  |
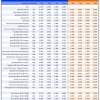
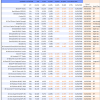
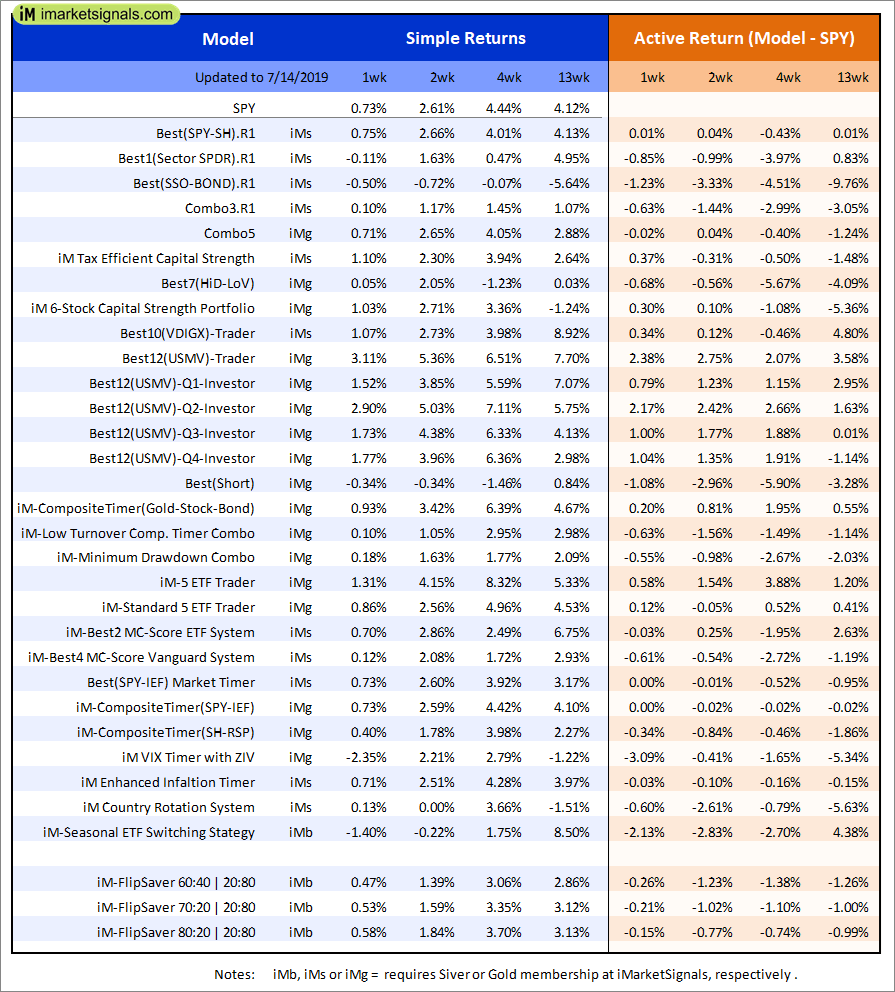
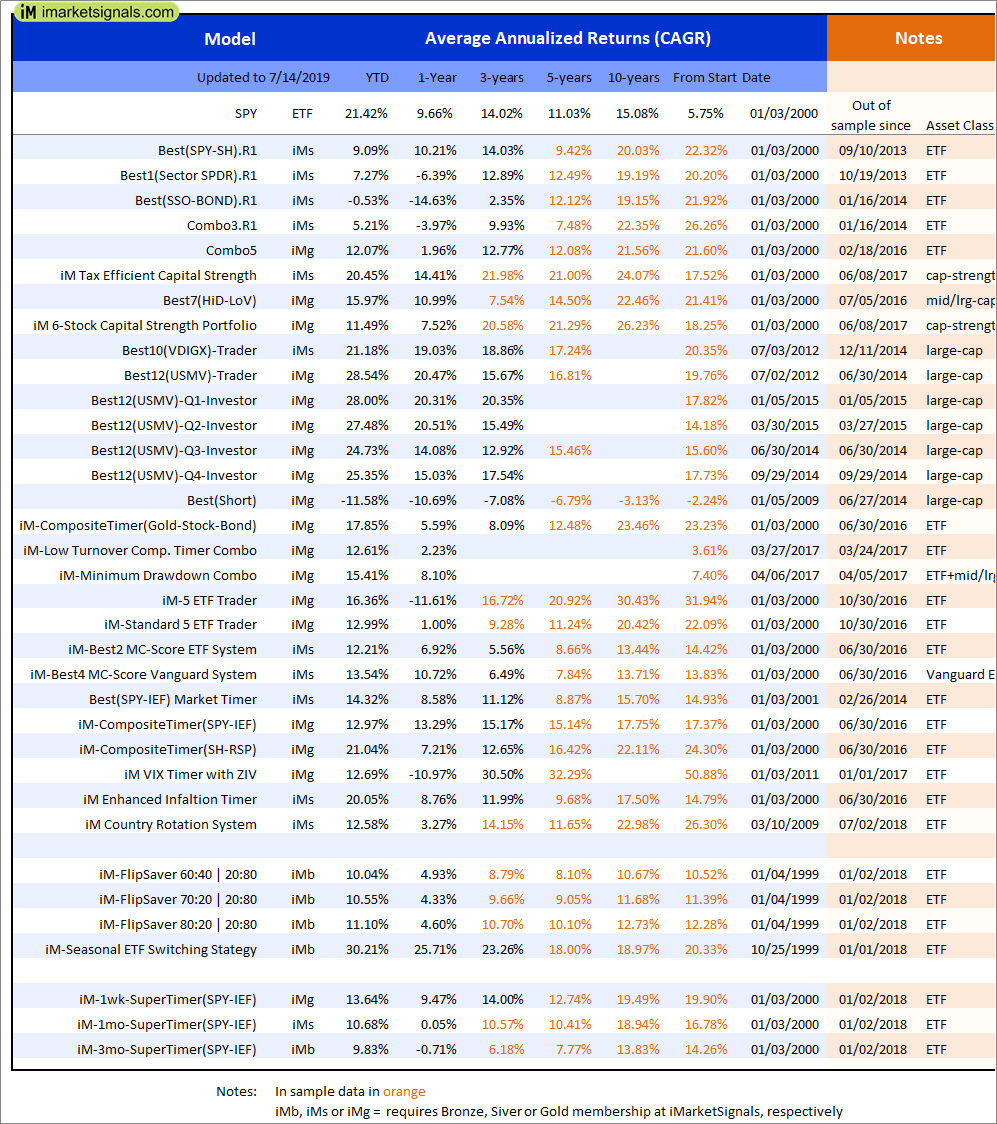
Out of sample performance summary of our models for the past 1, 2, 4 and 13 week periods. The active active return indicates how the models over- or underperformed the benchmark ETF SPY. Also the YTD, and the 1-, 3-, 5- and 10-year annualized returns are shown in the second table |
|
|
iM-FlipSaver 60:40 | 20:80 – 2017: The model’s out of sample performance YTD is 11.2%, and for the last 12 months is 5.4%. Over the same period the benchmark E60B40 performance was 15.1% and 9.0% respectively. Over the previous week the market value of iM-FlipSaver 80:20 | 20:80 gained 0.85% at a time when SPY gained 0.73%. A starting capital of $100,000 at inception on 7/16/2015 would have grown to $124,426 which includes $1,009 cash and excludes $788 spent on fees and slippage. |
|
|
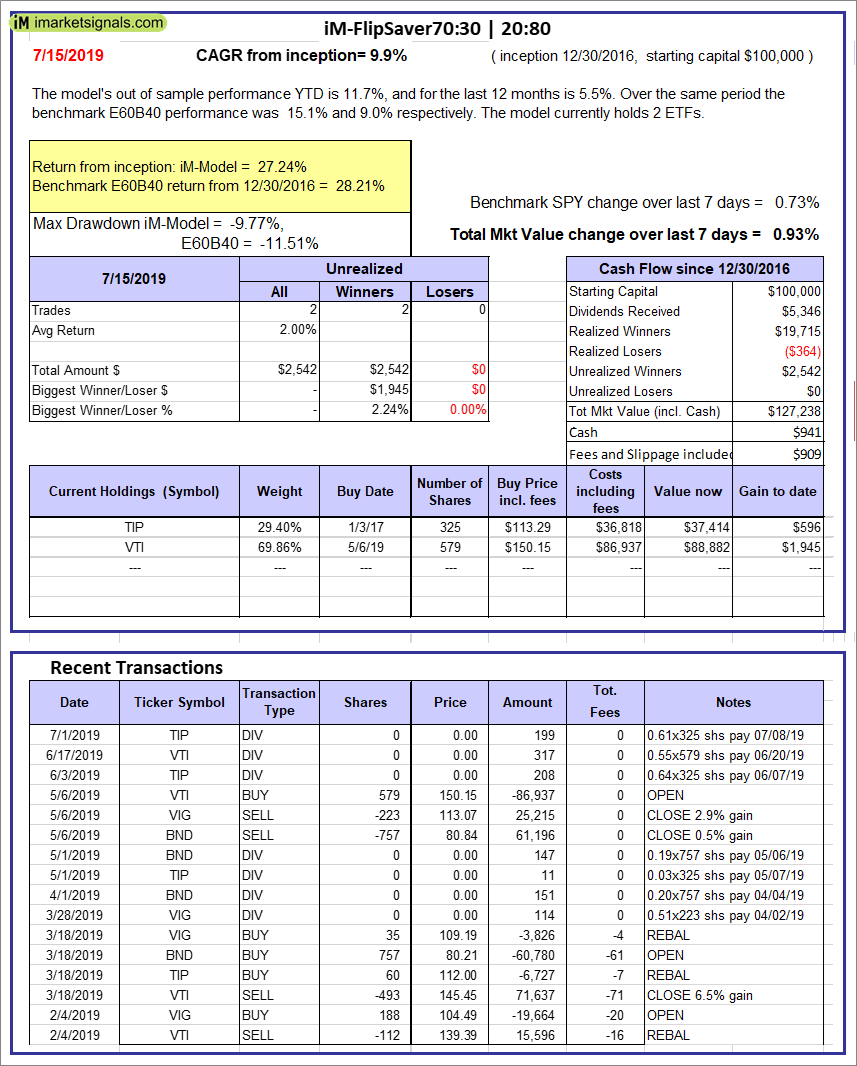
iM-FlipSaver 70:30 | 20:80 – 2017: The model’s out of sample performance YTD is 11.7%, and for the last 12 months is 5.5%. Over the same period the benchmark E60B40 performance was 15.1% and 9.0% respectively. Over the previous week the market value of iM-FlipSaver 70:30 | 20:80 gained 0.93% at a time when SPY gained 0.73%. A starting capital of $100,000 at inception on 7/15/2015 would have grown to $127,238 which includes $941 cash and excludes $909 spent on fees and slippage. |
|
|
iM-FlipSaver 80:20 | 20:80 – 2017: The model’s out of sample performance YTD is 12.1%, and for the last 12 months is 5.6%. Over the same period the benchmark E60B40 performance was 15.1% and 9.0% respectively. Over the previous week the market value of iM-FlipSaver 80:20 | 20:80 gained 1.01% at a time when SPY gained 0.73%. A starting capital of $100,000 at inception on 1/2/2017 would have grown to $130,026 which includes $965 cash and excludes $1,024 spent on fees and slippage. |
|
|
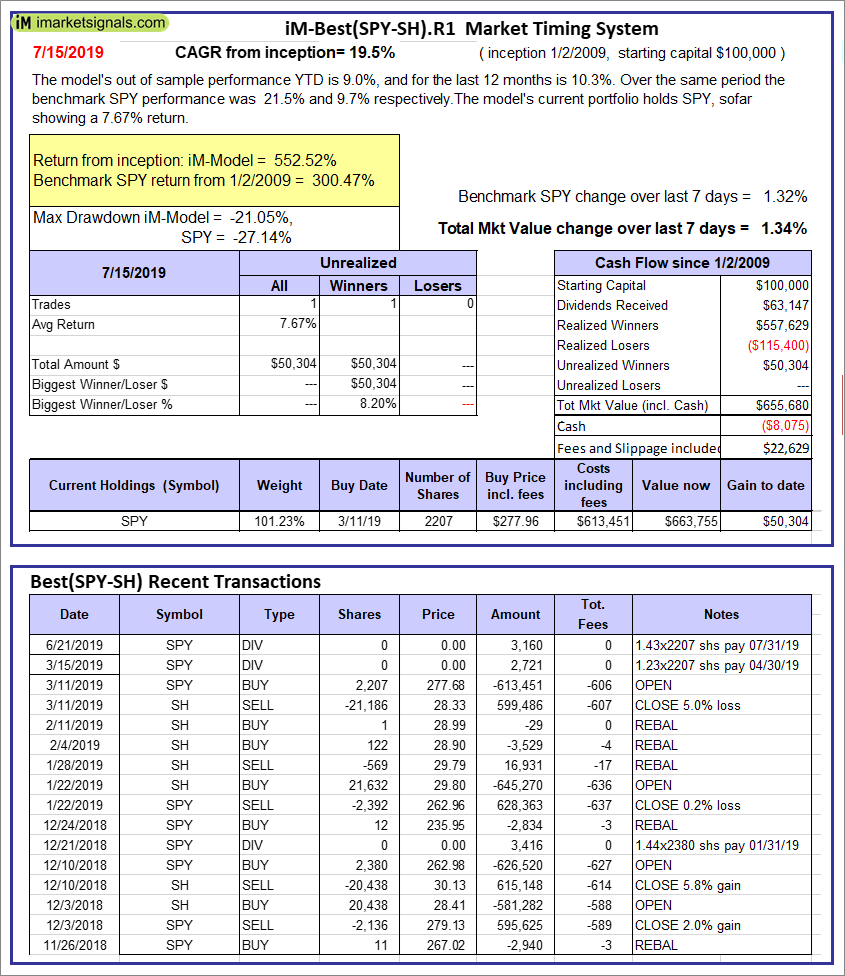
iM-Best(SPY-SH).R1: The model’s out of sample performance YTD is 9.0%, and for the last 12 months is 10.3%. Over the same period the benchmark SPY performance was 21.5% and 9.7% respectively. Over the previous week the market value of Best(SPY-SH) gained 1.34% at a time when SPY gained 1.32%. A starting capital of $100,000 at inception on 1/2/2009 would have grown to $655,680 which includes -$8,075 cash and excludes $22,629 spent on fees and slippage. |
|
|
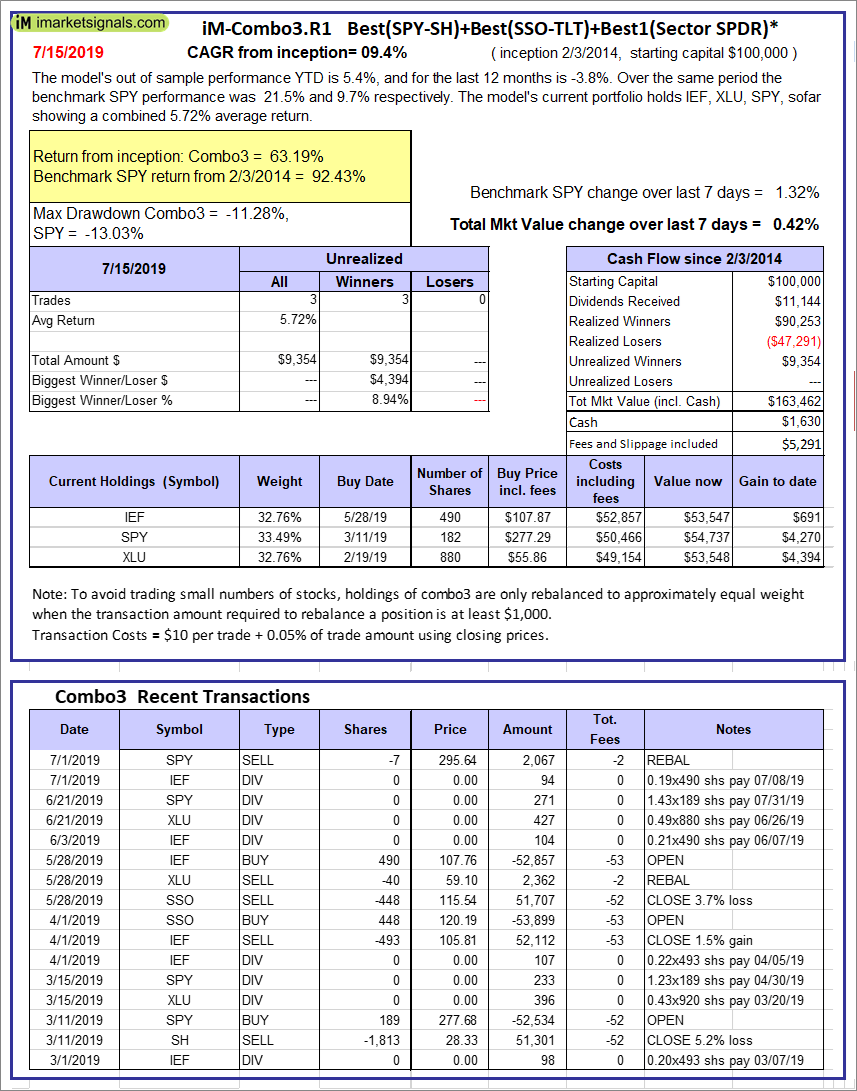
iM-Combo3.R1: The model’s out of sample performance YTD is 5.4%, and for the last 12 months is -3.8%. Over the same period the benchmark SPY performance was 21.5% and 9.7% respectively. Over the previous week the market value of iM-Combo3.R1 gained 0.42% at a time when SPY gained 1.32%. A starting capital of $100,000 at inception on 2/3/2014 would have grown to $163,462 which includes $1,630 cash and excludes $5,291 spent on fees and slippage. |
|
|
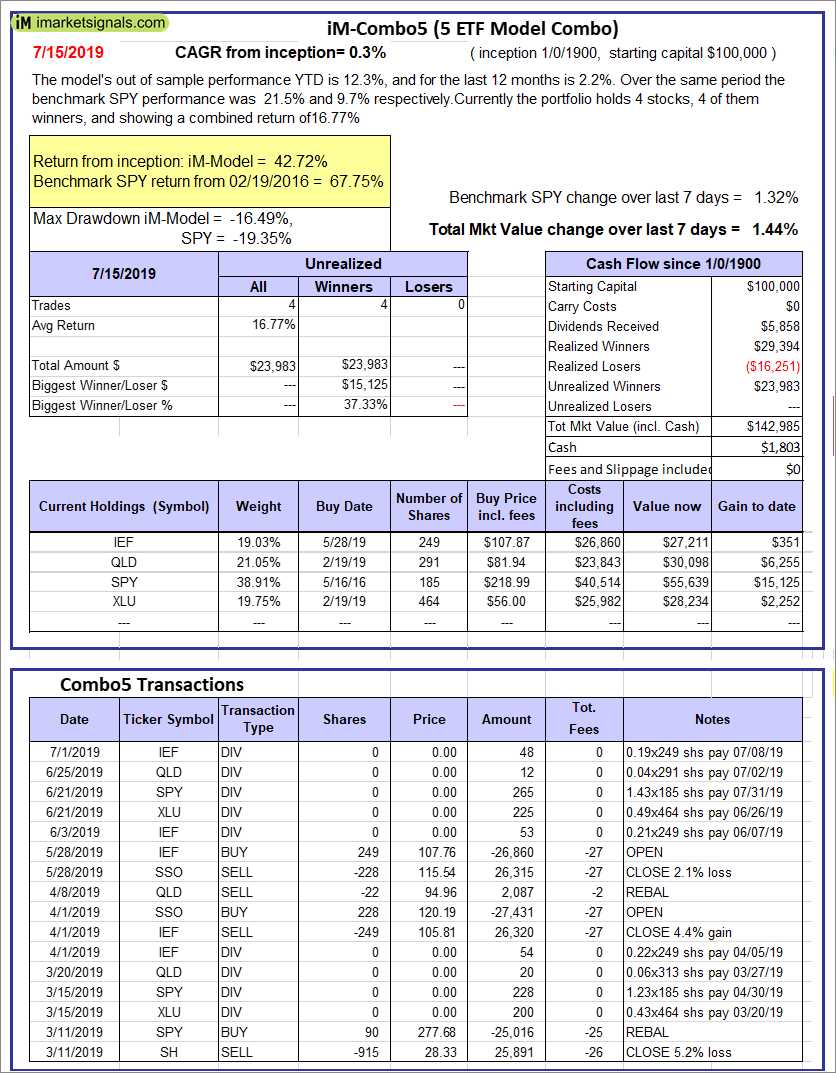
iM-Combo5: The model’s out of sample performance YTD is 12.3%, and for the last 12 months is 2.2%. Over the same period the benchmark SPY performance was 21.5% and 9.7% respectively. Over the previous week the market value of iM-Combo5 gained 1.44% at a time when SPY gained 1.32%. A starting capital of $100,000 at inception on 2/22/2016 would have grown to $142,985 which includes $1,803 cash and excludes $0 spent on fees and slippage. |
|
|
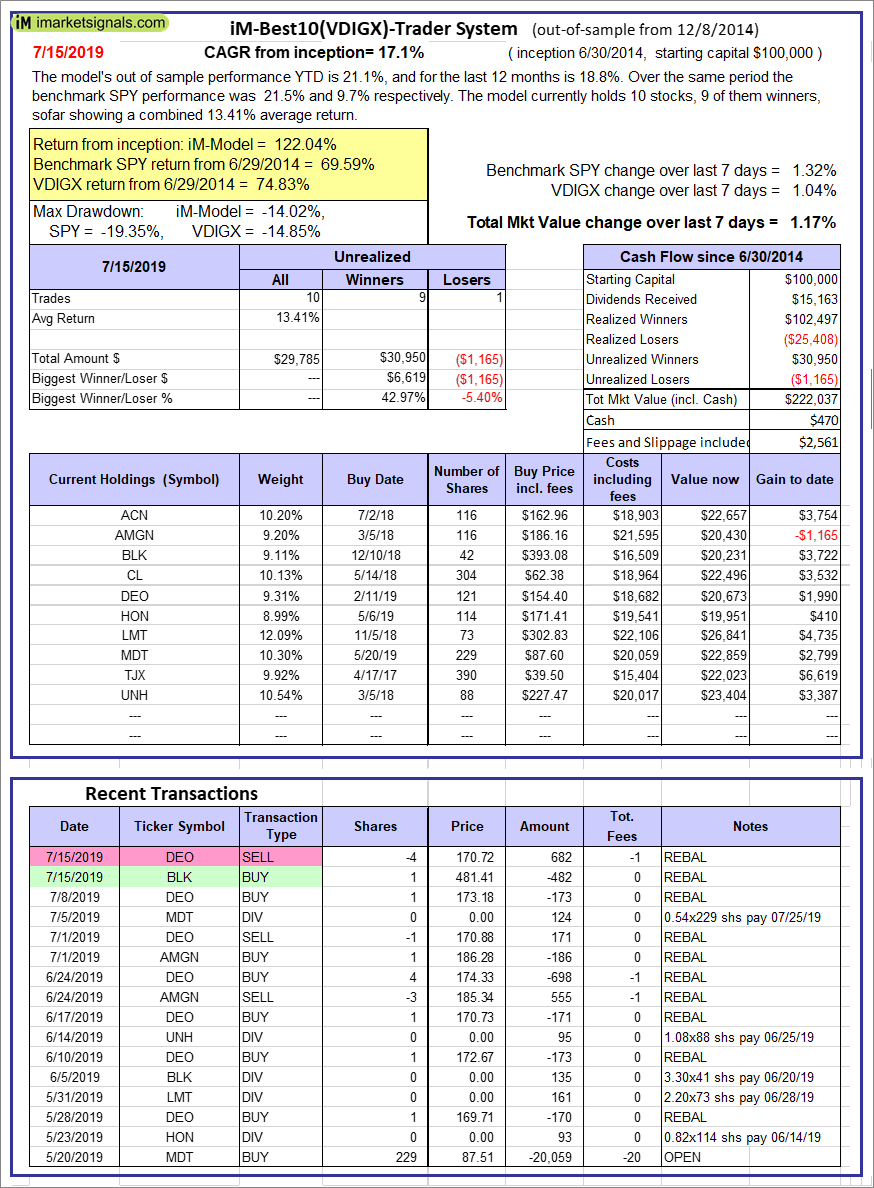
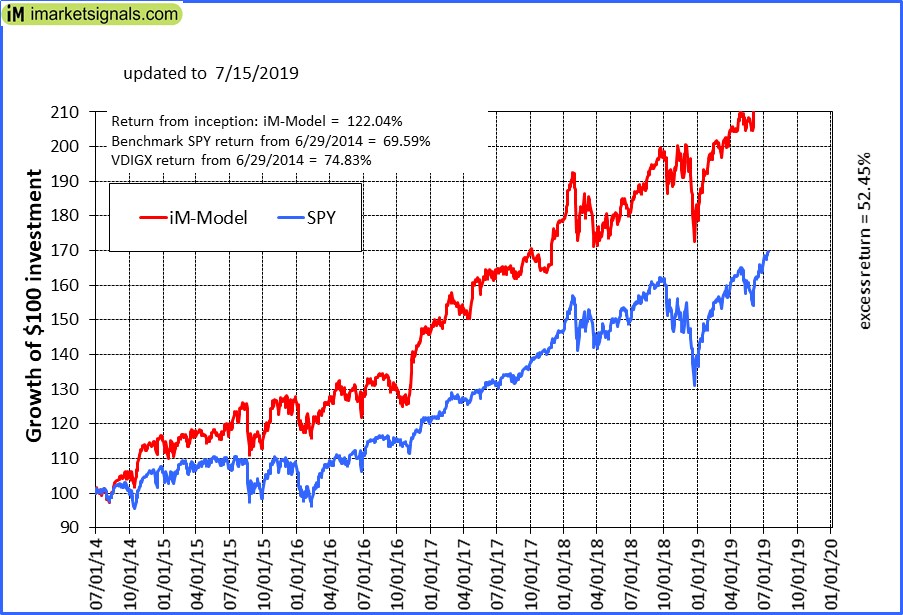
iM-Best10(VDIGX)-Trader: The model’s out of sample performance YTD is 21.1%, and for the last 12 months is 18.8%. Over the same period the benchmark SPY performance was 21.5% and 9.7% respectively. Since inception, on 7/1/2014, the model gained 122.04% while the benchmark SPY gained 69.59% and VDIGX gained 74.83% over the same period. Over the previous week the market value of iM-Best10(VDIGX) gained 1.17% at a time when SPY gained 1.32%. A starting capital of $100,000 at inception on 7/1/2014 would have grown to $222,037 which includes $470 cash and excludes $2,561 spent on fees and slippage. |
|
|
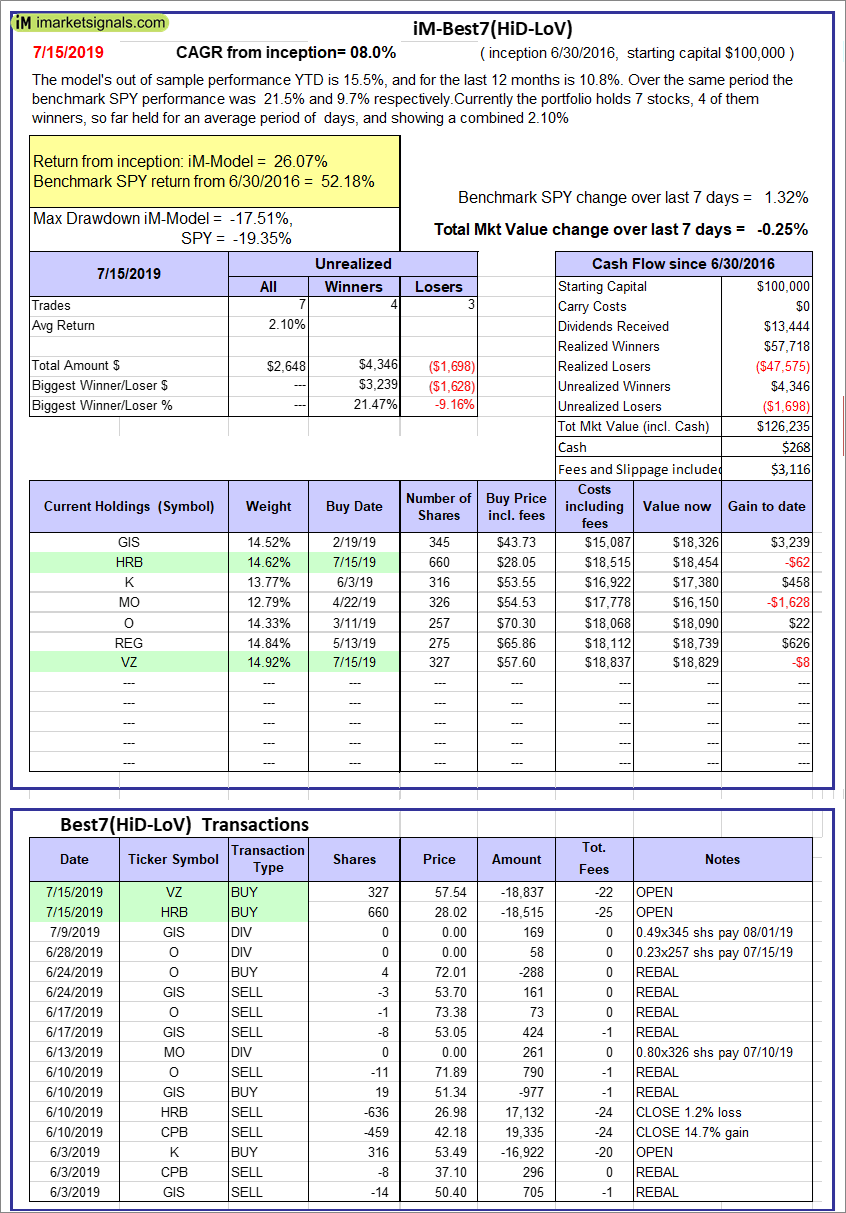
iM-Best7(HiD-LoV): The model’s out of sample performance YTD is 15.5%, and for the last 12 months is 10.8%. Over the same period the benchmark SPY performance was 21.5% and 9.7% respectively. Over the previous week the market value of iM-Best7(HiD-LoV) gained -0.25% at a time when SPY gained 1.32%. A starting capital of $100,000 at inception on 6/30/2016 would have grown to $126,235 which includes $268 cash and excludes $3,116 spent on fees and slippage. |
|
|
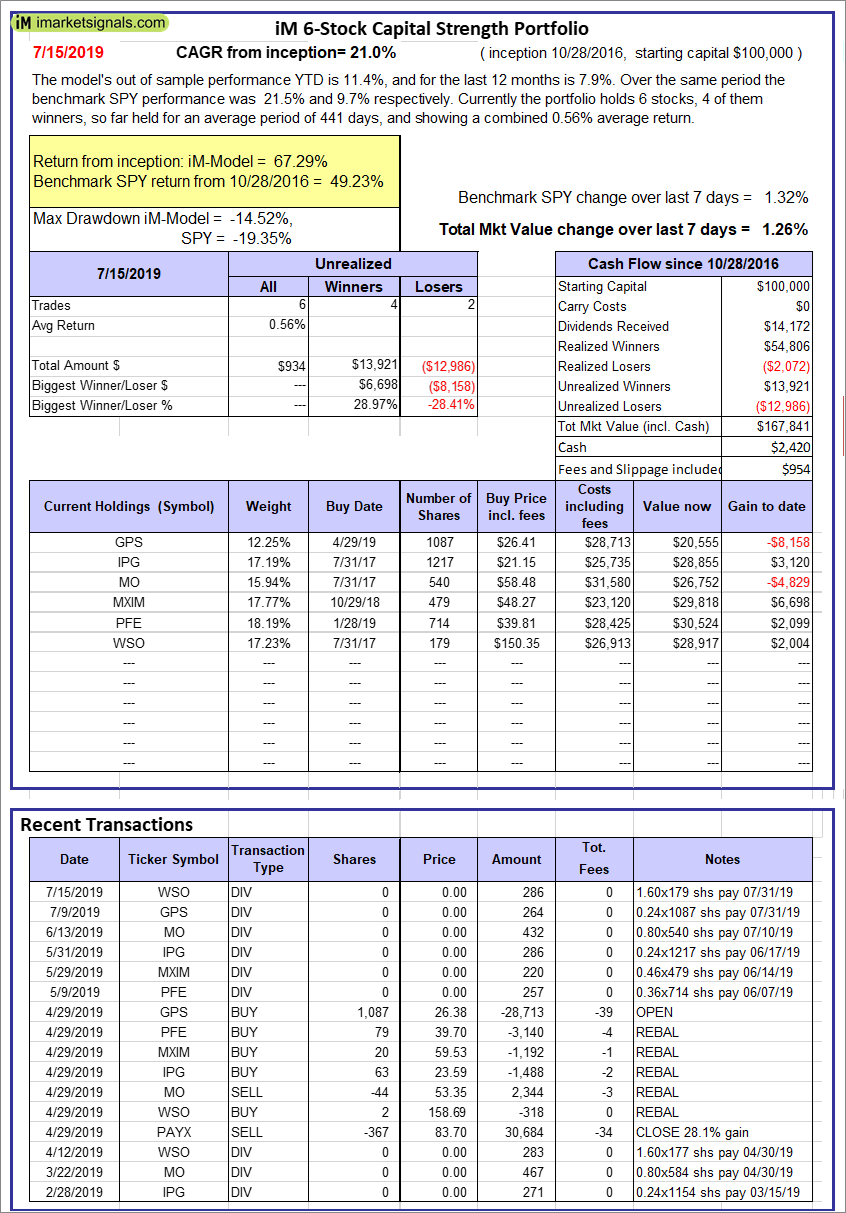
iM 6-Stock Capital Strength Portfolio: The model’s out of sample performance YTD is 11.4%, and for the last 12 months is 7.9%. Over the same period the benchmark SPY performance was 21.5% and 9.7% respectively. Over the previous week the market value of the iM 6-Stock Capital Strength Portfolio gained 1.26% at a time when SPY gained 1.32%. A starting capital of $100,000 at inception on 10/28/2016 would have grown to $167,841 which includes $2,420 cash and excludes $954 spent on fees and slippage. |
|
|
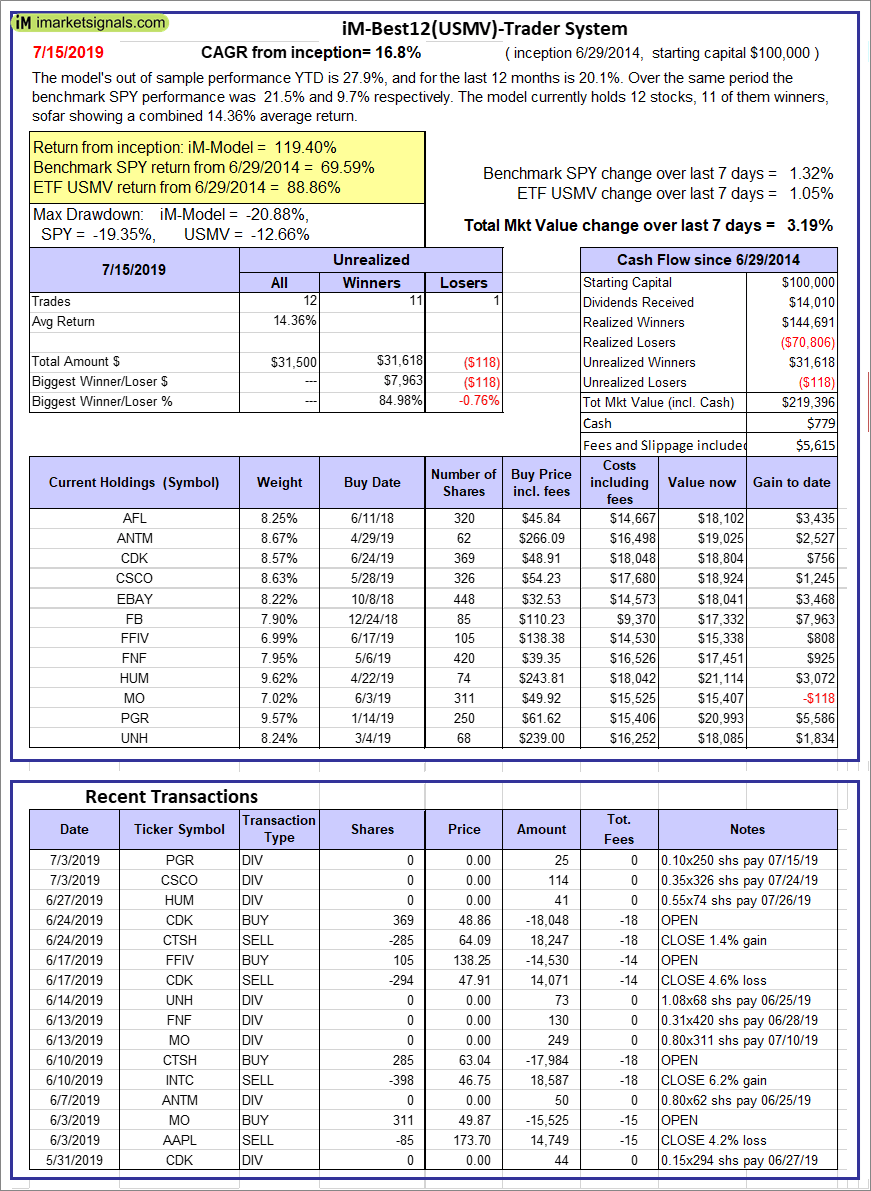
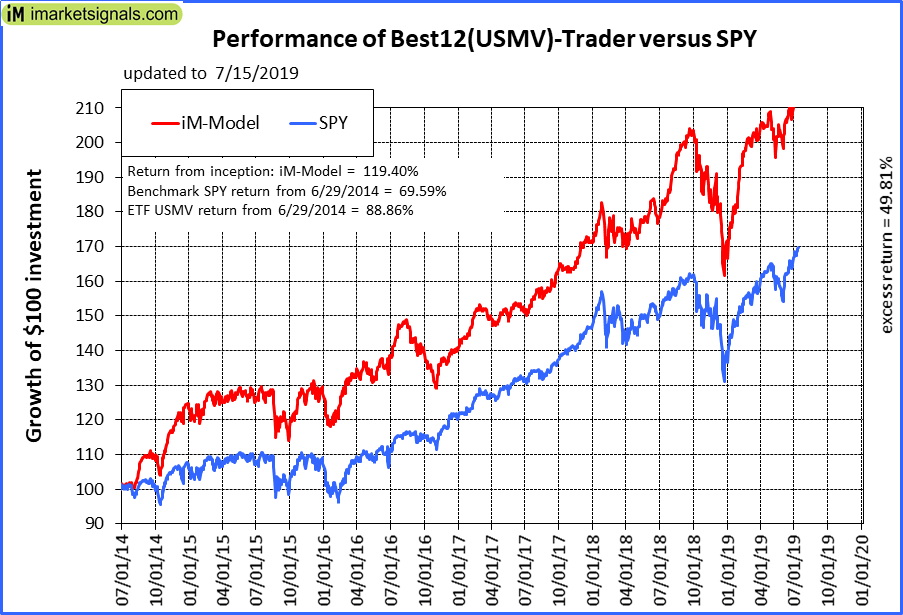
iM-Best12(USMV)-Trader: The model’s out of sample performance YTD is 27.9%, and for the last 12 months is 20.1%. Over the same period the benchmark SPY performance was 21.5% and 9.7% respectively. Since inception, on 6/30/2014, the model gained 119.40% while the benchmark SPY gained 69.59% and the ETF USMV gained 88.86% over the same period. Over the previous week the market value of iM-Best12(USMV)-Trader gained 3.19% at a time when SPY gained 1.32%. A starting capital of $100,000 at inception on 6/30/2014 would have grown to $219,396 which includes $779 cash and excludes $5,615 spent on fees and slippage. |
|
|
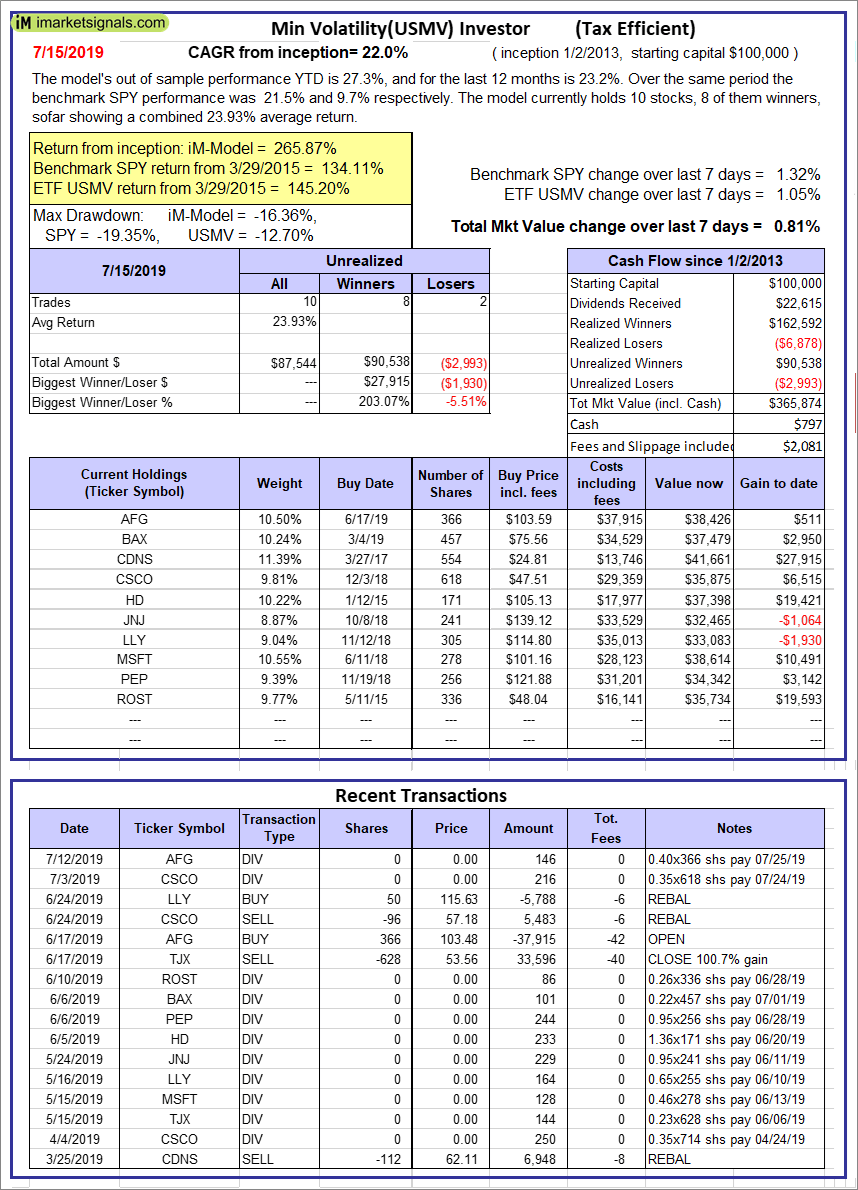
iM Min Volatility (USMV) Investor: The model’s out of sample performance YTD is 26.2%, and for the last 12 months is 24.1%. Over the same period the benchmark SPY performance was 19.9% and 9.9% respectively. Since inception, on 1/3/2013, the model gained 262.93% while the benchmark SPY gained 131.05% and the ETF USMV gained 142.65% over the same period. Over the previous week the market value of iM Min Volatility (USMV) Investor gained 1.22% at a time when SPY gained 0.39%. A starting capital of $100,000 at inception on 1/3/2013 would have grown to $362,932 which includes $651 cash and excludes $2,081 spent on fees and slippage. |
|
|
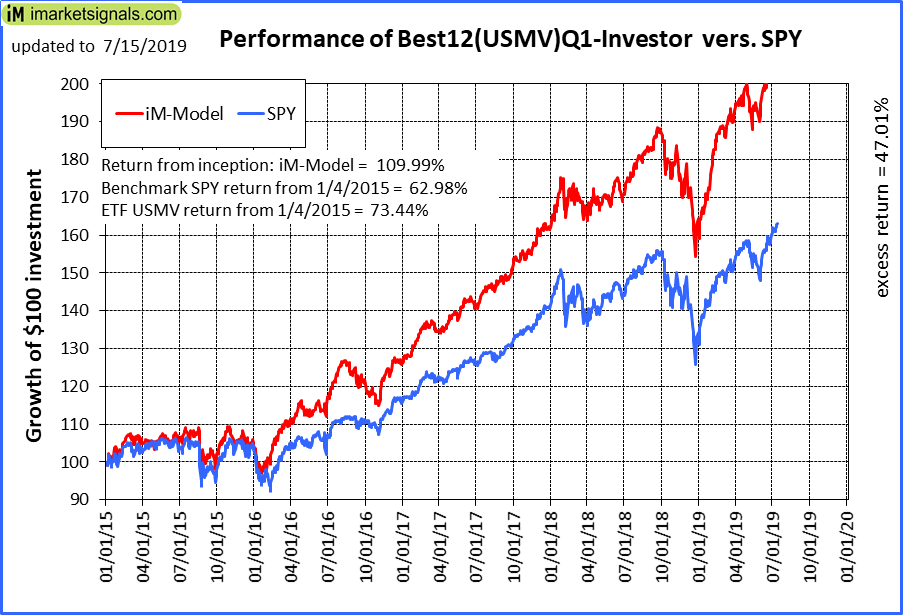
iM-Best12(USMV)Q1-Investor: To be discontinued. The model’s out of sample performance YTD is 27.7%, and for the last 12 months is 20.3%. Over the same period the benchmark SPY performance was 21.5% and 9.7% respectively. Since inception, on 1/5/2015, the model gained 109.99% while the benchmark SPY gained 62.98% and the ETF USMV gained 73.44% over the same period. Over the previous week the market value of iM-Best12(USMV)Q1 gained 1.79% at a time when SPY gained 1.32%. A starting capital of $100,000 at inception on 1/5/2015 would have grown to $209,988 which includes $696 cash and excludes $1,522 spent on fees and slippage. |
|
|
iM-Best12(USMV)Q2-Investor: Reporting will be discontinued To be discontinued. The model’s out of sample performance YTD is 26.9%, and for the last 12 months is 20.2%. Over the same period the benchmark SPY performance was 21.5% and 9.7% respectively. Since inception, on 3/30/2015, the model gained 76.35% while the benchmark SPY gained 57.15% and the ETF USMV gained 67.52% over the same period. Over the previous week the market value of iM-Best12(USMV)Q2 gained 2.72% at a time when SPY gained 1.32%. A starting capital of $100,000 at inception on 3/30/2015 would have grown to $176,352 which includes $492 cash and excludes $1,431 spent on fees and slippage. |
|
|
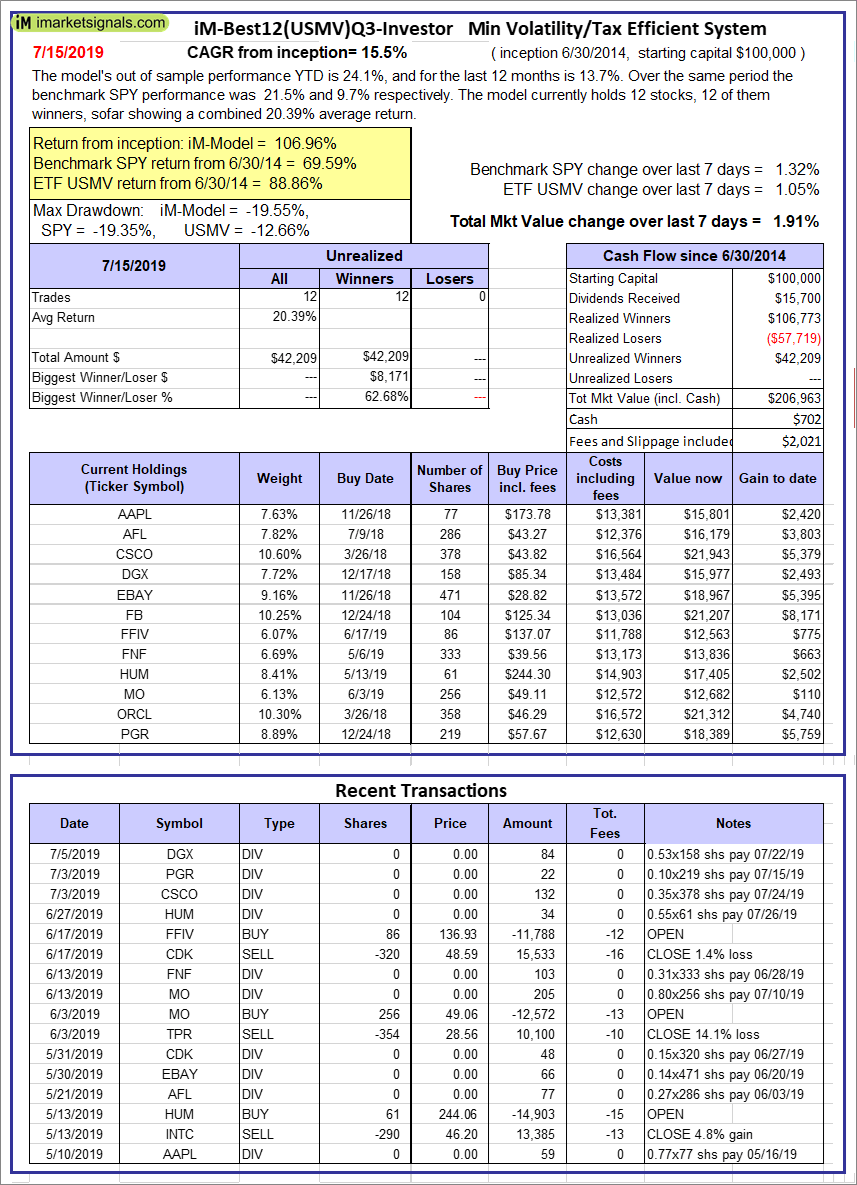
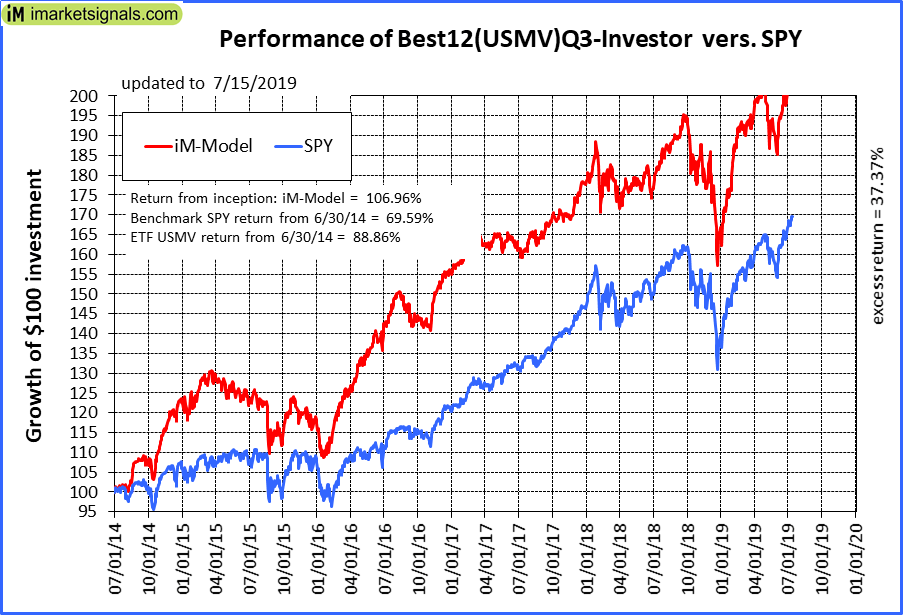
iM-Best12(USMV)Q3-Investor: Reporting will be discontinued To be discontinued. The model’s out of sample performance YTD is 24.1%, and for the last 12 months is 13.7%. Over the same period the benchmark SPY performance was 21.5% and 9.7% respectively. Since inception, on 7/1/2014, the model gained 106.96% while the benchmark SPY gained 69.59% and the ETF USMV gained 88.86% over the same period. Over the previous week the market value of iM-Best12(USMV)Q3 gained 1.91% at a time when SPY gained 1.32%. A starting capital of $100,000 at inception on 7/1/2014 would have grown to $206,963 which includes $702 cash and excludes $2,021 spent on fees and slippage. |
|
|
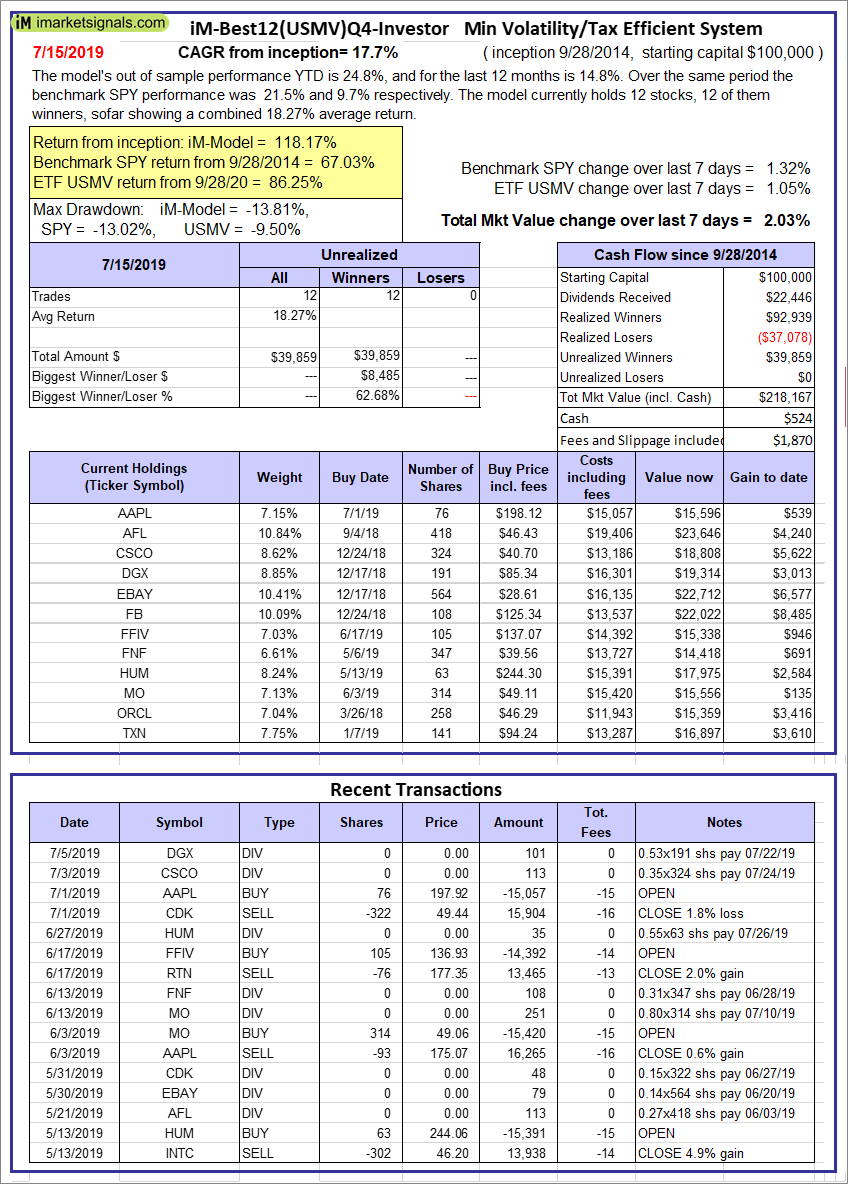
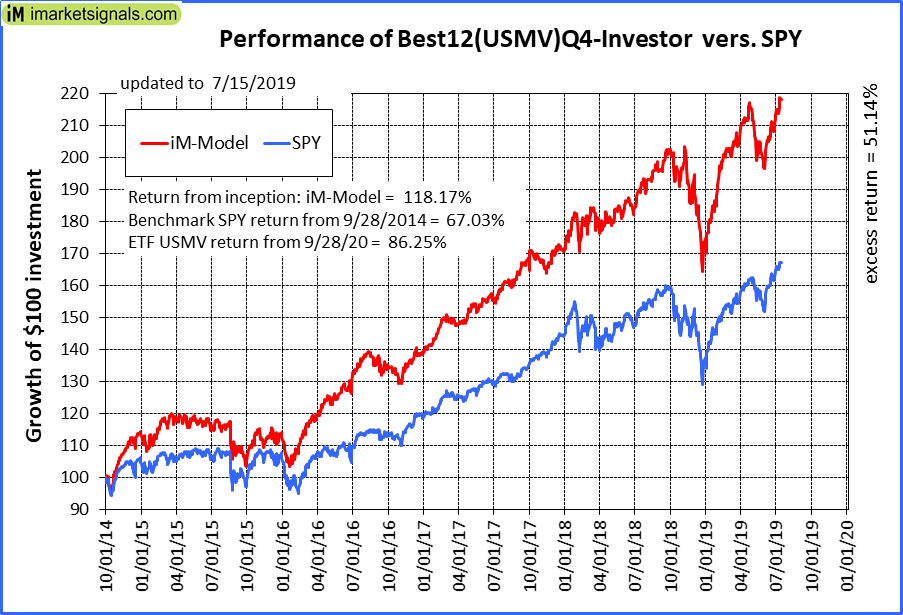
iM-Best12(USMV)Q4-Investor: Reporting will be discontinued To be discontinued. Since inception, on 9/29/2014, the model gained 118.17% while the benchmark SPY gained 67.03% and the ETF USMV gained 86.25% over the same period. Over the previous week the market value of iM-Best12(USMV)Q4 gained 2.03% at a time when SPY gained 1.32%. A starting capital of $100,000 at inception on 9/29/2014 would have grown to $218,167 which includes $524 cash and excludes $1,870 spent on fees and slippage. |
|
|
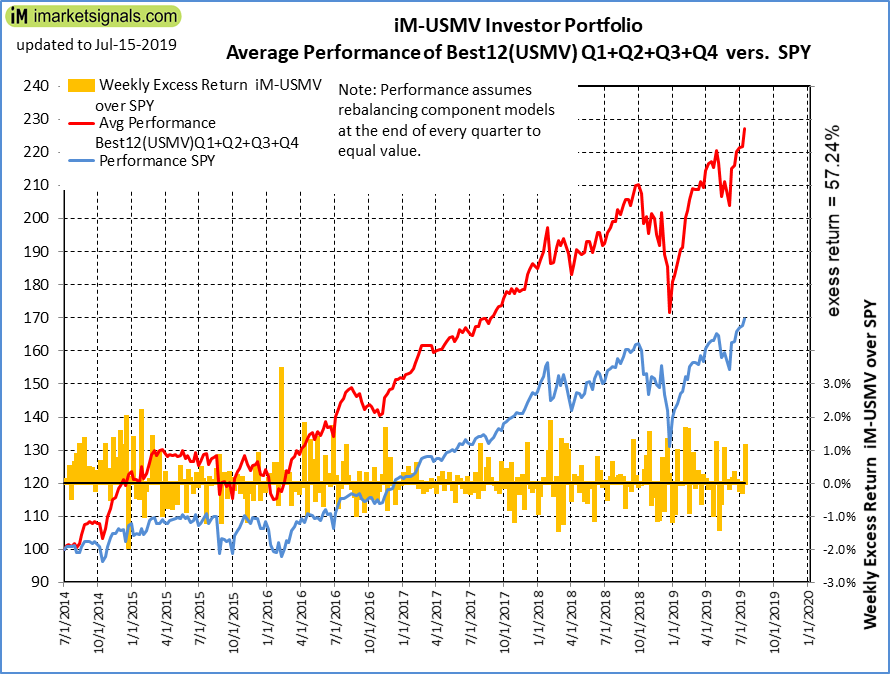
Average Performance of iM-Best12(USMV)Q1+Q2+Q3+Q4-Investor resulted in an excess return of 54.04% over SPY. (see iM-USMV Investor Portfolio) |
|
|
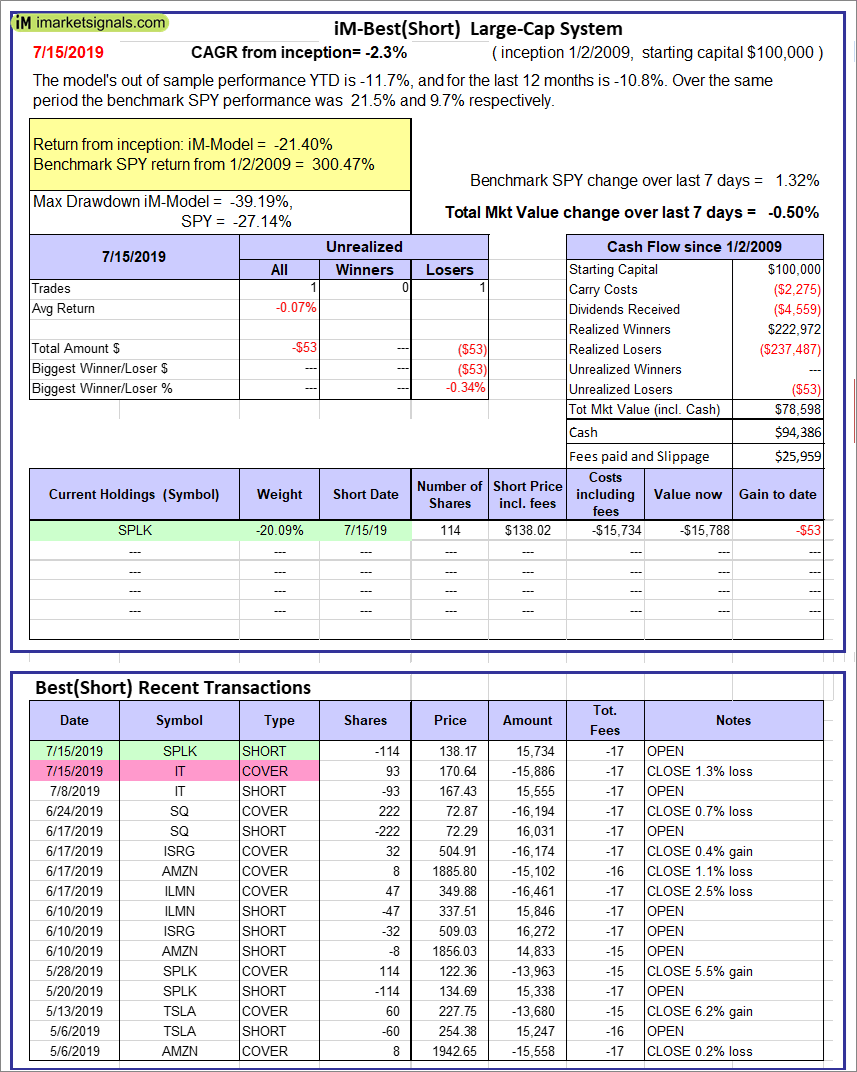
iM-Best(Short): The model’s out of sample performance YTD is -11.7%, and for the last 12 months is -10.8%. Over the same period the benchmark SPY performance was 21.5% and 9.7% respectively. Over the previous week the market value of iM-Best(Short) gained -0.50% at a time when SPY gained 1.32%. Over the period 1/2/2009 to 7/15/2019 the starting capital of $100,000 would have grown to $78,598 which includes $94,386 cash and excludes $25,959 spent on fees and slippage. |
|
|
iM-Best2 MC-Score ETF System: The model’s out of sample performance YTD is 12.4%, and for the last 12 months is 7.1%. Over the same period the benchmark SPY performance was 21.5% and 9.7% respectively. Over the previous week the market value of the iM-Best2 MC-Score ETF System gained 0.93% at a time when SPY gained 1.32%. A starting capital of $100,000 at inception on 6/30/2016 would have grown to $119,269 which includes $780 cash and excludes $670 spent on fees and slippage. |
|
|
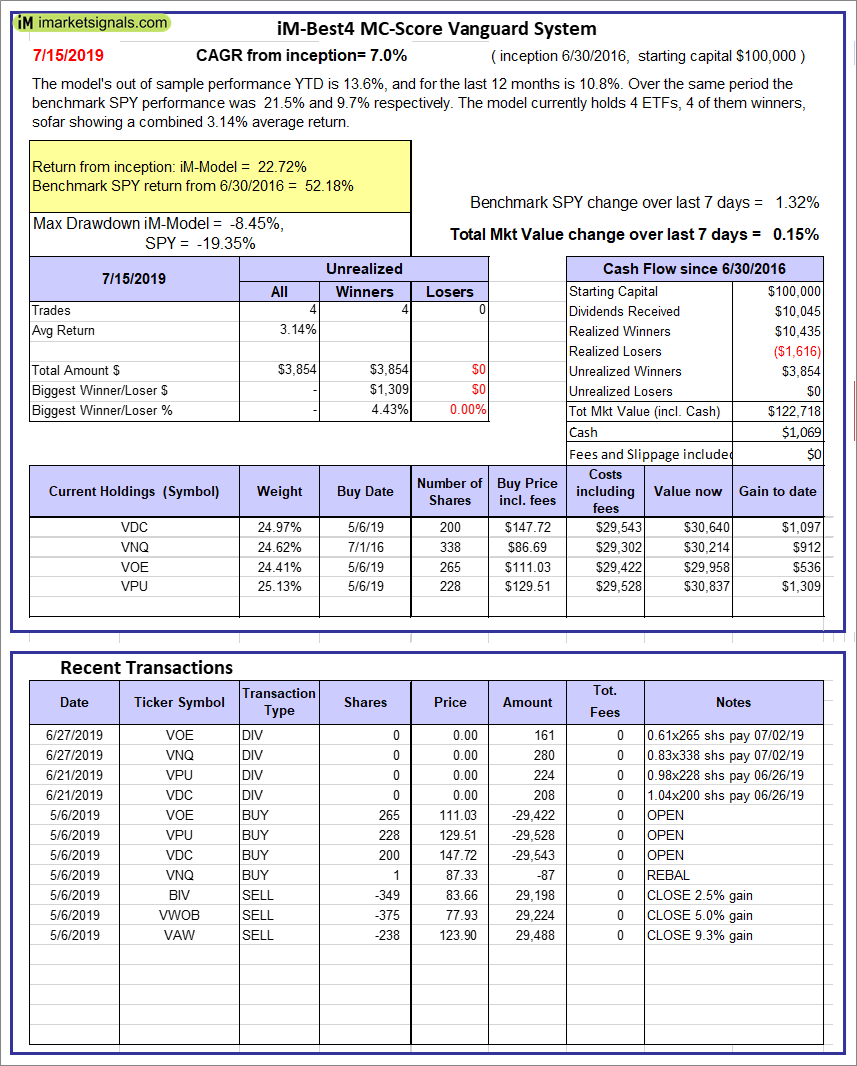
iM-Best4 MC-Score Vanguard System: The model’s out of sample performance YTD is 13.6%, and for the last 12 months is 10.8%. Over the same period the benchmark SPY performance was 21.5% and 9.7% respectively. Over the previous week the market value of the iM-Best4 MC-Score Vanguard System gained 0.15% at a time when SPY gained 1.32%. A starting capital of $100,000 at inception on 6/30/2016 would have grown to $122,718 which includes $1,069 cash and excludes $00 spent on fees and slippage. |
|
|
iM-Composite (SH-RSP) Timer: The model’s out of sample performance YTD is 20.2%, and for the last 12 months is 6.9%. Over the same period the benchmark SPY performance was 21.5% and 9.7% respectively. Over the previous week the market value of the iM-Composite (SH-RSP) Timer gained 0.84% at a time when SPY gained 1.32%. A starting capital of $100,000 at inception on 6/30/2016 would have grown to $144,444 which includes $5,737 cash and excludes $513 spent on fees and slippage. |
|
|
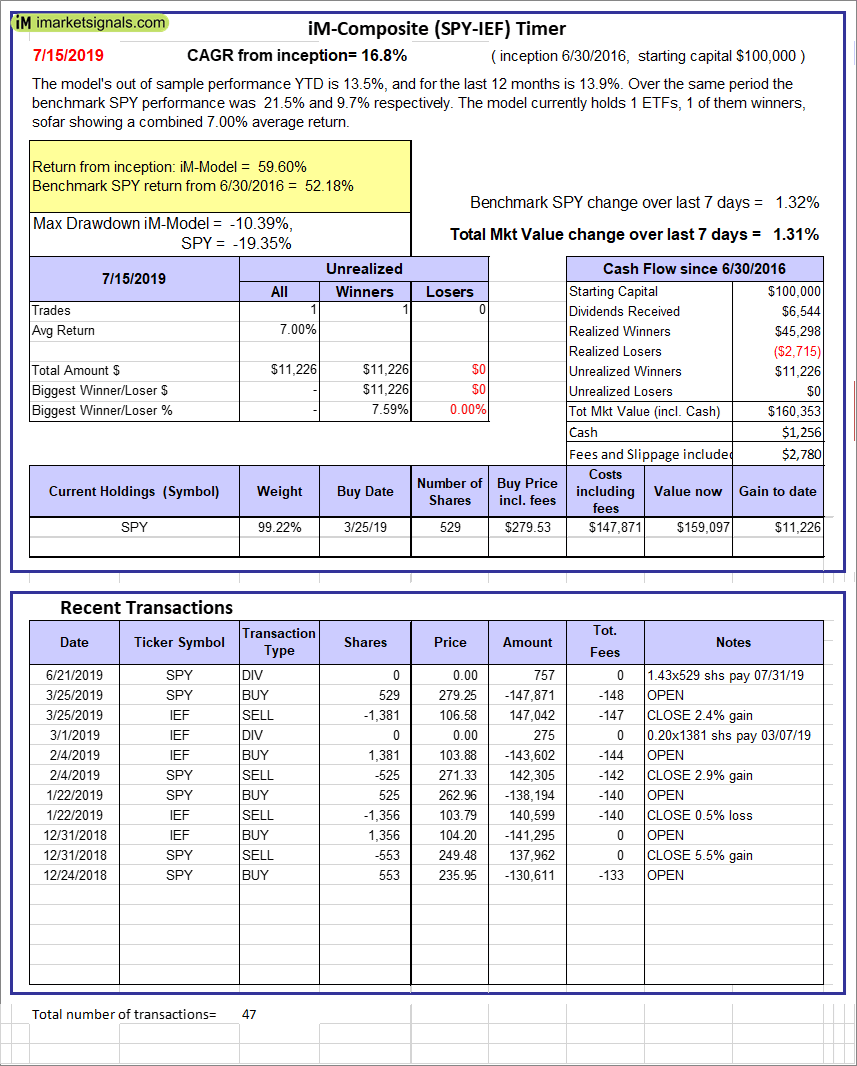
iM-Composite (SPY-IEF) Timer: The model’s out of sample performance YTD is 13.5%, and for the last 12 months is 13.9%. Over the same period the benchmark SPY performance was 21.5% and 9.7% respectively. Over the previous week the market value of the iM-Composite (SPY-IEF) Timer gained 1.31% at a time when SPY gained 1.32%. A starting capital of $100,000 at inception on 6/30/2016 would have grown to $160,353 which includes $1,256 cash and excludes $2,780 spent on fees and slippage. |
|
|
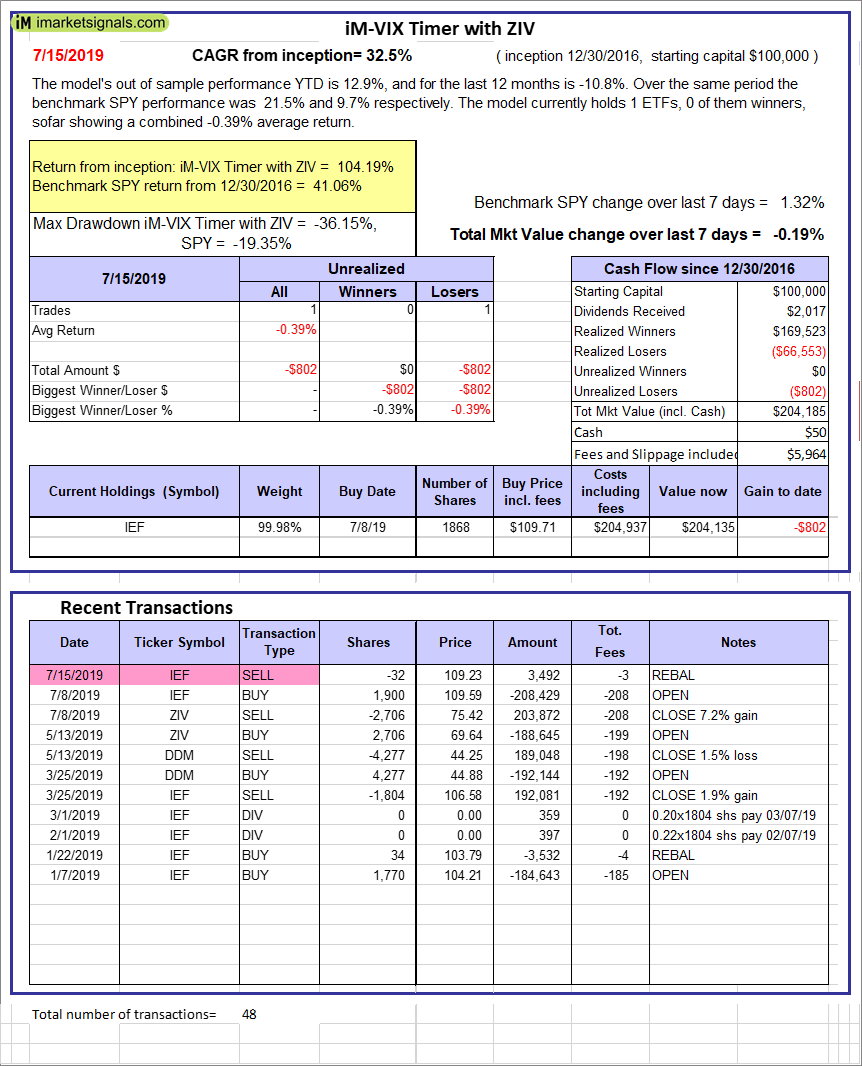
iM-VIX Timer with ZIV: The model’s out of sample performance YTD is 12.9%, and for the last 12 months is -10.8%. Over the same period the benchmark SPY performance was 21.5% and 9.7% respectively. Over the previous week the market value of the iM-VIX Timer with ZIV gained -0.19% at a time when SPY gained 1.32%. A starting capital of $100,000 at inception on 6/30/2016 would have grown to $204,185 which includes $50 cash and excludes $5,964 spent on fees and slippage. |
|
|
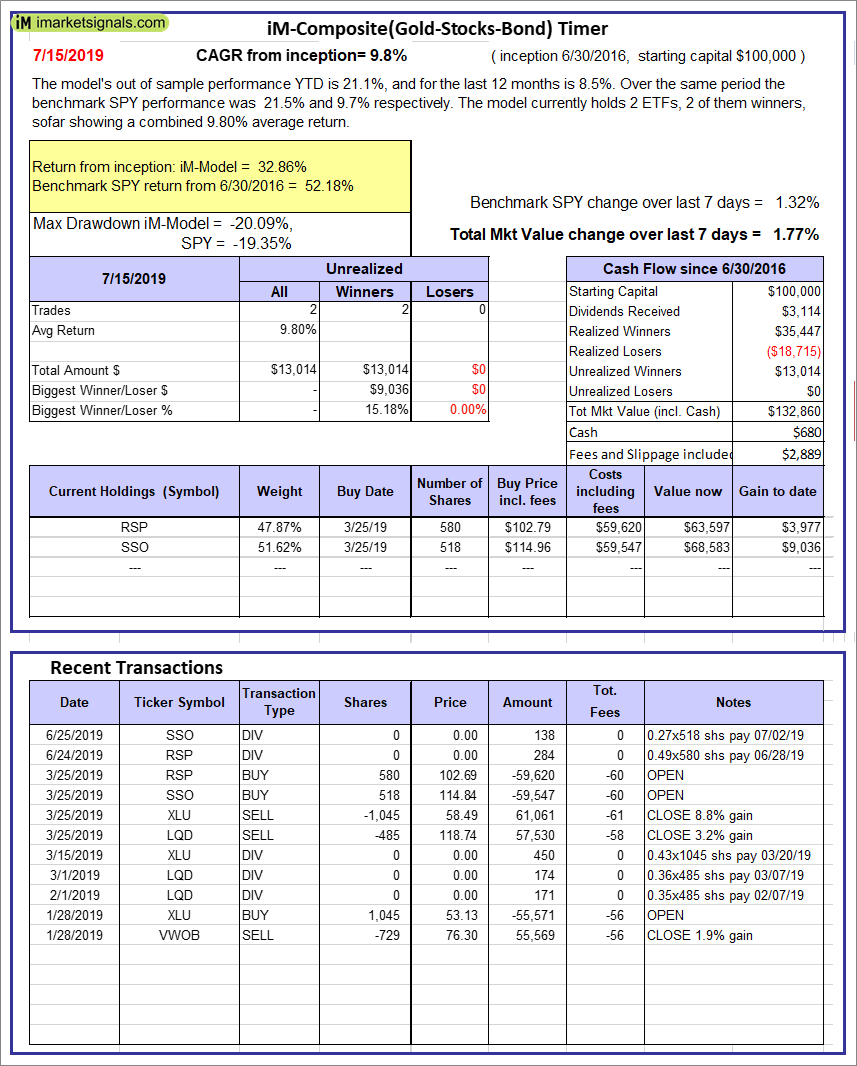
iM-Composite(Gold-Stocks-Bond) Timer: The model’s out of sample performance YTD is 21.1%, and for the last 12 months is 8.5%. Over the same period the benchmark SPY performance was 21.5% and 9.7% respectively. Over the previous week the market value of the iM-Composite(Gold-Stocks-Bond) Timer gained 1.77% at a time when SPY gained 1.32%. A starting capital of $100,000 at inception on 6/30/2016 would have grown to $132,860 which includes $680 cash and excludes $2,889 spent on fees and slippage. |
|
|
iM-Low Turnover Composite Timer Combo: The model’s out of sample performance YTD is 12.5%, and for the last 12 months is 2.1%. Over the same period the benchmark SPY performance was 21.5% and 9.7% respectively. Over the previous week the market value of the iM-Low Turnover Composite Timer Combo gained 0.37% at a time when SPY gained 1.32%. A starting capital of $100,000 at inception on 3/24/27 would have grown to $108,411 which includes $517 cash and excludes $887 spent on fees and slippage. |
|
|
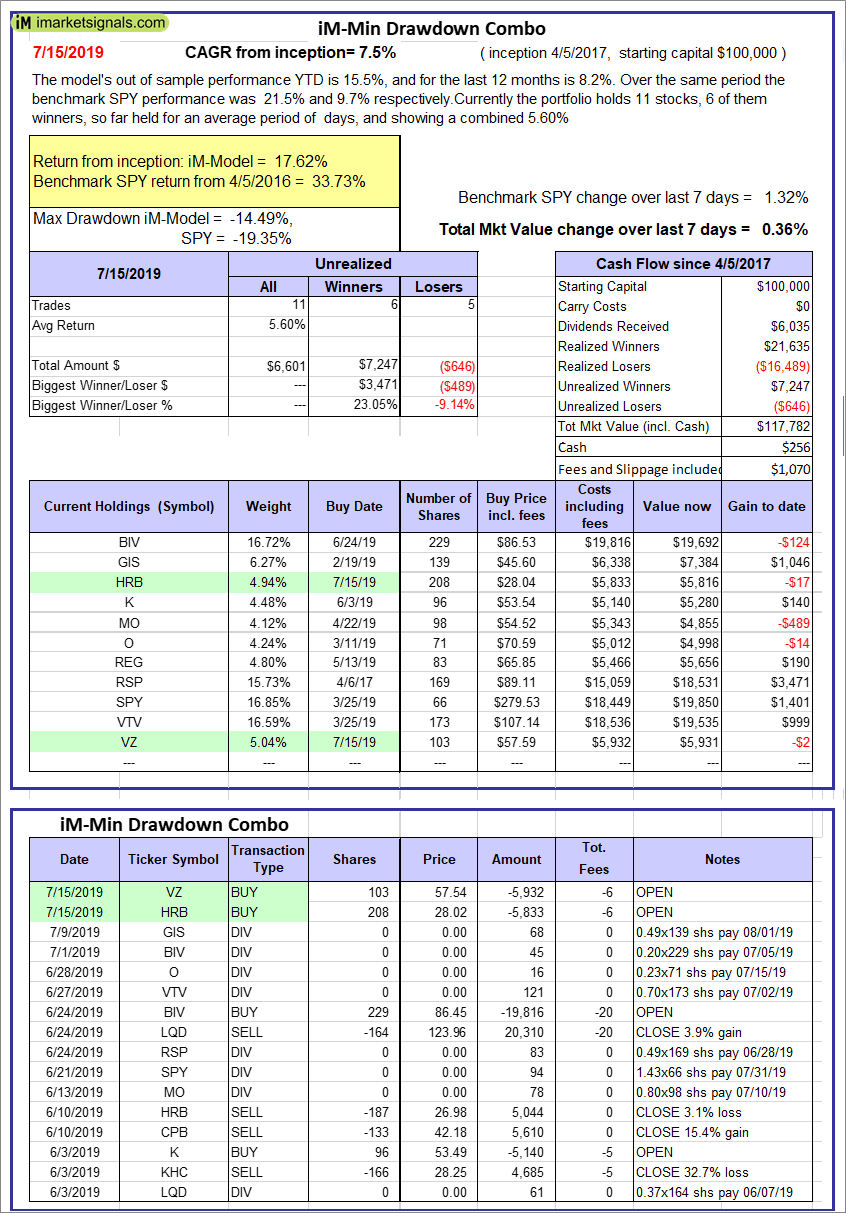
iM-Min Drawdown Combo: The model’s out of sample performance YTD is 15.5%, and for the last 12 months is 8.2%. Over the same period the benchmark SPY performance was 21.5% and 9.7% respectively. Over the previous week the market value of the iM-Min Drawdown Combo gained 0.36% at a time when SPY gained 1.32%. A starting capital of $100,000 at inception on 4/5/2017 would have grown to $117,782 which includes $256 cash and excludes $1,070 spent on fees and slippage. |
|
|
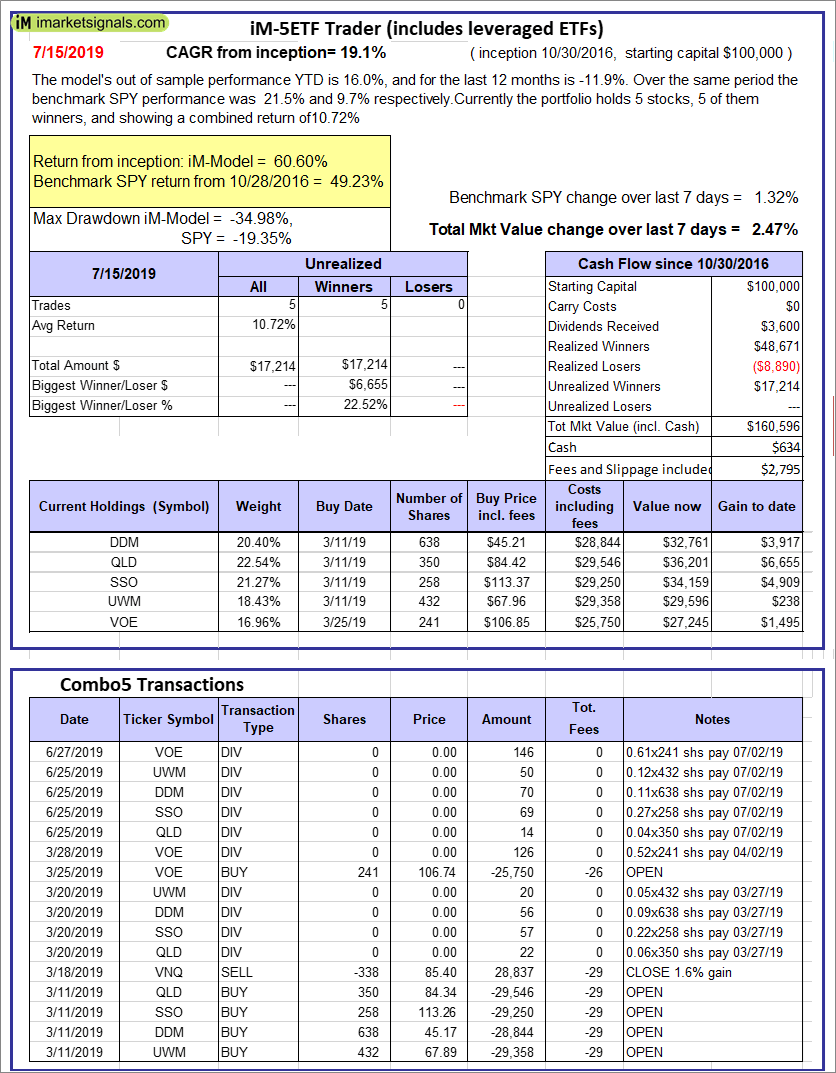
iM-5ETF Trader (includes leveraged ETFs): The model’s out of sample performance YTD is 16.0%, and for the last 12 months is -11.9%. Over the same period the benchmark SPY performance was 21.5% and 9.7% respectively. Over the previous week the market value of the iM-5ETF Trader (includes leveraged ETFs) gained 2.47% at a time when SPY gained 1.32%. A starting capital of $100,000 at inception on 10/30/2016 would have grown to $160,596 which includes $634 cash and excludes $2,795 spent on fees and slippage. |
|
|
iM-Standard 5ETF Trader (excludes leveraged ETFs): The model’s out of sample performance YTD is 13.0%, and for the last 12 months is 1.0%. Over the same period the benchmark SPY performance was 21.5% and 9.7% respectively. Over the previous week the market value of the iM-Standard 5ETF Trader (excludes leveraged ETFs) gained 1.45% at a time when SPY gained 1.32%. A starting capital of $100,000 at inception on 10/30/2016 would have grown to $132,531 which includes $205 cash and excludes $2,670 spent on fees and slippage. |


Leave a Reply
You must be logged in to post a comment.