  |
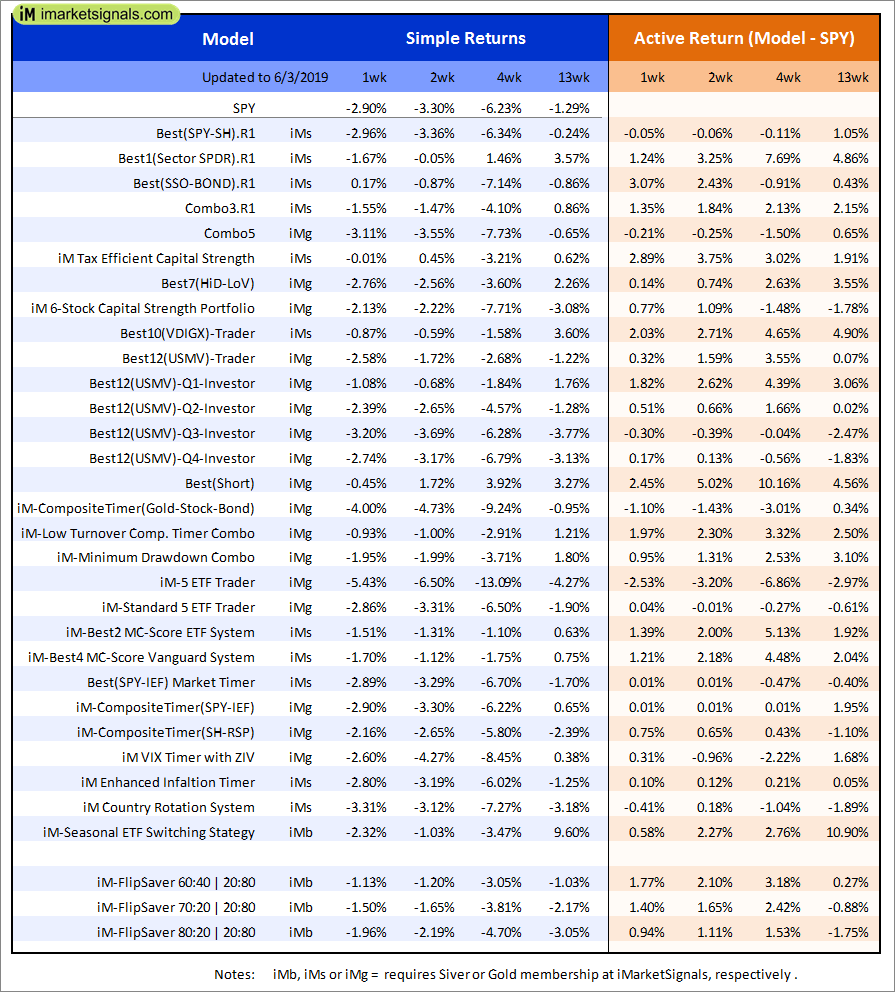
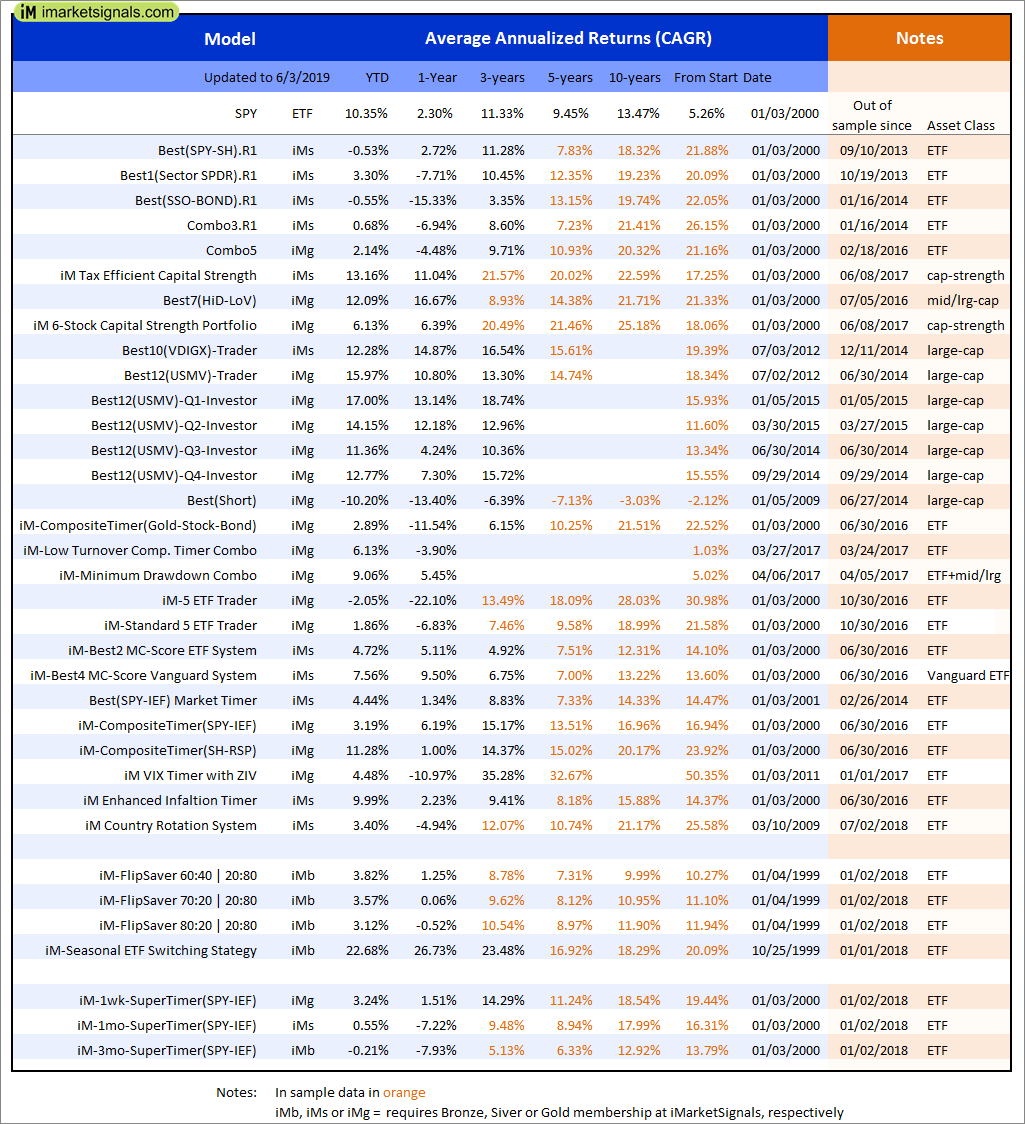
Out of sample performance summary of our models for the past 1, 2, 4 and 13 week periods. The active active return indicates how the models over- or underperformed the benchmark ETF SPY. Also the YTD, and the 1-, 3-, 5- and 10-year annualized returns are shown in the second table |
|
|
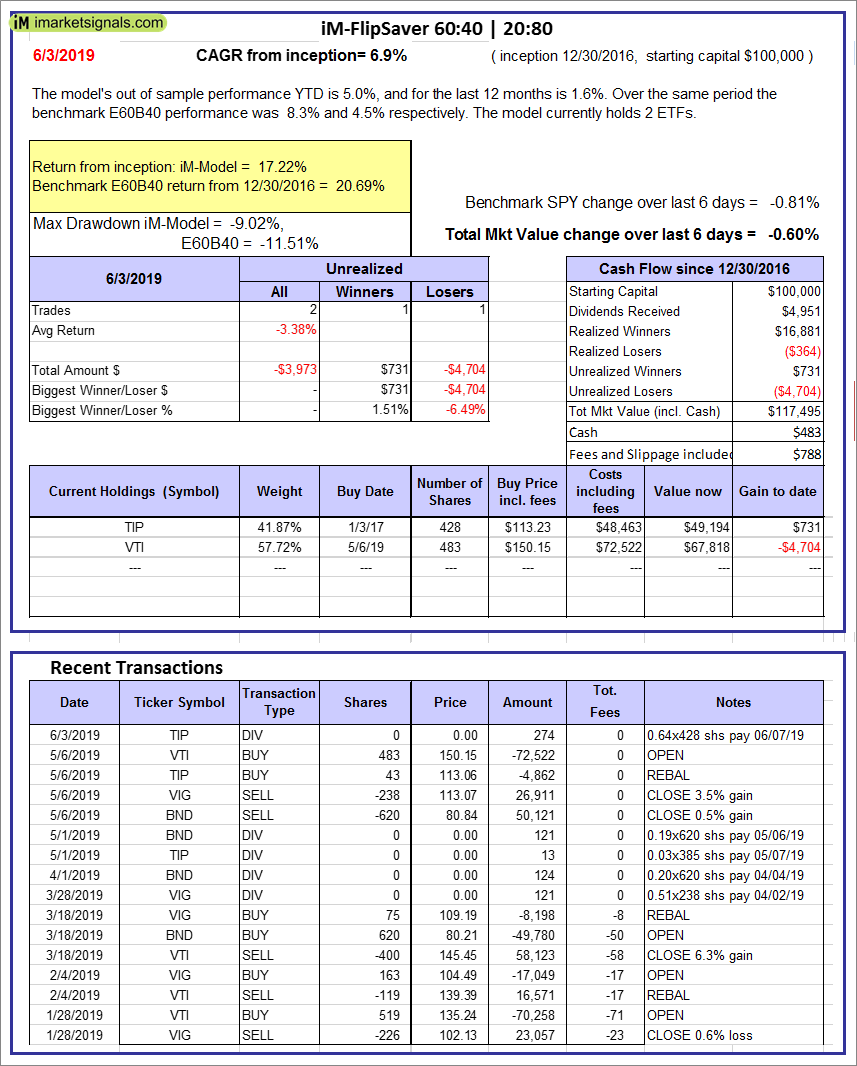
iM-FlipSaver 60:40 | 20:80 – 2017: The model’s out of sample performance YTD is 5.0%, and for the last 12 months is 1.6%. Over the same period the benchmark E60B40 performance was 8.3% and 4.5% respectively. Over the previous week the market value of iM-FlipSaver 80:20 | 20:80 gained -0.60% at a time when SPY gained -0.81%. A starting capital of $100,000 at inception on 7/16/2015 would have grown to $117,495 which includes $483 cash and excludes $788 spent on fees and slippage. |
|
|
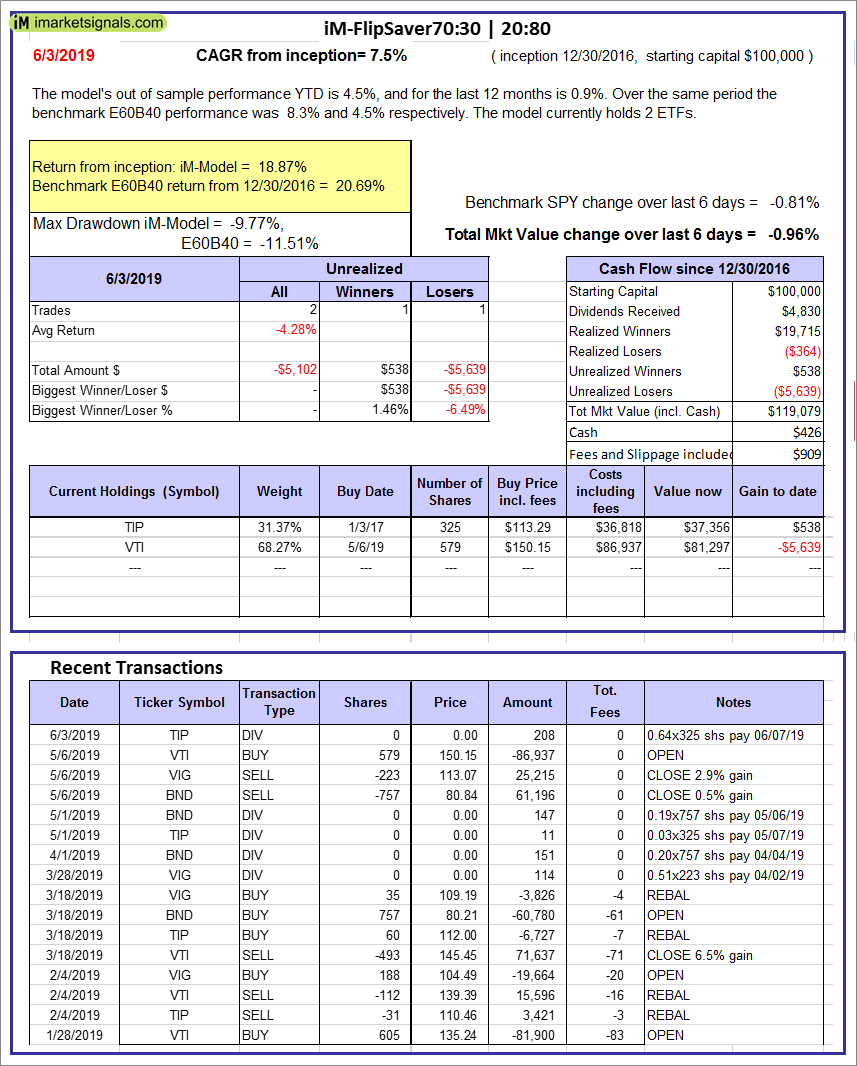
iM-FlipSaver 70:30 | 20:80 – 2017: The model’s out of sample performance YTD is 4.5%, and for the last 12 months is 0.9%. Over the same period the benchmark E60B40 performance was 8.3% and 4.5% respectively. Over the previous week the market value of iM-FlipSaver 70:30 | 20:80 gained -0.96% at a time when SPY gained -0.81%. A starting capital of $100,000 at inception on 7/15/2015 would have grown to $119,079 which includes $426 cash and excludes $909 spent on fees and slippage. |
|
|
iM-FlipSaver 80:20 | 20:80 – 2017: The model’s out of sample performance YTD is 4.0%, and for the last 12 months is 0.3%. Over the same period the benchmark E60B40 performance was 8.3% and 4.5% respectively. Over the previous week the market value of iM-FlipSaver 80:20 | 20:80 gained -1.31% at a time when SPY gained -0.81%. A starting capital of $100,000 at inception on 1/2/2017 would have grown to $120,639 which includes $461 cash and excludes $1,024 spent on fees and slippage. |
|
|
iM-Best(SPY-SH).R1: The model’s out of sample performance YTD is -1.1%, and for the last 12 months is 2.7%. Over the same period the benchmark SPY performance was 10.3% and 2.3% respectively. Over the previous week the market value of Best(SPY-SH) gained -0.31% at a time when SPY gained -1.99%. A starting capital of $100,000 at inception on 1/2/2009 would have grown to $594,742 which includes -$11,234 cash and excludes $22,629 spent on fees and slippage. |
|
|
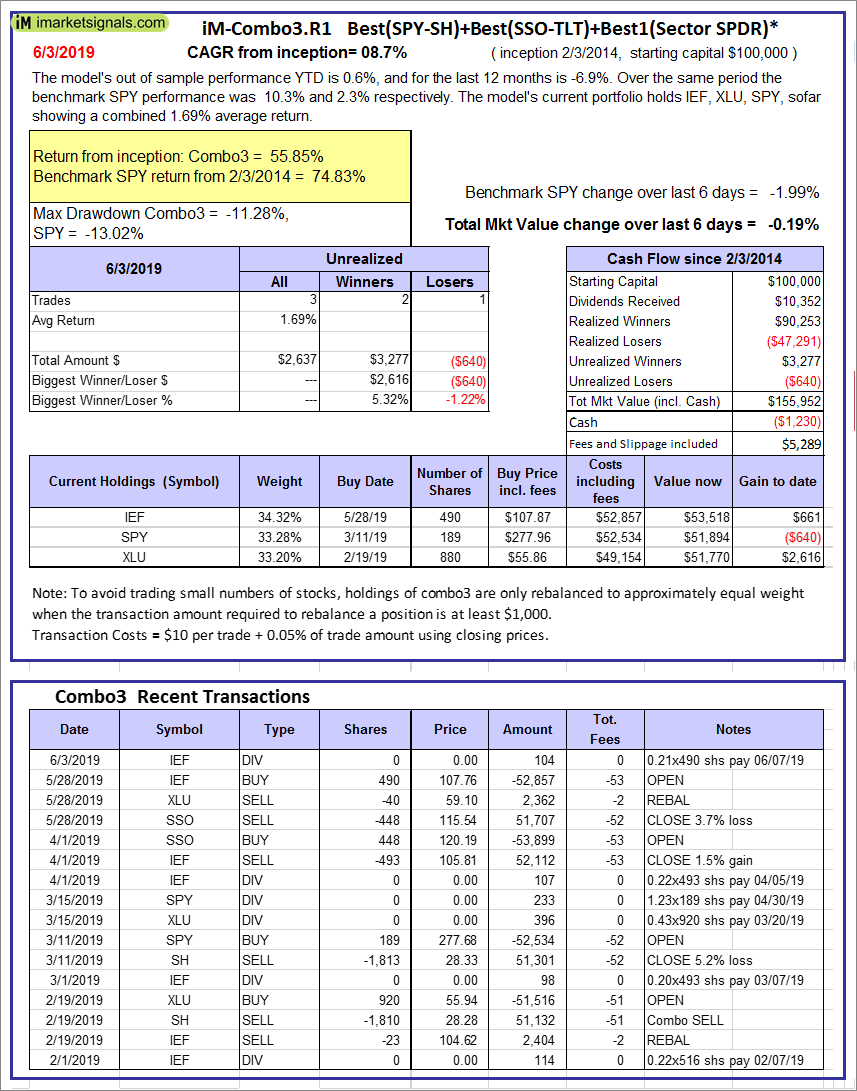
iM-Combo3.R1: The model’s out of sample performance YTD is 0.6%, and for the last 12 months is -6.9%. Over the same period the benchmark SPY performance was 10.3% and 2.3% respectively. Over the previous week the market value of iM-Combo3.R1 gained -0.77% at a time when SPY gained -1.99%. A starting capital of $100,000 at inception on 2/3/2014 would have grown to $155,952 which includes -$1,230 cash and excludes $5,289 spent on fees and slippage. |
|
|
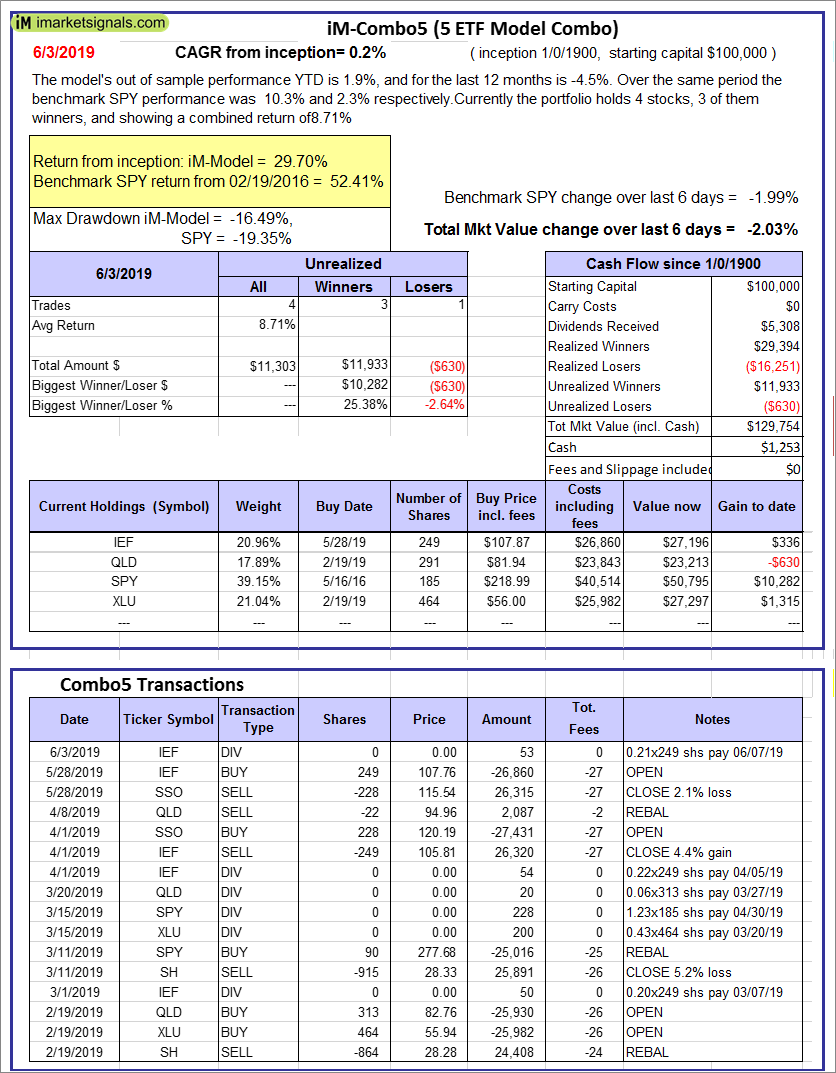
iM-Combo5: The model’s out of sample performance YTD is 1.9%, and for the last 12 months is -4.5%. Over the same period the benchmark SPY performance was 10.3% and 2.3% respectively. Over the previous week the market value of iM-Combo5 gained -2.03% at a time when SPY gained -1.99%. A starting capital of $100,000 at inception on 2/22/2016 would have grown to $129,754 which includes $1,253 cash and excludes $0 spent on fees and slippage. |
|
|
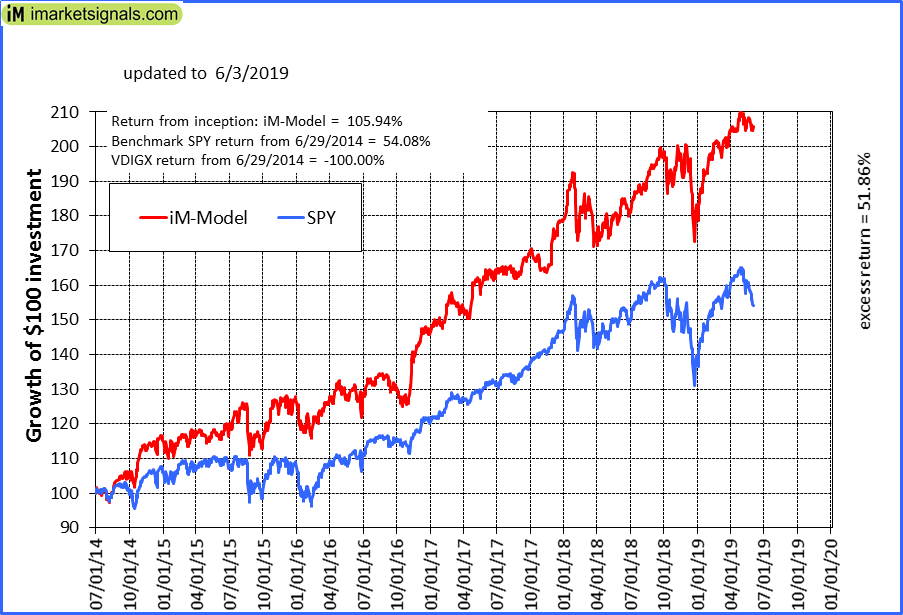
iM-Best10(VDIGX)-Trader: The model’s out of sample performance YTD is 12.3%, and for the last 12 months is 14.7%. Over the same period the benchmark SPY performance was 10.3% and 2.3% respectively. Since inception, on 7/1/2014, the model gained 105.94% while the benchmark SPY gained 54.08% and VDIGX gained -100.00% over the same period. Over the previous week the market value of iM-Best10(VDIGX) gained 0.28% at a time when SPY gained -1.99%. A starting capital of $100,000 at inception on 7/1/2014 would have grown to $205,942 which includes $591 cash and excludes $2,558 spent on fees and slippage. |
|
|
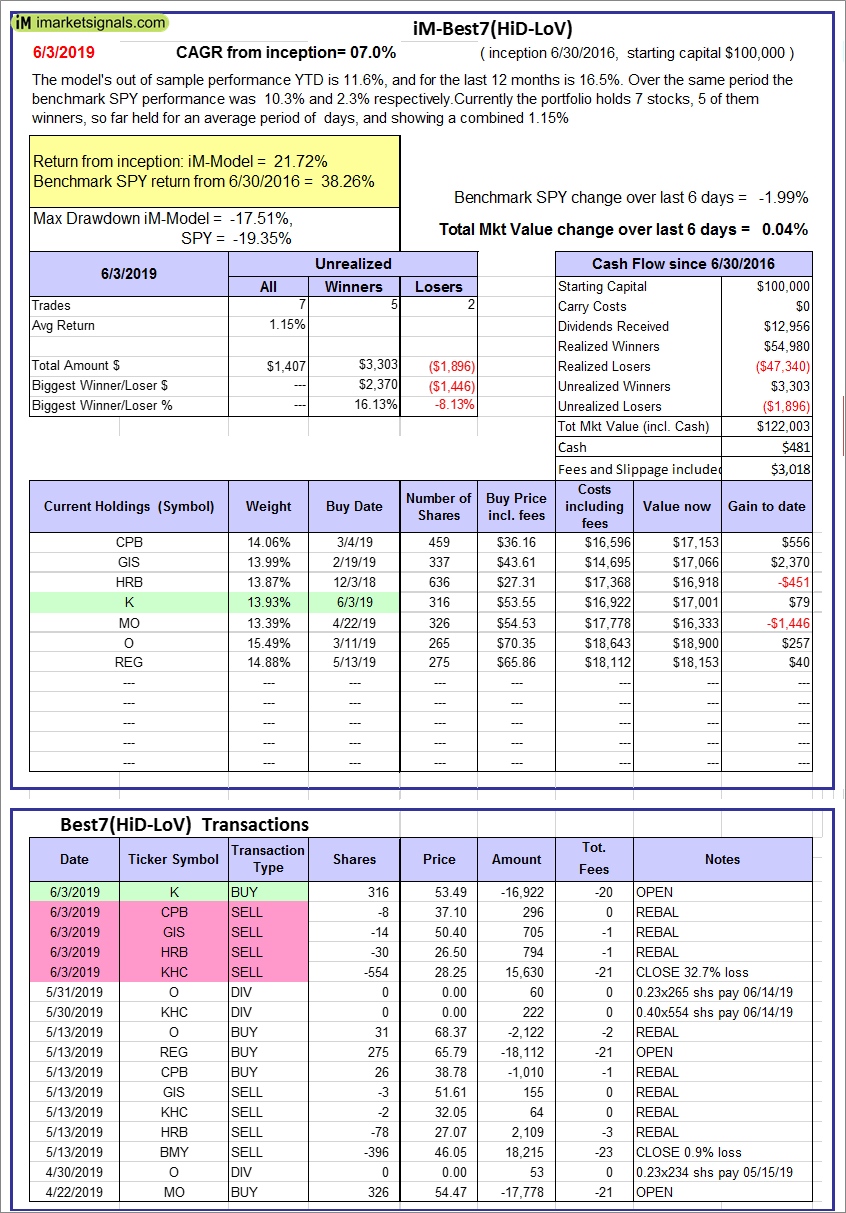
iM-Best7(HiD-LoV): The model’s out of sample performance YTD is 11.6%, and for the last 12 months is 16.5%. Over the same period the benchmark SPY performance was 10.3% and 2.3% respectively. Over the previous week the market value of iM-Best7(HiD-LoV) gained 0.04% at a time when SPY gained -1.99%. A starting capital of $100,000 at inception on 6/30/2016 would have grown to $122,003 which includes $481 cash and excludes $3,018 spent on fees and slippage. |
|
|
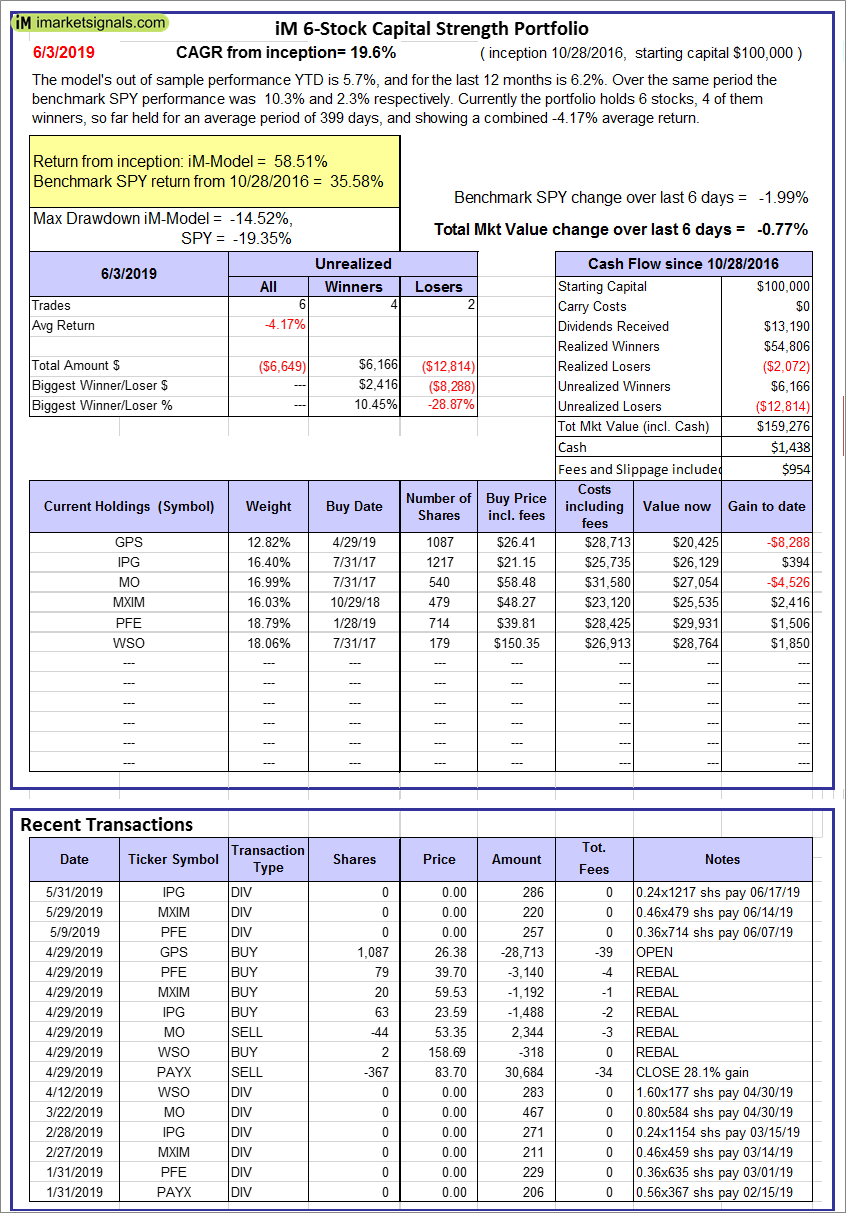
iM 6-Stock Capital Strength Portfolio: The model’s out of sample performance YTD is 5.7%, and for the last 12 months is 6.2%. Over the same period the benchmark SPY performance was 10.3% and 2.3% respectively. Over the previous week the market value of the iM 6-Stock Capital Strength Portfolio gained -0.77% at a time when SPY gained -1.99%. A starting capital of $100,000 at inception on 10/28/2016 would have grown to $159,276 which includes $1,438 cash and excludes $954 spent on fees and slippage. |
|
|
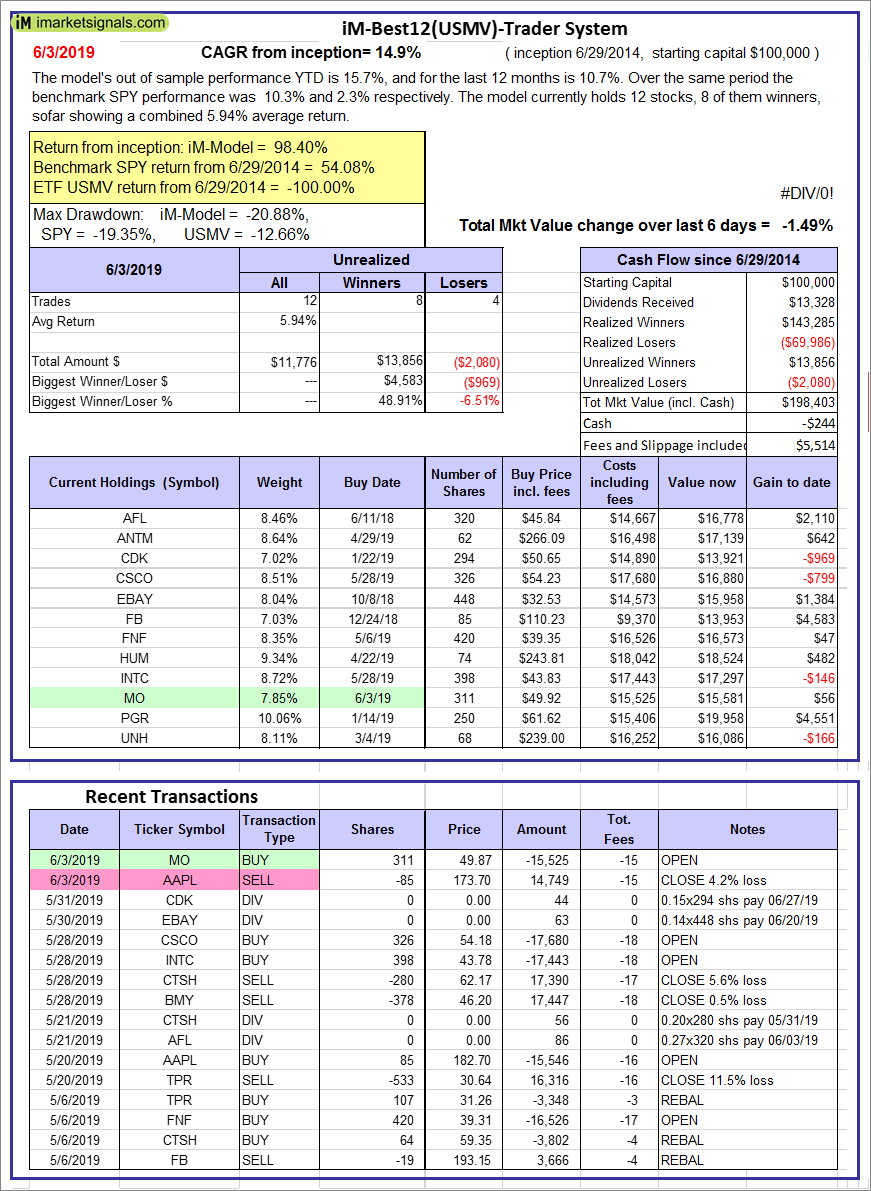
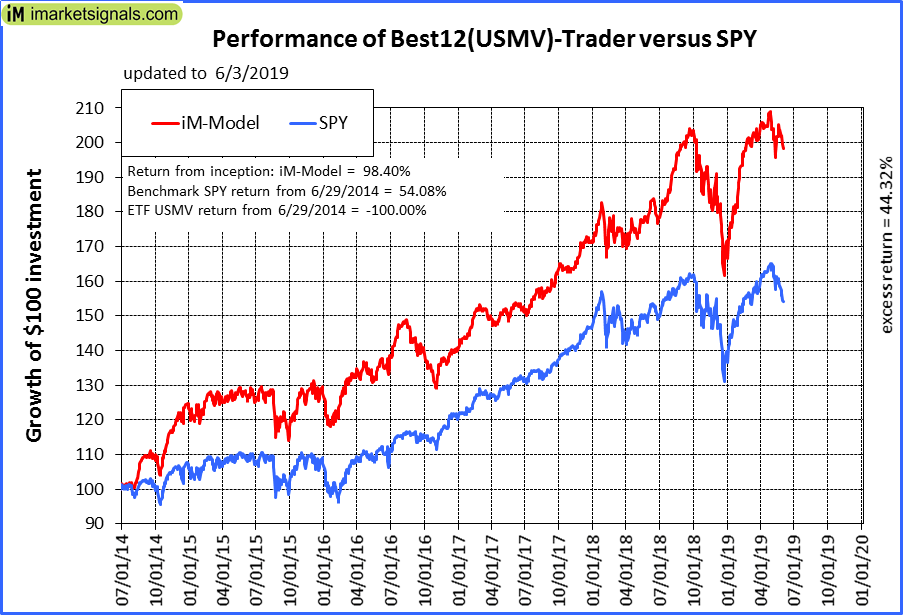
iM-Best12(USMV)-Trader: The model’s out of sample performance YTD is 15.7%, and for the last 12 months is 10.7%. Over the same period the benchmark SPY performance was 10.3% and 2.3% respectively. Since inception, on 6/30/2014, the model gained 98.40% while the benchmark SPY gained 54.08% and the ETF USMV gained -100.00% over the same period. Over the previous week the market value of iM-Best12(USMV)-Trader gained -1.49% at a time when SPY gained -1.99%. A starting capital of $100,000 at inception on 6/30/2014 would have grown to $198,403 which includes -$244 cash and excludes $5,514 spent on fees and slippage. |
|
|
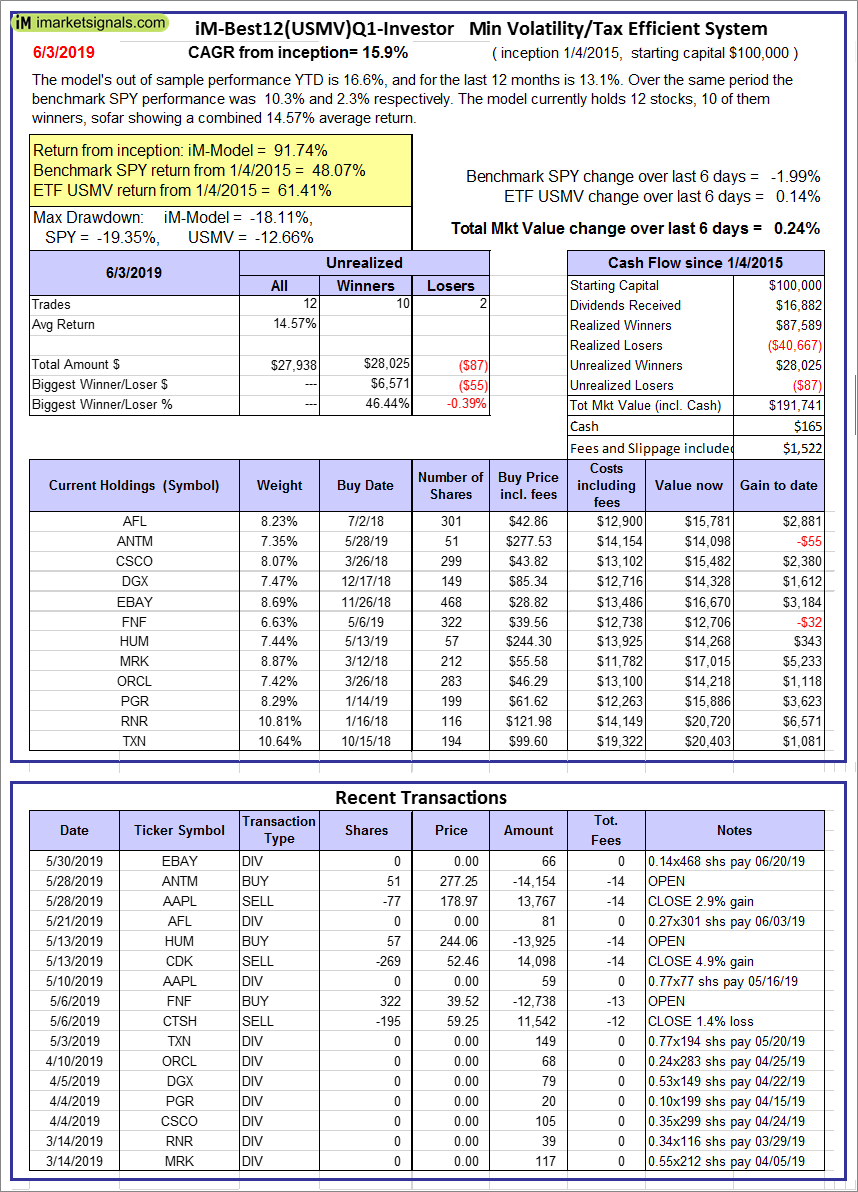
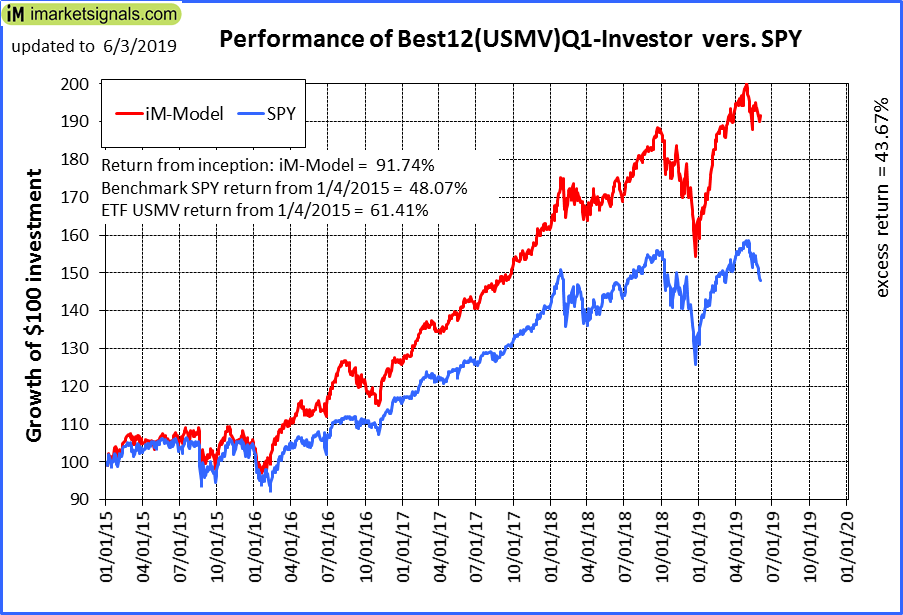
iM-Best12(USMV)Q1-Investor: The model’s out of sample performance YTD is 16.6%, and for the last 12 months is 13.1%. Over the same period the benchmark SPY performance was 10.3% and 2.3% respectively. Since inception, on 1/5/2015, the model gained 91.74% while the benchmark SPY gained 48.07% and the ETF USMV gained 61.41% over the same period. Over the previous week the market value of iM-Best12(USMV)Q1 gained 0.24% at a time when SPY gained -1.99%. A starting capital of $100,000 at inception on 1/5/2015 would have grown to $191,741 which includes $165 cash and excludes $1,522 spent on fees and slippage. |
|
|
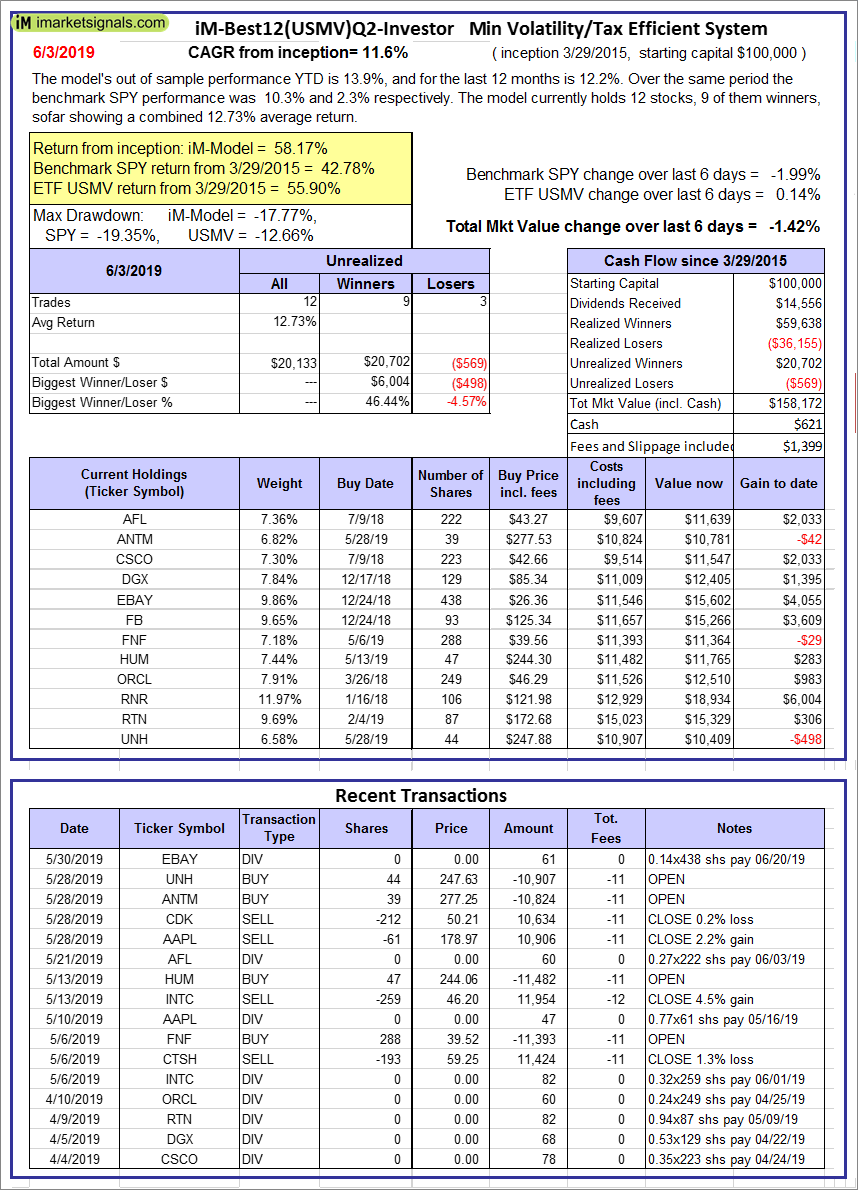
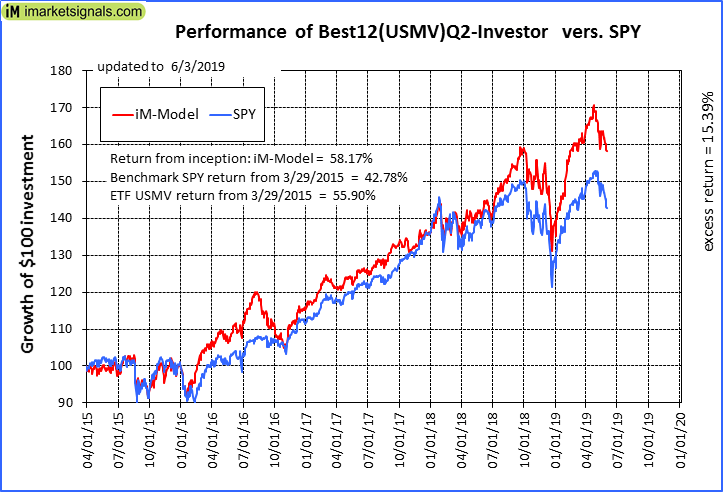
iM-Best12(USMV)Q2-Investor: The model’s out of sample performance YTD is 13.9%, and for the last 12 months is 12.2%. Over the same period the benchmark SPY performance was 10.3% and 2.3% respectively. Since inception, on 3/30/2015, the model gained 58.17% while the benchmark SPY gained 42.78% and the ETF USMV gained 55.90% over the same period. Over the previous week the market value of iM-Best12(USMV)Q2 gained -1.42% at a time when SPY gained -1.99%. A starting capital of $100,000 at inception on 3/30/2015 would have grown to $158,172 which includes $621 cash and excludes $1,399 spent on fees and slippage. |
|
|
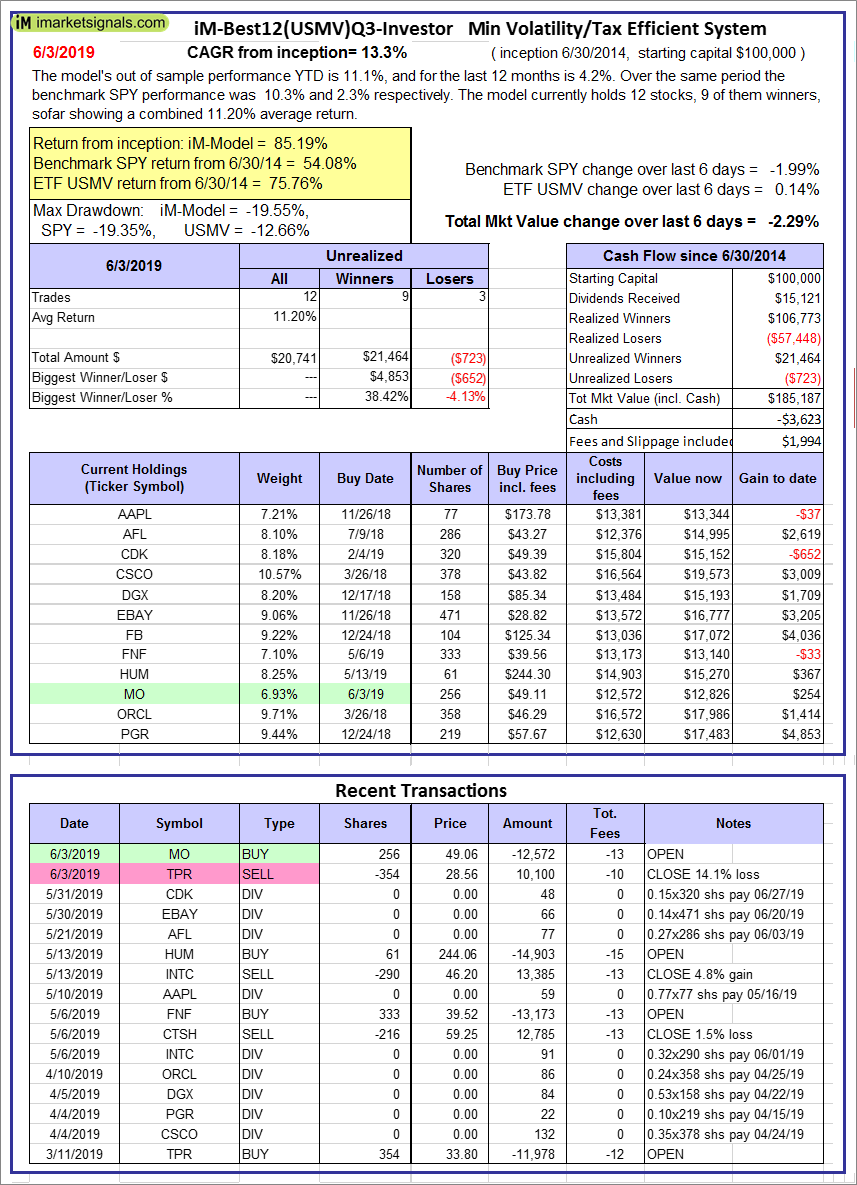
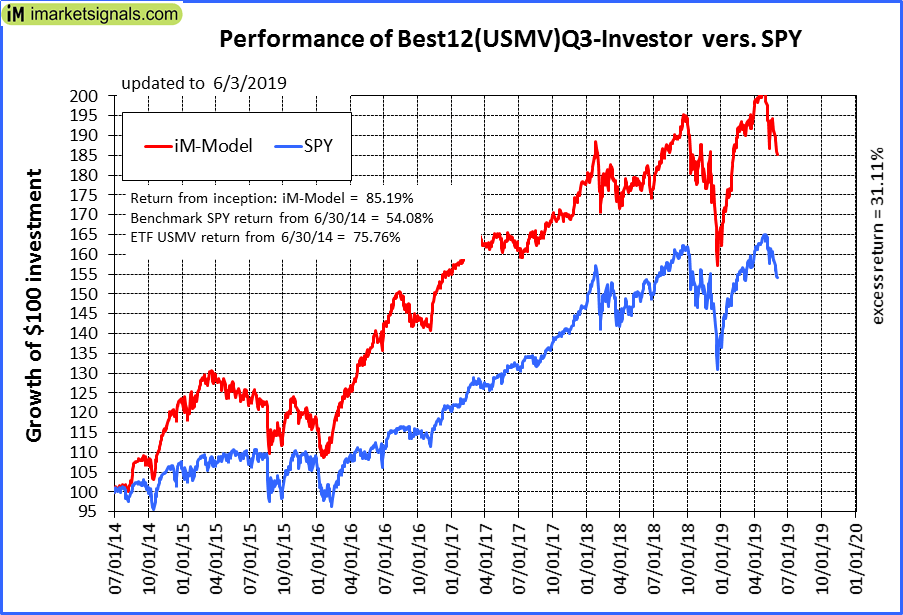
iM-Best12(USMV)Q3-Investor: The model’s out of sample performance YTD is 11.1%, and for the last 12 months is 4.2%. Over the same period the benchmark SPY performance was 10.3% and 2.3% respectively. Since inception, on 7/1/2014, the model gained 85.19% while the benchmark SPY gained 54.08% and the ETF USMV gained 75.76% over the same period. Over the previous week the market value of iM-Best12(USMV)Q3 gained -2.29% at a time when SPY gained -1.99%. A starting capital of $100,000 at inception on 7/1/2014 would have grown to $185,187 which includes -$3,623 cash and excludes $1,994 spent on fees and slippage. |
|
|
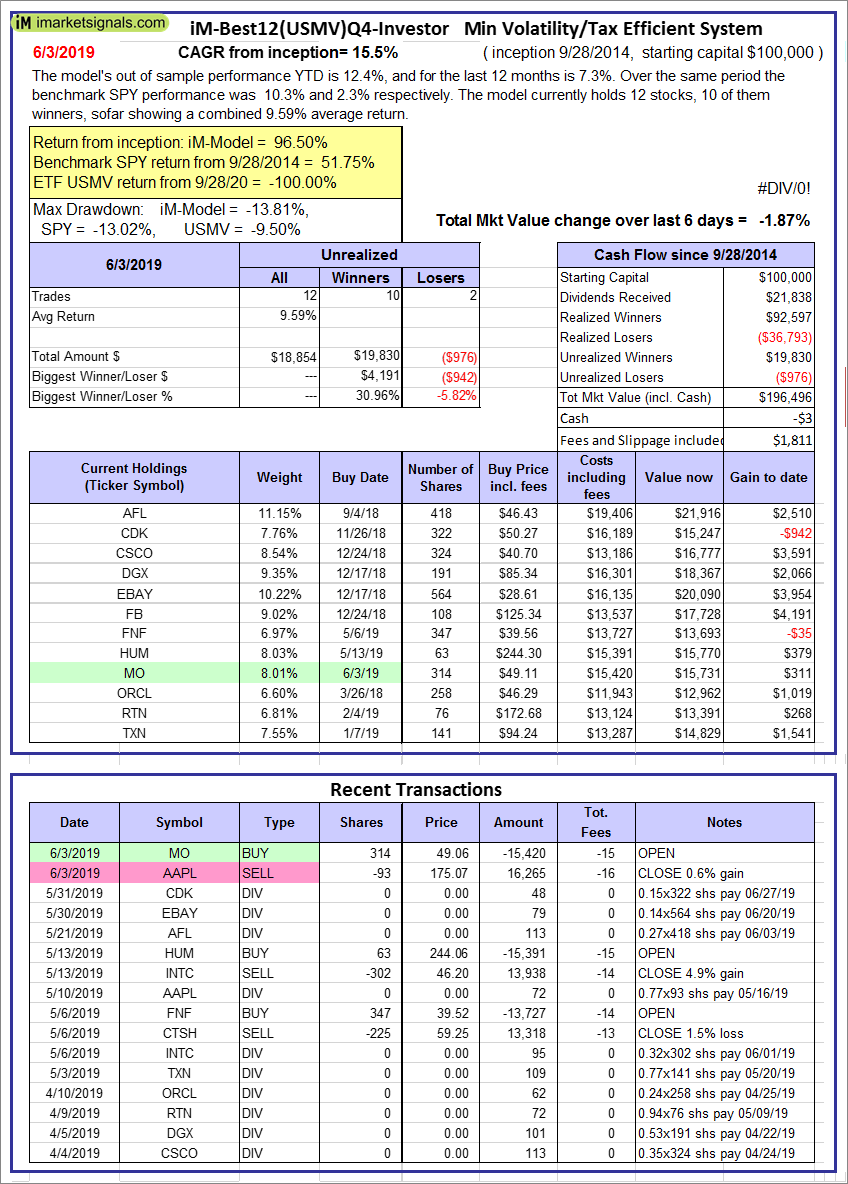
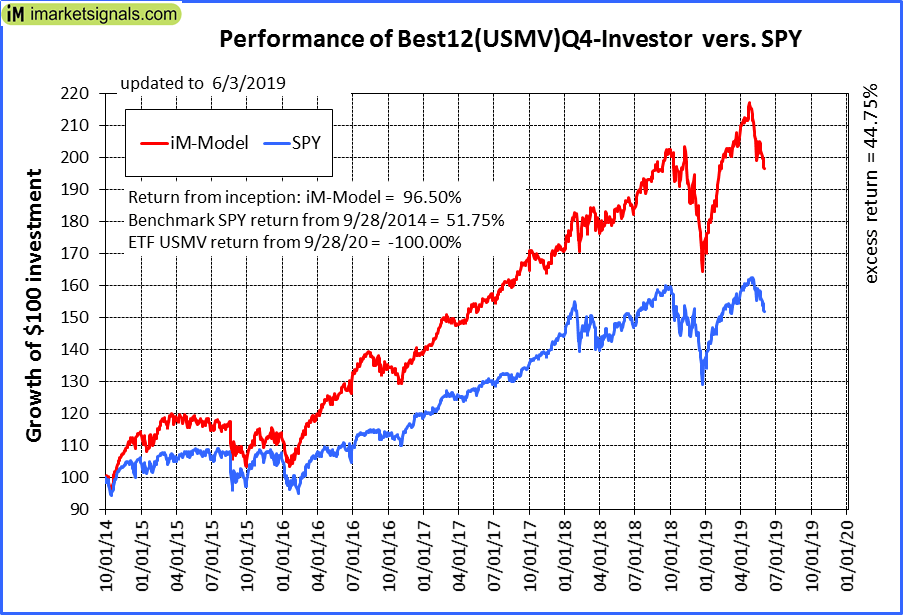
iM-Best12(USMV)Q4-Investor: Since inception, on 9/29/2014, the model gained 96.50% while the benchmark SPY gained 51.75% and the ETF USMV gained -100.00% over the same period. Over the previous week the market value of iM-Best12(USMV)Q4 gained -1.87% at a time when SPY gained -1.99%. A starting capital of $100,000 at inception on 9/29/2014 would have grown to $196,496 which includes -$3 cash and excludes $1,811 spent on fees and slippage. |
|
|
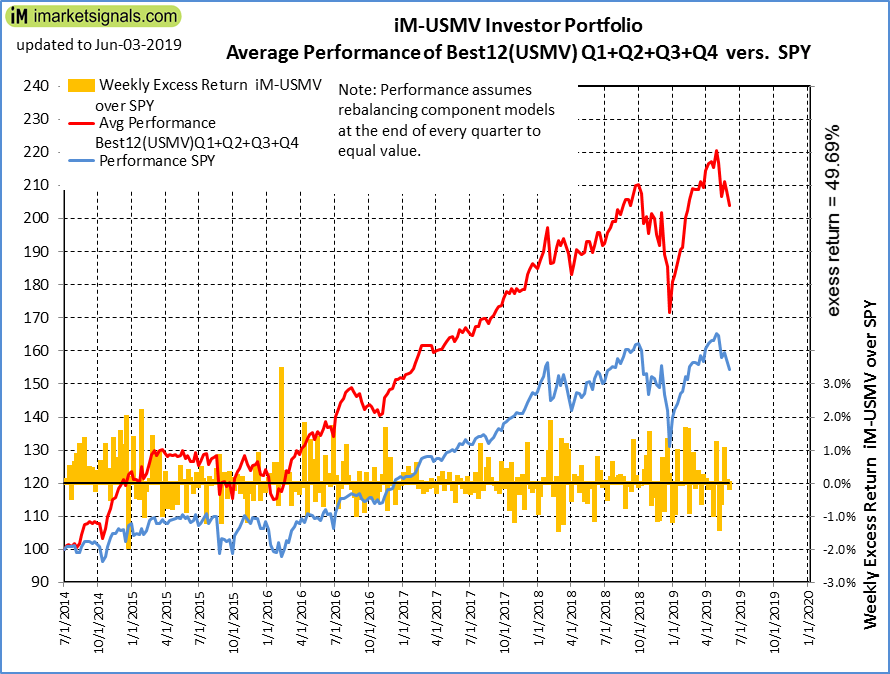
Average Performance of iM-Best12(USMV)Q1+Q2+Q3+Q4-Investor resulted in an excess return of 49.69% over SPY. (see iM-USMV Investor Portfolio) |
|
|
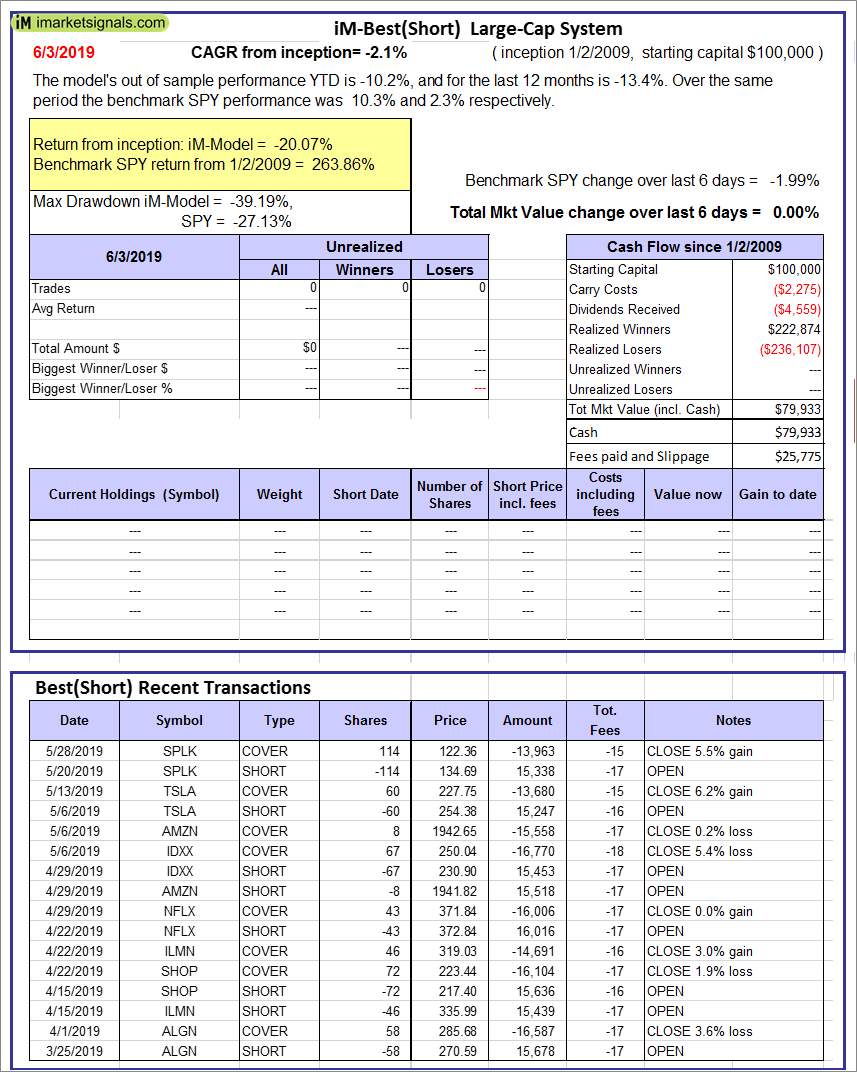
iM-Best(Short): The model’s out of sample performance YTD is -10.2%, and for the last 12 months is -13.4%. Over the same period the benchmark SPY performance was 10.3% and 2.3% respectively. Over the previous week the market value of iM-Best(Short) gained 0.00% at a time when SPY gained -1.99%. Over the period 1/2/2009 to 6/3/2019 the starting capital of $100,000 would have grown to $79,933 which includes $79,933 cash and excludes $25,775 spent on fees and slippage. |
|
|
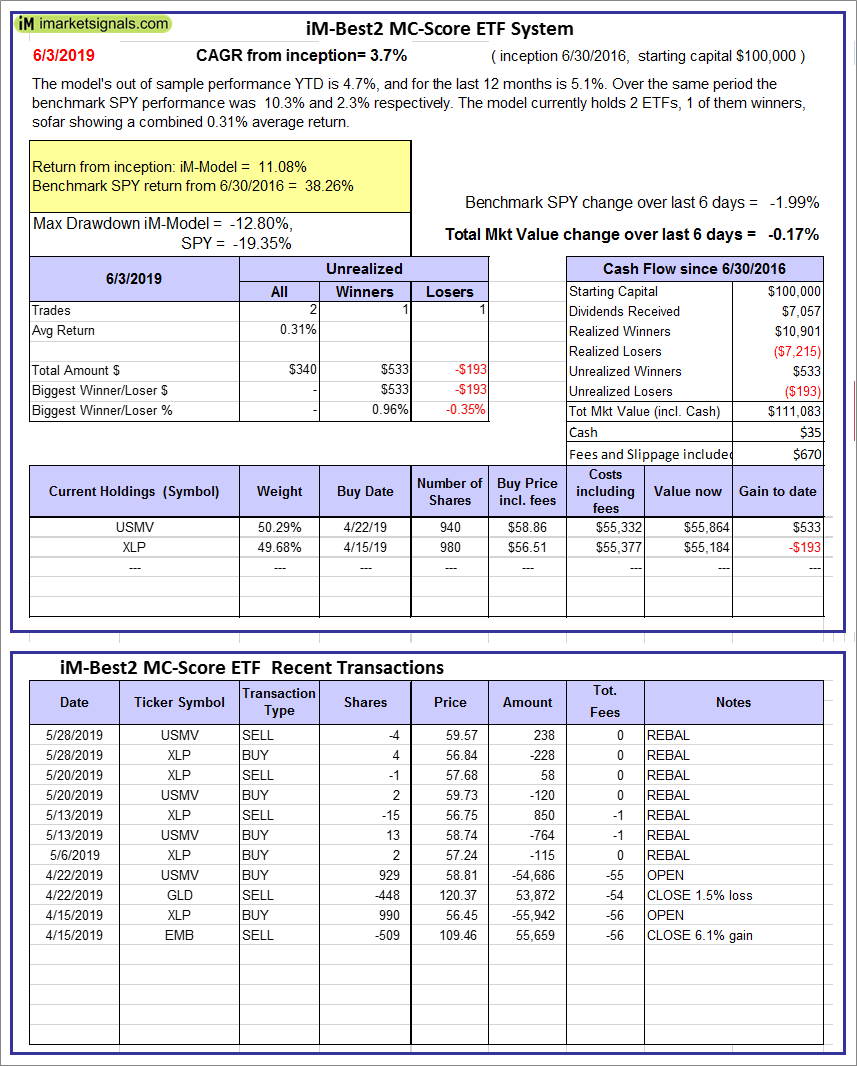
iM-Best2 MC-Score ETF System: The model’s out of sample performance YTD is 4.7%, and for the last 12 months is 5.1%. Over the same period the benchmark SPY performance was 10.3% and 2.3% respectively. Over the previous week the market value of the iM-Best2 MC-Score ETF System gained -0.17% at a time when SPY gained -1.99%. A starting capital of $100,000 at inception on 6/30/2016 would have grown to $111,083 which includes $35 cash and excludes $670 spent on fees and slippage. |
|
|
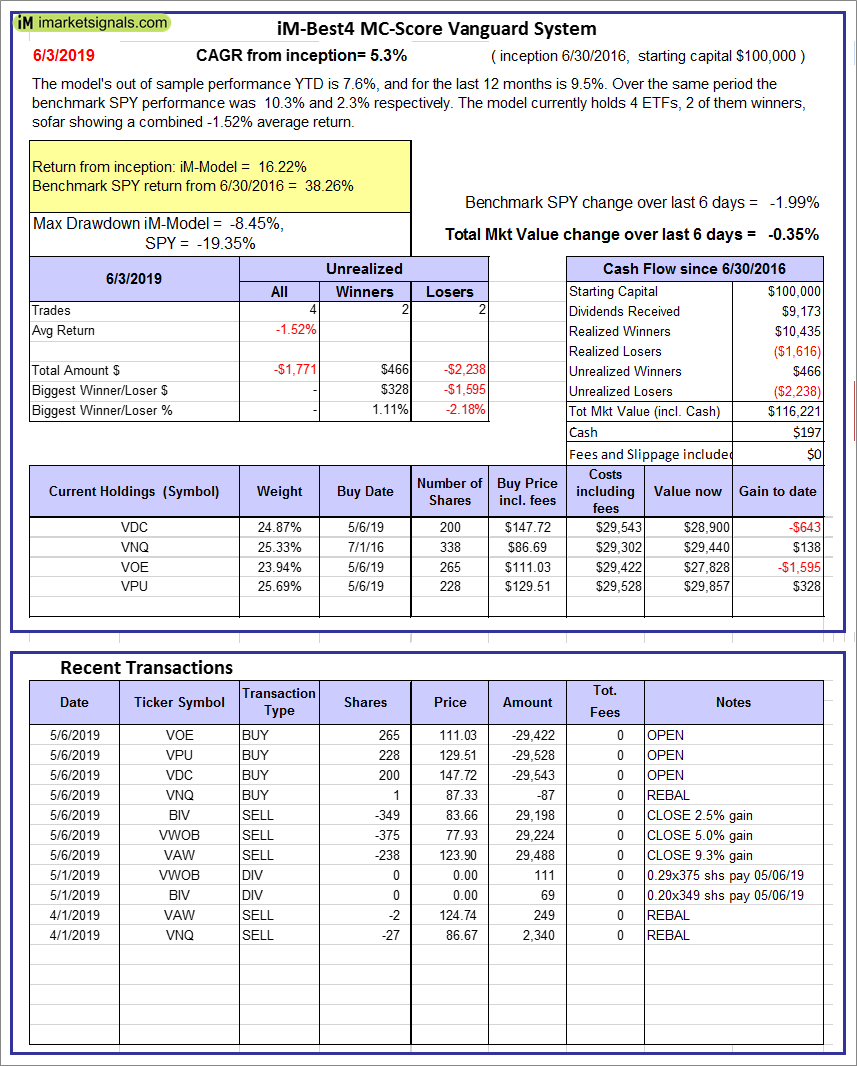
iM-Best4 MC-Score Vanguard System: The model’s out of sample performance YTD is 7.6%, and for the last 12 months is 9.5%. Over the same period the benchmark SPY performance was 10.3% and 2.3% respectively. Over the previous week the market value of the iM-Best4 MC-Score Vanguard System gained -0.35% at a time when SPY gained -1.99%. A starting capital of $100,000 at inception on 6/30/2016 would have grown to $116,221 which includes $197 cash and excludes $00 spent on fees and slippage. |
|
|
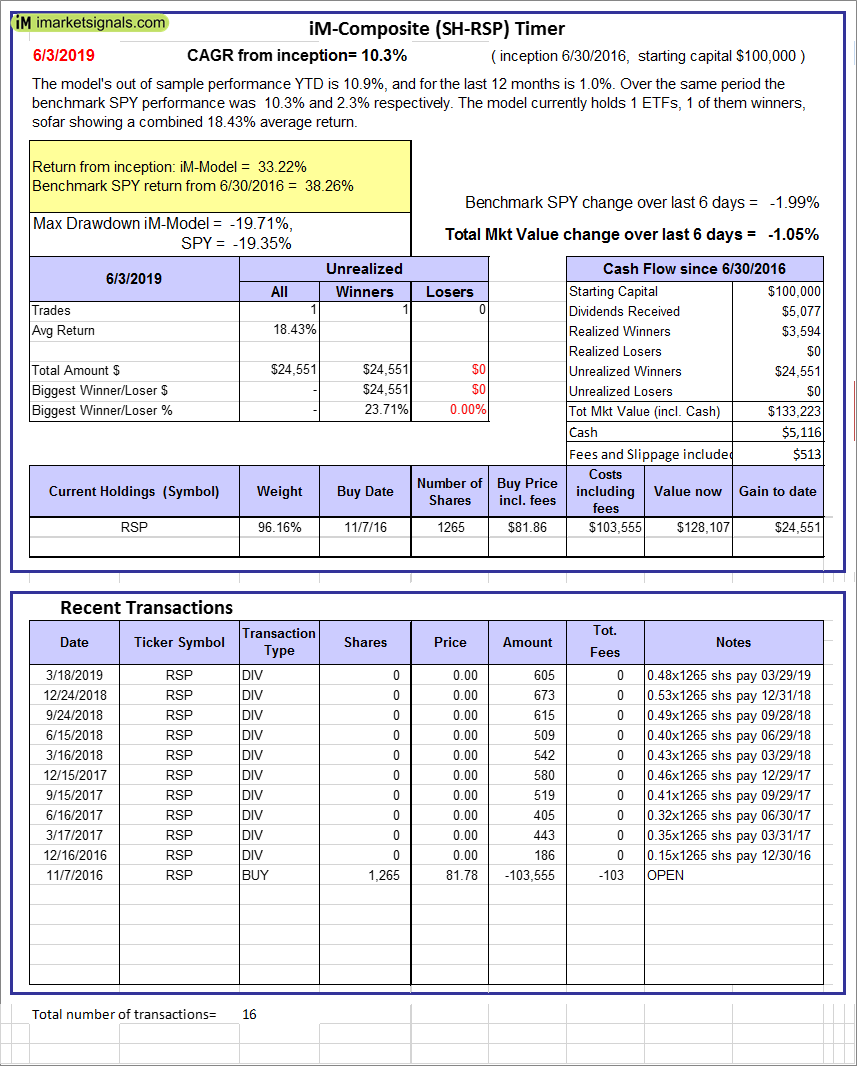
iM-Composite (SH-RSP) Timer: The model’s out of sample performance YTD is 10.9%, and for the last 12 months is 1.0%. Over the same period the benchmark SPY performance was 10.3% and 2.3% respectively. Over the previous week the market value of the iM-Composite (SH-RSP) Timer gained -1.05% at a time when SPY gained -1.99%. A starting capital of $100,000 at inception on 6/30/2016 would have grown to $133,223 which includes $5,116 cash and excludes $513 spent on fees and slippage. |
|
|
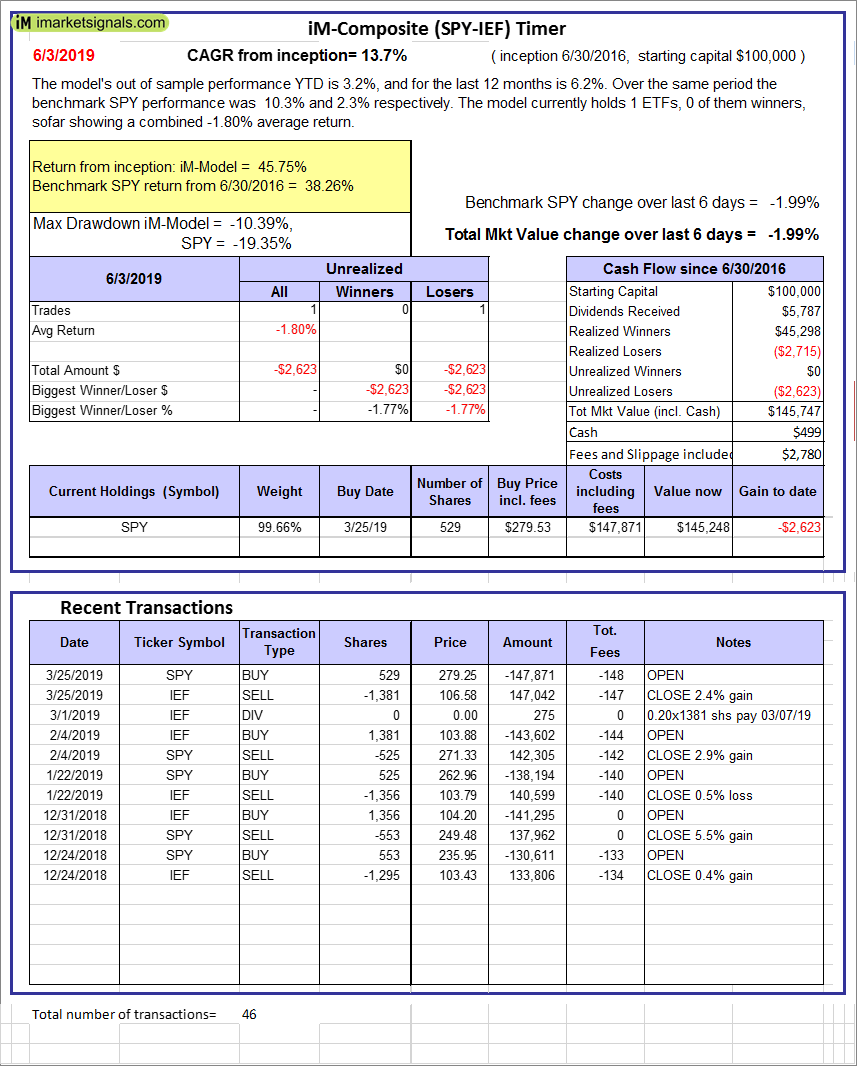
iM-Composite (SPY-IEF) Timer: The model’s out of sample performance YTD is 3.2%, and for the last 12 months is 6.2%. Over the same period the benchmark SPY performance was 10.3% and 2.3% respectively. Over the previous week the market value of the iM-Composite (SPY-IEF) Timer gained -1.99% at a time when SPY gained -1.99%. A starting capital of $100,000 at inception on 6/30/2016 would have grown to $145,747 which includes $499 cash and excludes $2,780 spent on fees and slippage. |
|
|
iM-VIX Timer with ZIV: The model’s out of sample performance YTD is 4.5%, and for the last 12 months is -11.0%. Over the same period the benchmark SPY performance was 10.3% and 2.3% respectively. Over the previous week the market value of the iM-VIX Timer with ZIV gained -2.51% at a time when SPY gained -1.99%. A starting capital of $100,000 at inception on 6/30/2016 would have grown to $188,912 which includes $1,115 cash and excludes $5,544 spent on fees and slippage. |
|
|
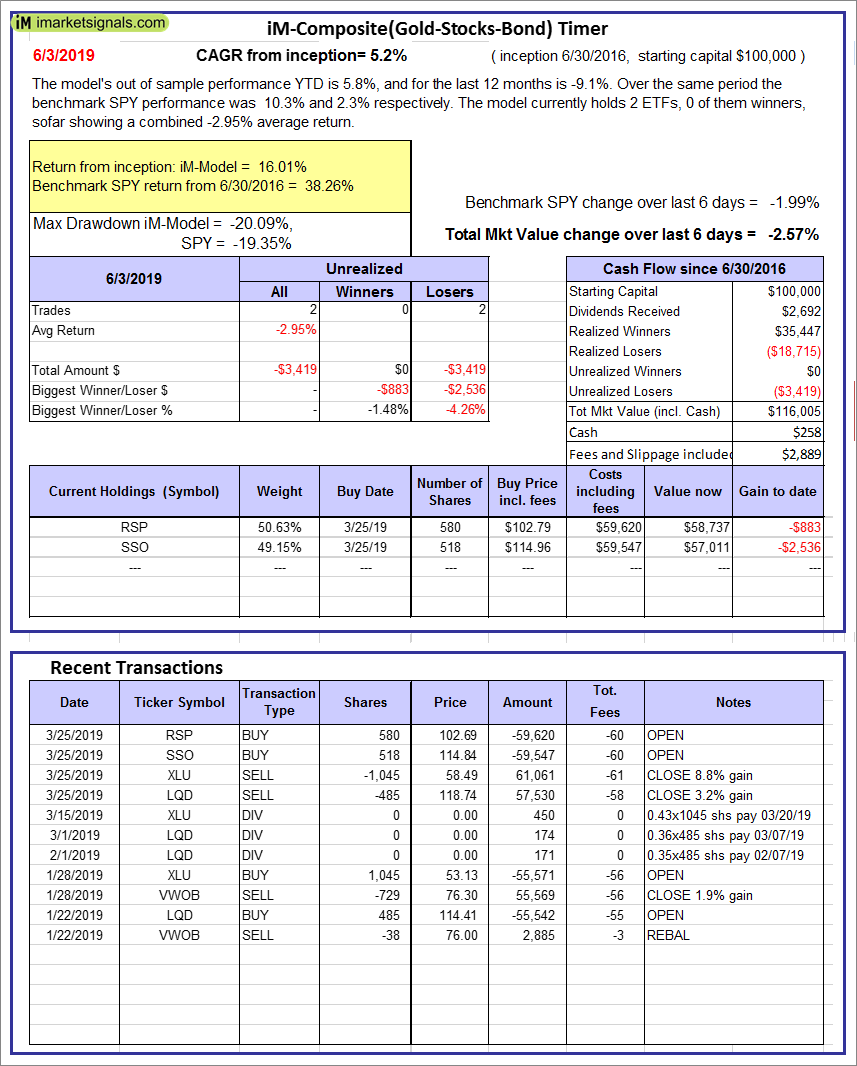
iM-Composite(Gold-Stocks-Bond) Timer: The model’s out of sample performance YTD is 5.8%, and for the last 12 months is -9.1%. Over the same period the benchmark SPY performance was 10.3% and 2.3% respectively. Over the previous week the market value of the iM-Composite(Gold-Stocks-Bond) Timer gained -2.57% at a time when SPY gained -1.99%. A starting capital of $100,000 at inception on 6/30/2016 would have grown to $116,005 which includes $258 cash and excludes $2,889 spent on fees and slippage. |
|
|
iM-Low Turnover Composite Timer Combo: The model’s out of sample performance YTD is 6.1%, and for the last 12 months is -3.9%. Over the same period the benchmark SPY performance was 10.3% and 2.3% respectively. Over the previous week the market value of the iM-Low Turnover Composite Timer Combo gained -0.16% at a time when SPY gained -1.99%. A starting capital of $100,000 at inception on 3/24/27 would have grown to $102,253 which includes -$527 cash and excludes $813 spent on fees and slippage. |
|
|
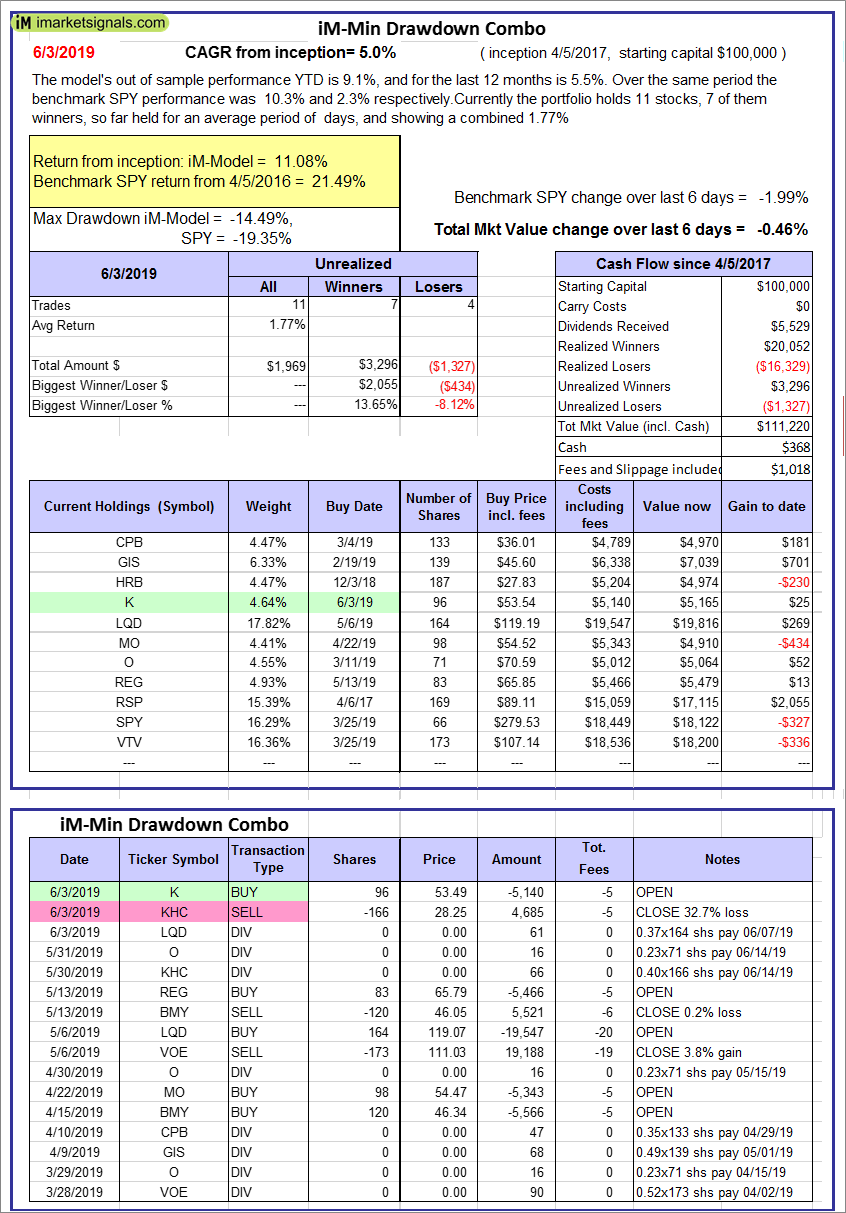
iM-Min Drawdown Combo: The model’s out of sample performance YTD is 9.1%, and for the last 12 months is 5.5%. Over the same period the benchmark SPY performance was 10.3% and 2.3% respectively. Over the previous week the market value of the iM-Min Drawdown Combo gained -0.46% at a time when SPY gained -1.99%. A starting capital of $100,000 at inception on 4/5/2017 would have grown to $111,220 which includes $368 cash and excludes $1,018 spent on fees and slippage. |
|
|
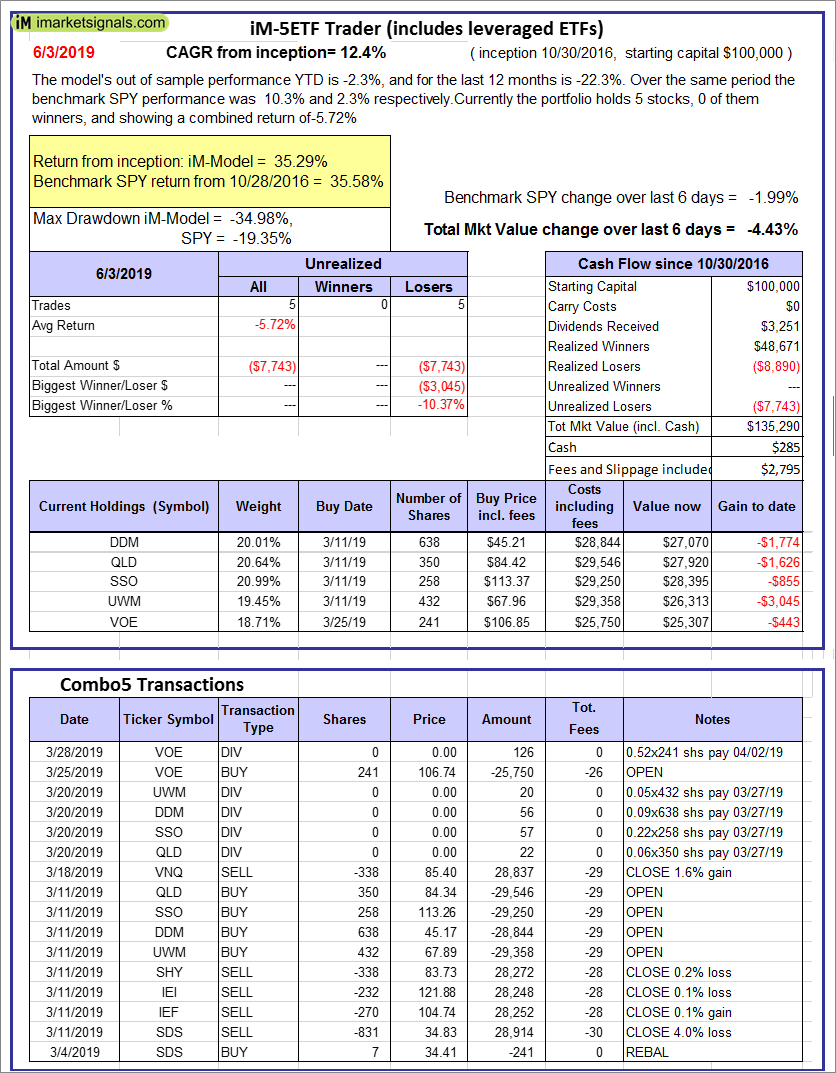
iM-5ETF Trader (includes leveraged ETFs): The model’s out of sample performance YTD is -2.3%, and for the last 12 months is -22.3%. Over the same period the benchmark SPY performance was 10.3% and 2.3% respectively. Over the previous week the market value of the iM-5ETF Trader (includes leveraged ETFs) gained -4.43% at a time when SPY gained -1.99%. A starting capital of $100,000 at inception on 10/30/2016 would have grown to $135,290 which includes $285 cash and excludes $2,795 spent on fees and slippage. |
|
|
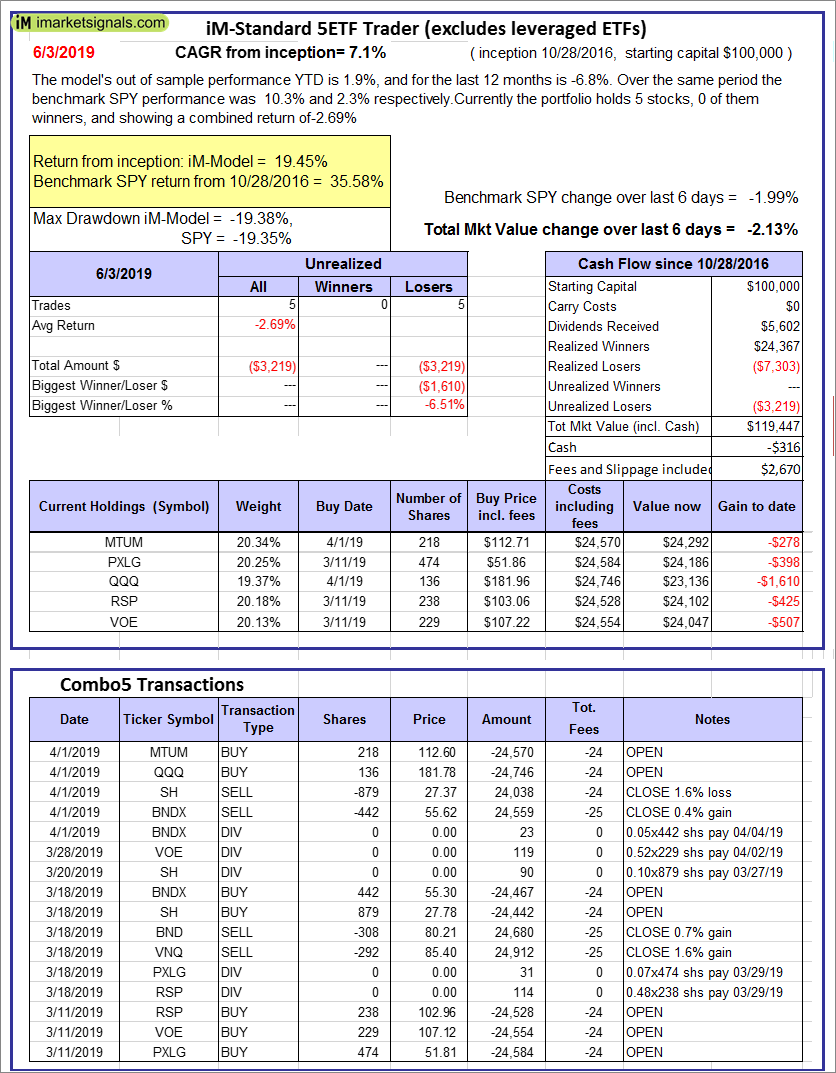
iM-Standard 5ETF Trader (excludes leveraged ETFs): The model’s out of sample performance YTD is 1.9%, and for the last 12 months is -6.8%. Over the same period the benchmark SPY performance was 10.3% and 2.3% respectively. Over the previous week the market value of the iM-Standard 5ETF Trader (excludes leveraged ETFs) gained -2.13% at a time when SPY gained -1.99%. A starting capital of $100,000 at inception on 10/30/2016 would have grown to $119,447 which includes -$316 cash and excludes $2,670 spent on fees and slippage. |


Leave a Reply
You must be logged in to post a comment.