
  |
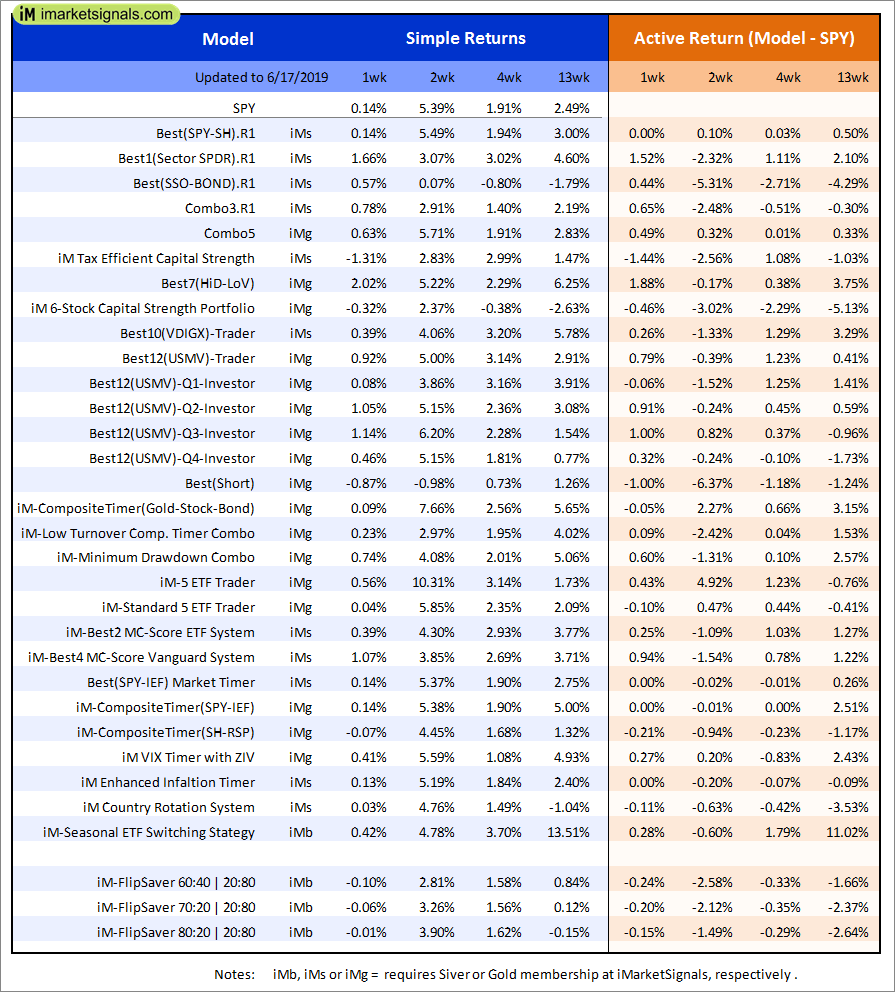
Out of sample performance summary of our models for the past 1, 2, 4 and 13 week periods. The active active return indicates how the models over- or underperformed the benchmark ETF SPY. Also the YTD, and the 1-, 3-, 5- and 10-year annualized returns are shown in the second table |
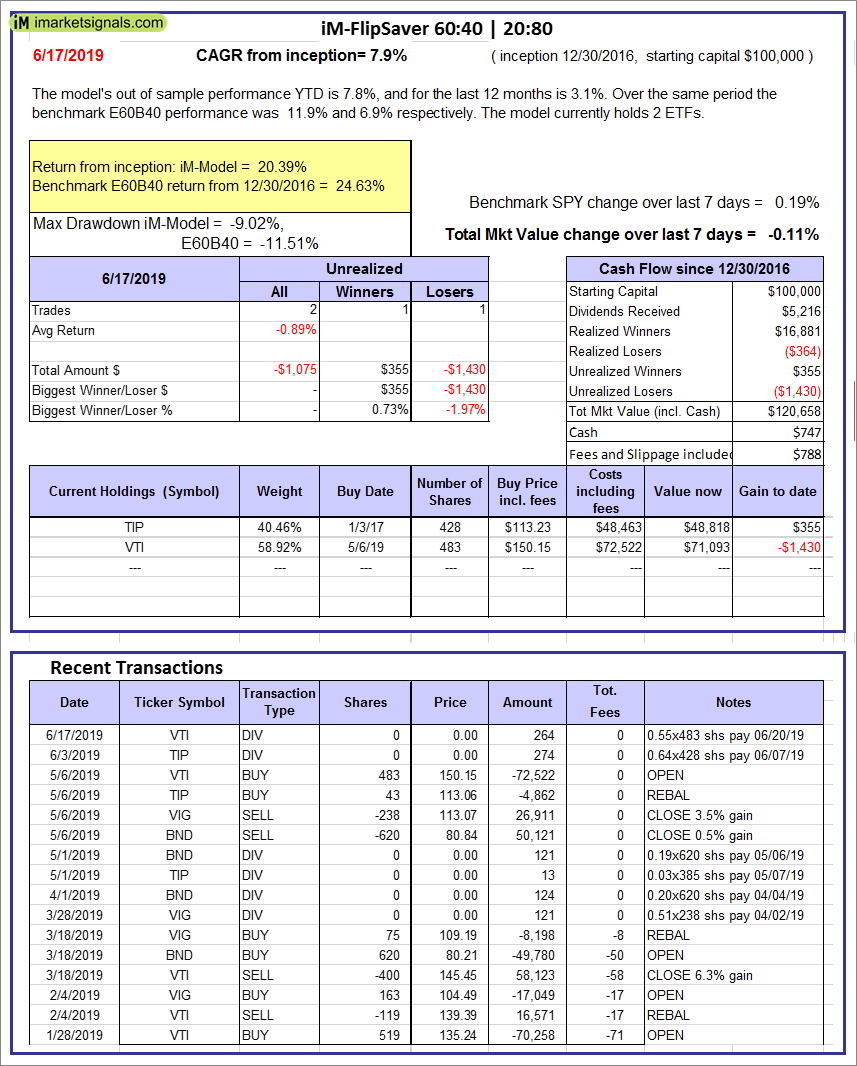 |
iM-FlipSaver 60:40 | 20:80 – 2017: The model’s out of sample performance YTD is 7.8%, and for the last 12 months is 3.1%. Over the same period the benchmark E60B40 performance was 11.9% and 6.9% respectively. Over the previous week the market value of iM-FlipSaver 80:20 | 20:80 gained -0.11% at a time when SPY gained 0.19%. A starting capital of $100,000 at inception on 7/16/2015 would have grown to $120,658 which includes $747 cash and excludes $788 spent on fees and slippage. |
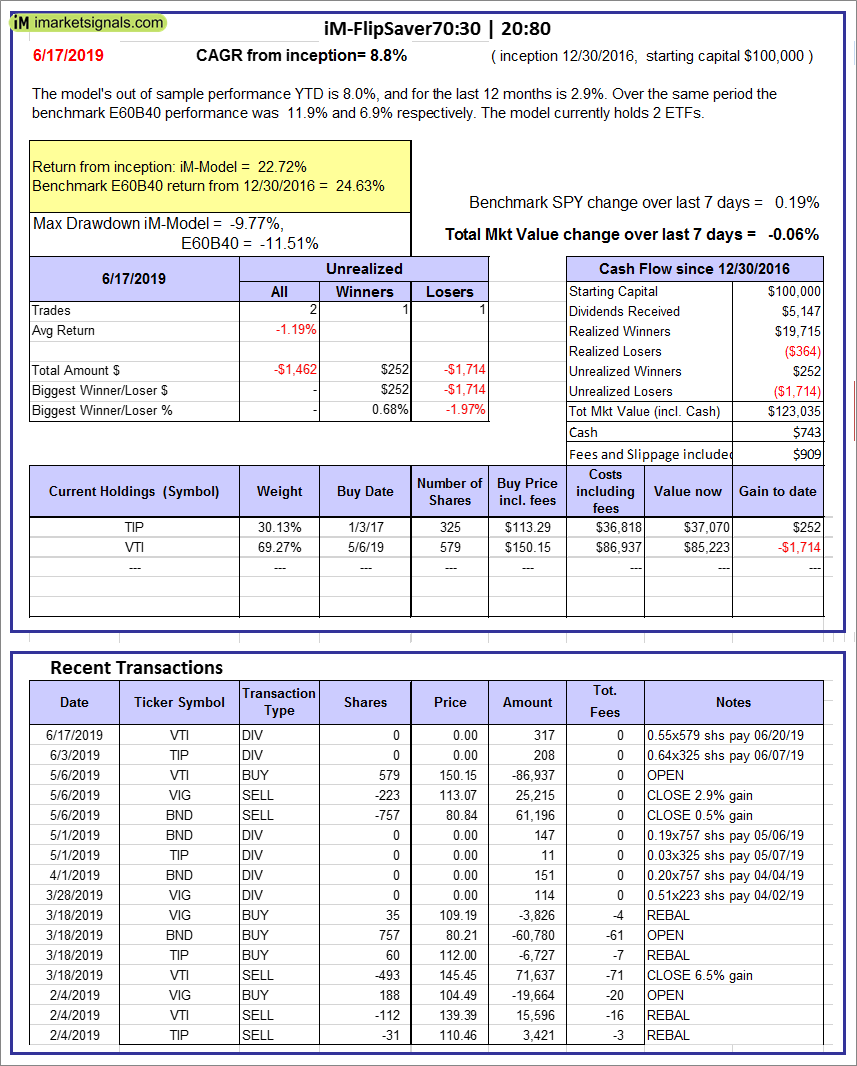 |
iM-FlipSaver 70:30 | 20:80 – 2017: The model’s out of sample performance YTD is 8.0%, and for the last 12 months is 2.9%. Over the same period the benchmark E60B40 performance was 11.9% and 6.9% respectively. Over the previous week the market value of iM-FlipSaver 70:30 | 20:80 gained -0.06% at a time when SPY gained 0.19%. A starting capital of $100,000 at inception on 7/15/2015 would have grown to $123,035 which includes $743 cash and excludes $909 spent on fees and slippage. |
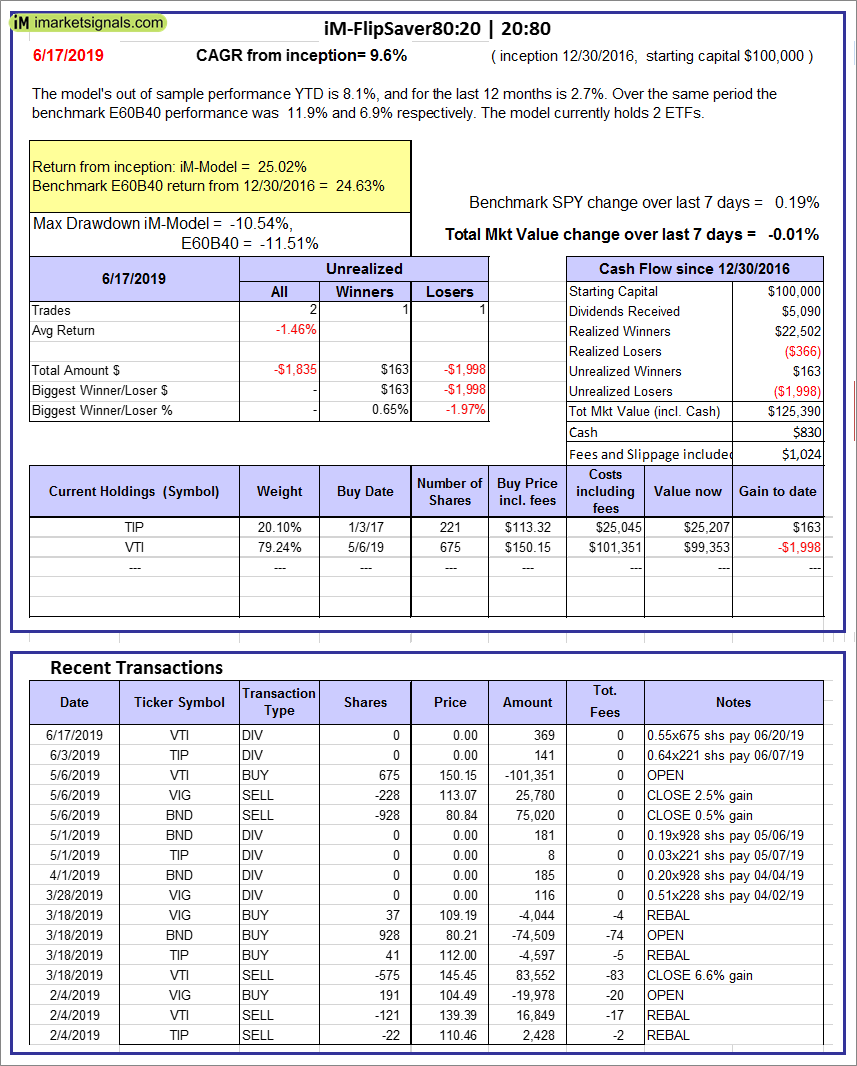 |
iM-FlipSaver 80:20 | 20:80 – 2017: The model’s out of sample performance YTD is 8.1%, and for the last 12 months is 2.7%. Over the same period the benchmark E60B40 performance was 11.9% and 6.9% respectively. Over the previous week the market value of iM-FlipSaver 80:20 | 20:80 gained -0.01% at a time when SPY gained 0.19%. A starting capital of $100,000 at inception on 1/2/2017 would have grown to $125,390 which includes $830 cash and excludes $1,024 spent on fees and slippage. |
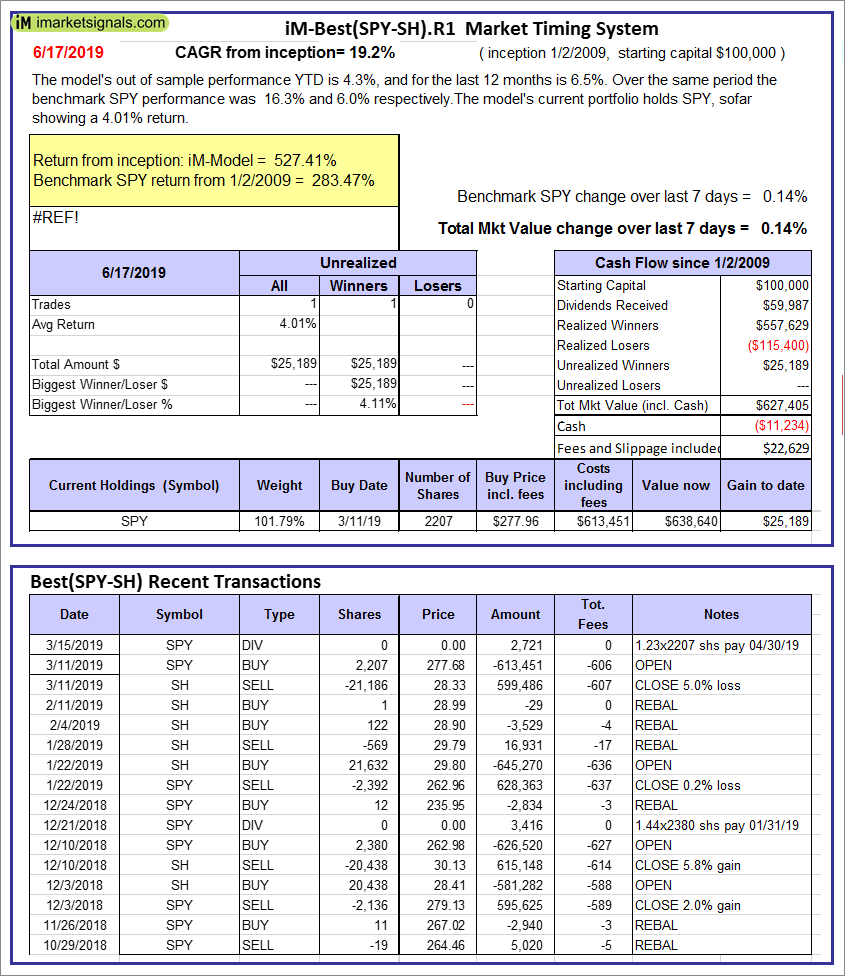 |
iM-Best(SPY-SH).R1: The model’s out of sample performance YTD is 4.3%, and for the last 12 months is 6.5%. Over the same period the benchmark SPY performance was 16.3% and 6.0% respectively. Over the previous week the market value of Best(SPY-SH) gained 0.14% at a time when SPY gained 0.14%. A starting capital of $100,000 at inception on 1/2/2009 would have grown to $627,405 which includes -$11,234 cash and excludes $22,629 spent on fees and slippage. |
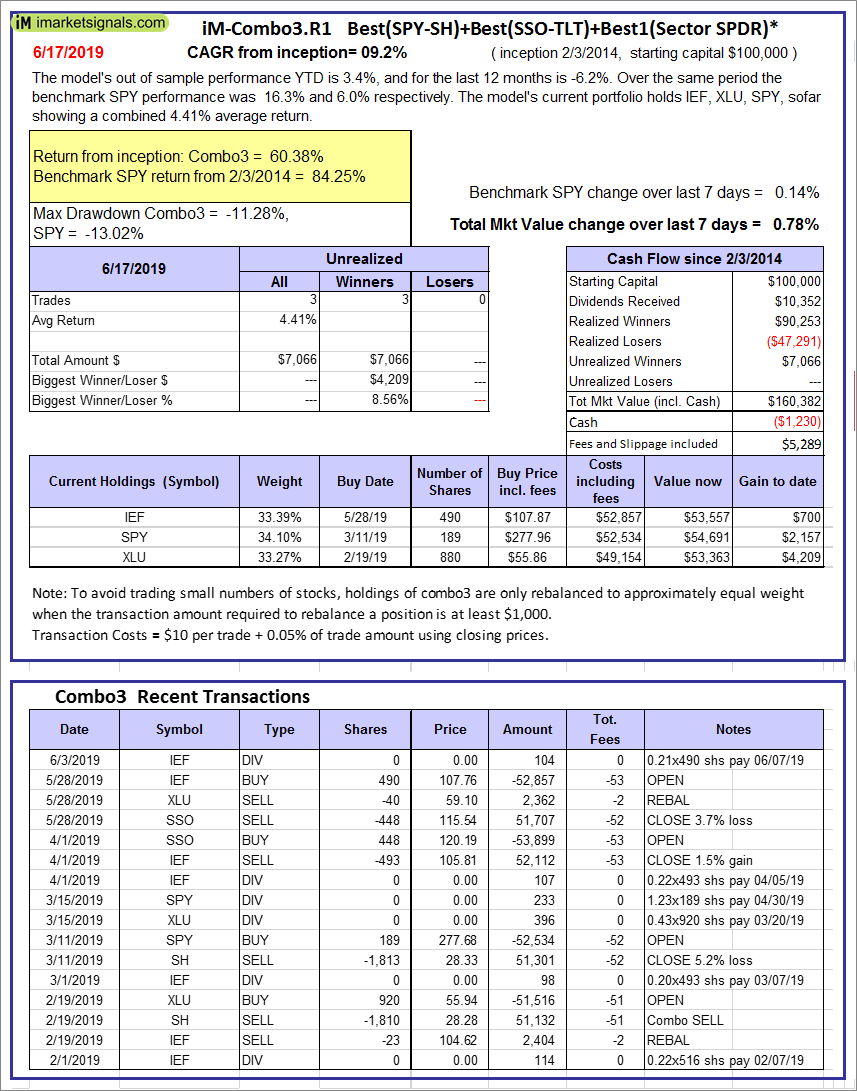 |
iM-Combo3.R1: The model’s out of sample performance YTD is 3.4%, and for the last 12 months is -6.2%. Over the same period the benchmark SPY performance was 16.3% and 6.0% respectively. Over the previous week the market value of iM-Combo3.R1 gained 0.78% at a time when SPY gained 0.14%. A starting capital of $100,000 at inception on 2/3/2014 would have grown to $160,382 which includes -$1,230 cash and excludes $5,289 spent on fees and slippage. |
 |
iM-Combo5: The model’s out of sample performance YTD is 7.7%, and for the last 12 months is -1.7%. Over the same period the benchmark SPY performance was 16.3% and 6.0% respectively. Over the previous week the market value of iM-Combo5 gained 0.63% at a time when SPY gained 0.14%. A starting capital of $100,000 at inception on 2/22/2016 would have grown to $137,103 which includes $1,253 cash and excludes $0 spent on fees and slippage. |
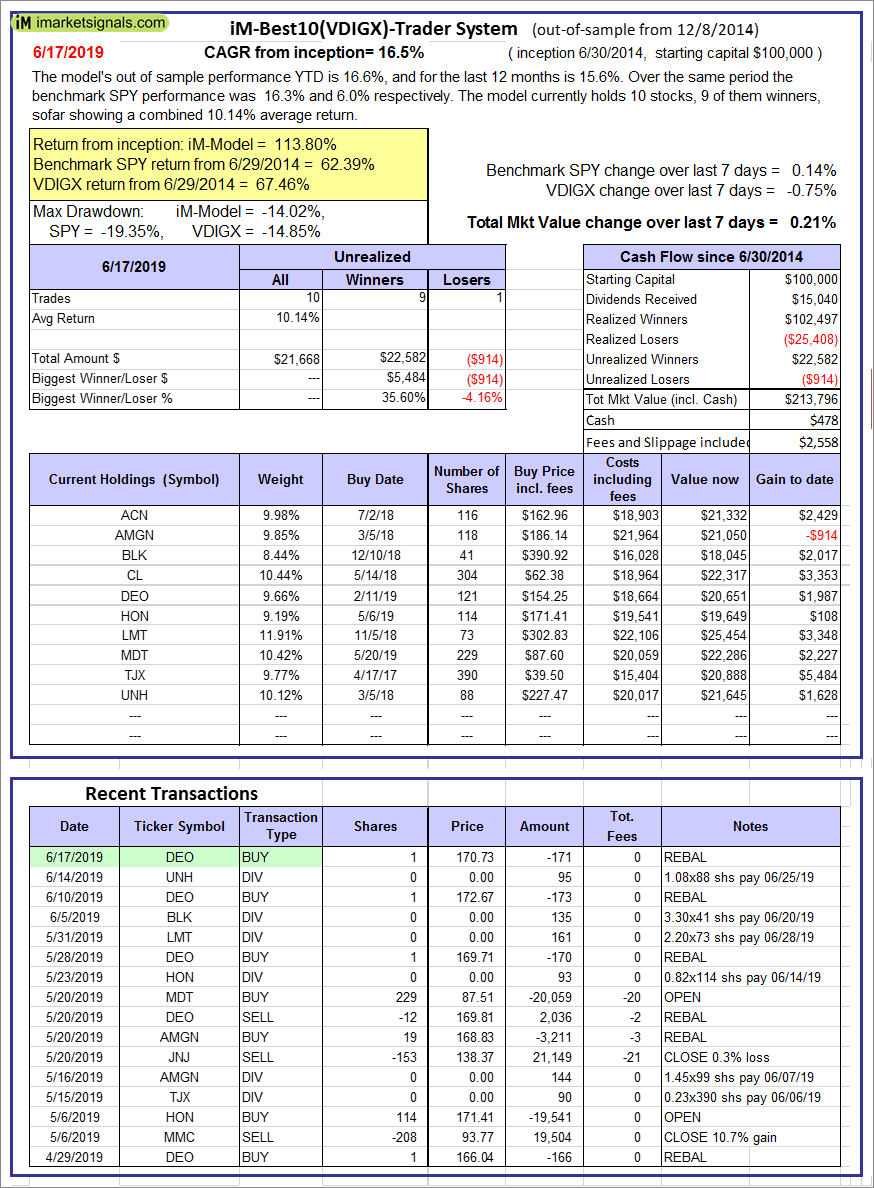 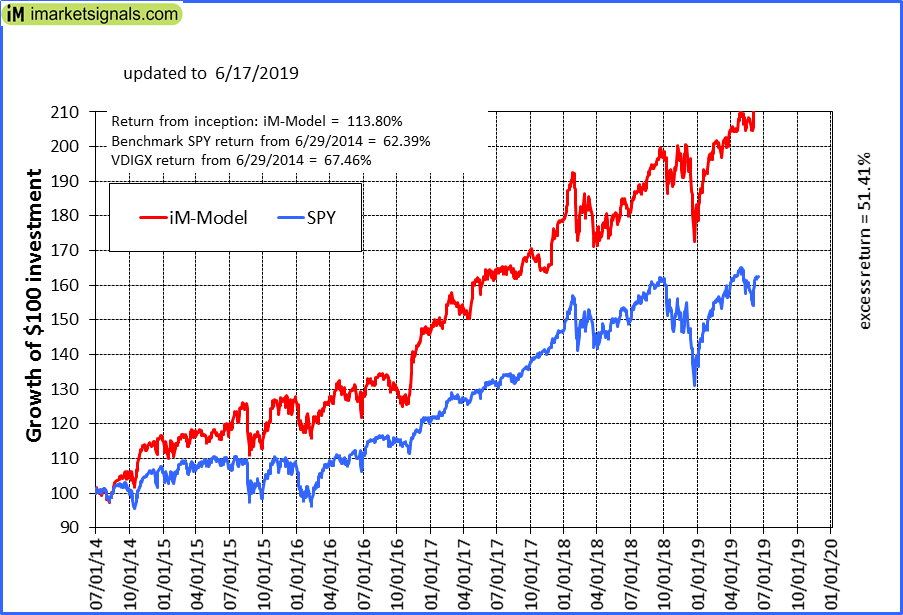 |
iM-Best10(VDIGX)-Trader: The model’s out of sample performance YTD is 16.6%, and for the last 12 months is 15.6%. Over the same period the benchmark SPY performance was 16.3% and 6.0% respectively. Since inception, on 7/1/2014, the model gained 113.80% while the benchmark SPY gained 62.39% and VDIGX gained 67.46% over the same period. Over the previous week the market value of iM-Best10(VDIGX) gained 0.21% at a time when SPY gained 0.14%. A starting capital of $100,000 at inception on 7/1/2014 would have grown to $213,796 which includes $478 cash and excludes $2,558 spent on fees and slippage. |
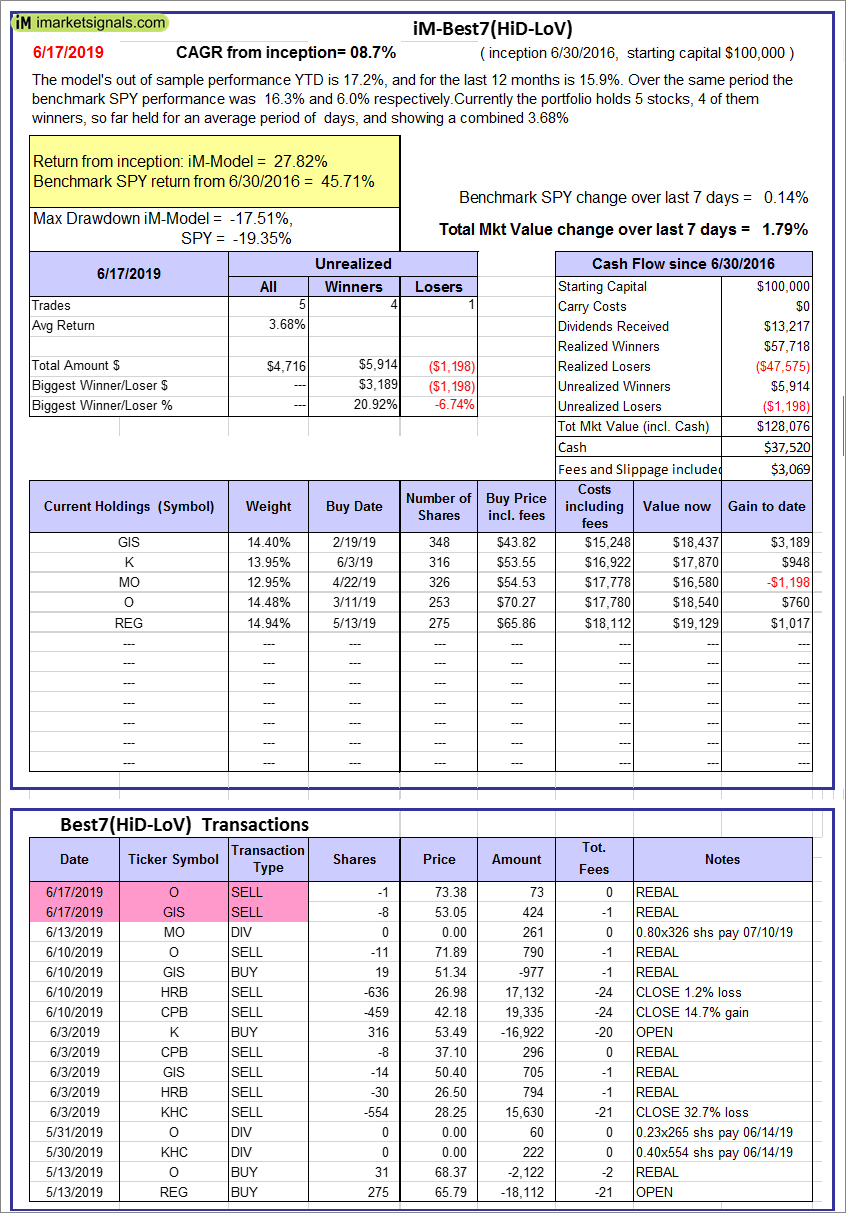 |
iM-Best7(HiD-LoV): The model’s out of sample performance YTD is 17.2%, and for the last 12 months is 15.9%. Over the same period the benchmark SPY performance was 16.3% and 6.0% respectively. Over the previous week the market value of iM-Best7(HiD-LoV) gained 1.79% at a time when SPY gained 0.14%. A starting capital of $100,000 at inception on 6/30/2016 would have grown to $128,076 which includes $37,520 cash and excludes $3,069 spent on fees and slippage. |
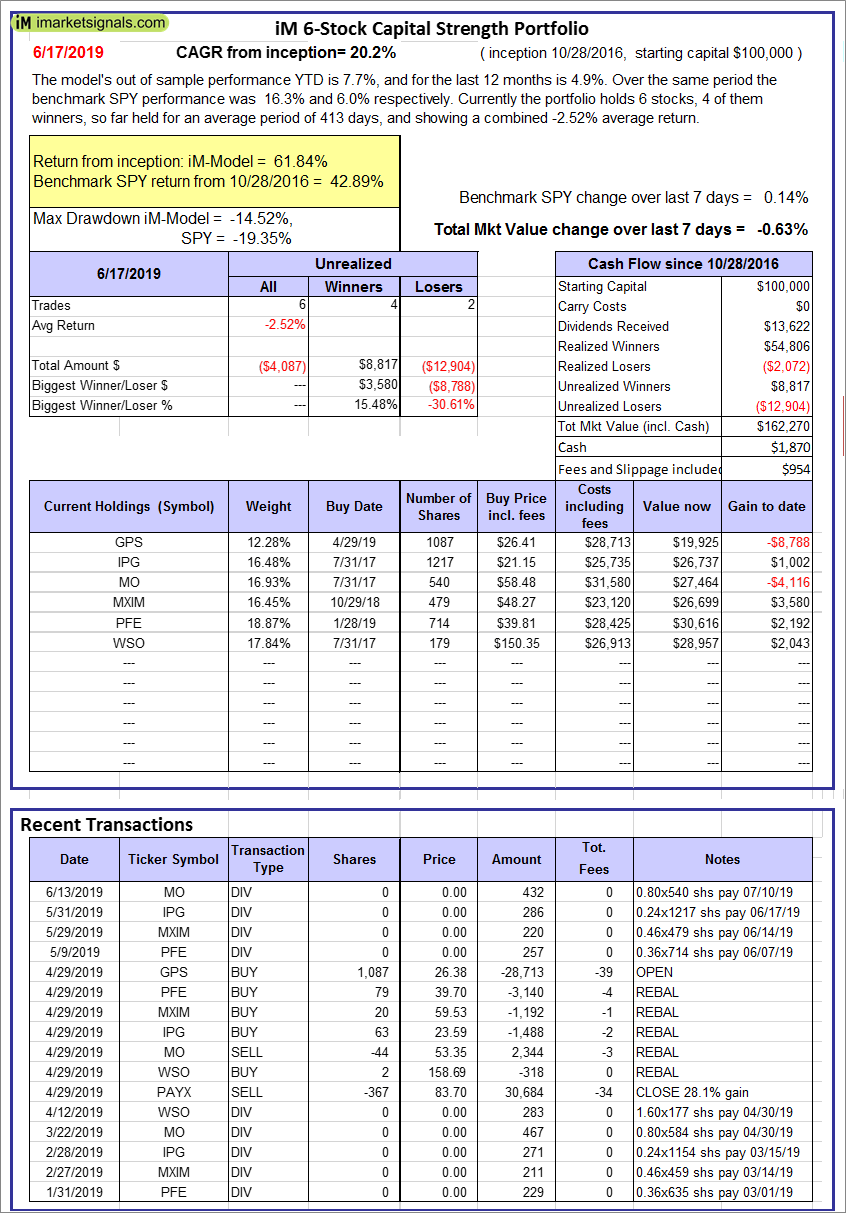 |
iM 6-Stock Capital Strength Portfolio: The model’s out of sample performance YTD is 7.7%, and for the last 12 months is 4.9%. Over the same period the benchmark SPY performance was 16.3% and 6.0% respectively. Over the previous week the market value of the iM 6-Stock Capital Strength Portfolio gained -0.63% at a time when SPY gained 0.14%. A starting capital of $100,000 at inception on 10/28/2016 would have grown to $162,270 which includes $1,870 cash and excludes $954 spent on fees and slippage. |
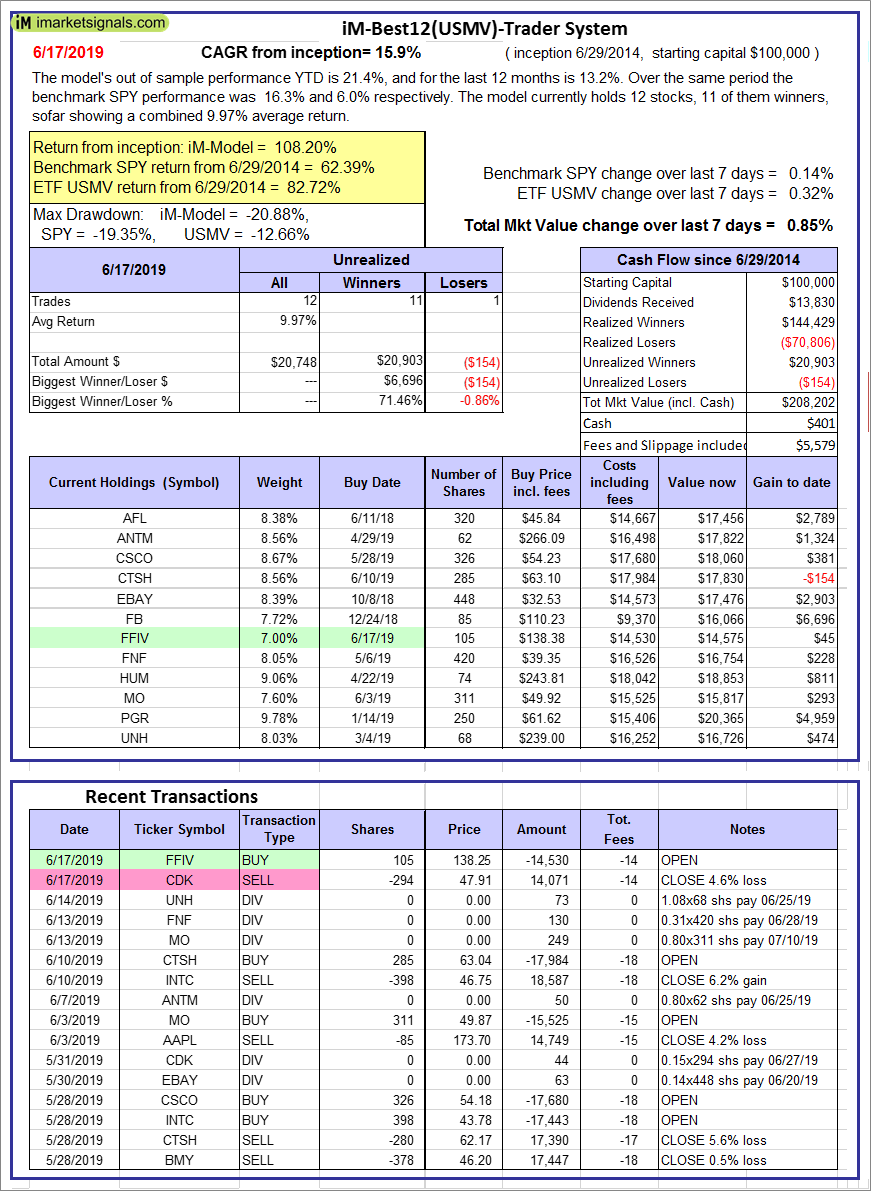  |
iM-Best12(USMV)-Trader: The model’s out of sample performance YTD is 21.4%, and for the last 12 months is 13.2%. Over the same period the benchmark SPY performance was 16.3% and 6.0% respectively. Since inception, on 6/30/2014, the model gained 108.20% while the benchmark SPY gained 62.39% and the ETF USMV gained 82.72% over the same period. Over the previous week the market value of iM-Best12(USMV)-Trader gained 0.85% at a time when SPY gained 0.14%. A starting capital of $100,000 at inception on 6/30/2014 would have grown to $208,202 which includes $401 cash and excludes $5,579 spent on fees and slippage. |
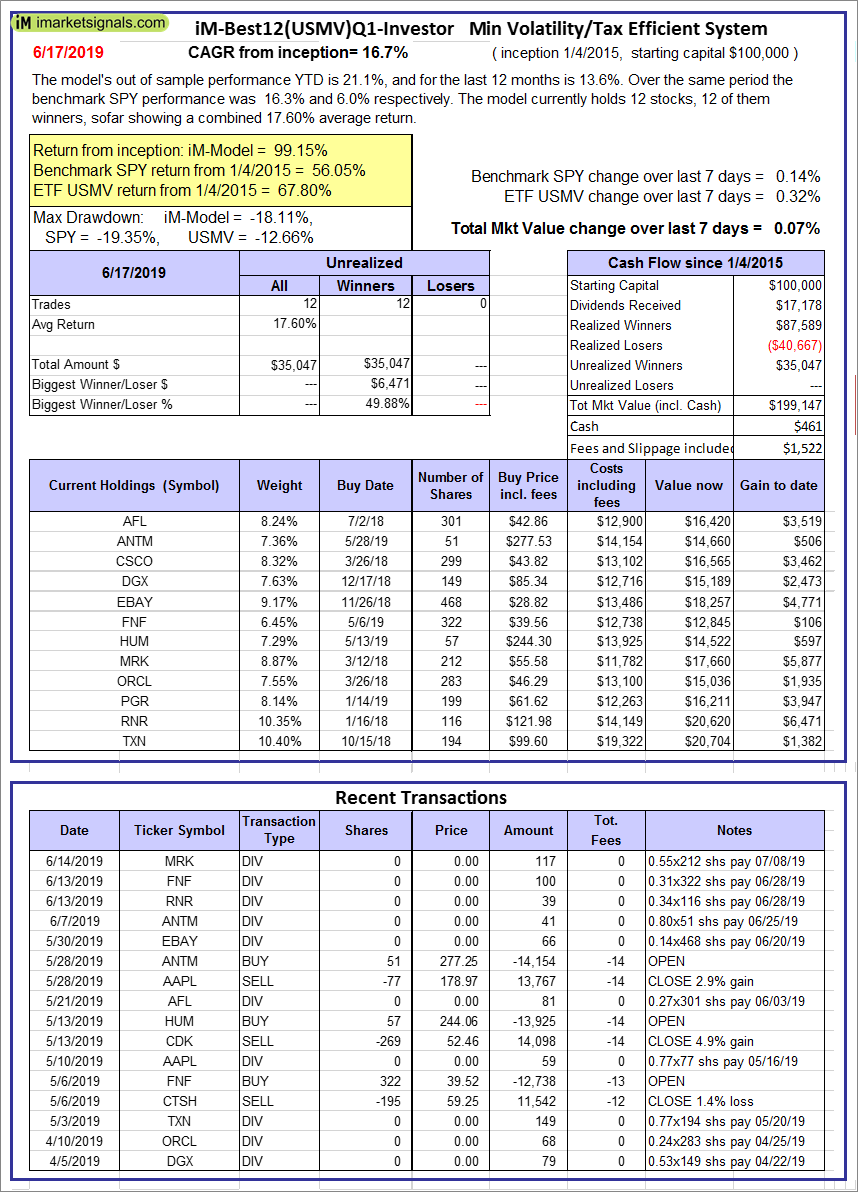 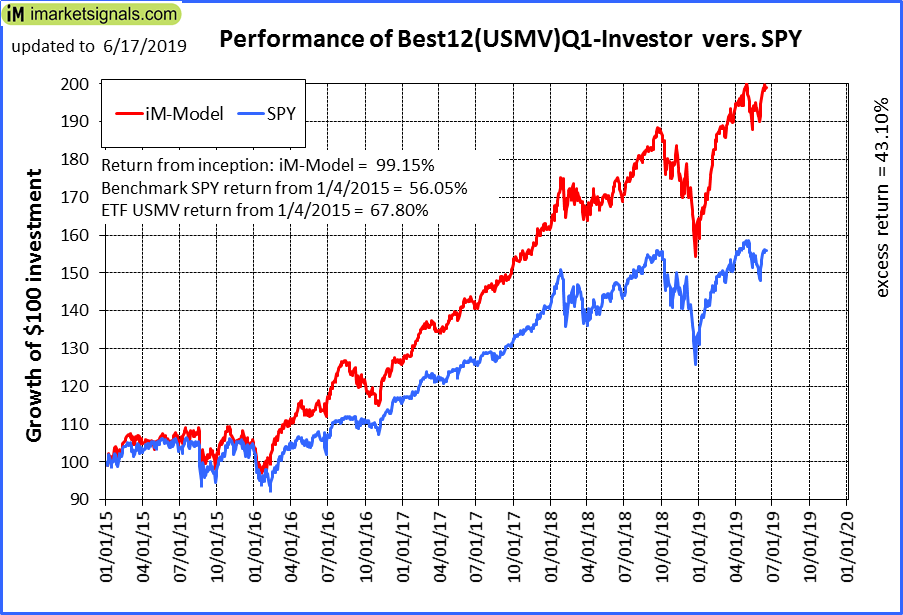 |
iM-Best12(USMV)Q1-Investor: The model’s out of sample performance YTD is 21.1%, and for the last 12 months is 13.6%. Over the same period the benchmark SPY performance was 16.3% and 6.0% respectively. Since inception, on 1/5/2015, the model gained 99.15% while the benchmark SPY gained 56.05% and the ETF USMV gained 67.80% over the same period. Over the previous week the market value of iM-Best12(USMV)Q1 gained 0.07% at a time when SPY gained 0.14%. A starting capital of $100,000 at inception on 1/5/2015 would have grown to $199,147 which includes $461 cash and excludes $1,522 spent on fees and slippage. |
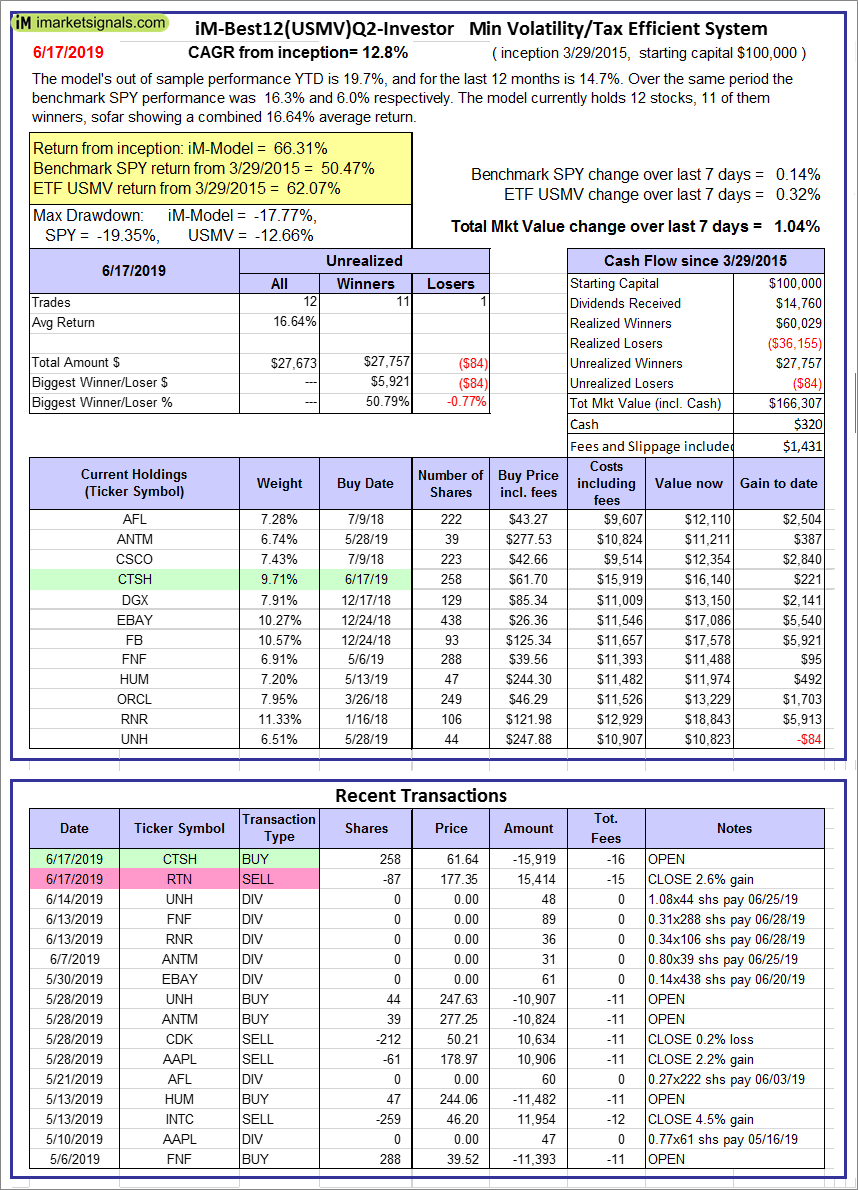 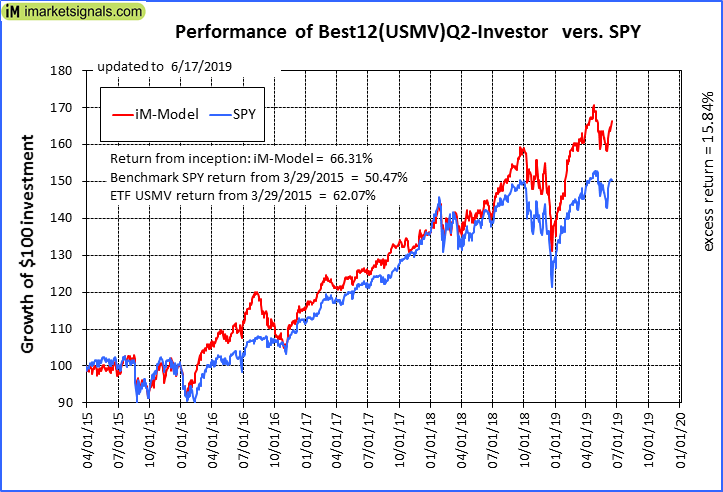 |
iM-Best12(USMV)Q2-Investor: The model’s out of sample performance YTD is 19.7%, and for the last 12 months is 14.7%. Over the same period the benchmark SPY performance was 16.3% and 6.0% respectively. Since inception, on 3/30/2015, the model gained 66.31% while the benchmark SPY gained 50.47% and the ETF USMV gained 62.07% over the same period. Over the previous week the market value of iM-Best12(USMV)Q2 gained 1.04% at a time when SPY gained 0.14%. A starting capital of $100,000 at inception on 3/30/2015 would have grown to $166,307 which includes $320 cash and excludes $1,431 spent on fees and slippage. |
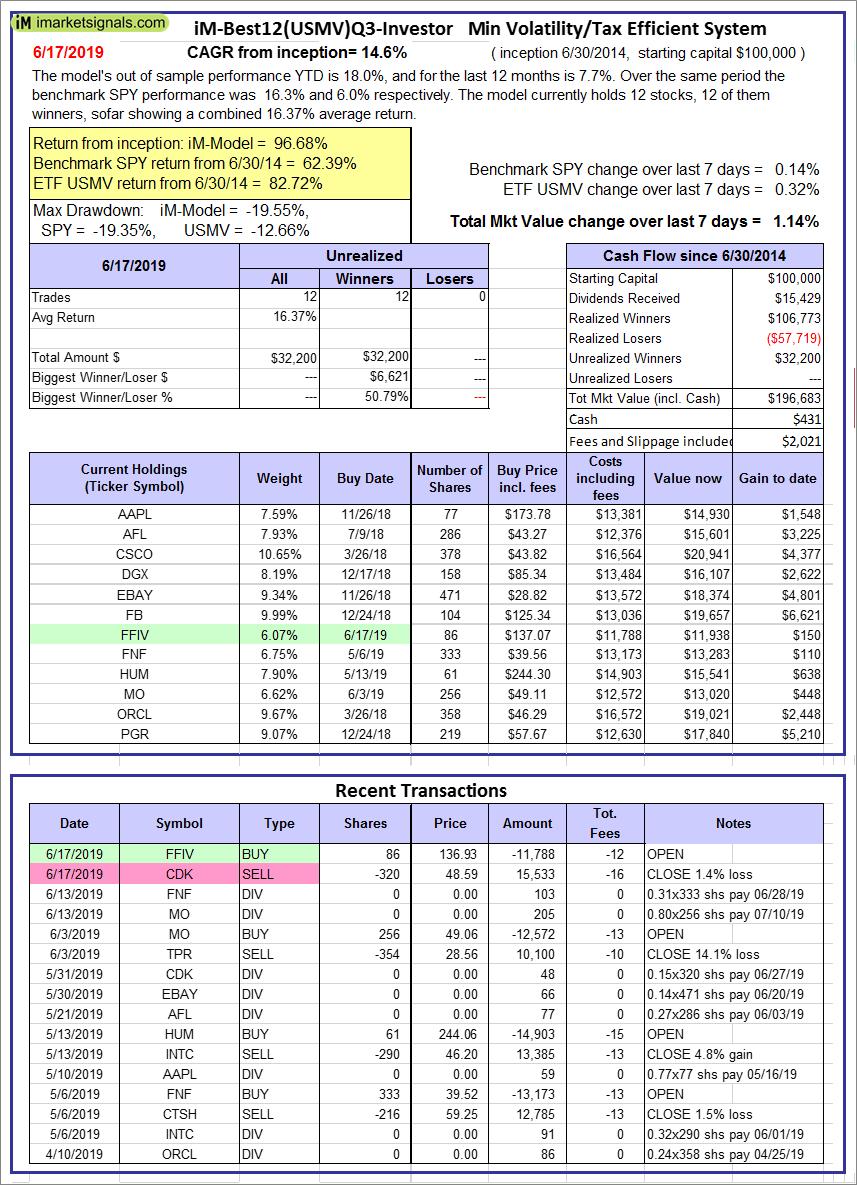 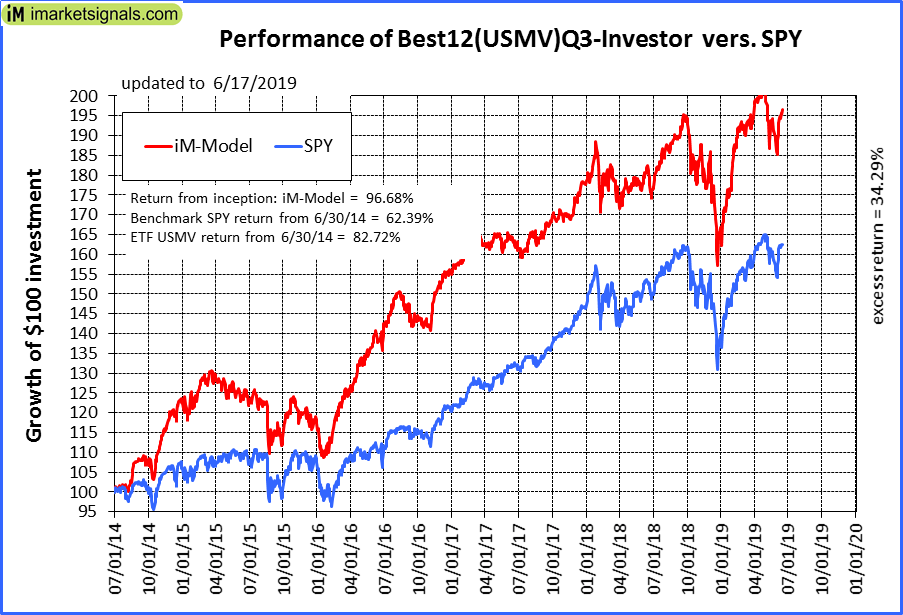 |
iM-Best12(USMV)Q3-Investor: The model’s out of sample performance YTD is 18.0%, and for the last 12 months is 7.7%. Over the same period the benchmark SPY performance was 16.3% and 6.0% respectively. Since inception, on 7/1/2014, the model gained 96.68% while the benchmark SPY gained 62.39% and the ETF USMV gained 82.72% over the same period. Over the previous week the market value of iM-Best12(USMV)Q3 gained 1.14% at a time when SPY gained 0.14%. A starting capital of $100,000 at inception on 7/1/2014 would have grown to $196,683 which includes $431 cash and excludes $2,021 spent on fees and slippage. |
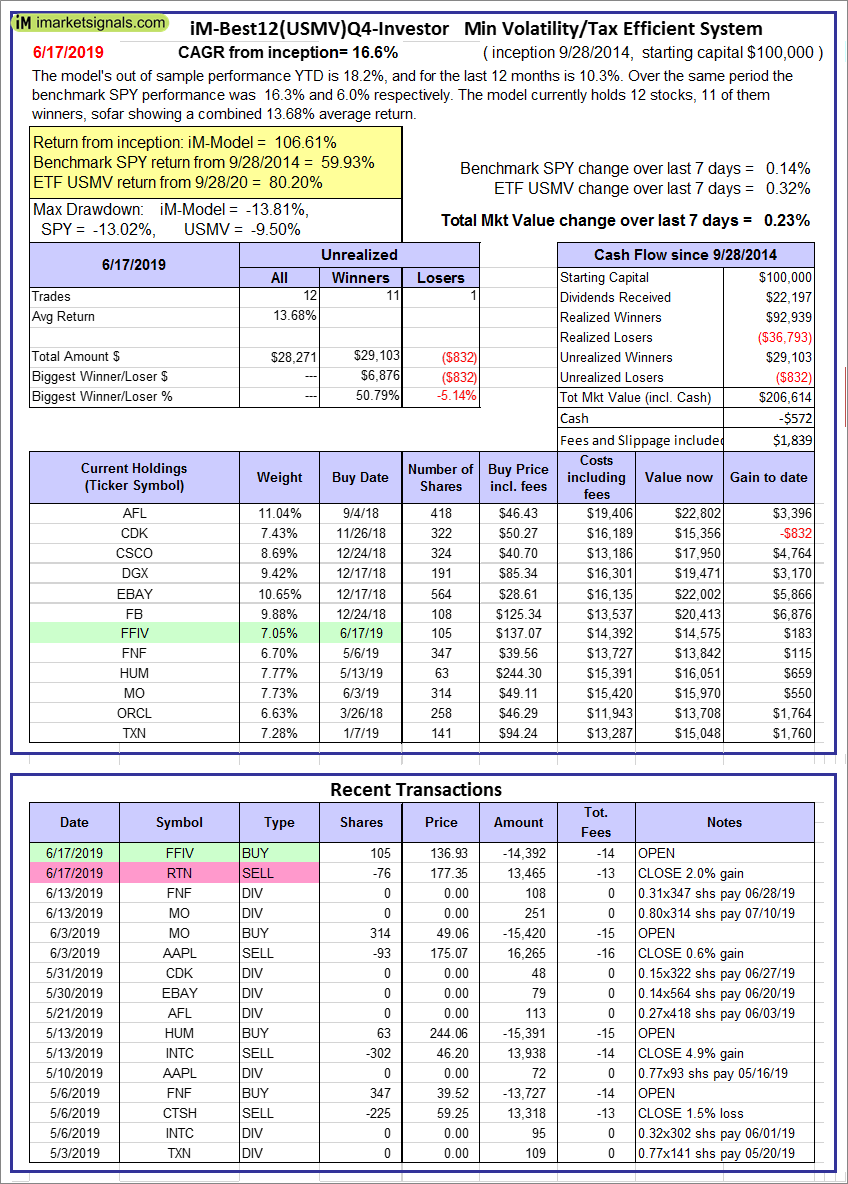  |
iM-Best12(USMV)Q4-Investor: Since inception, on 9/29/2014, the model gained 106.61% while the benchmark SPY gained 59.93% and the ETF USMV gained 80.20% over the same period. Over the previous week the market value of iM-Best12(USMV)Q4 gained 0.23% at a time when SPY gained 0.14%. A starting capital of $100,000 at inception on 9/29/2014 would have grown to $206,614 which includes -$572 cash and excludes $1,839 spent on fees and slippage. |
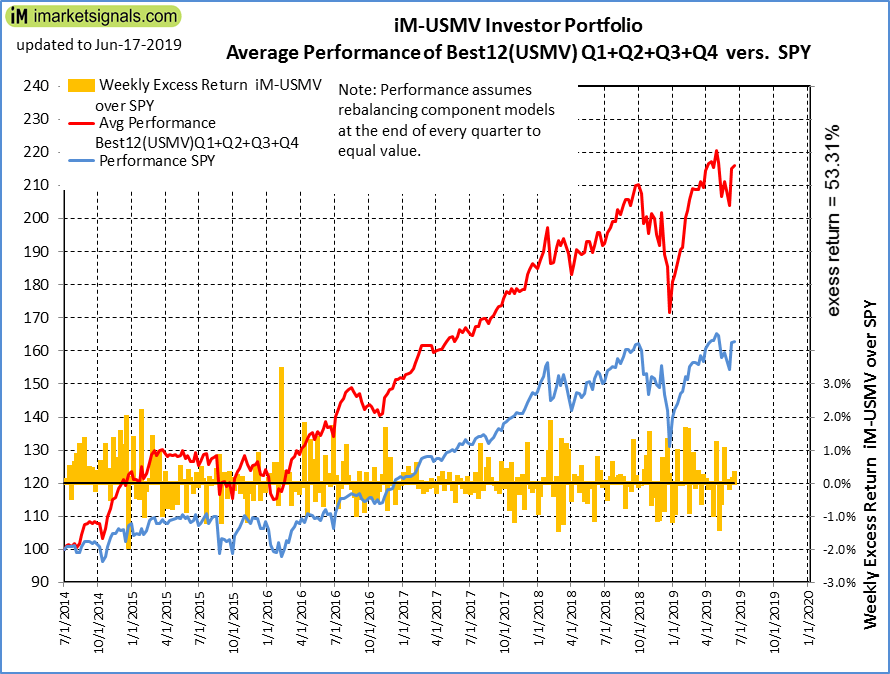 |
Average Performance of iM-Best12(USMV)Q1+Q2+Q3+Q4-Investor resulted in an excess return of 53.31% over SPY. (see iM-USMV Investor Portfolio) |
 |
iM-Best(Short): The model’s out of sample performance YTD is -11.1%, and for the last 12 months is -10.1%. Over the same period the benchmark SPY performance was 16.3% and 6.0% respectively. Over the previous week the market value of iM-Best(Short) gained -0.87% at a time when SPY gained 0.14%. Over the period 1/2/2009 to 6/17/2019 the starting capital of $100,000 would have grown to $79,147 which includes $95,178 cash and excludes $25,891 spent on fees and slippage. |
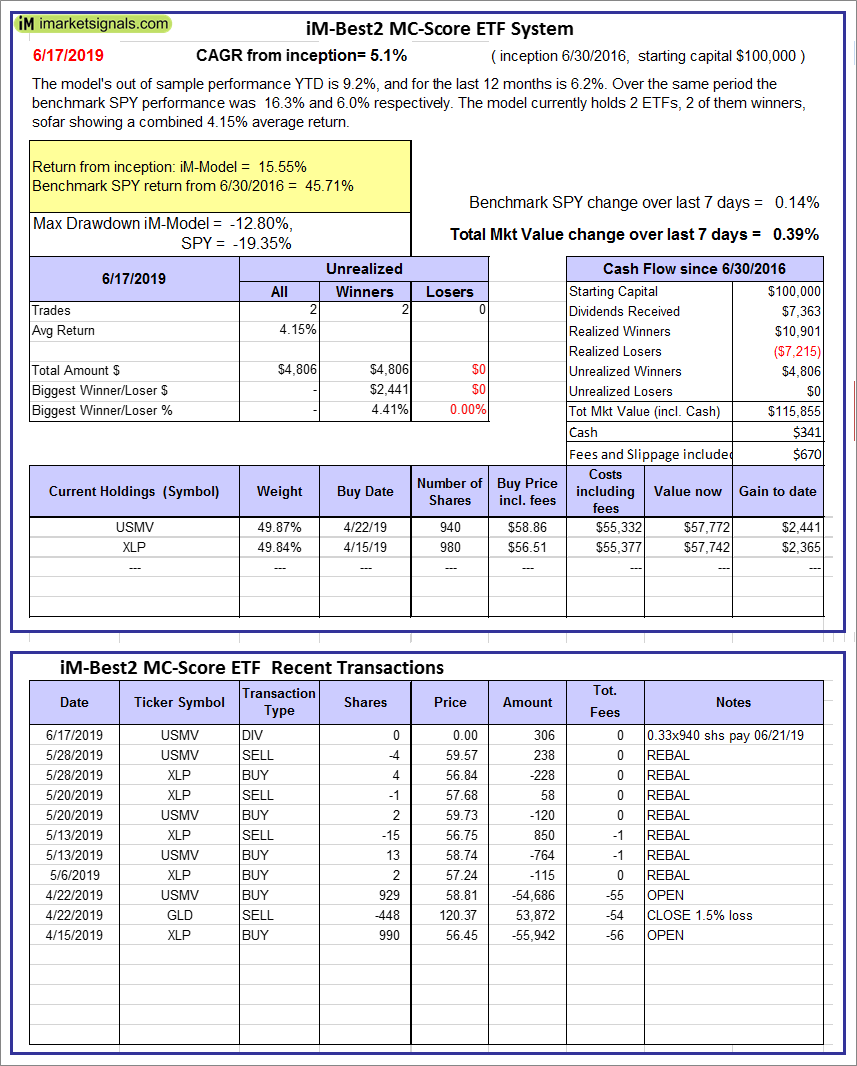 |
iM-Best2 MC-Score ETF System: The model’s out of sample performance YTD is 9.2%, and for the last 12 months is 6.2%. Over the same period the benchmark SPY performance was 16.3% and 6.0% respectively. Over the previous week the market value of the iM-Best2 MC-Score ETF System gained 0.39% at a time when SPY gained 0.14%. A starting capital of $100,000 at inception on 6/30/2016 would have grown to $115,855 which includes $341 cash and excludes $670 spent on fees and slippage. |
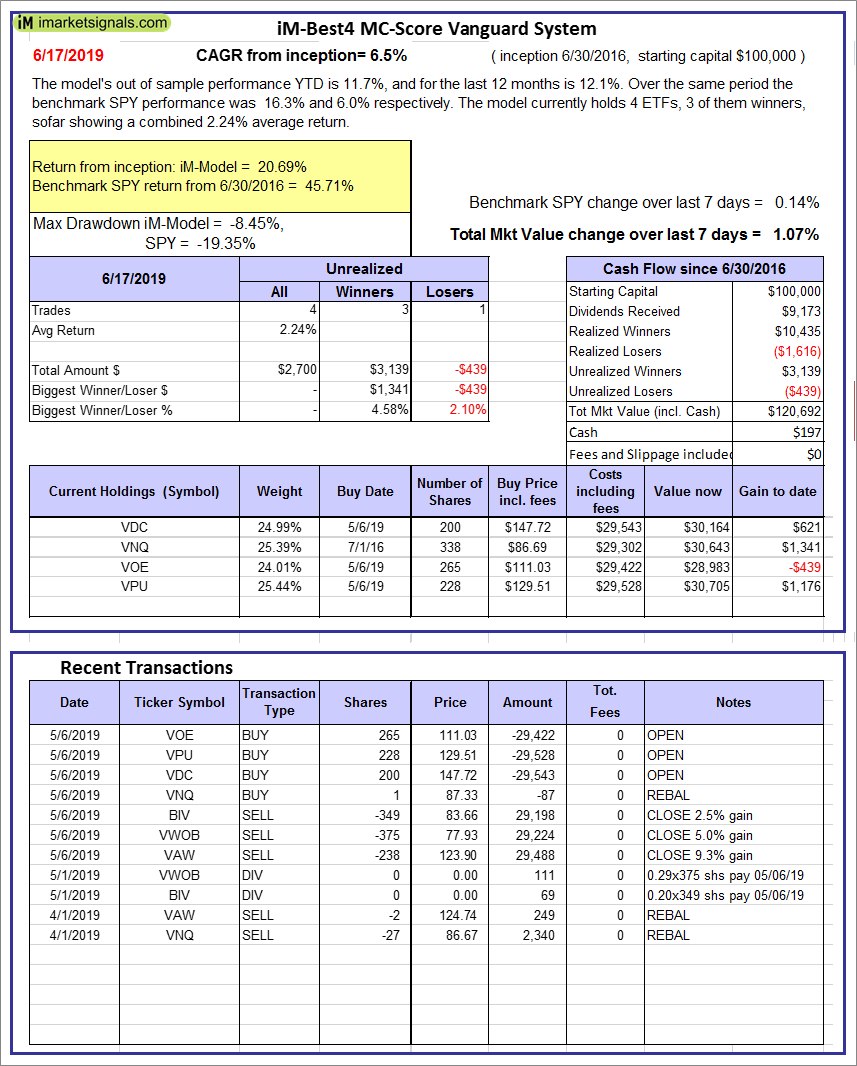 |
iM-Best4 MC-Score Vanguard System: The model’s out of sample performance YTD is 11.7%, and for the last 12 months is 12.1%. Over the same period the benchmark SPY performance was 16.3% and 6.0% respectively. Over the previous week the market value of the iM-Best4 MC-Score Vanguard System gained 1.07% at a time when SPY gained 0.14%. A starting capital of $100,000 at inception on 6/30/2016 would have grown to $120,692 which includes $197 cash and excludes $00 spent on fees and slippage. |
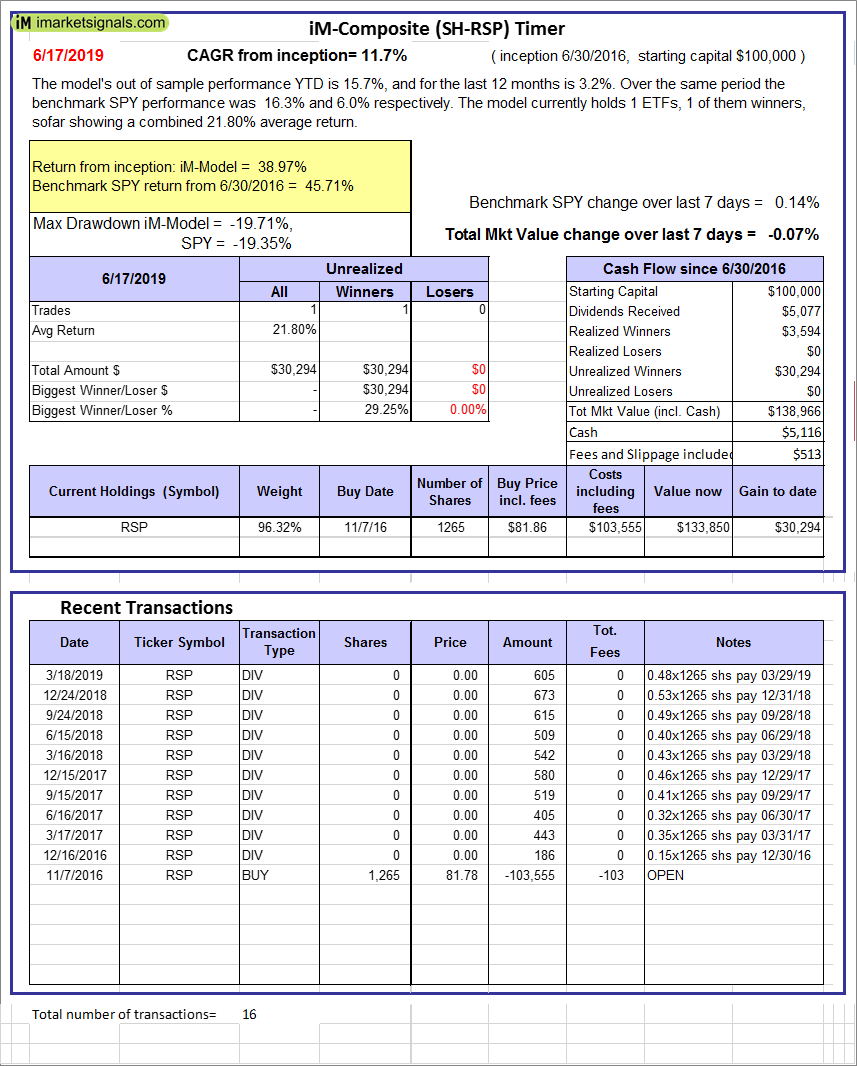 |
iM-Composite (SH-RSP) Timer: The model’s out of sample performance YTD is 15.7%, and for the last 12 months is 3.2%. Over the same period the benchmark SPY performance was 16.3% and 6.0% respectively. Over the previous week the market value of the iM-Composite (SH-RSP) Timer gained -0.07% at a time when SPY gained 0.14%. A starting capital of $100,000 at inception on 6/30/2016 would have grown to $138,966 which includes $5,116 cash and excludes $513 spent on fees and slippage. |
 |
iM-Composite (SPY-IEF) Timer: The model’s out of sample performance YTD is 8.7%, and for the last 12 months is 10.0%. Over the same period the benchmark SPY performance was 16.3% and 6.0% respectively. Over the previous week the market value of the iM-Composite (SPY-IEF) Timer gained 0.14% at a time when SPY gained 0.14%. A starting capital of $100,000 at inception on 6/30/2016 would have grown to $153,576 which includes $499 cash and excludes $2,780 spent on fees and slippage. |
 |
iM-VIX Timer with ZIV: The model’s out of sample performance YTD is 10.3%, and for the last 12 months is -10.4%. Over the same period the benchmark SPY performance was 16.3% and 6.0% respectively. Over the previous week the market value of the iM-VIX Timer with ZIV gained 0.41% at a time when SPY gained 0.14%. A starting capital of $100,000 at inception on 6/30/2016 would have grown to $199,465 which includes $1,115 cash and excludes $5,544 spent on fees and slippage. |
 |
iM-Composite(Gold-Stocks-Bond) Timer: The model’s out of sample performance YTD is 13.8%, and for the last 12 months is -1.2%. Over the same period the benchmark SPY performance was 16.3% and 6.0% respectively. Over the previous week the market value of the iM-Composite(Gold-Stocks-Bond) Timer gained 0.09% at a time when SPY gained 0.14%. A starting capital of $100,000 at inception on 6/30/2016 would have grown to $124,891 which includes $258 cash and excludes $2,889 spent on fees and slippage. |
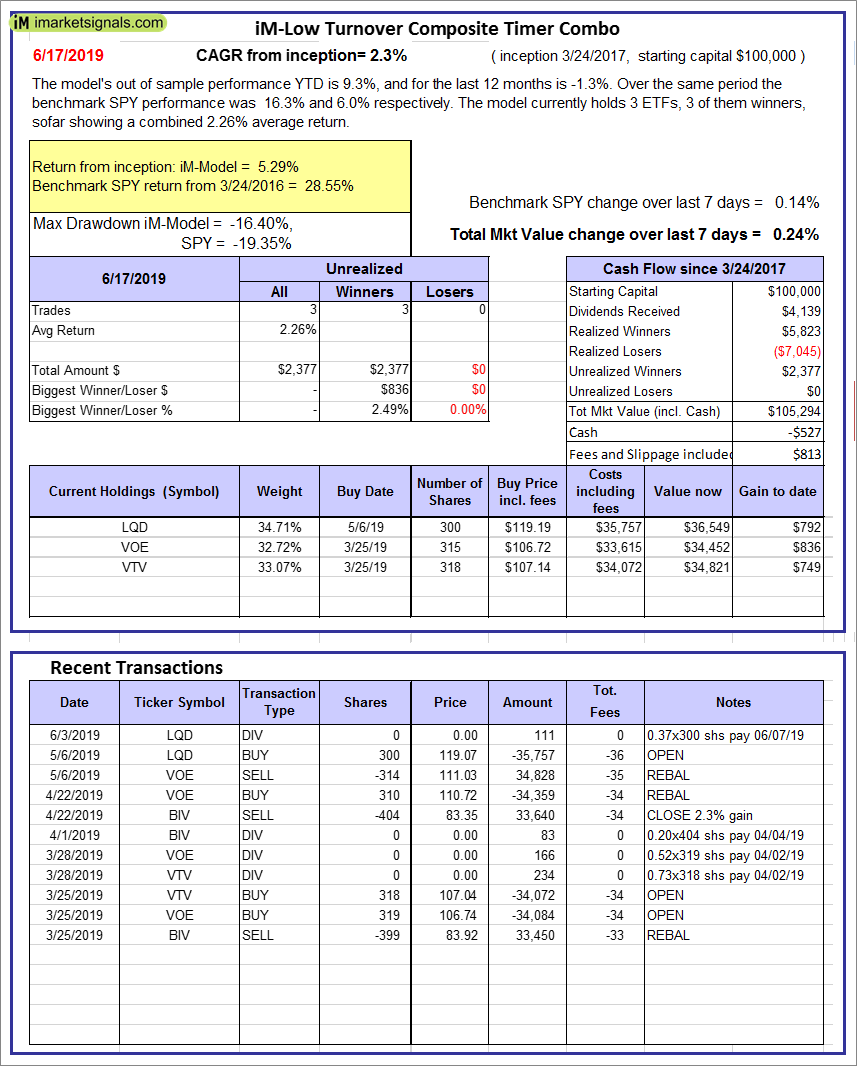 |
iM-Low Turnover Composite Timer Combo: The model’s out of sample performance YTD is 9.3%, and for the last 12 months is -1.3%. Over the same period the benchmark SPY performance was 16.3% and 6.0% respectively. Over the previous week the market value of the iM-Low Turnover Composite Timer Combo gained 0.24% at a time when SPY gained 0.14%. A starting capital of $100,000 at inception on 3/24/27 would have grown to $105,294 which includes -$527 cash and excludes $813 spent on fees and slippage. |
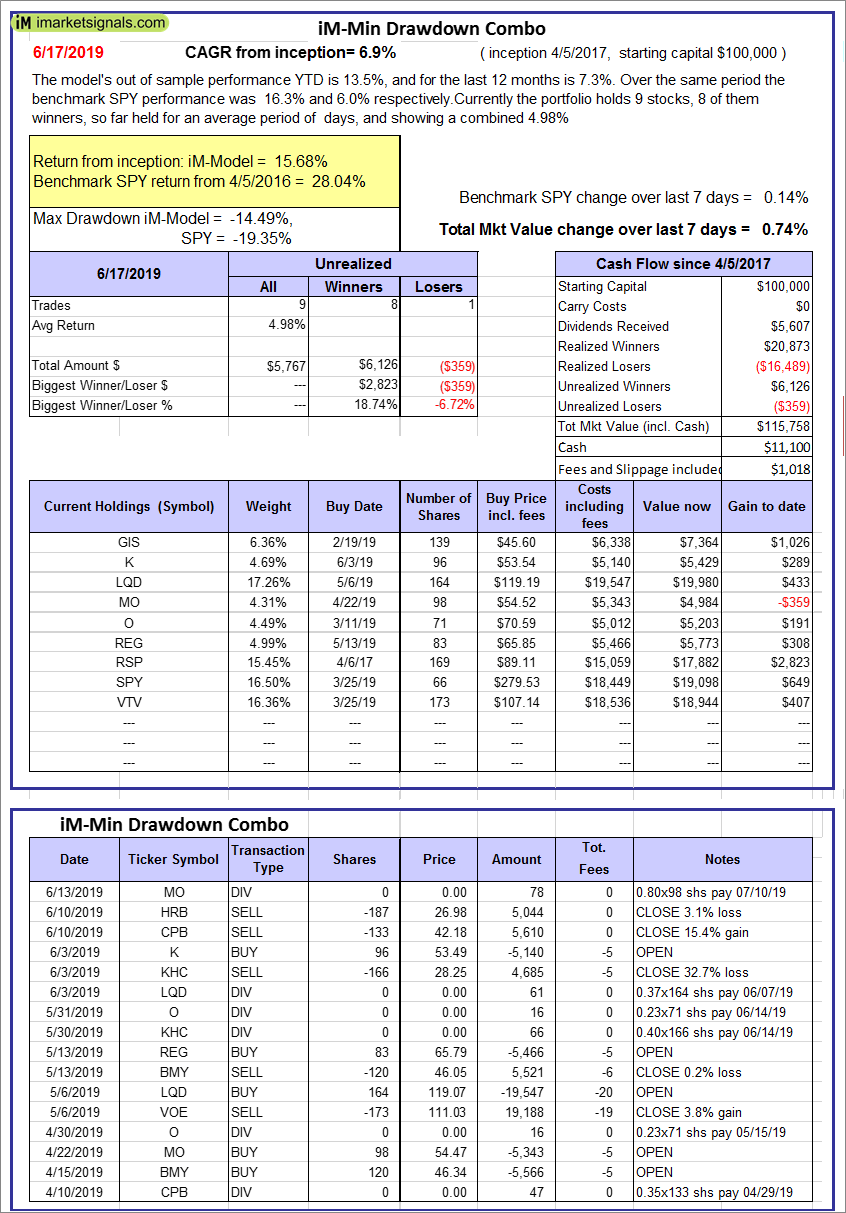 |
iM-Min Drawdown Combo: The model’s out of sample performance YTD is 13.5%, and for the last 12 months is 7.3%. Over the same period the benchmark SPY performance was 16.3% and 6.0% respectively. Over the previous week the market value of the iM-Min Drawdown Combo gained 0.74% at a time when SPY gained 0.14%. A starting capital of $100,000 at inception on 4/5/2017 would have grown to $115,758 which includes $11,100 cash and excludes $1,018 spent on fees and slippage. |
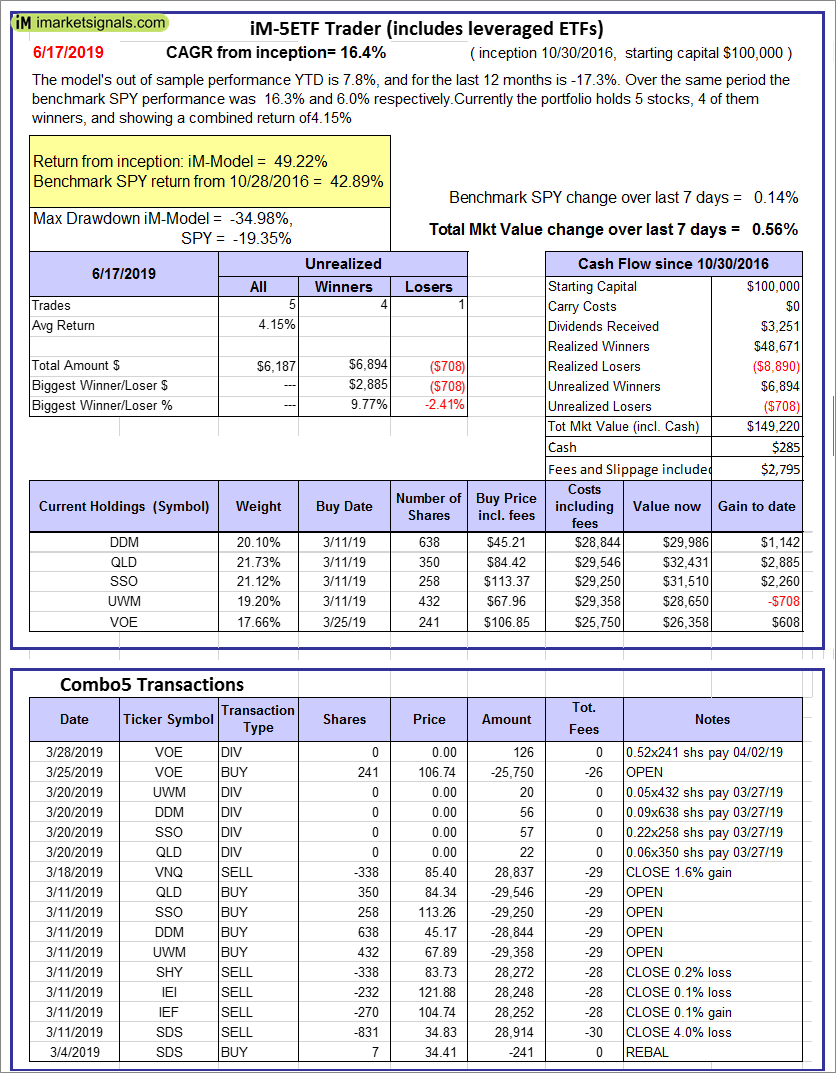 |
iM-5ETF Trader (includes leveraged ETFs): The model’s out of sample performance YTD is 7.8%, and for the last 12 months is -17.3%. Over the same period the benchmark SPY performance was 16.3% and 6.0% respectively. Over the previous week the market value of the iM-5ETF Trader (includes leveraged ETFs) gained 0.56% at a time when SPY gained 0.14%. A starting capital of $100,000 at inception on 10/30/2016 would have grown to $149,220 which includes $285 cash and excludes $2,795 spent on fees and slippage. |
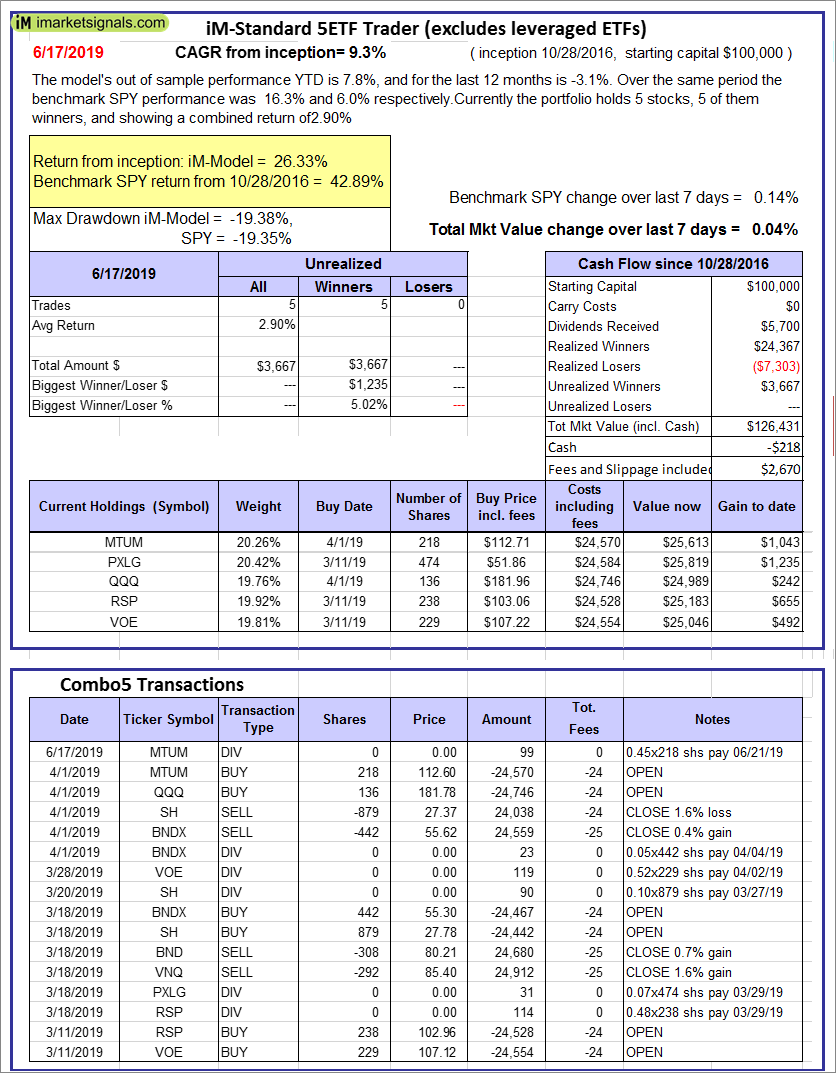 |
iM-Standard 5ETF Trader (excludes leveraged ETFs): The model’s out of sample performance YTD is 7.8%, and for the last 12 months is -3.1%. Over the same period the benchmark SPY performance was 16.3% and 6.0% respectively. Over the previous week the market value of the iM-Standard 5ETF Trader (excludes leveraged ETFs) gained 0.04% at a time when SPY gained 0.14%. A starting capital of $100,000 at inception on 10/30/2016 would have grown to $126,431 which includes -$218 cash and excludes $2,670 spent on fees and slippage. |
iM-Best Reports – 6/17/2019
Posted in pmp SPY-SH
Leave a Reply
You must be logged in to post a comment.