  |
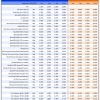
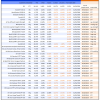
Out of sample performance summary of our models for the past 1, 2, 4 and 13 week periods. The active active return indicates how the models over- or underperformed the benchmark ETF SPY. Also the YTD, and the 1-, 3-, 5- and 10-year annualized returns are shown in the second table |
|
|
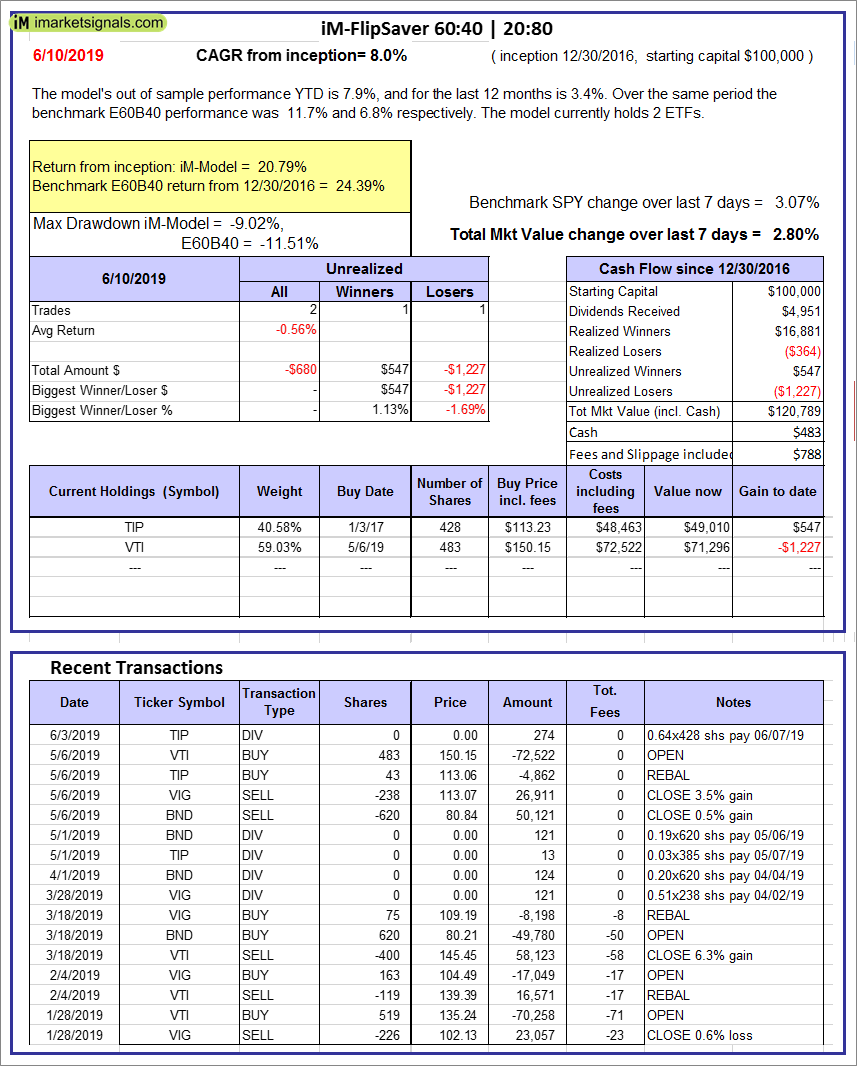
iM-FlipSaver 60:40 | 20:80 – 2017: The model’s out of sample performance YTD is 7.9%, and for the last 12 months is 3.4%. Over the same period the benchmark E60B40 performance was 11.7% and 6.8% respectively. Over the previous week the market value of iM-FlipSaver 80:20 | 20:80 gained 2.80% at a time when SPY gained 3.07%. A starting capital of $100,000 at inception on 7/16/2015 would have grown to $120,789 which includes $483 cash and excludes $788 spent on fees and slippage. |
|
|
iM-FlipSaver 70:30 | 20:80 – 2017: The model’s out of sample performance YTD is 8.0%, and for the last 12 months is 3.1%. Over the same period the benchmark E60B40 performance was 11.7% and 6.8% respectively. Over the previous week the market value of iM-FlipSaver 70:30 | 20:80 gained 3.38% at a time when SPY gained 3.07%. A starting capital of $100,000 at inception on 7/15/2015 would have grown to $123,108 which includes $426 cash and excludes $909 spent on fees and slippage. |
|
|
iM-FlipSaver 80:20 | 20:80 – 2017: The model’s out of sample performance YTD is 8.2%, and for the last 12 months is 2.8%. Over the same period the benchmark E60B40 performance was 11.7% and 6.8% respectively. Over the previous week the market value of iM-FlipSaver 80:20 | 20:80 gained 3.95% at a time when SPY gained 3.07%. A starting capital of $100,000 at inception on 1/2/2017 would have grown to $125,404 which includes $461 cash and excludes $1,024 spent on fees and slippage. |
|
|
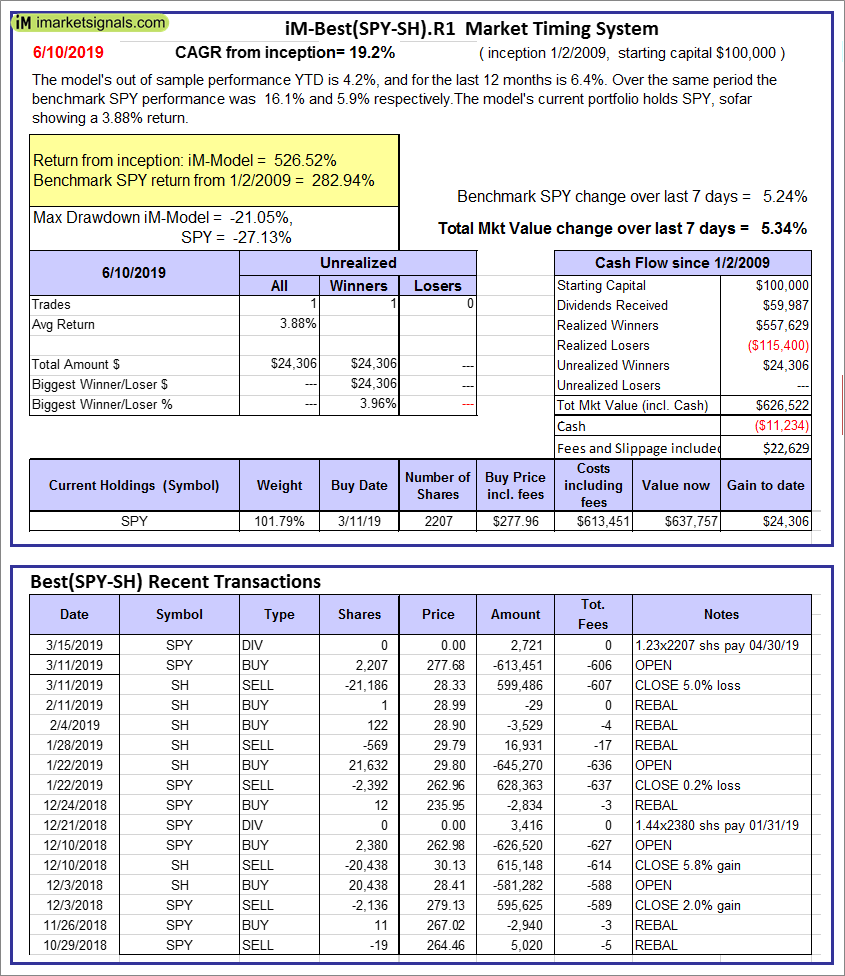
iM-Best(SPY-SH).R1: The model’s out of sample performance YTD is 4.2%, and for the last 12 months is 6.4%. Over the same period the benchmark SPY performance was 16.1% and 5.9% respectively. Over the previous week the market value of Best(SPY-SH) gained 5.34% at a time when SPY gained 5.24%. A starting capital of $100,000 at inception on 1/2/2009 would have grown to $626,522 which includes -$11,234 cash and excludes $22,629 spent on fees and slippage. |
|
|
iM-Combo3.R1: The model’s out of sample performance YTD is 2.6%, and for the last 12 months is -6.8%. Over the same period the benchmark SPY performance was 16.1% and 5.9% respectively. Over the previous week the market value of iM-Combo3.R1 gained 2.04% at a time when SPY gained 5.24%. A starting capital of $100,000 at inception on 2/3/2014 would have grown to $159,133 which includes -$1,230 cash and excludes $5,289 spent on fees and slippage. |
|
|
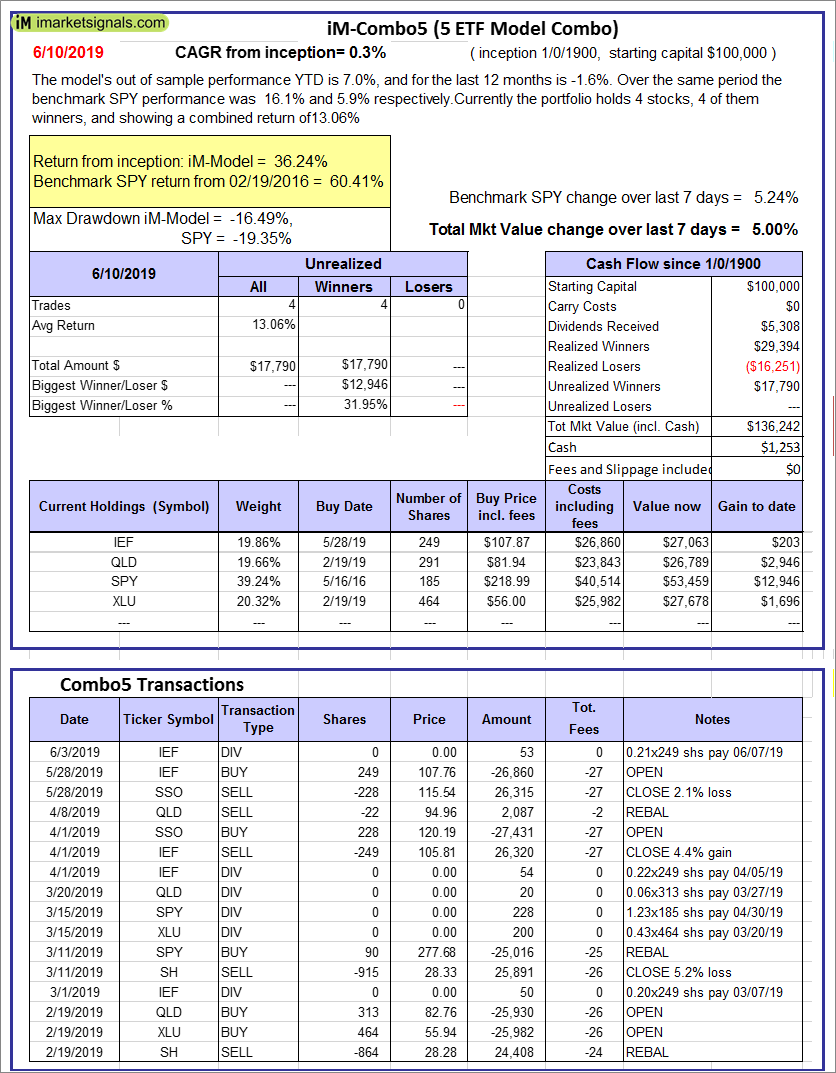
iM-Combo5: The model’s out of sample performance YTD is 7.0%, and for the last 12 months is -1.6%. Over the same period the benchmark SPY performance was 16.1% and 5.9% respectively. Over the previous week the market value of iM-Combo5 gained 5.00% at a time when SPY gained 5.24%. A starting capital of $100,000 at inception on 2/22/2016 would have grown to $136,242 which includes $1,253 cash and excludes $0 spent on fees and slippage. |
|
|
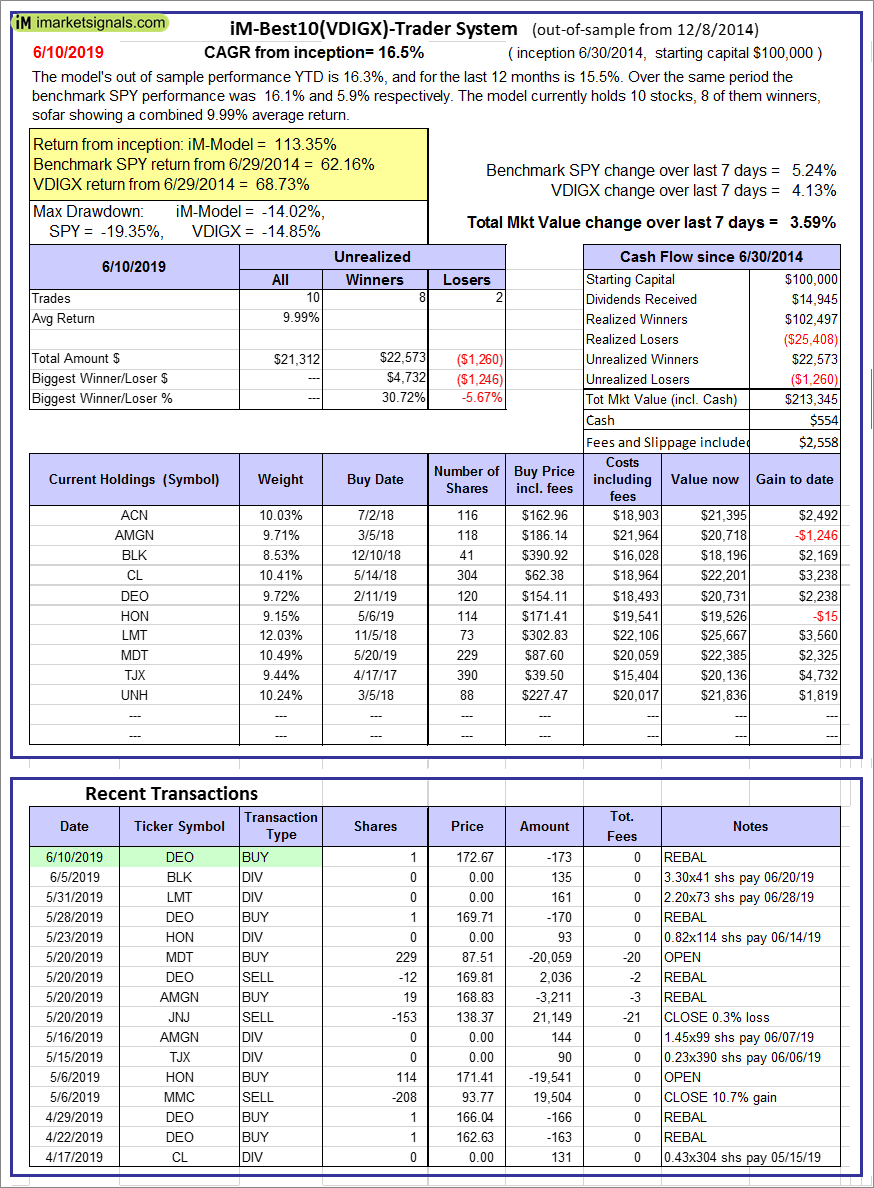
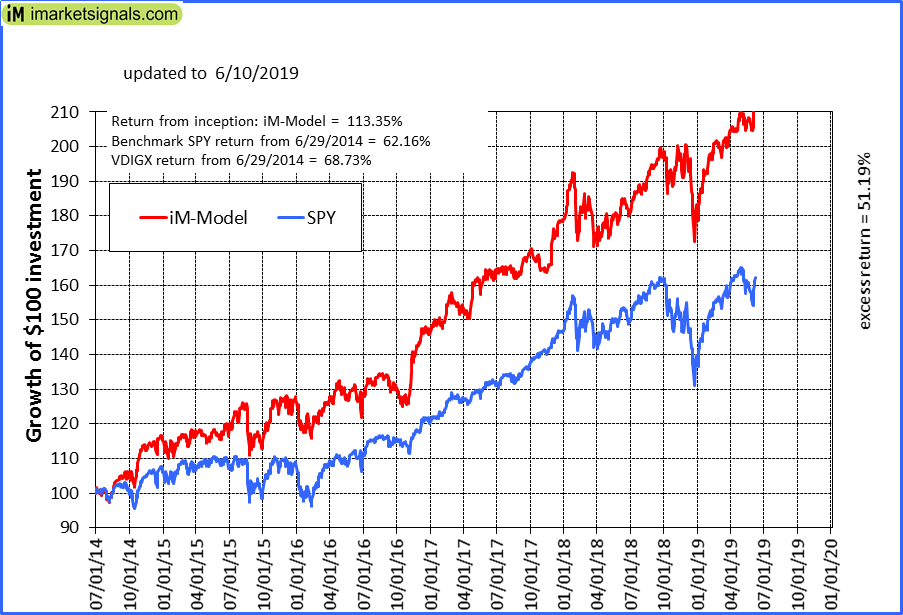
iM-Best10(VDIGX)-Trader: The model’s out of sample performance YTD is 16.3%, and for the last 12 months is 15.5%. Over the same period the benchmark SPY performance was 16.1% and 5.9% respectively. Since inception, on 7/1/2014, the model gained 113.35% while the benchmark SPY gained 62.16% and VDIGX gained 68.73% over the same period. Over the previous week the market value of iM-Best10(VDIGX) gained 3.59% at a time when SPY gained 5.24%. A starting capital of $100,000 at inception on 7/1/2014 would have grown to $213,345 which includes $554 cash and excludes $2,558 spent on fees and slippage. |
|
|
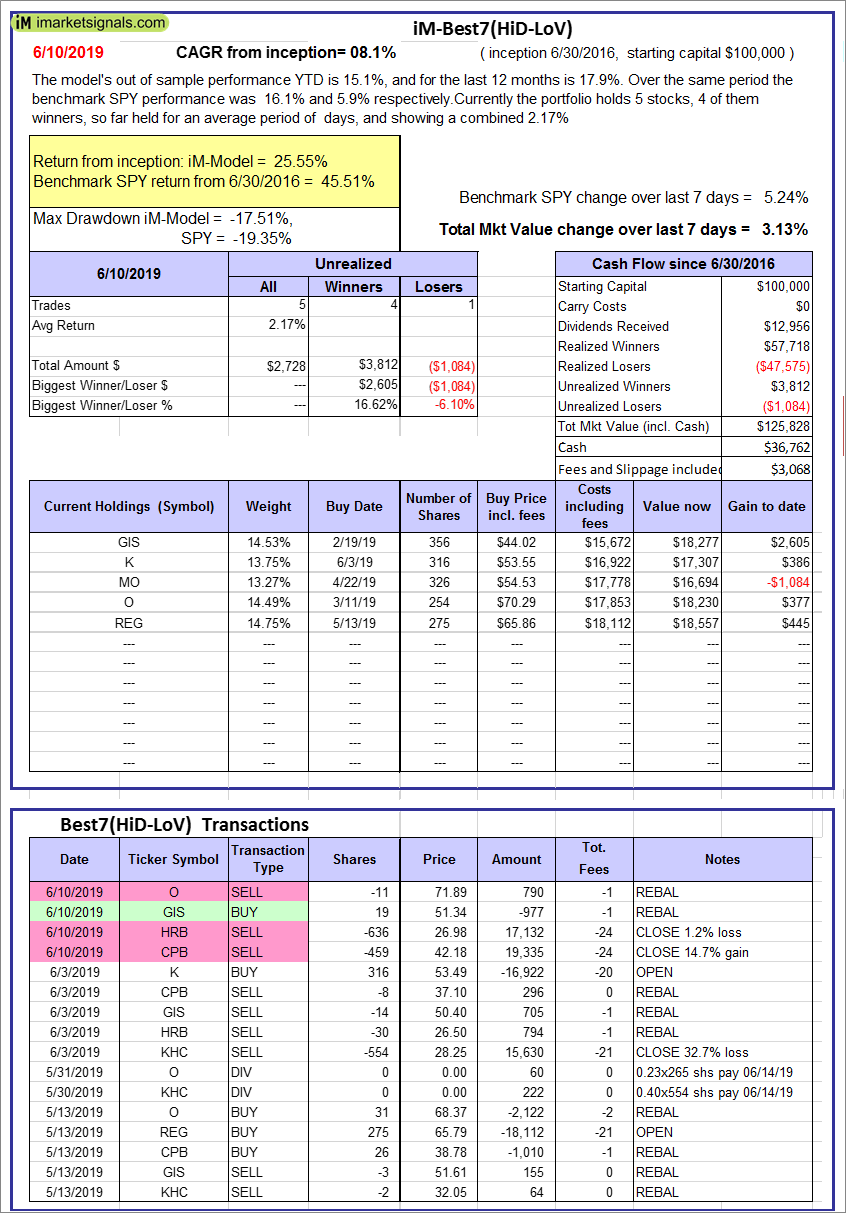
iM-Best7(HiD-LoV): The model’s out of sample performance YTD is 15.1%, and for the last 12 months is 17.9%. Over the same period the benchmark SPY performance was 16.1% and 5.9% respectively. Over the previous week the market value of iM-Best7(HiD-LoV) gained 3.13% at a time when SPY gained 5.24%. A starting capital of $100,000 at inception on 6/30/2016 would have grown to $125,828 which includes $36,762 cash and excludes $3,068 spent on fees and slippage. |
|
|
iM 6-Stock Capital Strength Portfolio: The model’s out of sample performance YTD is 8.4%, and for the last 12 months is 6.4%. Over the same period the benchmark SPY performance was 16.1% and 5.9% respectively. Over the previous week the market value of the iM 6-Stock Capital Strength Portfolio gained 2.53% at a time when SPY gained 5.24%. A starting capital of $100,000 at inception on 10/28/2016 would have grown to $163,299 which includes $1,438 cash and excludes $954 spent on fees and slippage. |
|
|
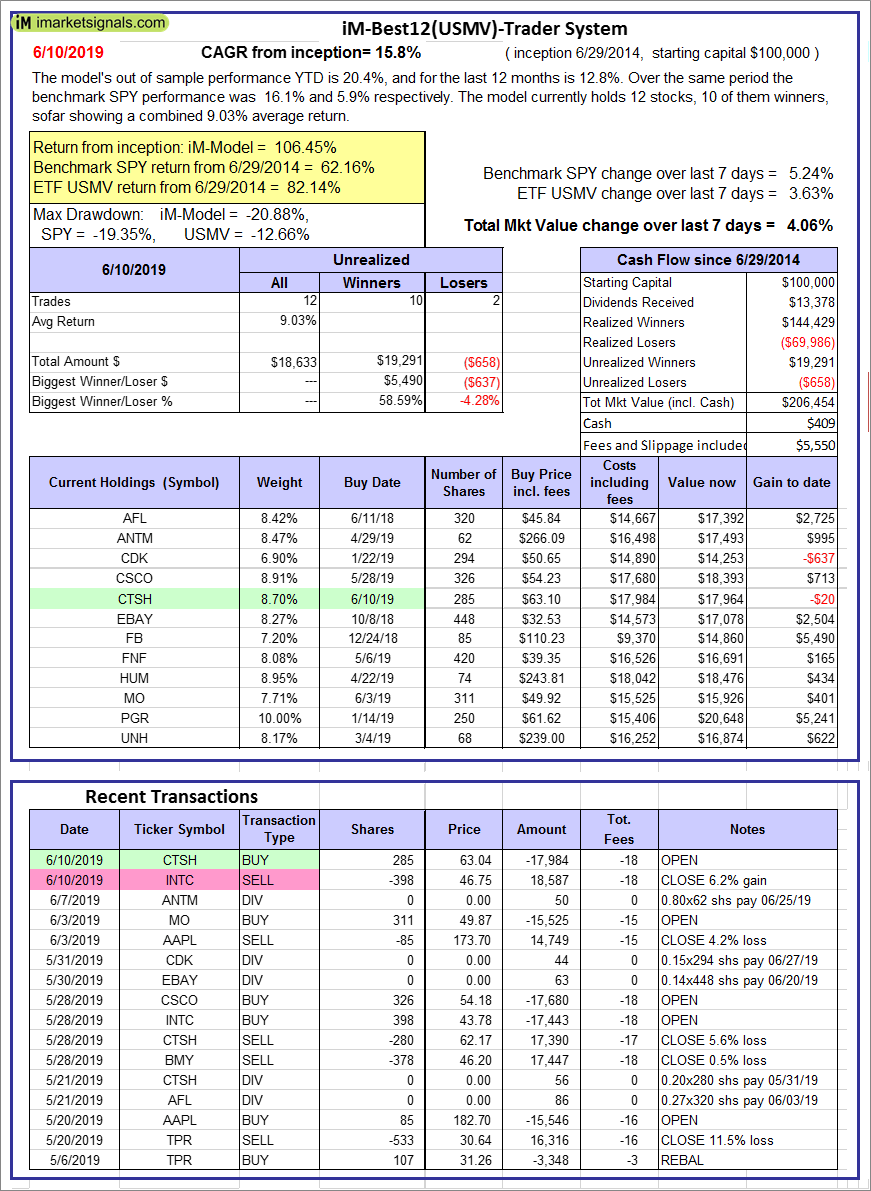
iM-Best12(USMV)-Trader: The model’s out of sample performance YTD is 20.4%, and for the last 12 months is 12.8%. Over the same period the benchmark SPY performance was 16.1% and 5.9% respectively. Since inception, on 6/30/2014, the model gained 106.45% while the benchmark SPY gained 62.16% and the ETF USMV gained 82.14% over the same period. Over the previous week the market value of iM-Best12(USMV)-Trader gained 4.06% at a time when SPY gained 5.24%. A starting capital of $100,000 at inception on 6/30/2014 would have grown to $206,454 which includes $409 cash and excludes $5,550 spent on fees and slippage. |
|
|
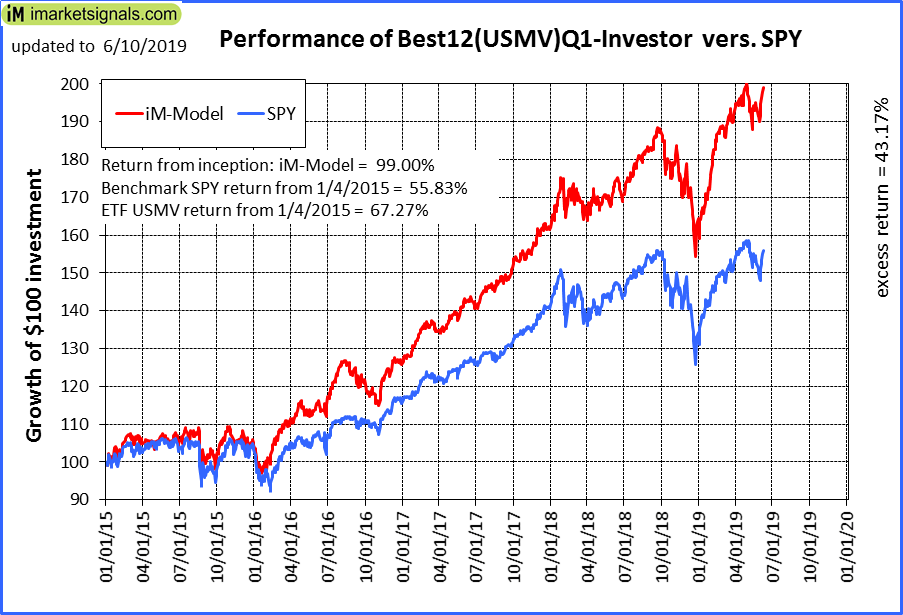
iM-Best12(USMV)Q1-Investor: The model’s out of sample performance YTD is 21.1%, and for the last 12 months is 14.3%. Over the same period the benchmark SPY performance was 16.1% and 5.9% respectively. Since inception, on 1/5/2015, the model gained 99.00% while the benchmark SPY gained 55.83% and the ETF USMV gained 67.27% over the same period. Over the previous week the market value of iM-Best12(USMV)Q1 gained 3.79% at a time when SPY gained 5.24%. A starting capital of $100,000 at inception on 1/5/2015 would have grown to $199,001 which includes $205 cash and excludes $1,522 spent on fees and slippage. |
|
|
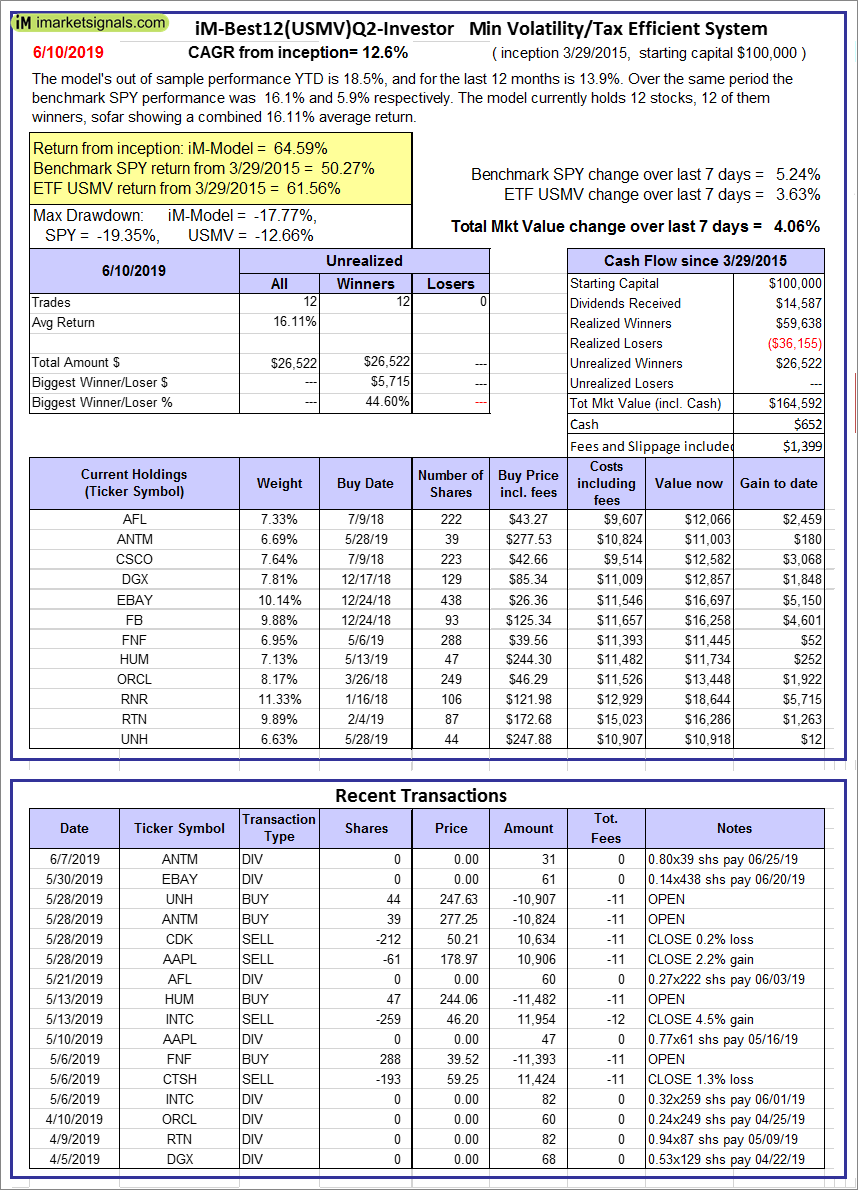
iM-Best12(USMV)Q2-Investor: The model’s out of sample performance YTD is 18.5%, and for the last 12 months is 13.9%. Over the same period the benchmark SPY performance was 16.1% and 5.9% respectively. Since inception, on 3/30/2015, the model gained 64.59% while the benchmark SPY gained 50.27% and the ETF USMV gained 61.56% over the same period. Over the previous week the market value of iM-Best12(USMV)Q2 gained 4.06% at a time when SPY gained 5.24%. A starting capital of $100,000 at inception on 3/30/2015 would have grown to $164,592 which includes $652 cash and excludes $1,399 spent on fees and slippage. |
|
|
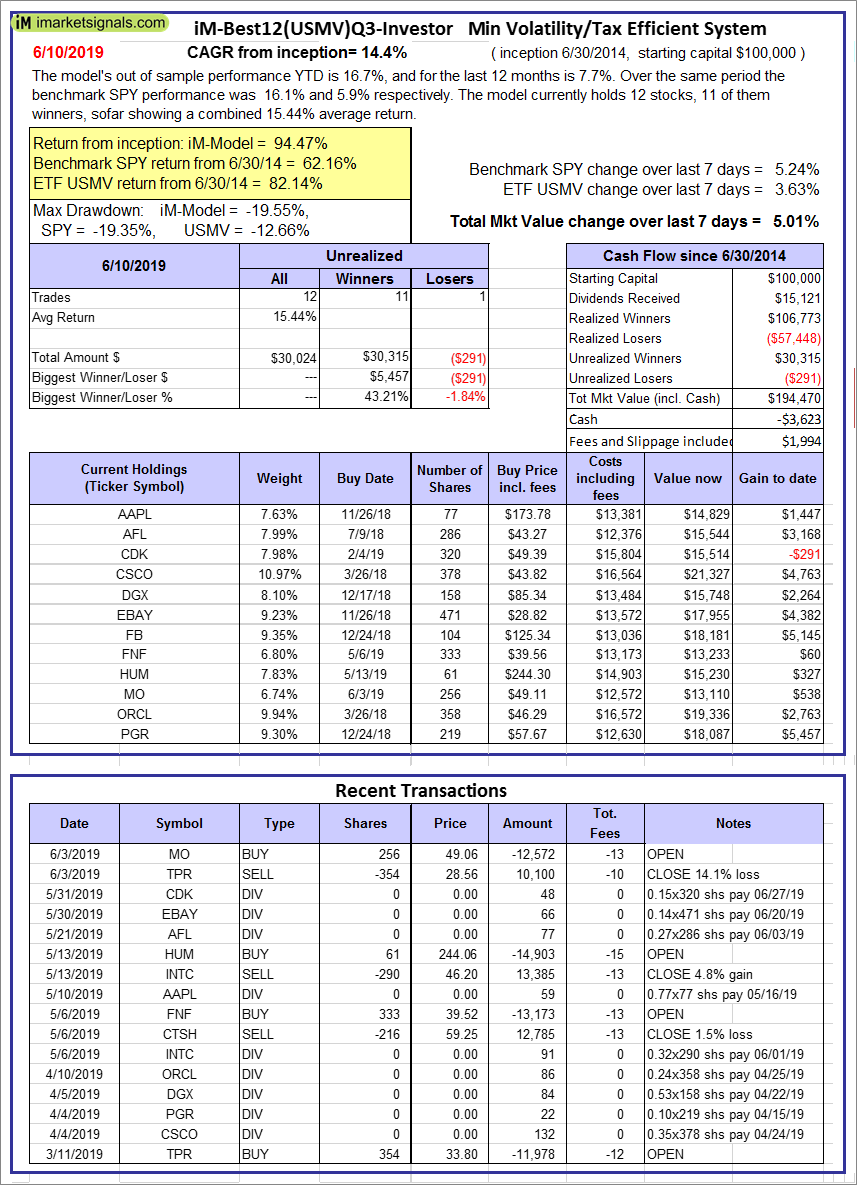
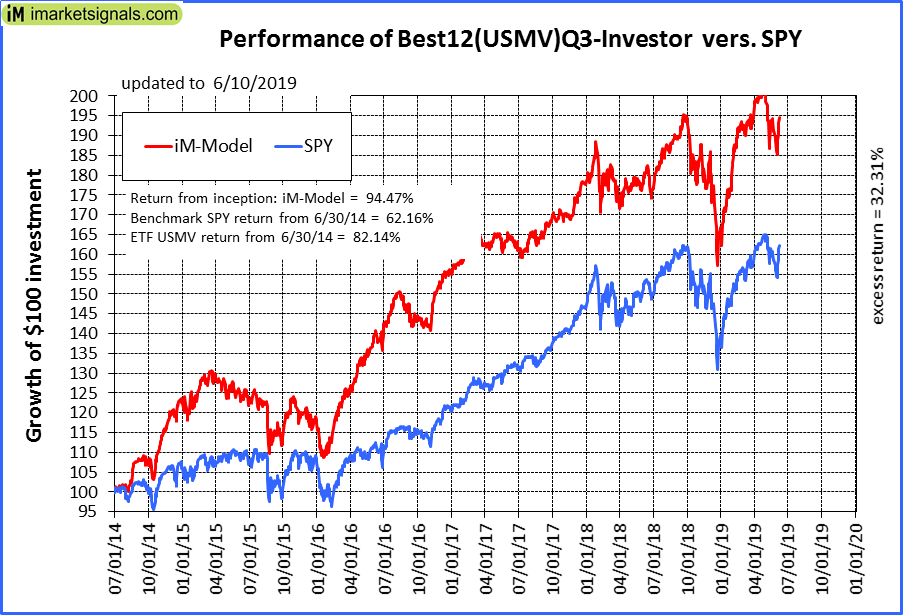
iM-Best12(USMV)Q3-Investor: The model’s out of sample performance YTD is 16.7%, and for the last 12 months is 7.7%. Over the same period the benchmark SPY performance was 16.1% and 5.9% respectively. Since inception, on 7/1/2014, the model gained 94.47% while the benchmark SPY gained 62.16% and the ETF USMV gained 82.14% over the same period. Over the previous week the market value of iM-Best12(USMV)Q3 gained 5.01% at a time when SPY gained 5.24%. A starting capital of $100,000 at inception on 7/1/2014 would have grown to $194,470 which includes -$3,623 cash and excludes $1,994 spent on fees and slippage. |
|
|
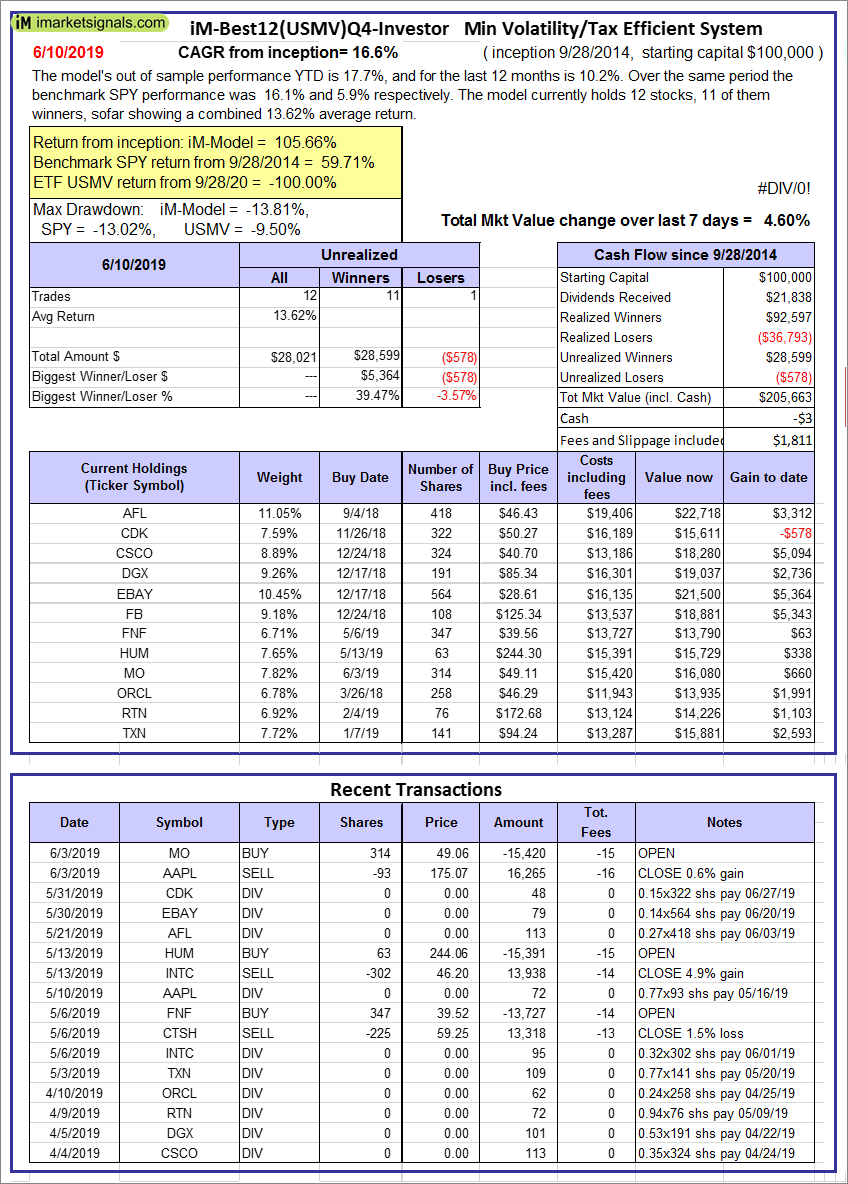
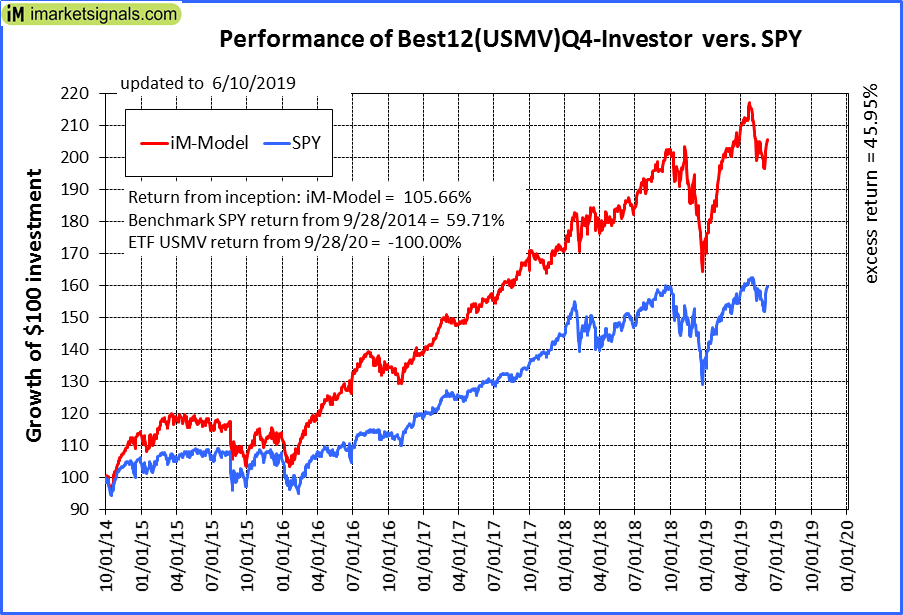
iM-Best12(USMV)Q4-Investor: Since inception, on 9/29/2014, the model gained 105.66% while the benchmark SPY gained 59.71% and the ETF USMV gained 79.63% over the same period. Over the previous week the market value of iM-Best12(USMV)Q4 gained 4.60% at a time when SPY gained 5.24%. A starting capital of $100,000 at inception on 9/29/2014 would have grown to $205,663 which includes -$3 cash and excludes $1,811 spent on fees and slippage. |
|
|
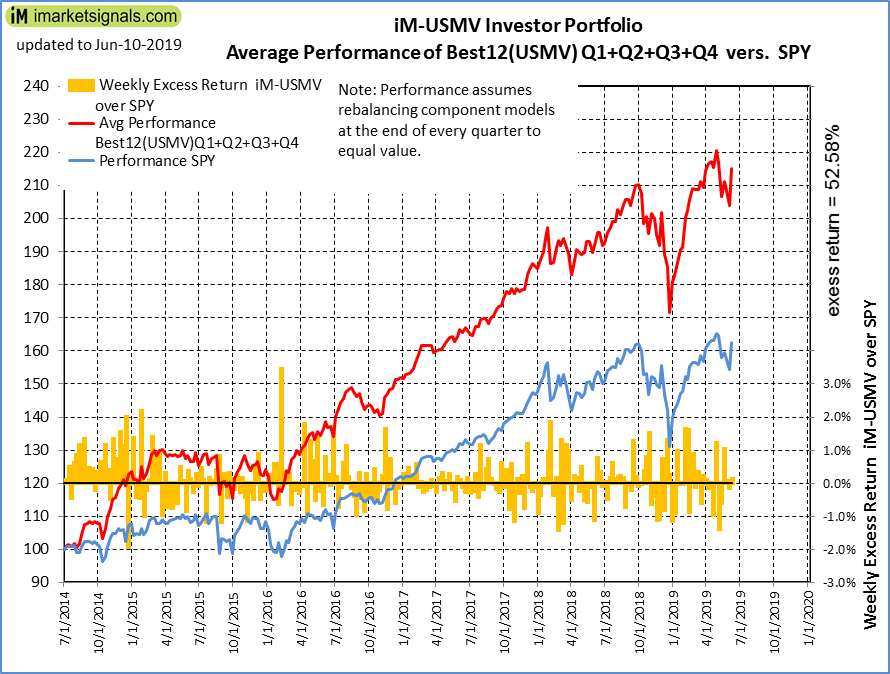
Average Performance of iM-Best12(USMV)Q1+Q2+Q3+Q4-Investor resulted in an excess return of 52.58% over SPY. (see iM-USMV Investor Portfolio) |
|
|
iM-Best(Short): The model’s out of sample performance YTD is -10.3%, and for the last 12 months is -11.2%. Over the same period the benchmark SPY performance was 16.1% and 5.9% respectively. Over the previous week the market value of iM-Best(Short) gained -0.11% at a time when SPY gained 5.24%. Over the period 1/2/2009 to 6/10/2019 the starting capital of $100,000 would have grown to $79,844 which includes $126,884 cash and excludes $25,824 spent on fees and slippage. |
|
|
iM-Best2 MC-Score ETF System: The model’s out of sample performance YTD is 8.8%, and for the last 12 months is 7.1%. Over the same period the benchmark SPY performance was 16.1% and 5.9% respectively. Over the previous week the market value of the iM-Best2 MC-Score ETF System gained 3.89% at a time when SPY gained 5.24%. A starting capital of $100,000 at inception on 6/30/2016 would have grown to $115,406 which includes $35 cash and excludes $670 spent on fees and slippage. |
|
|
iM-Best4 MC-Score Vanguard System: The model’s out of sample performance YTD is 10.5%, and for the last 12 months is 11.9%. Over the same period the benchmark SPY performance was 16.1% and 5.9% respectively. Over the previous week the market value of the iM-Best4 MC-Score Vanguard System gained 2.74% at a time when SPY gained 5.24%. A starting capital of $100,000 at inception on 6/30/2016 would have grown to $119,411 which includes $197 cash and excludes $00 spent on fees and slippage. |
|
|
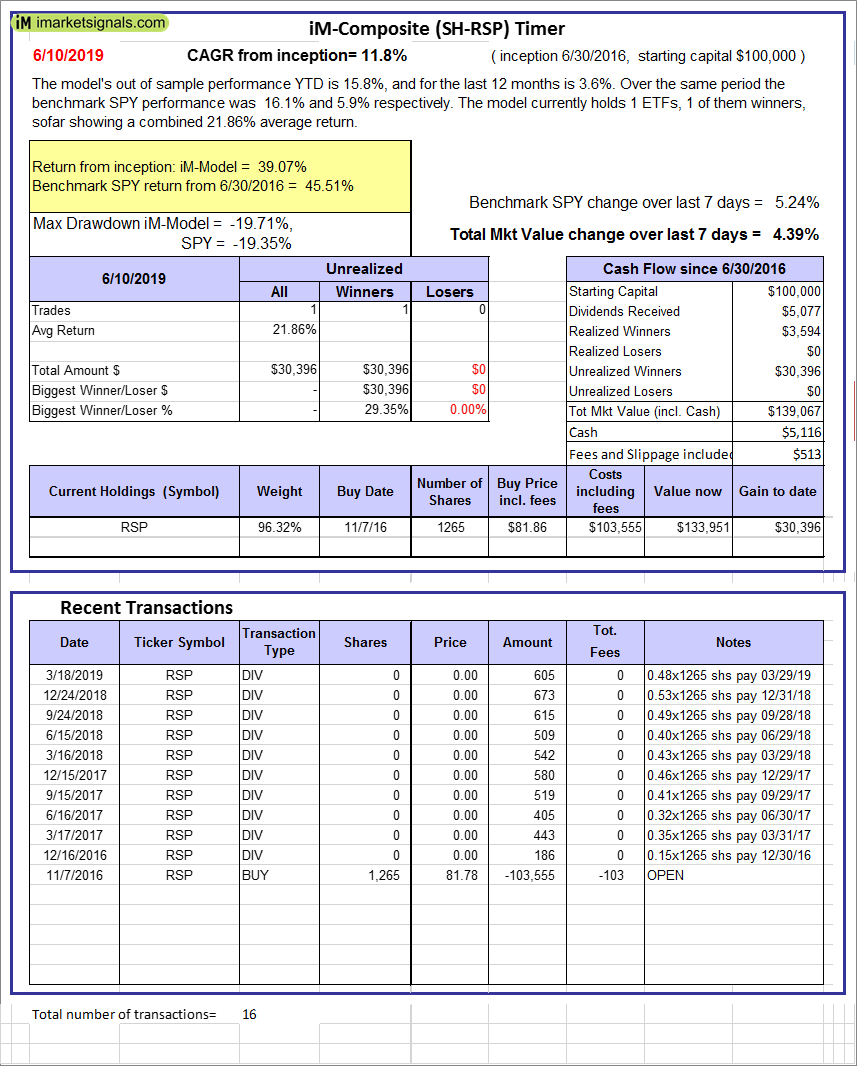
iM-Composite (SH-RSP) Timer: The model’s out of sample performance YTD is 15.8%, and for the last 12 months is 3.6%. Over the same period the benchmark SPY performance was 16.1% and 5.9% respectively. Over the previous week the market value of the iM-Composite (SH-RSP) Timer gained 4.39% at a time when SPY gained 5.24%. A starting capital of $100,000 at inception on 6/30/2016 would have grown to $139,067 which includes $5,116 cash and excludes $513 spent on fees and slippage. |
|
|
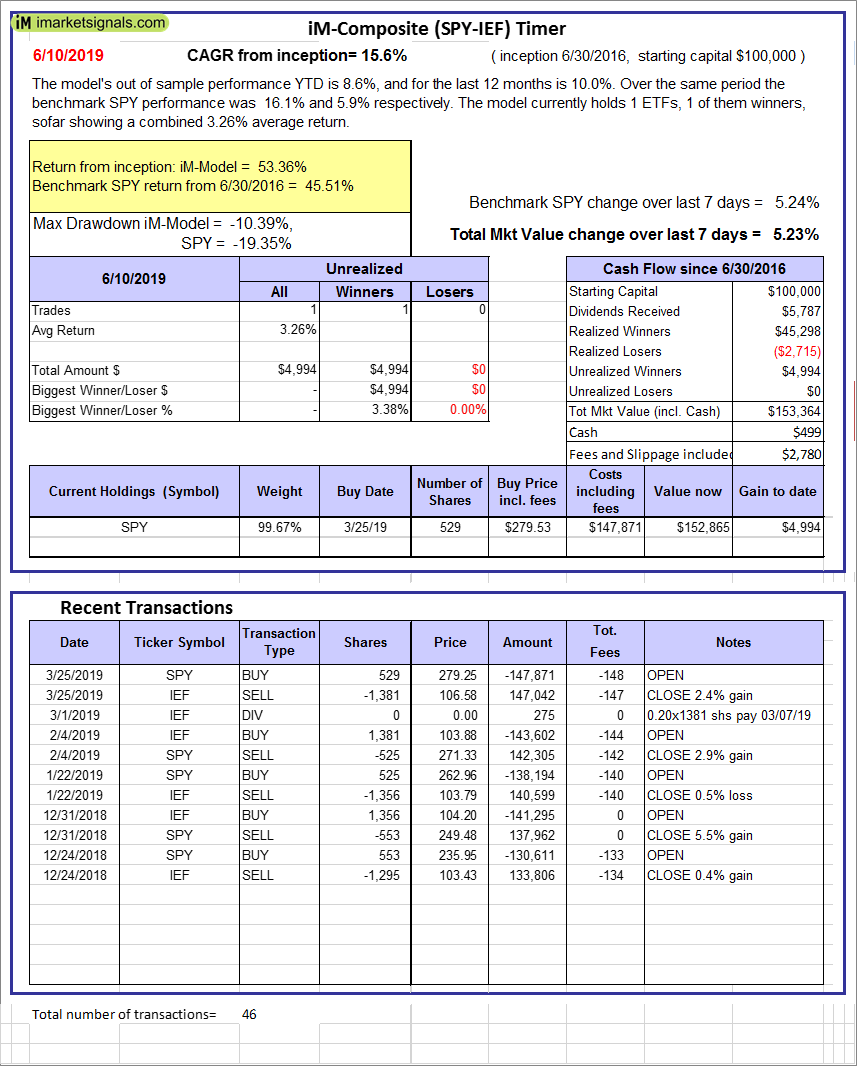
iM-Composite (SPY-IEF) Timer: The model’s out of sample performance YTD is 8.6%, and for the last 12 months is 10.0%. Over the same period the benchmark SPY performance was 16.1% and 5.9% respectively. Over the previous week the market value of the iM-Composite (SPY-IEF) Timer gained 5.23% at a time when SPY gained 5.24%. A starting capital of $100,000 at inception on 6/30/2016 would have grown to $153,364 which includes $499 cash and excludes $2,780 spent on fees and slippage. |
|
|
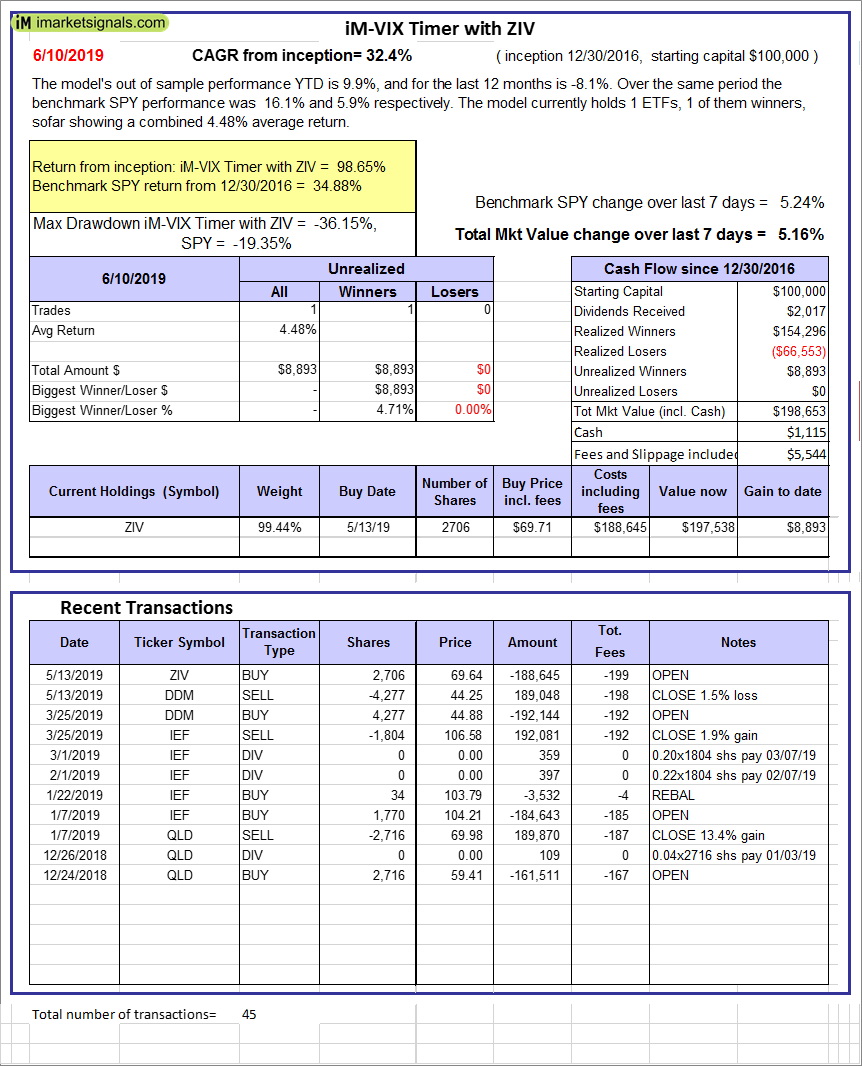
iM-VIX Timer with ZIV: The model’s out of sample performance YTD is 9.9%, and for the last 12 months is -8.1%. Over the same period the benchmark SPY performance was 16.1% and 5.9% respectively. Over the previous week the market value of the iM-VIX Timer with ZIV gained 5.16% at a time when SPY gained 5.24%. A starting capital of $100,000 at inception on 6/30/2016 would have grown to $198,653 which includes $1,115 cash and excludes $5,544 spent on fees and slippage. |
|
|
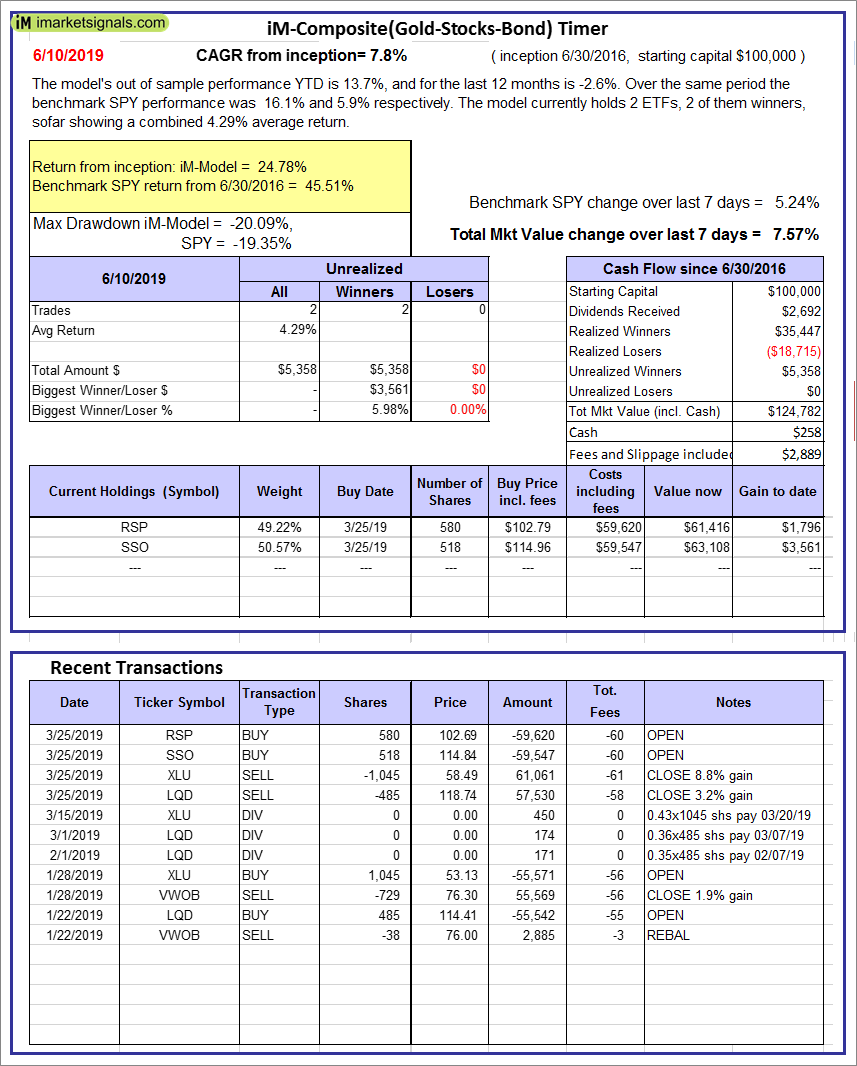
iM-Composite(Gold-Stocks-Bond) Timer: The model’s out of sample performance YTD is 13.7%, and for the last 12 months is -2.6%. Over the same period the benchmark SPY performance was 16.1% and 5.9% respectively. Over the previous week the market value of the iM-Composite(Gold-Stocks-Bond) Timer gained 7.57% at a time when SPY gained 5.24%. A starting capital of $100,000 at inception on 6/30/2016 would have grown to $124,782 which includes $258 cash and excludes $2,889 spent on fees and slippage. |
|
|
iM-Low Turnover Composite Timer Combo: The model’s out of sample performance YTD is 9.0%, and for the last 12 months is -1.9%. Over the same period the benchmark SPY performance was 16.1% and 5.9% respectively. Over the previous week the market value of the iM-Low Turnover Composite Timer Combo gained 2.73% at a time when SPY gained 5.24%. A starting capital of $100,000 at inception on 3/24/27 would have grown to $105,047 which includes -$527 cash and excludes $813 spent on fees and slippage. |
|
|
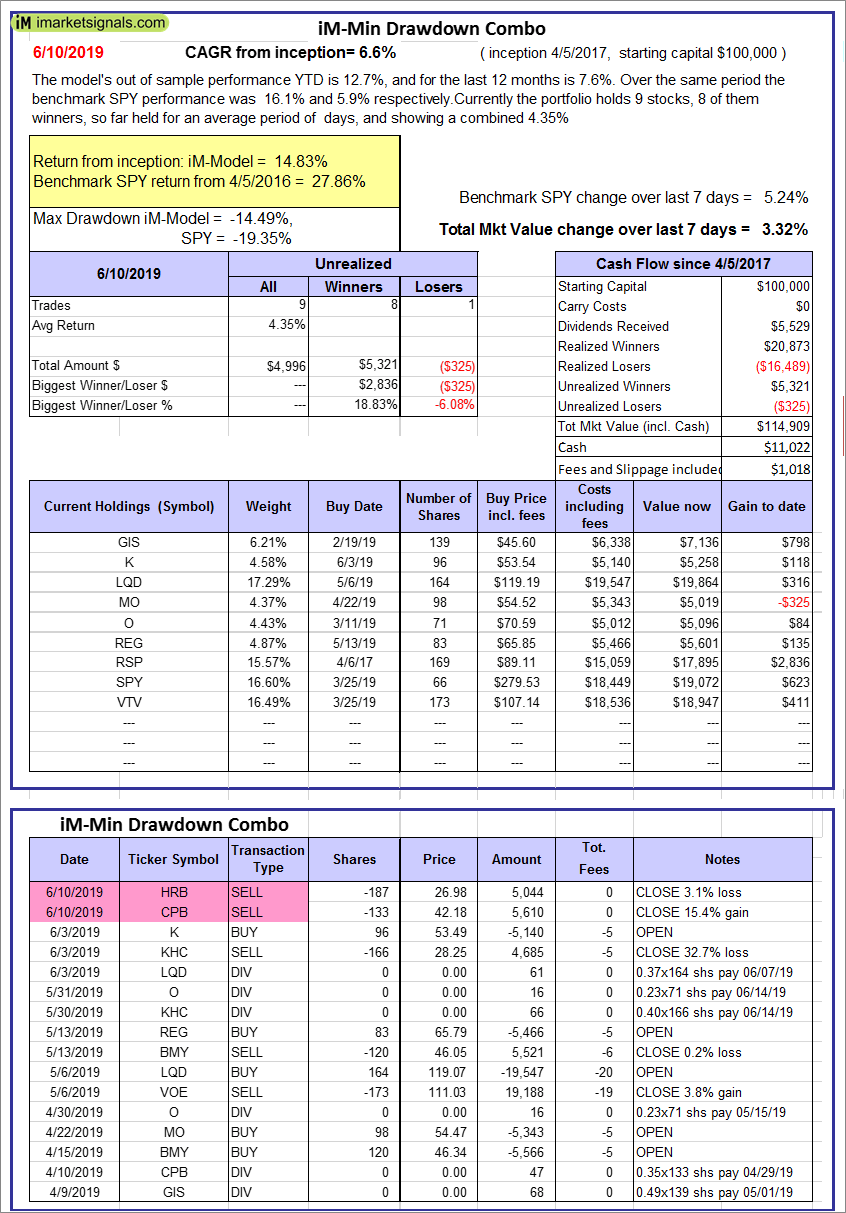
iM-Min Drawdown Combo: The model’s out of sample performance YTD is 12.7%, and for the last 12 months is 7.6%. Over the same period the benchmark SPY performance was 16.1% and 5.9% respectively. Over the previous week the market value of the iM-Min Drawdown Combo gained 3.32% at a time when SPY gained 5.24%. A starting capital of $100,000 at inception on 4/5/2017 would have grown to $114,909 which includes $11,022 cash and excludes $1,018 spent on fees and slippage. |
|
|
iM-5ETF Trader (includes leveraged ETFs): The model’s out of sample performance YTD is 7.2%, and for the last 12 months is -17.3%. Over the same period the benchmark SPY performance was 16.1% and 5.9% respectively. Over the previous week the market value of the iM-5ETF Trader (includes leveraged ETFs) gained 9.68% at a time when SPY gained 5.24%. A starting capital of $100,000 at inception on 10/30/2016 would have grown to $148,384 which includes $285 cash and excludes $2,795 spent on fees and slippage. |
|
|
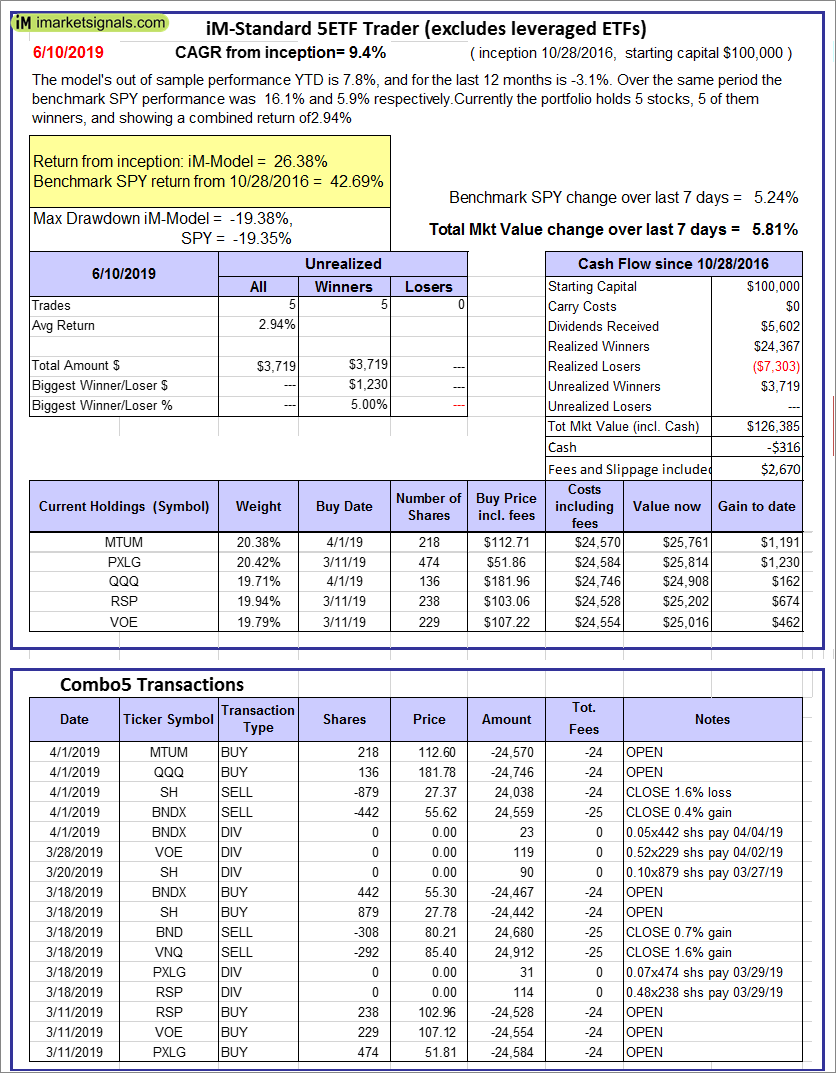
iM-Standard 5ETF Trader (excludes leveraged ETFs): The model’s out of sample performance YTD is 7.8%, and for the last 12 months is -3.1%. Over the same period the benchmark SPY performance was 16.1% and 5.9% respectively. Over the previous week the market value of the iM-Standard 5ETF Trader (excludes leveraged ETFs) gained 5.81% at a time when SPY gained 5.24%. A starting capital of $100,000 at inception on 10/30/2016 would have grown to $126,385 which includes -$316 cash and excludes $2,670 spent on fees and slippage. |


Leave a Reply
You must be logged in to post a comment.