
  |
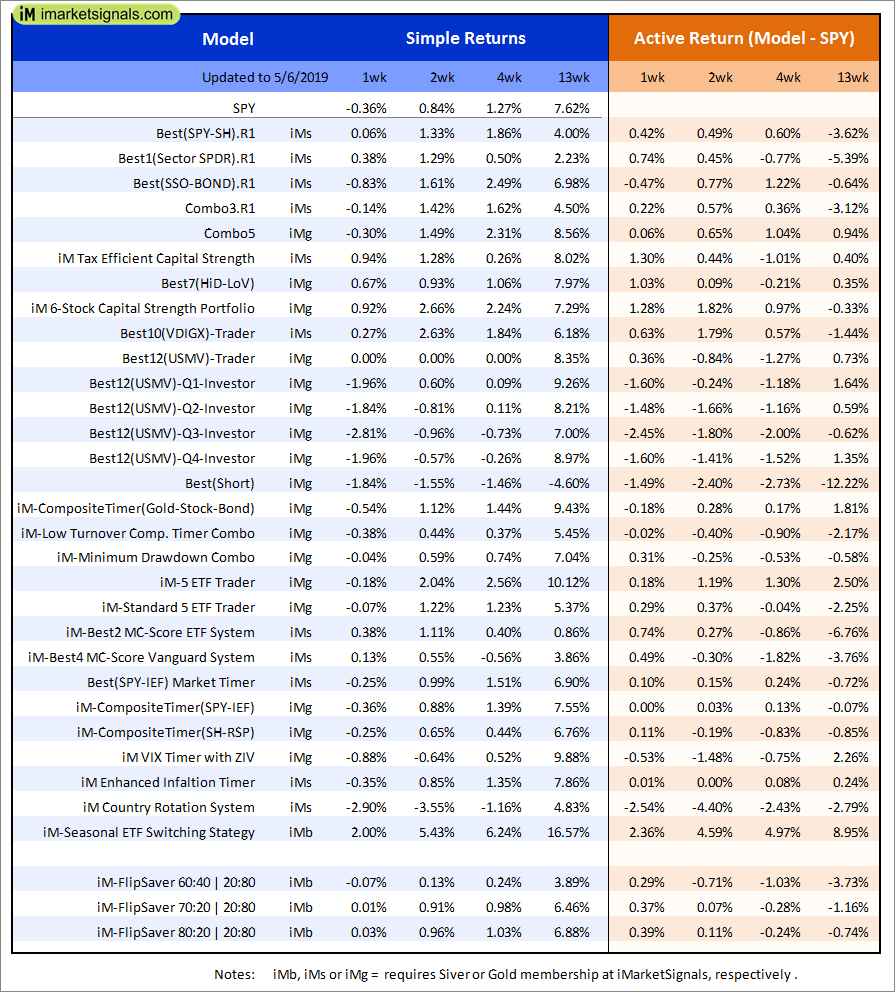
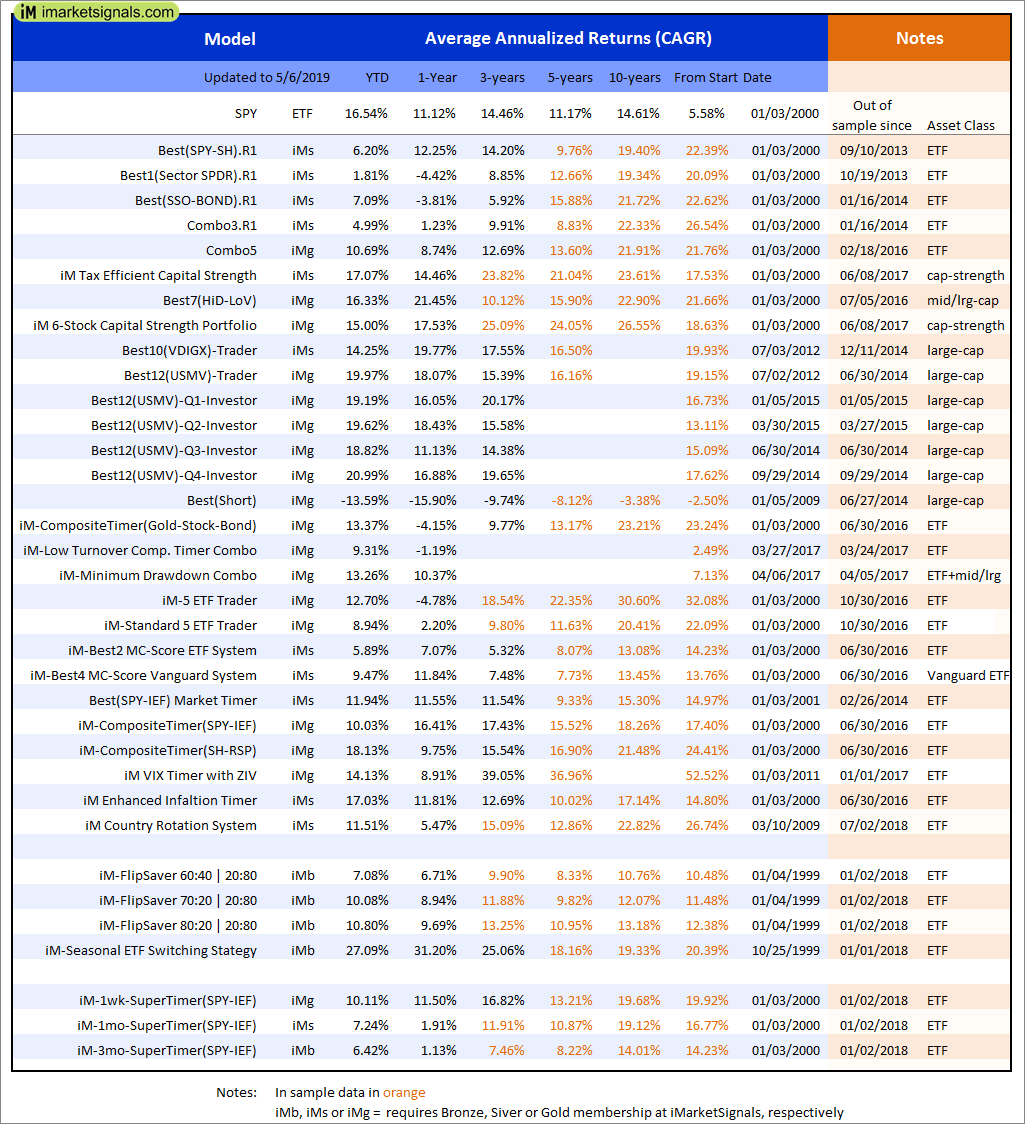
Out of sample performance summary of our models for the past 1, 2, 4 and 13 week periods. The active active return indicates how the models over- or underperformed the benchmark ETF SPY. Also the YTD, and the 1-, 3-, 5- and 10-year annualized returns are shown in the second table |
 |
iM-FlipSaver 60:40 | 20:80 – 2017: The model’s out of sample performance YTD is 8.2%, and for the last 12 months is 6.9%. Over the same period the benchmark E60B40 performance was 11.7% and 9.8% respectively. Over the previous week the market value of iM-FlipSaver 80:20 | 20:80 gained 0.11% at a time when SPY gained -0.12%. A starting capital of $100,000 at inception on 7/16/2015 would have grown to $121,121 which includes $209 cash and excludes $788 spent on fees and slippage. |
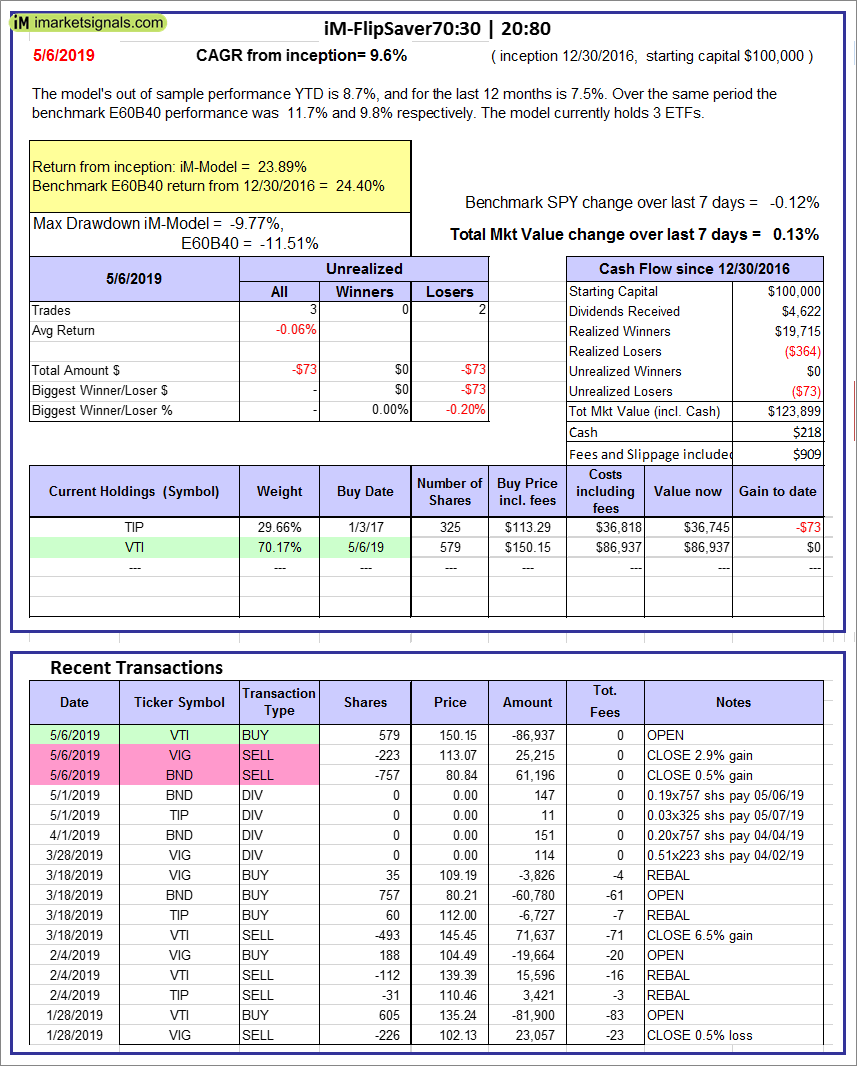 |
iM-FlipSaver 70:30 | 20:80 – 2017: The model’s out of sample performance YTD is 8.7%, and for the last 12 months is 7.5%. Over the same period the benchmark E60B40 performance was 11.7% and 9.8% respectively. Over the previous week the market value of iM-FlipSaver 70:30 | 20:80 gained 0.13% at a time when SPY gained -0.12%. A starting capital of $100,000 at inception on 7/15/2015 would have grown to $123,899 which includes $218 cash and excludes $909 spent on fees and slippage. |
 |
iM-FlipSaver 80:20 | 20:80 – 2017: The model’s out of sample performance YTD is 9.2%, and for the last 12 months is 8.1%. Over the same period the benchmark E60B40 performance was 11.7% and 9.8% respectively. Over the previous week the market value of iM-FlipSaver 80:20 | 20:80 gained 0.16% at a time when SPY gained -0.12%. A starting capital of $100,000 at inception on 1/2/2017 would have grown to $126,657 which includes $319 cash and excludes $1,024 spent on fees and slippage. |
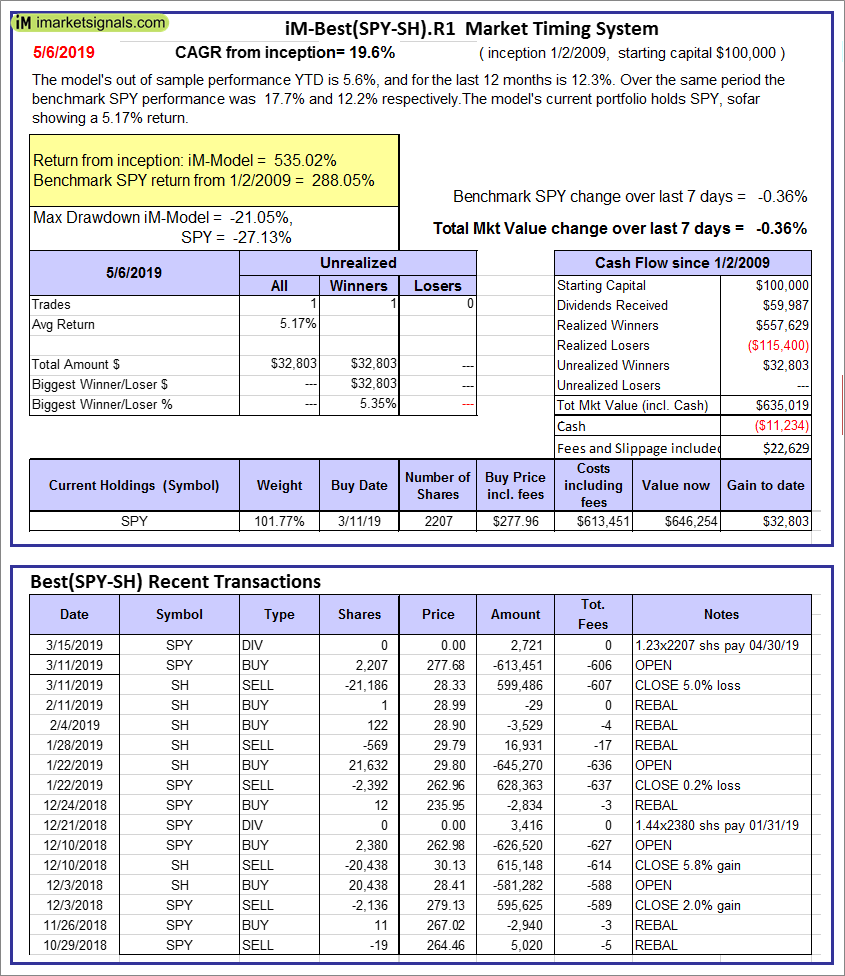 |
iM-Best(SPY-SH).R1: The model’s out of sample performance YTD is 5.6%, and for the last 12 months is 12.3%. Over the same period the benchmark SPY performance was 17.7% and 12.2% respectively. Over the previous week the market value of Best(SPY-SH) gained -0.36% at a time when SPY gained -0.36%. A starting capital of $100,000 at inception on 1/2/2009 would have grown to $635,019 which includes -$11,234 cash and excludes $22,629 spent on fees and slippage. |
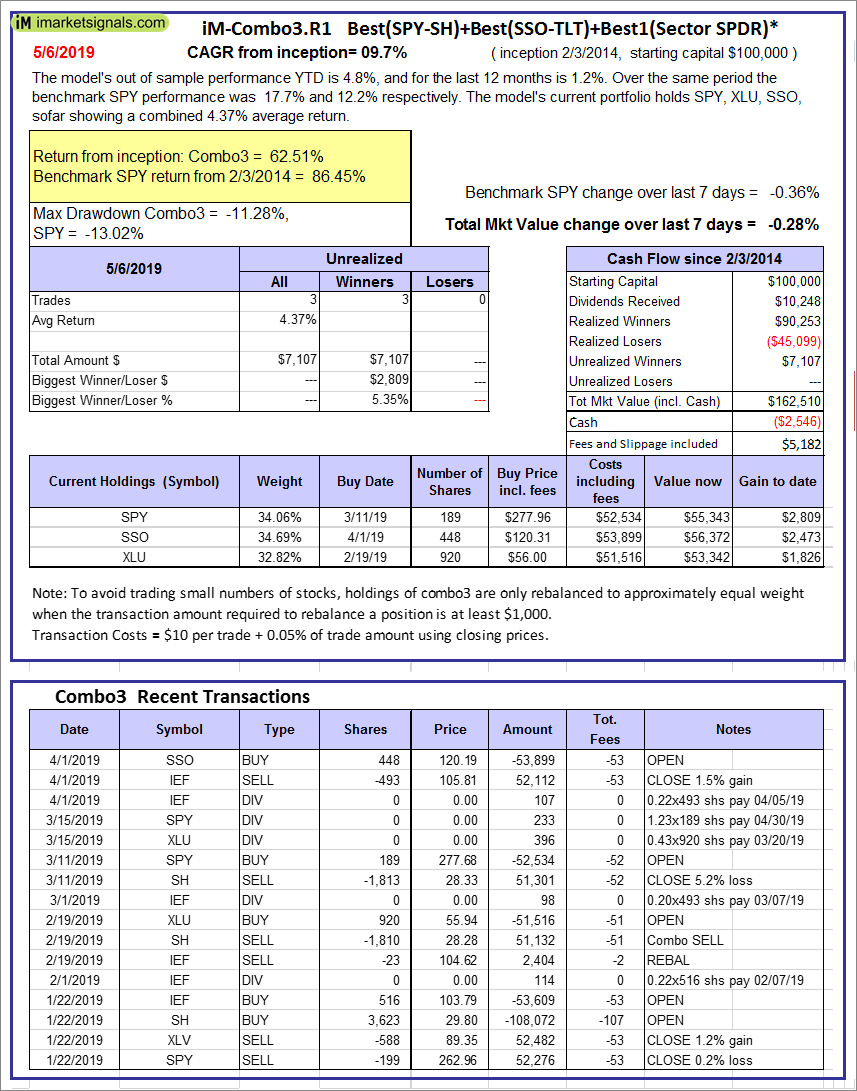 |
iM-Combo3.R1: The model’s out of sample performance YTD is 4.8%, and for the last 12 months is 1.2%. Over the same period the benchmark SPY performance was 17.7% and 12.2% respectively. Over the previous week the market value of iM-Combo3.R1 gained -0.28% at a time when SPY gained -0.36%. A starting capital of $100,000 at inception on 2/3/2014 would have grown to $162,510 which includes -$2,546 cash and excludes $5,182 spent on fees and slippage. |
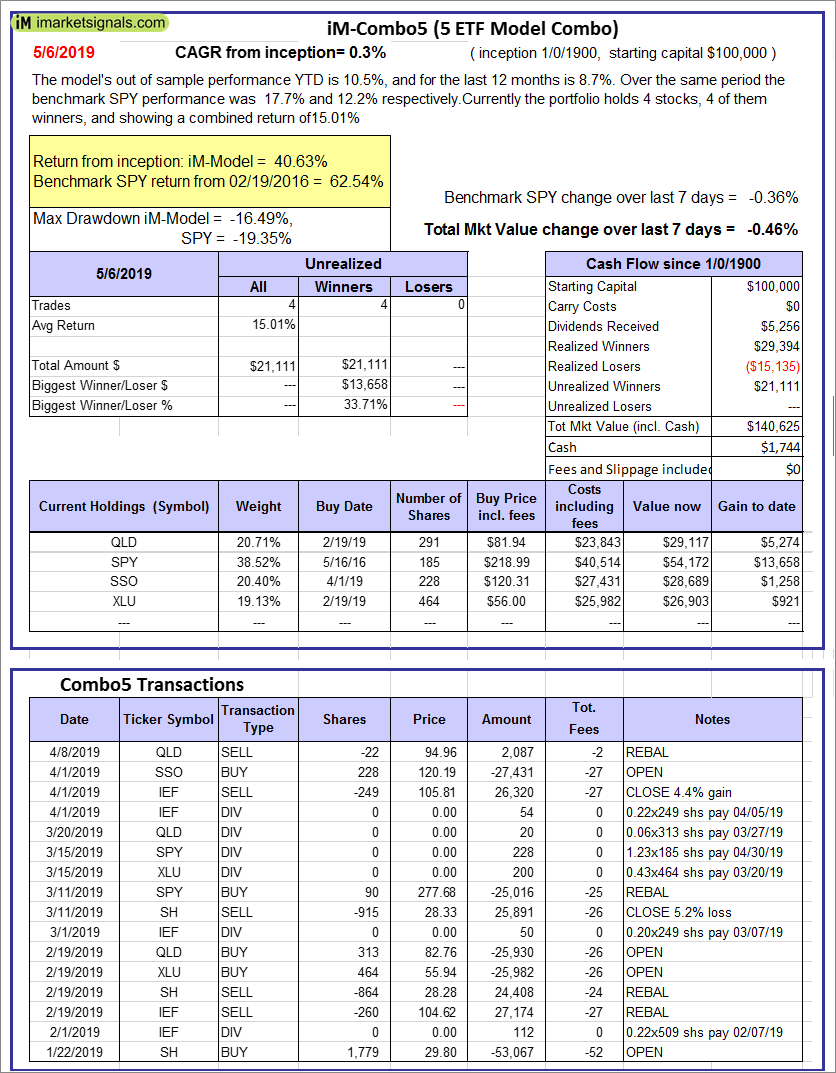 |
iM-Combo5: The model’s out of sample performance YTD is 10.5%, and for the last 12 months is 8.7%. Over the same period the benchmark SPY performance was 17.7% and 12.2% respectively. Over the previous week the market value of iM-Combo5 gained -0.46% at a time when SPY gained -0.36%. A starting capital of $100,000 at inception on 2/22/2016 would have grown to $140,625 which includes $1,744 cash and excludes $0 spent on fees and slippage. |
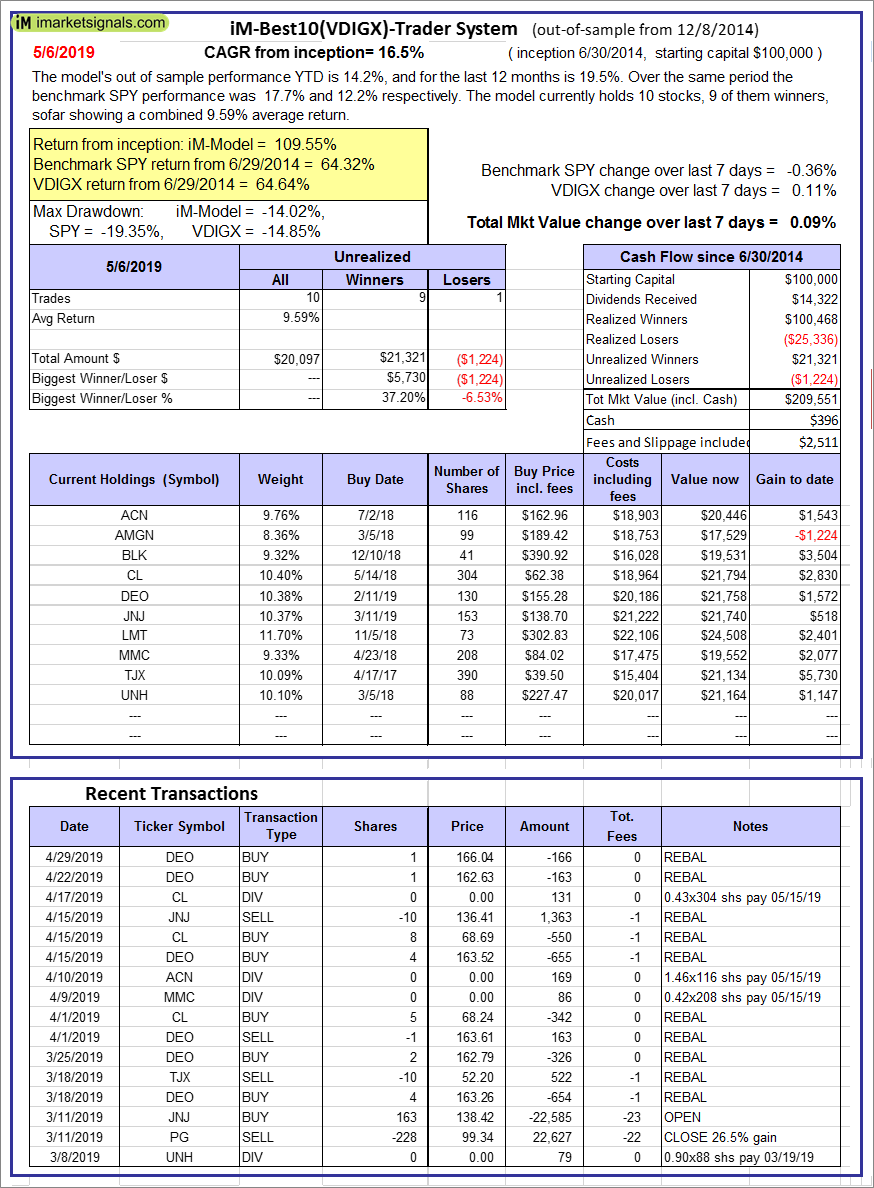  |
iM-Best10(VDIGX)-Trader: The model’s out of sample performance YTD is 14.2%, and for the last 12 months is 19.5%. Over the same period the benchmark SPY performance was 17.7% and 12.2% respectively. Since inception, on 7/1/2014, the model gained 109.55% while the benchmark SPY gained 64.32% and VDIGX gained 64.64% over the same period. Over the previous week the market value of iM-Best10(VDIGX) gained 0.09% at a time when SPY gained -0.36%. A starting capital of $100,000 at inception on 7/1/2014 would have grown to $209,551 which includes $396 cash and excludes $2,511 spent on fees and slippage. |
 |
iM-Best7(HiD-LoV): The model’s out of sample performance YTD is 15.8%, and for the last 12 months is 21.3%. Over the same period the benchmark SPY performance was 17.7% and 12.2% respectively. Over the previous week the market value of iM-Best7(HiD-LoV) gained 0.53% at a time when SPY gained -0.36%. A starting capital of $100,000 at inception on 6/30/2016 would have grown to $126,617 which includes $399 cash and excludes $2,925 spent on fees and slippage. |
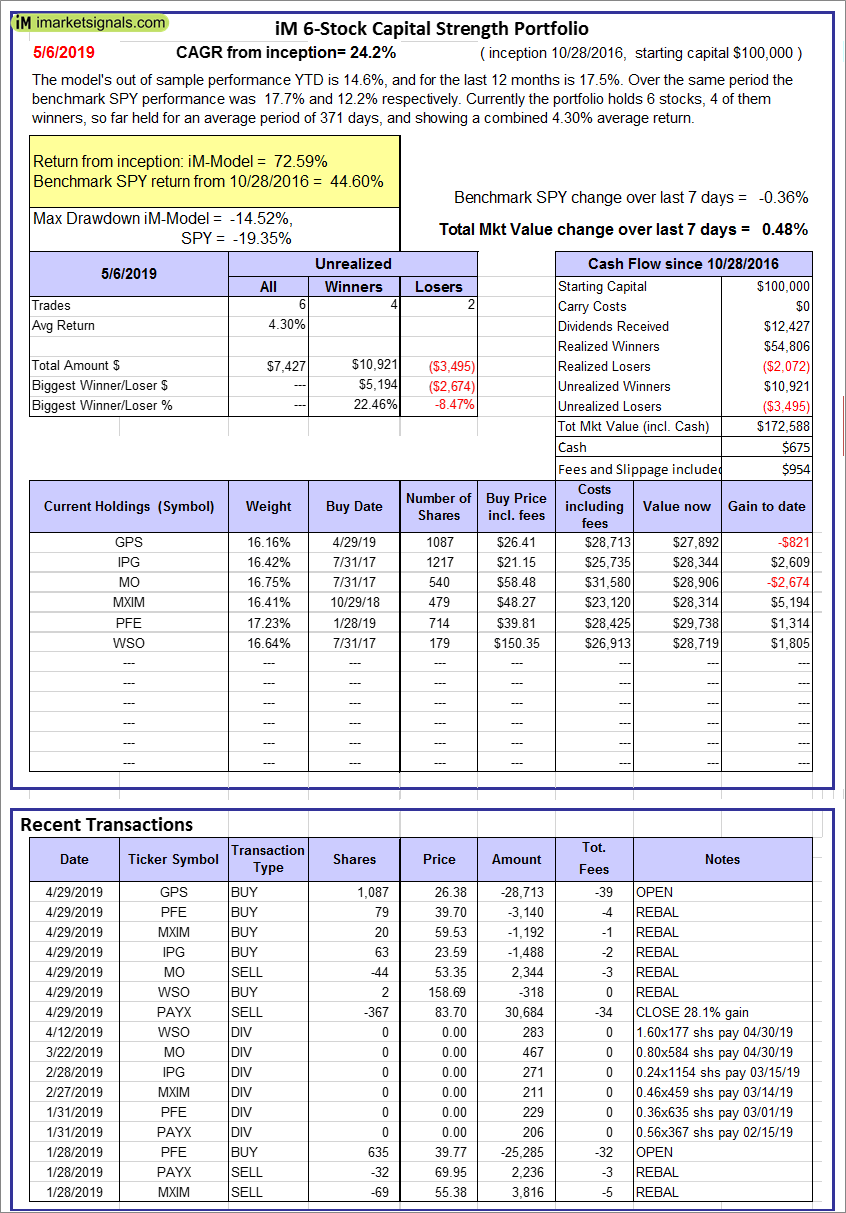 |
iM 6-Stock Capital Strength Portfolio: The model’s out of sample performance YTD is 14.6%, and for the last 12 months is 17.5%. Over the same period the benchmark SPY performance was 17.7% and 12.2% respectively. Over the previous week the market value of the iM 6-Stock Capital Strength Portfolio gained 0.48% at a time when SPY gained -0.36%. A starting capital of $100,000 at inception on 10/28/2016 would have grown to $172,588 which includes $675 cash and excludes $954 spent on fees and slippage. |
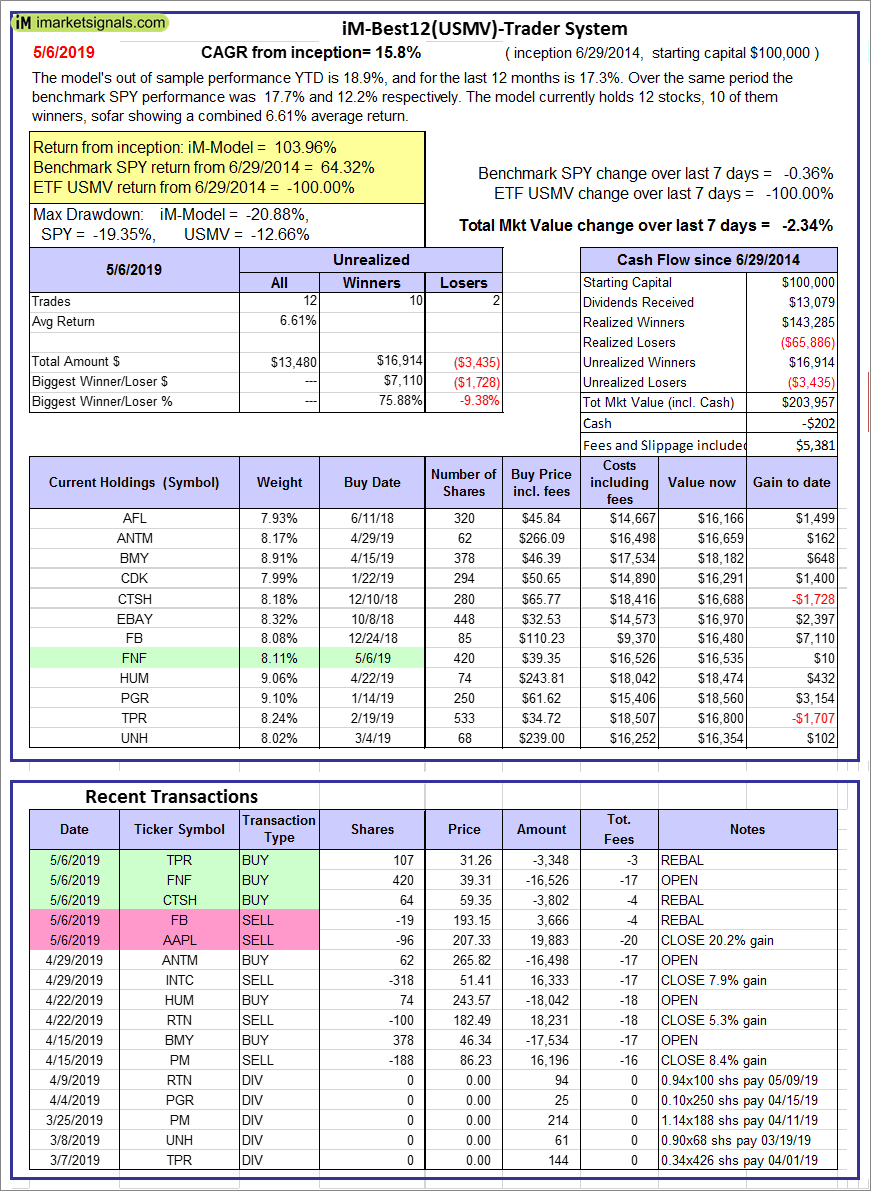 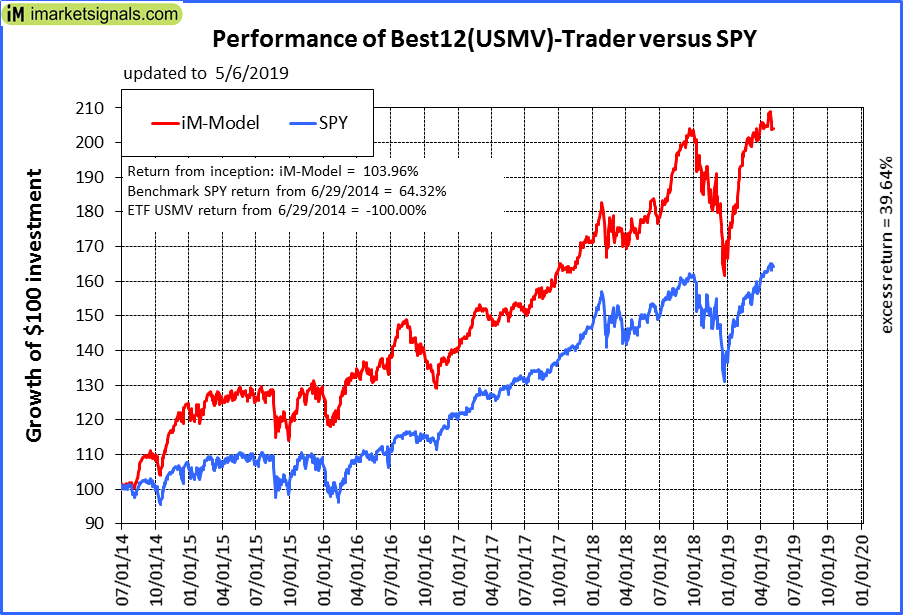 |
iM-Best12(USMV)-Trader: The model’s out of sample performance YTD is 18.9%, and for the last 12 months is 17.3%. Over the same period the benchmark SPY performance was 17.7% and 12.2% respectively. Since inception, on 6/30/2014, the model gained 103.96% while the benchmark SPY gained 64.32% and the ETF USMV gained -100.00% over the same period. Over the previous week the market value of iM-Best12(USMV)-Trader gained -2.34% at a time when SPY gained -0.36%. A starting capital of $100,000 at inception on 6/30/2014 would have grown to $203,957 which includes -$202 cash and excludes $5,381 spent on fees and slippage. |
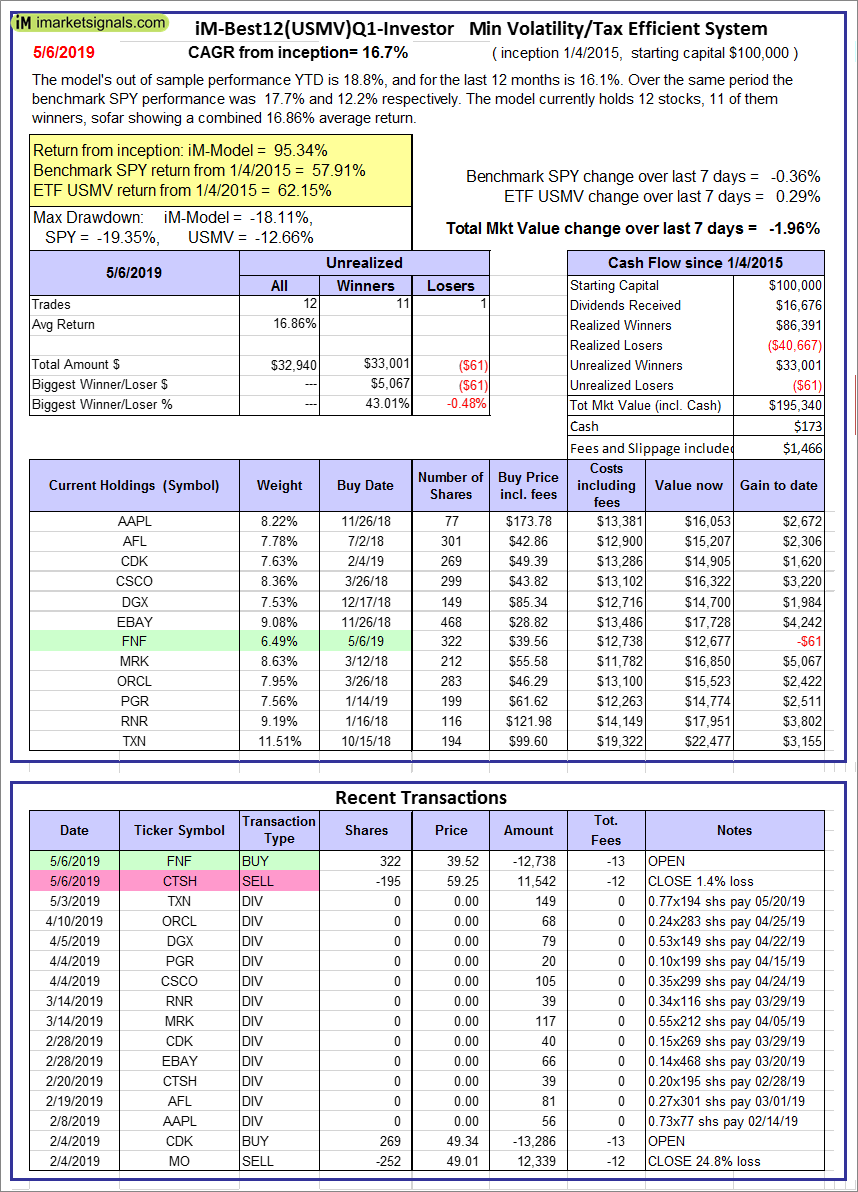  |
iM-Best12(USMV)Q1-Investor: The model’s out of sample performance YTD is 18.8%, and for the last 12 months is 16.1%. Over the same period the benchmark SPY performance was 17.7% and 12.2% respectively. Since inception, on 1/5/2015, the model gained 95.34% while the benchmark SPY gained 57.91% and the ETF USMV gained 62.15% over the same period. Over the previous week the market value of iM-Best12(USMV)Q1 gained -1.96% at a time when SPY gained -0.36%. A starting capital of $100,000 at inception on 1/5/2015 would have grown to $195,340 which includes $173 cash and excludes $1,466 spent on fees and slippage. |
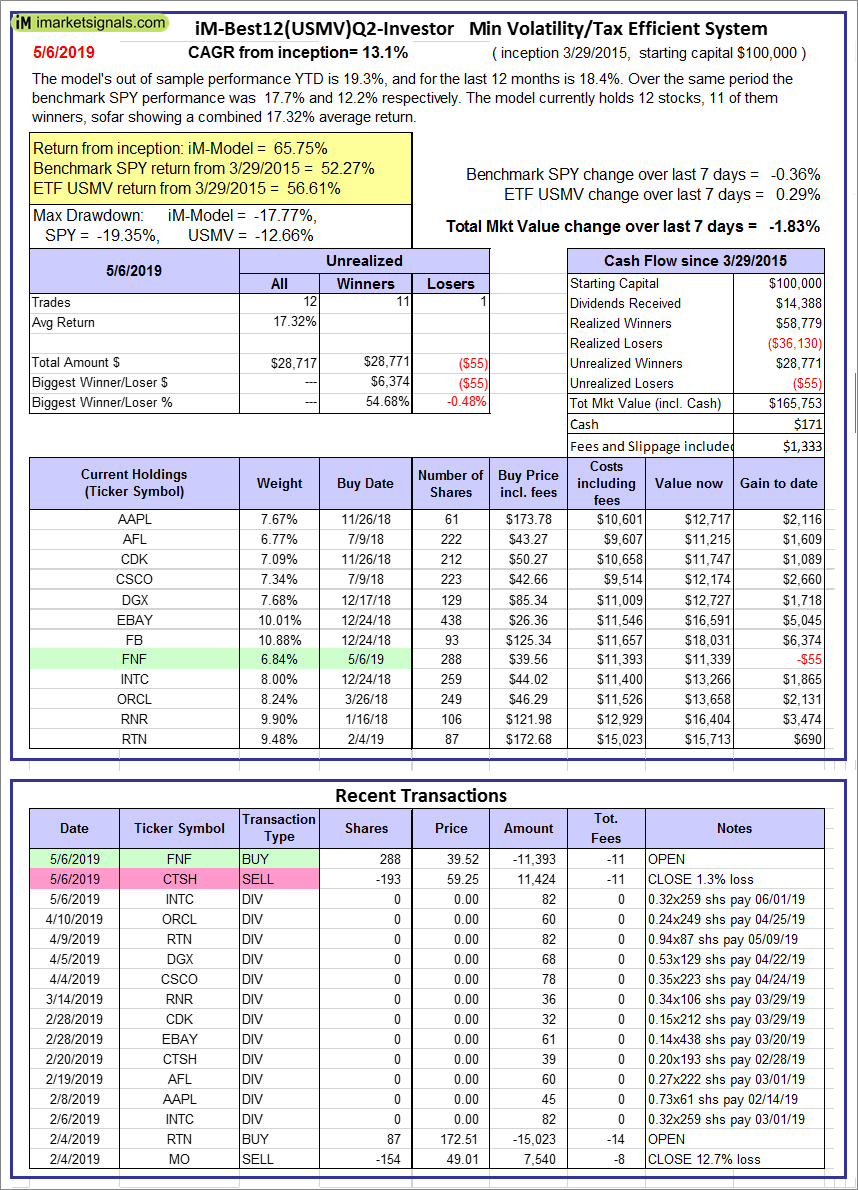 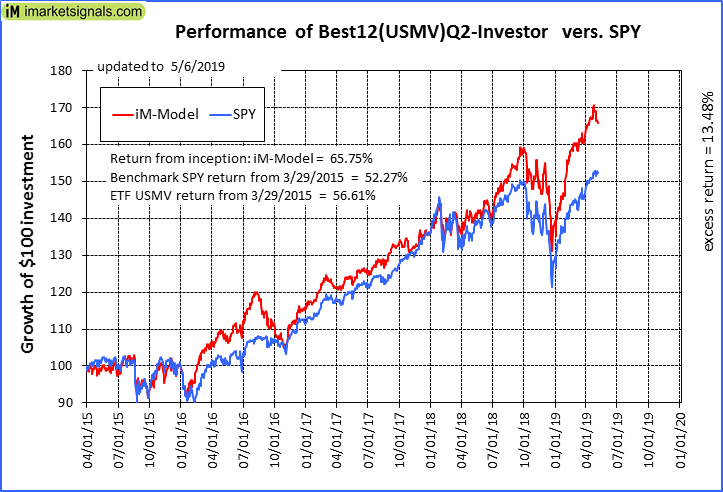 |
iM-Best12(USMV)Q2-Investor: The model’s out of sample performance YTD is 19.3%, and for the last 12 months is 18.4%. Over the same period the benchmark SPY performance was 17.7% and 12.2% respectively. Since inception, on 3/30/2015, the model gained 65.75% while the benchmark SPY gained 52.27% and the ETF USMV gained 56.61% over the same period. Over the previous week the market value of iM-Best12(USMV)Q2 gained -1.83% at a time when SPY gained -0.36%. A starting capital of $100,000 at inception on 3/30/2015 would have grown to $165,753 which includes $171 cash and excludes $1,333 spent on fees and slippage. |
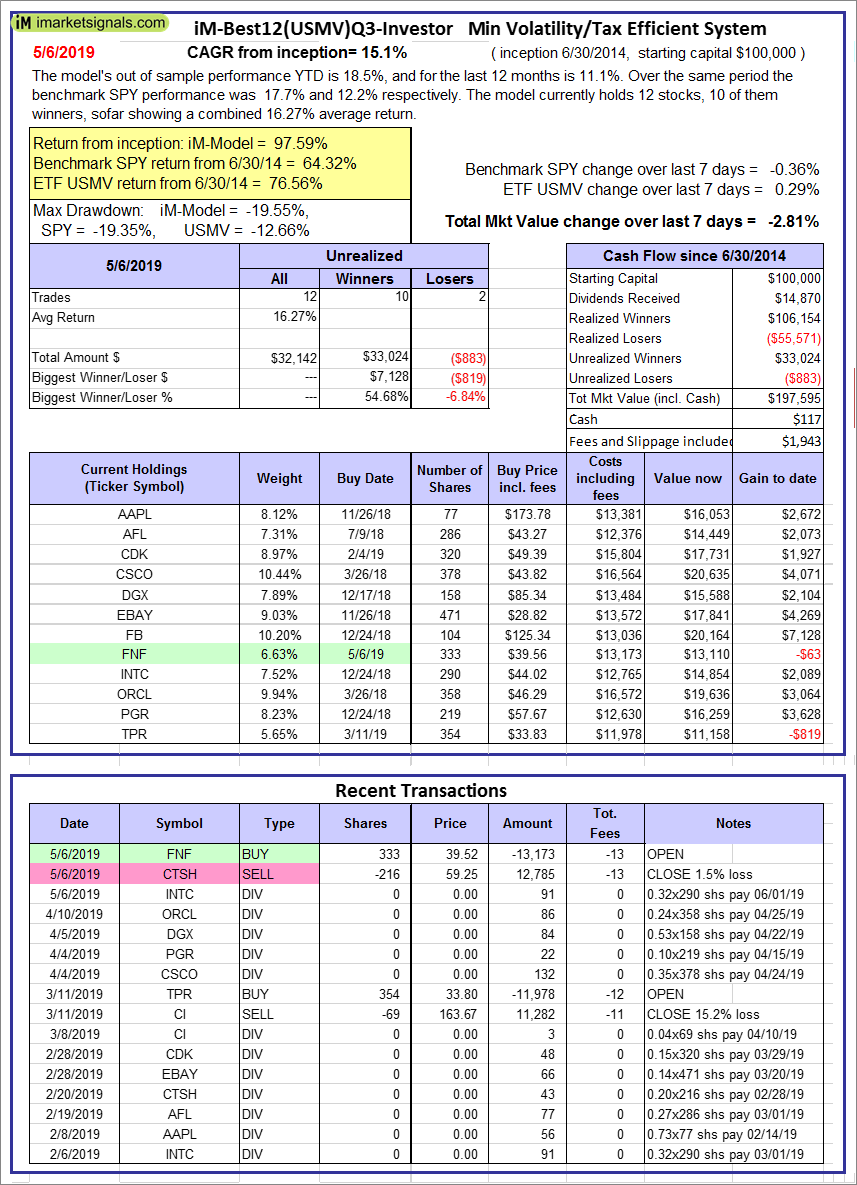 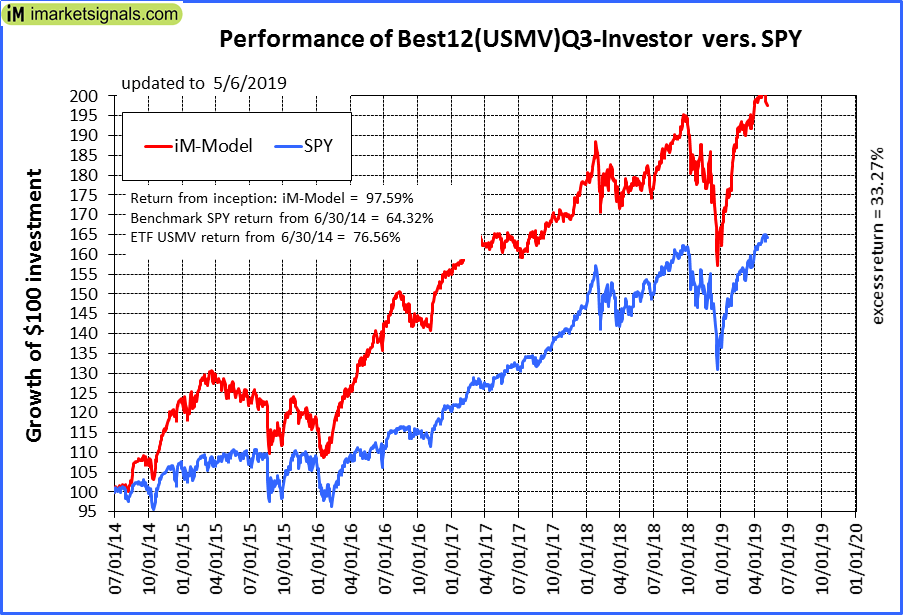 |
iM-Best12(USMV)Q3-Investor: The model’s out of sample performance YTD is 18.5%, and for the last 12 months is 11.1%. Over the same period the benchmark SPY performance was 17.7% and 12.2% respectively. Since inception, on 7/1/2014, the model gained 97.59% while the benchmark SPY gained 64.32% and the ETF USMV gained 76.56% over the same period. Over the previous week the market value of iM-Best12(USMV)Q3 gained -2.81% at a time when SPY gained -0.36%. A starting capital of $100,000 at inception on 7/1/2014 would have grown to $197,595 which includes $117 cash and excludes $1,943 spent on fees and slippage. |
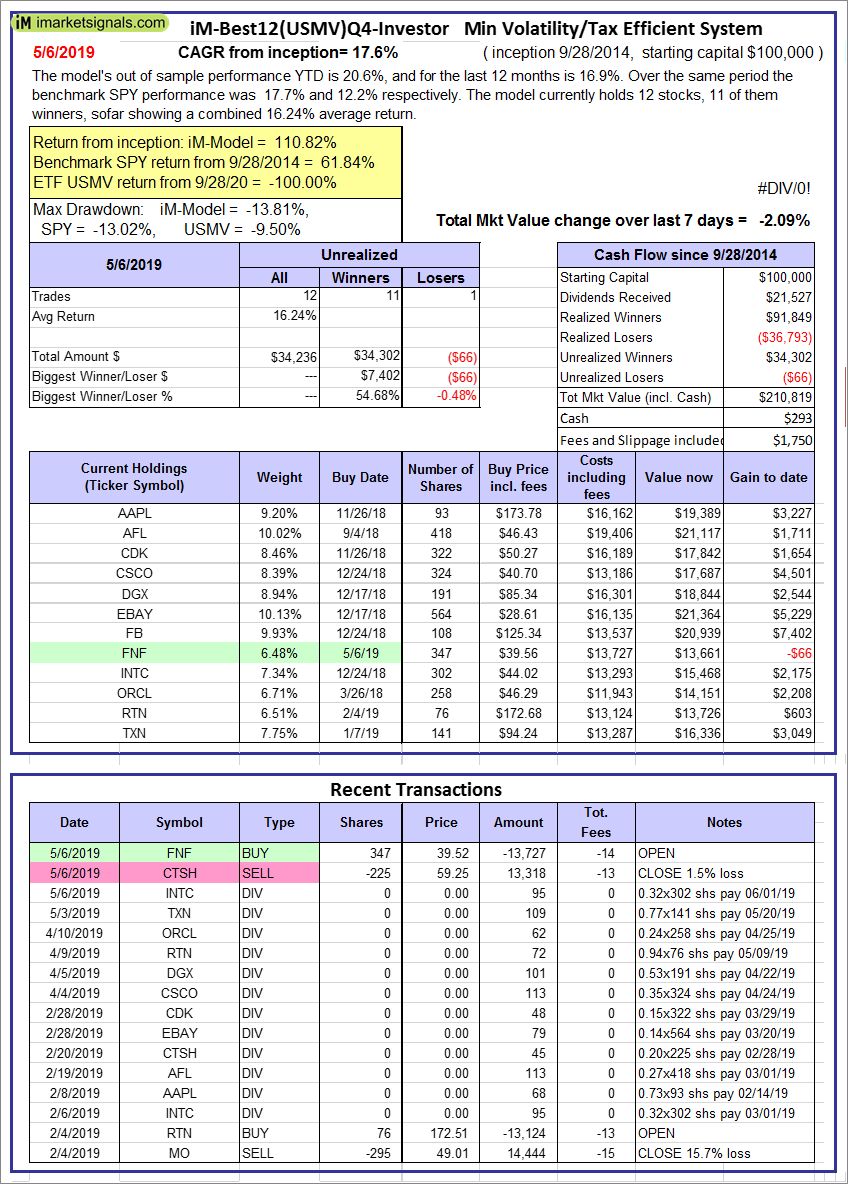 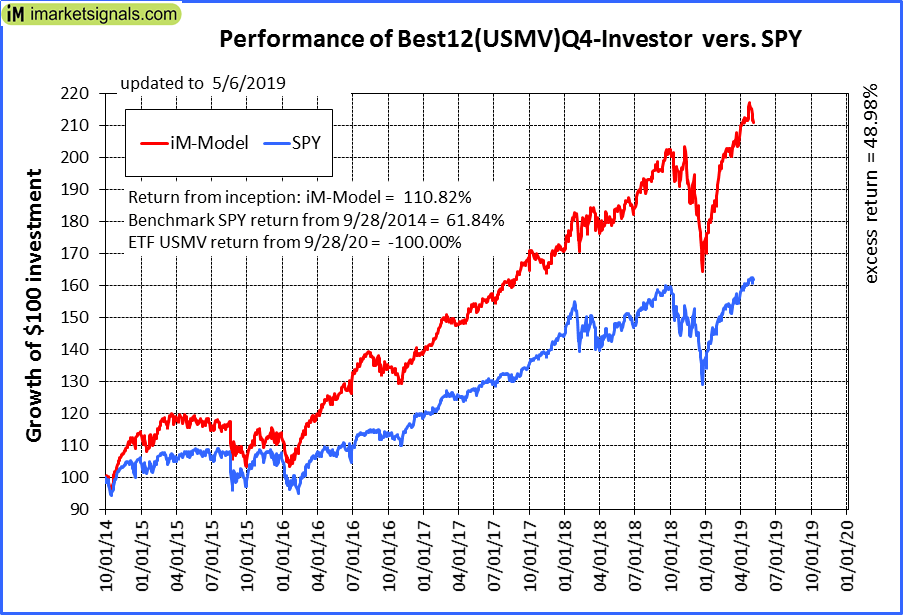 |
iM-Best12(USMV)Q4-Investor: Since inception, on 9/29/2014, the model gained 110.82% while the benchmark SPY gained 61.84% and the ETF USMV gained -100.00% over the same period. Over the previous week the market value of iM-Best12(USMV)Q4 gained -2.09% at a time when SPY gained -0.36%. A starting capital of $100,000 at inception on 9/29/2014 would have grown to $210,819 which includes $293 cash and excludes $1,750 spent on fees and slippage. |
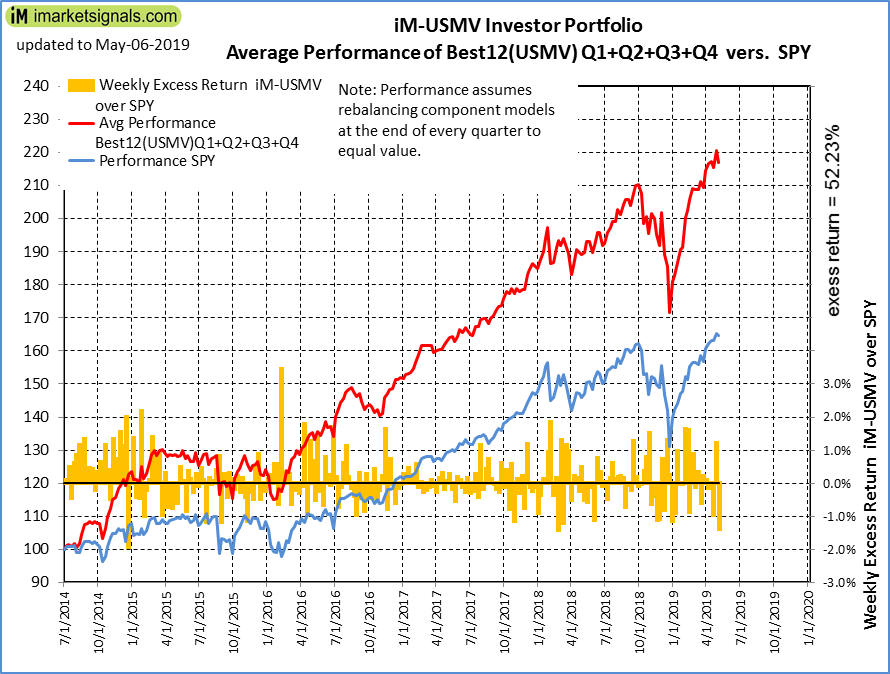 |
Average Performance of iM-Best12(USMV)Q1+Q2+Q3+Q4-Investor resulted in an excess return of 55.52% over SPY. (see iM-USMV Investor Portfolio) |
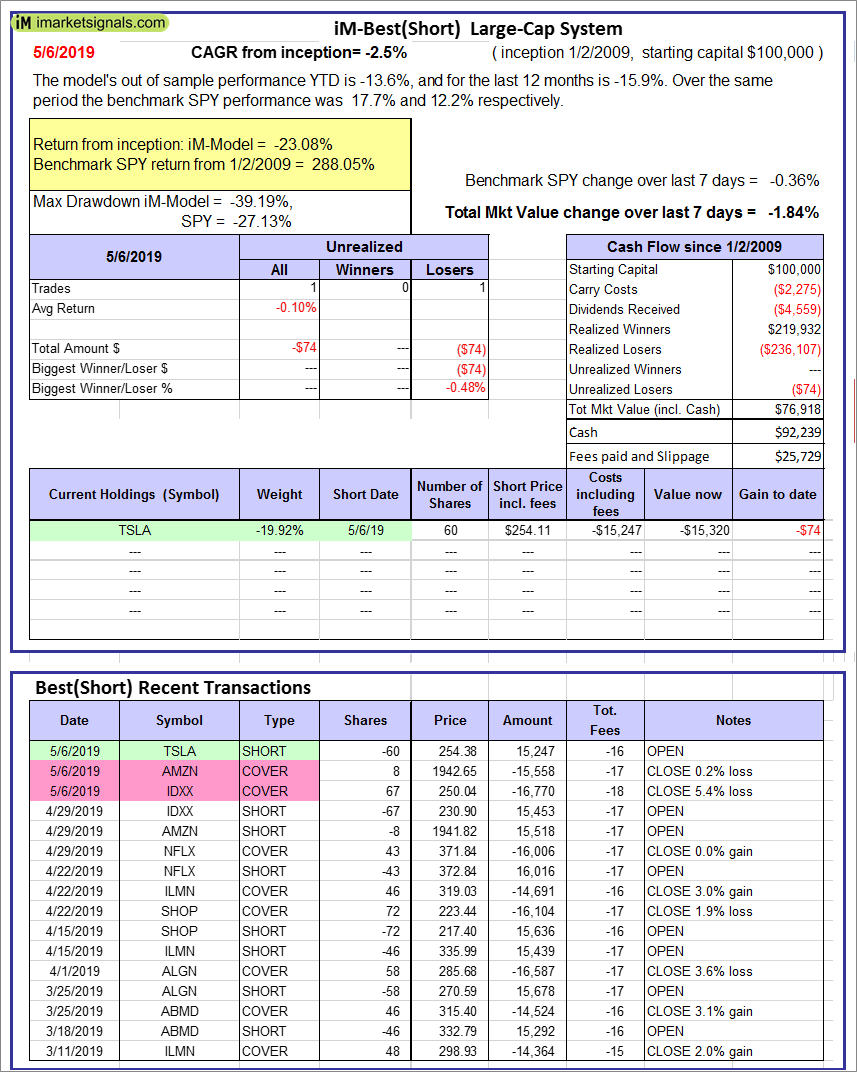 |
iM-Best(Short): The model’s out of sample performance YTD is -13.6%, and for the last 12 months is -15.9%. Over the same period the benchmark SPY performance was 17.7% and 12.2% respectively. Over the previous week the market value of iM-Best(Short) gained -1.84% at a time when SPY gained -0.36%. Over the period 1/2/2009 to 5/6/2019 the starting capital of $100,000 would have grown to $76,918 which includes $92,239 cash and excludes $25,729 spent on fees and slippage. |
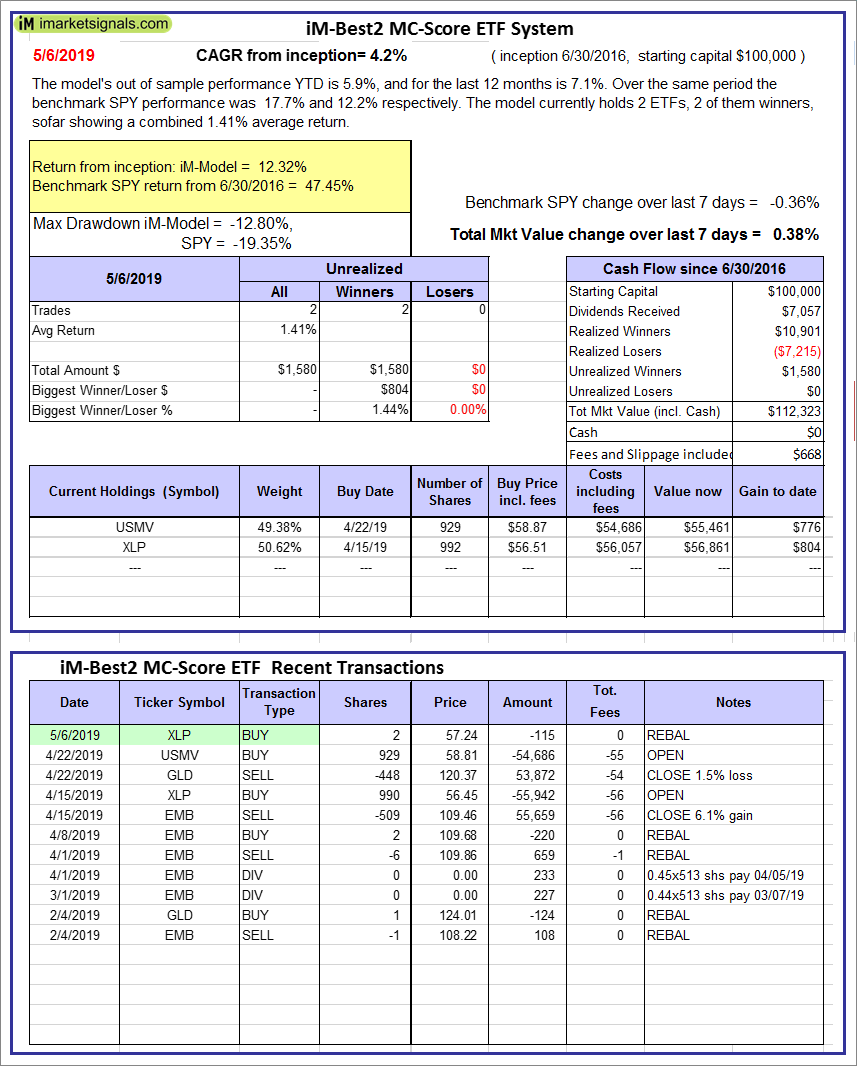 |
iM-Best2 MC-Score ETF System: The model’s out of sample performance YTD is 5.9%, and for the last 12 months is 7.1%. Over the same period the benchmark SPY performance was 17.7% and 12.2% respectively. Over the previous week the market value of the iM-Best2 MC-Score ETF System gained 0.38% at a time when SPY gained -0.36%. A starting capital of $100,000 at inception on 6/30/2016 would have grown to $112,323 which includes $0 cash and excludes $668 spent on fees and slippage. |
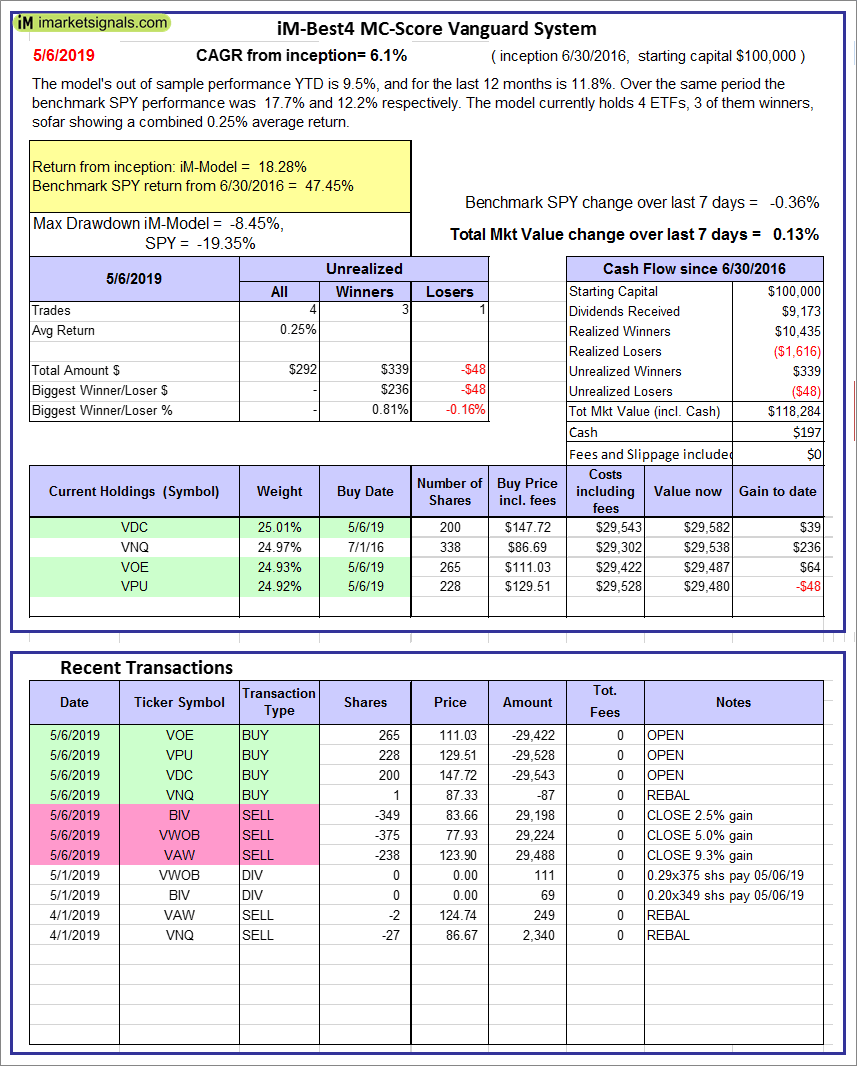 |
iM-Best4 MC-Score Vanguard System: The model’s out of sample performance YTD is 9.5%, and for the last 12 months is 11.8%. Over the same period the benchmark SPY performance was 17.7% and 12.2% respectively. Over the previous week the market value of the iM-Best4 MC-Score Vanguard System gained 0.13% at a time when SPY gained -0.36%. A starting capital of $100,000 at inception on 6/30/2016 would have grown to $118,284 which includes $197 cash and excludes $00 spent on fees and slippage. |
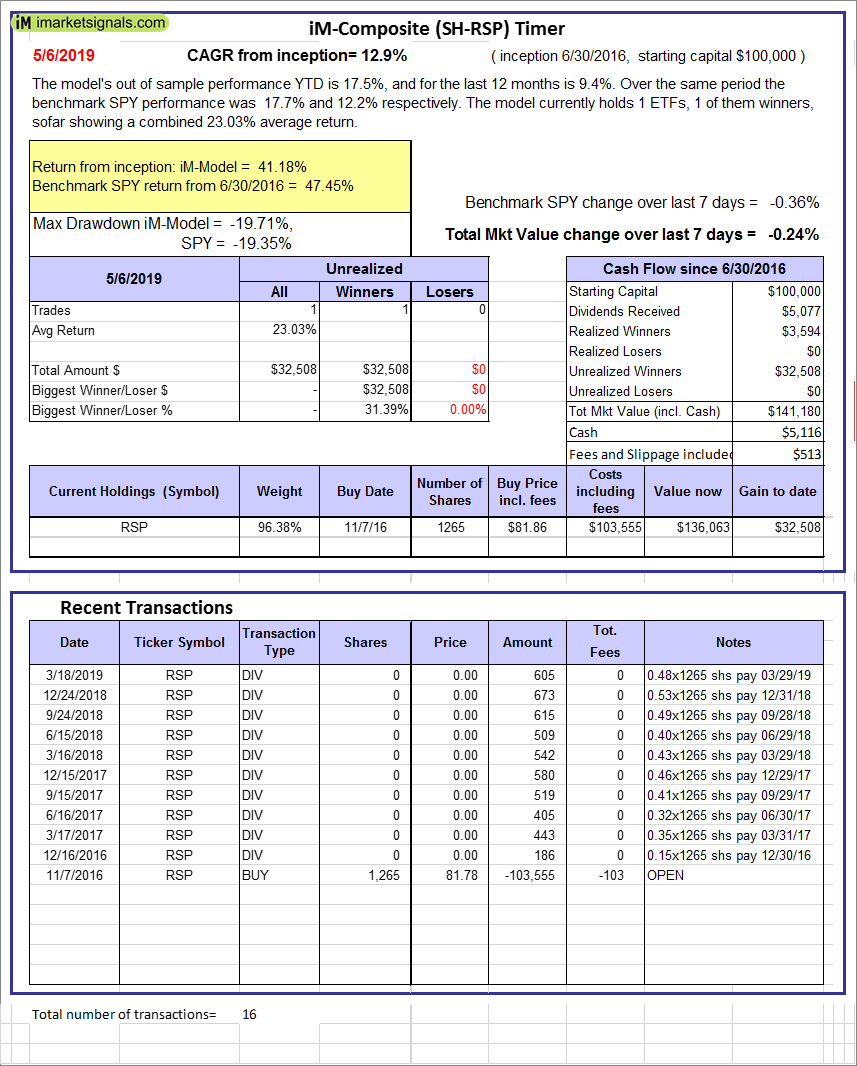 |
iM-Composite (SH-RSP) Timer: The model’s out of sample performance YTD is 17.5%, and for the last 12 months is 9.4%. Over the same period the benchmark SPY performance was 17.7% and 12.2% respectively. Over the previous week the market value of the iM-Composite (SH-RSP) Timer gained -0.24% at a time when SPY gained -0.36%. A starting capital of $100,000 at inception on 6/30/2016 would have grown to $141,180 which includes $5,116 cash and excludes $513 spent on fees and slippage. |
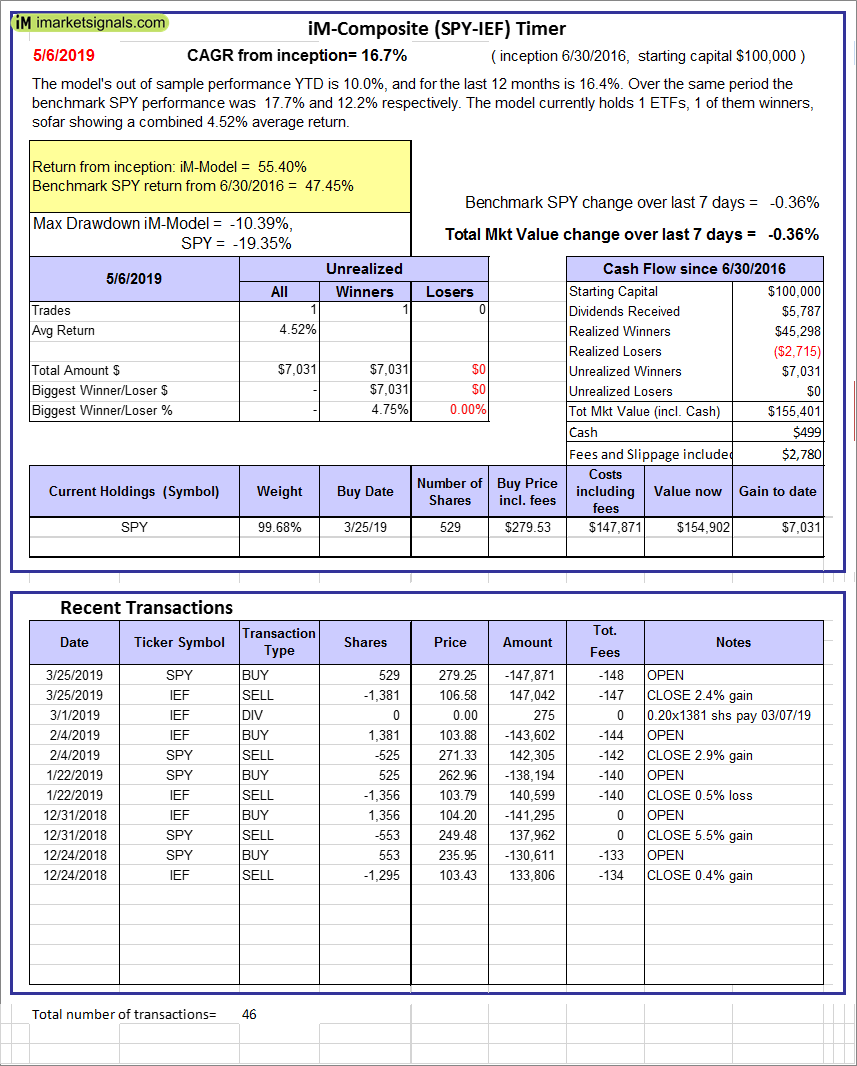 |
iM-Composite (SPY-IEF) Timer: The model’s out of sample performance YTD is 10.0%, and for the last 12 months is 16.4%. Over the same period the benchmark SPY performance was 17.7% and 12.2% respectively. Over the previous week the market value of the iM-Composite (SPY-IEF) Timer gained -0.36% at a time when SPY gained -0.36%. A starting capital of $100,000 at inception on 6/30/2016 would have grown to $155,401 which includes $499 cash and excludes $2,780 spent on fees and slippage. |
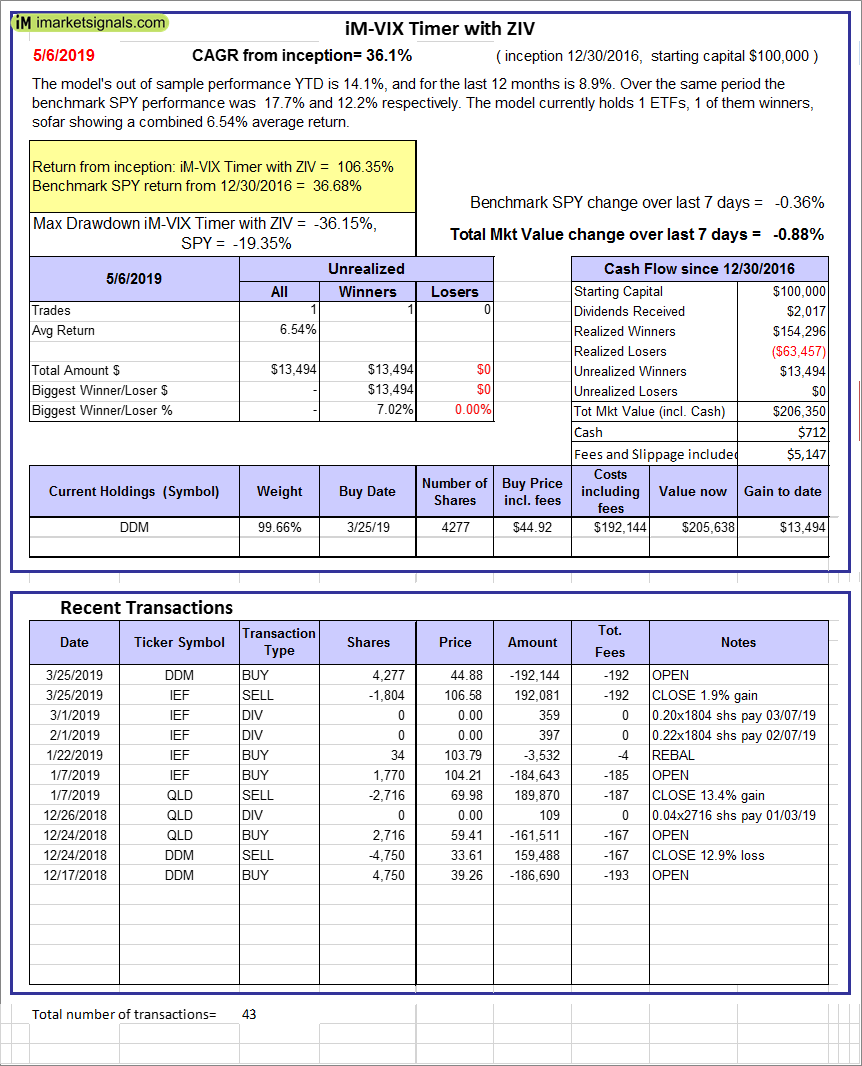 |
iM-VIX Timer with ZIV: The model’s out of sample performance YTD is 14.1%, and for the last 12 months is 8.9%. Over the same period the benchmark SPY performance was 17.7% and 12.2% respectively. Over the previous week the market value of the iM-VIX Timer with ZIV gained -0.88% at a time when SPY gained -0.36%. A starting capital of $100,000 at inception on 6/30/2016 would have grown to $206,350 which includes $712 cash and excludes $5,147 spent on fees and slippage. |
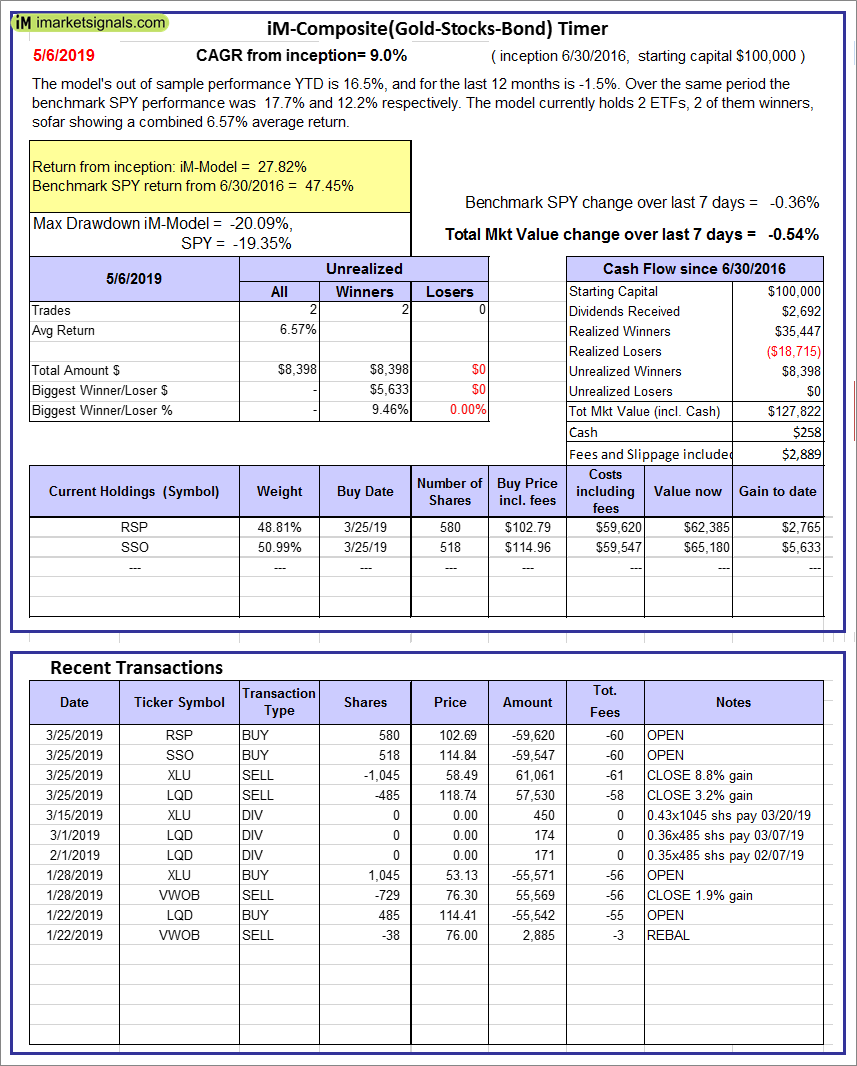 |
iM-Composite(Gold-Stocks-Bond) Timer: The model’s out of sample performance YTD is 16.5%, and for the last 12 months is -1.5%. Over the same period the benchmark SPY performance was 17.7% and 12.2% respectively. Over the previous week the market value of the iM-Composite(Gold-Stocks-Bond) Timer gained -0.54% at a time when SPY gained -0.36%. A starting capital of $100,000 at inception on 6/30/2016 would have grown to $127,822 which includes $258 cash and excludes $2,889 spent on fees and slippage. |
 |
iM-Low Turnover Composite Timer Combo: The model’s out of sample performance YTD is 9.3%, and for the last 12 months is -1.2%. Over the same period the benchmark SPY performance was 17.7% and 12.2% respectively. Over the previous week the market value of the iM-Low Turnover Composite Timer Combo gained -0.38% at a time when SPY gained -0.36%. A starting capital of $100,000 at inception on 3/24/27 would have grown to $105,319 which includes -$639 cash and excludes $813 spent on fees and slippage. |
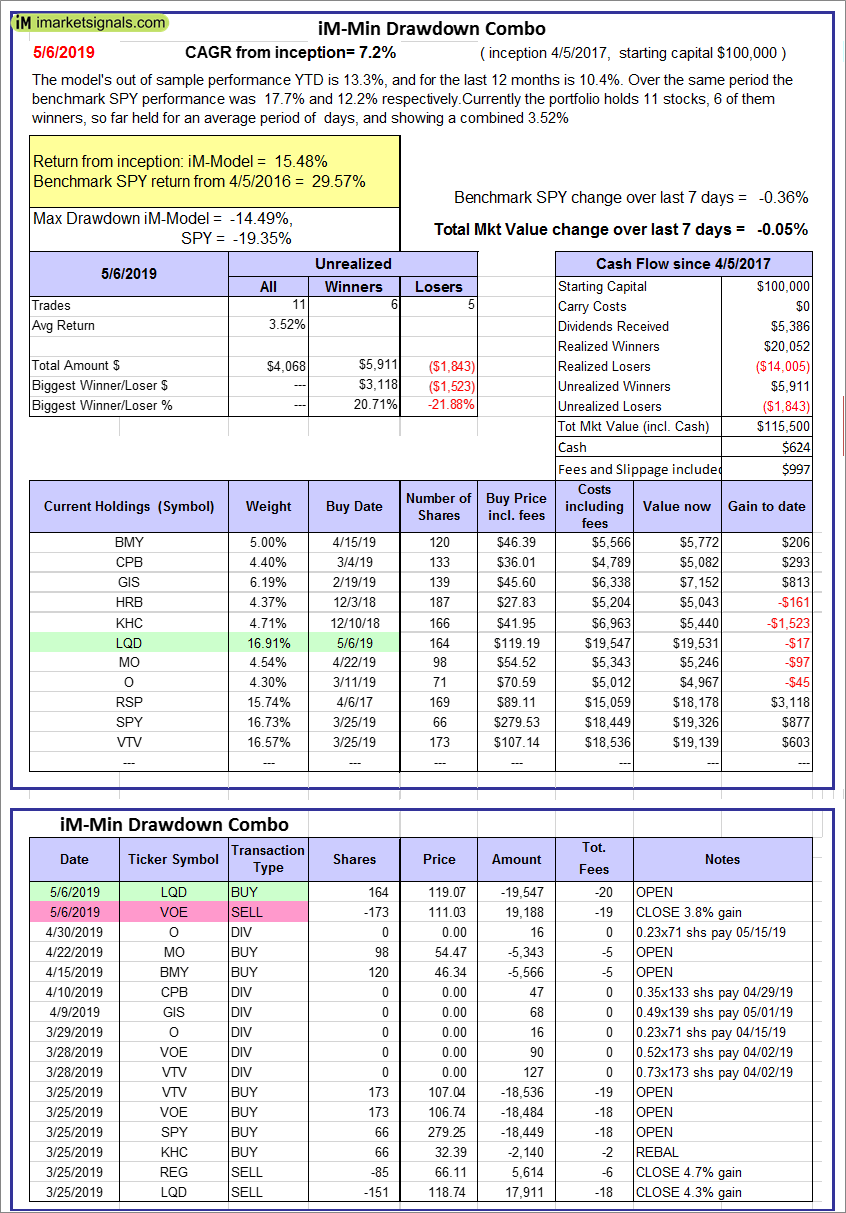 |
iM-Min Drawdown Combo: The model’s out of sample performance YTD is 13.3%, and for the last 12 months is 10.4%. Over the same period the benchmark SPY performance was 17.7% and 12.2% respectively. Over the previous week the market value of the iM-Min Drawdown Combo gained -0.05% at a time when SPY gained -0.36%. A starting capital of $100,000 at inception on 4/5/2017 would have grown to $115,500 which includes $624 cash and excludes $997 spent on fees and slippage. |
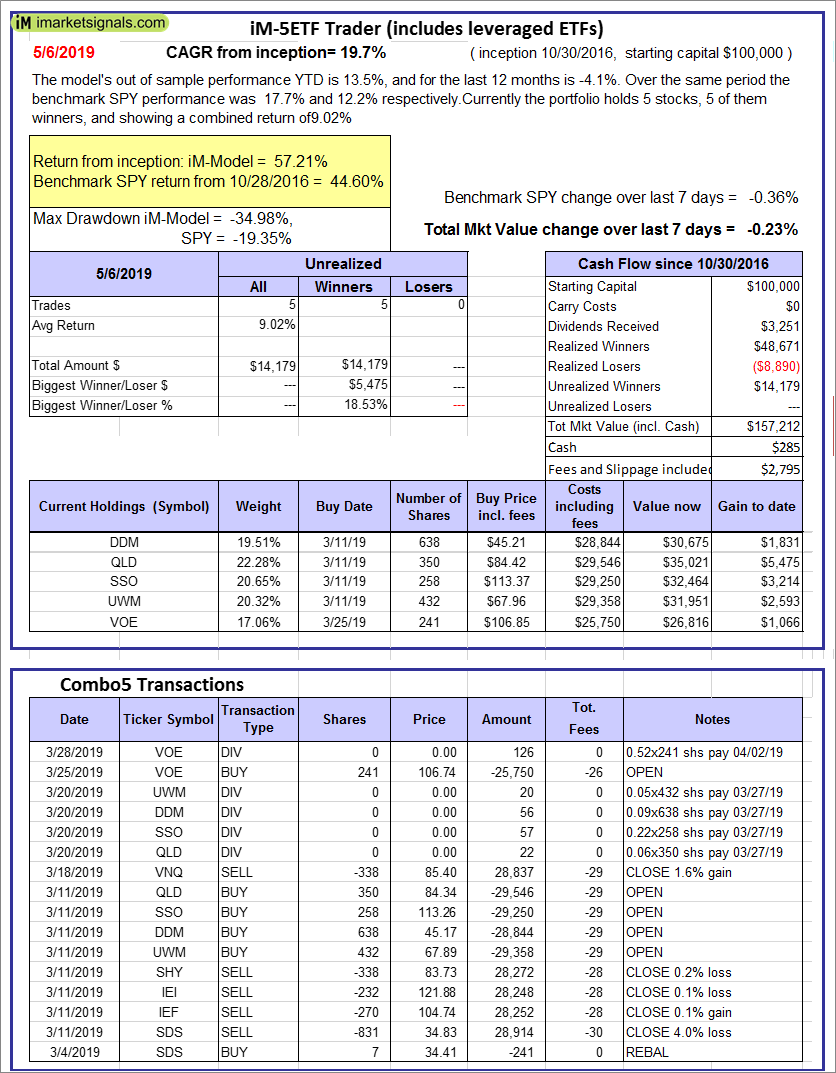 |
iM-5ETF Trader (includes leveraged ETFs): The model’s out of sample performance YTD is 13.5%, and for the last 12 months is -4.1%. Over the same period the benchmark SPY performance was 17.7% and 12.2% respectively. Over the previous week the market value of the iM-5ETF Trader (includes leveraged ETFs) gained -0.23% at a time when SPY gained -0.36%. A starting capital of $100,000 at inception on 10/30/2016 would have grown to $157,212 which includes $285 cash and excludes $2,795 spent on fees and slippage. |
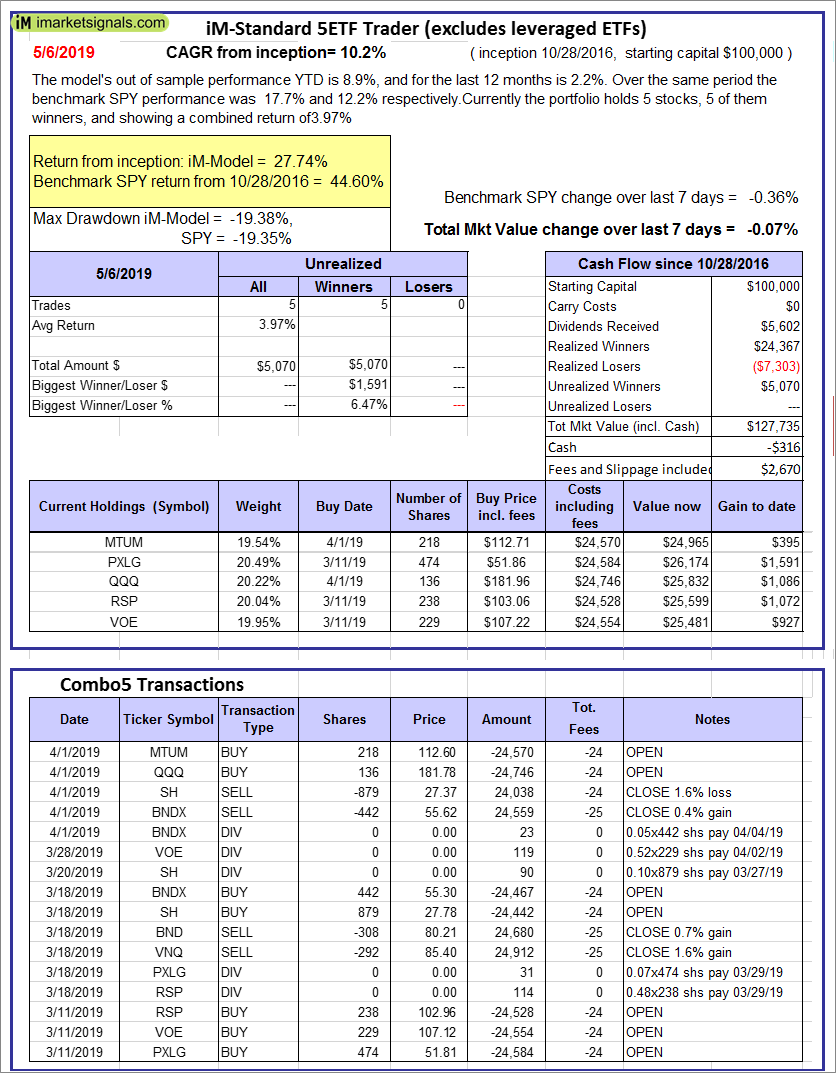 |
iM-Standard 5ETF Trader (excludes leveraged ETFs): The model’s out of sample performance YTD is 8.9%, and for the last 12 months is 2.2%. Over the same period the benchmark SPY performance was 17.7% and 12.2% respectively. Over the previous week the market value of the iM-Standard 5ETF Trader (excludes leveraged ETFs) gained -0.07% at a time when SPY gained -0.36%. A starting capital of $100,000 at inception on 10/30/2016 would have grown to $127,735 which includes -$316 cash and excludes $2,670 spent on fees and slippage. |
iM-Best Reports – 5/6/2019
Posted in pmp SPY-SH
Leave a Reply
You must be logged in to post a comment.