  |
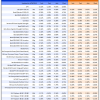
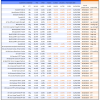
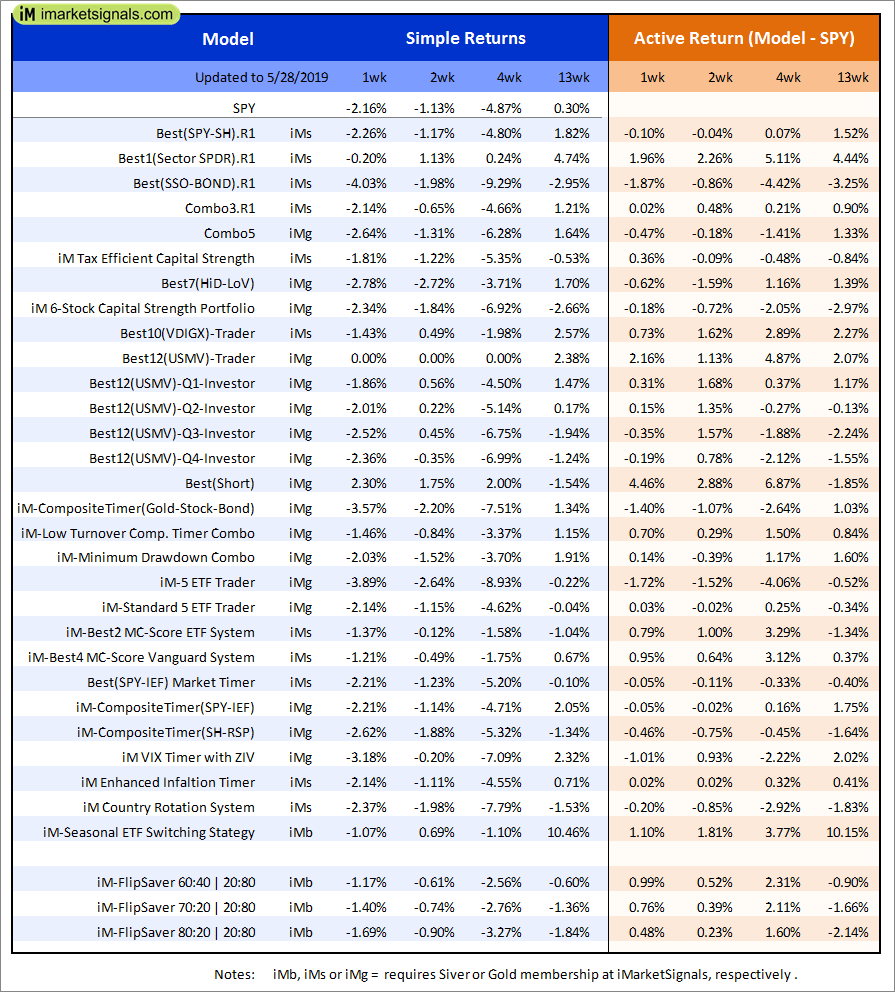
Out of sample performance summary of our models for the past 1, 2, 4 and 13 week periods. The active active return indicates how the models over- or underperformed the benchmark ETF SPY. Also the YTD, and the 1-, 3-, 5- and 10-year annualized returns are shown in the second table |
|
|
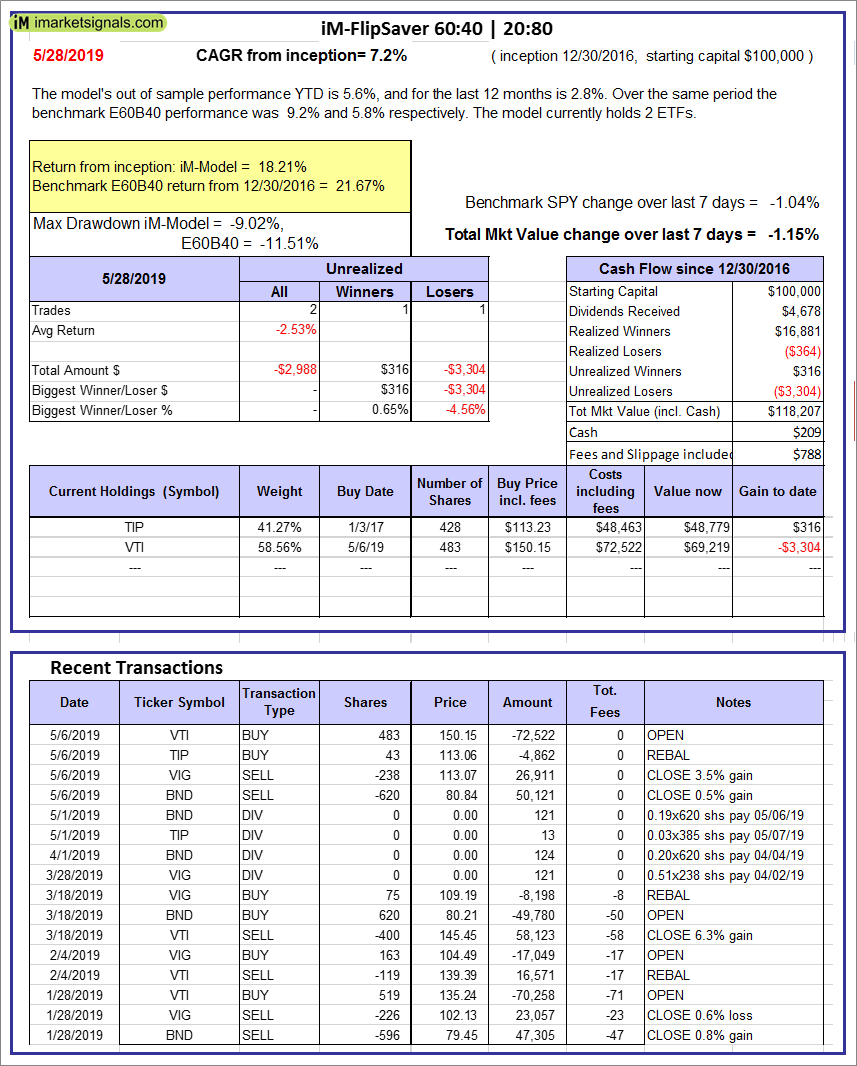
iM-FlipSaver 60:40 | 20:80 – 2017: The model’s out of sample performance YTD is 5.6%, and for the last 12 months is 2.8%. Over the same period the benchmark E60B40 performance was 9.2% and 5.8% respectively. Over the previous week the market value of iM-FlipSaver 80:20 | 20:80 gained -1.15% at a time when SPY gained -1.04%. A starting capital of $100,000 at inception on 7/16/2015 would have grown to $118,207 which includes $209 cash and excludes $788 spent on fees and slippage. |
|
|
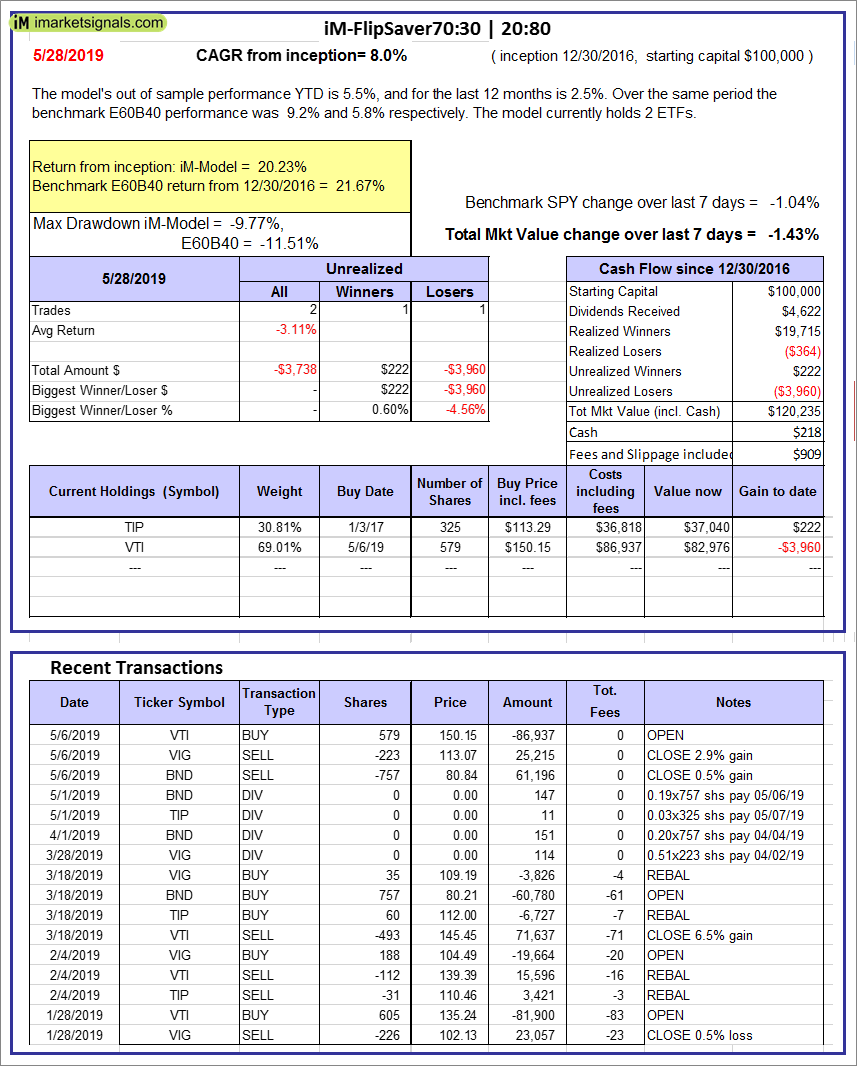
iM-FlipSaver 70:30 | 20:80 – 2017: The model’s out of sample performance YTD is 5.5%, and for the last 12 months is 2.5%. Over the same period the benchmark E60B40 performance was 9.2% and 5.8% respectively. Over the previous week the market value of iM-FlipSaver 70:30 | 20:80 gained -1.43% at a time when SPY gained -1.04%. A starting capital of $100,000 at inception on 7/15/2015 would have grown to $120,235 which includes $218 cash and excludes $909 spent on fees and slippage. |
|
|
iM-FlipSaver 80:20 | 20:80 – 2017: The model’s out of sample performance YTD is 5.4%, and for the last 12 months is 2.2%. Over the same period the benchmark E60B40 performance was 9.2% and 5.8% respectively. Over the previous week the market value of iM-FlipSaver 80:20 | 20:80 gained -1.70% at a time when SPY gained -1.04%. A starting capital of $100,000 at inception on 1/2/2017 would have grown to $122,241 which includes $319 cash and excludes $1,024 spent on fees and slippage. |
|
|
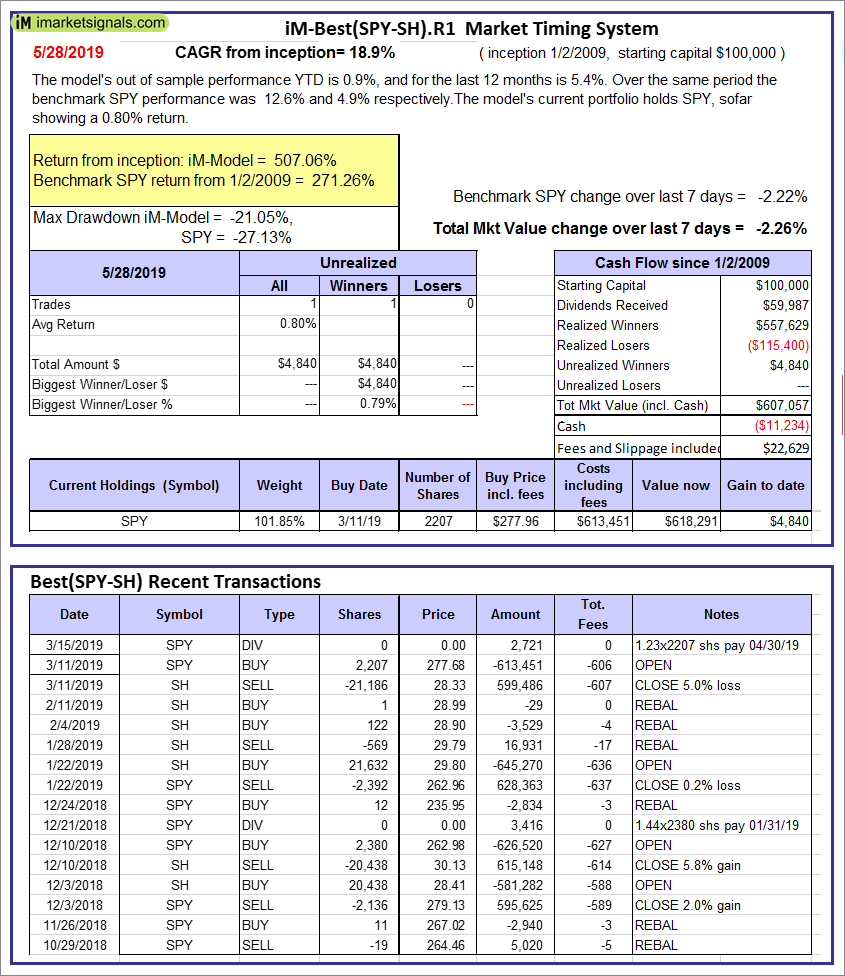
iM-Best(SPY-SH).R1: The model’s out of sample performance YTD is 0.9%, and for the last 12 months is 5.4%. Over the same period the benchmark SPY performance was 12.6% and 4.9% respectively. Over the previous week the market value of Best(SPY-SH) gained -2.26% at a time when SPY gained -2.22%. A starting capital of $100,000 at inception on 1/2/2009 would have grown to $607,057 which includes -$11,234 cash and excludes $22,629 spent on fees and slippage. |
|
|
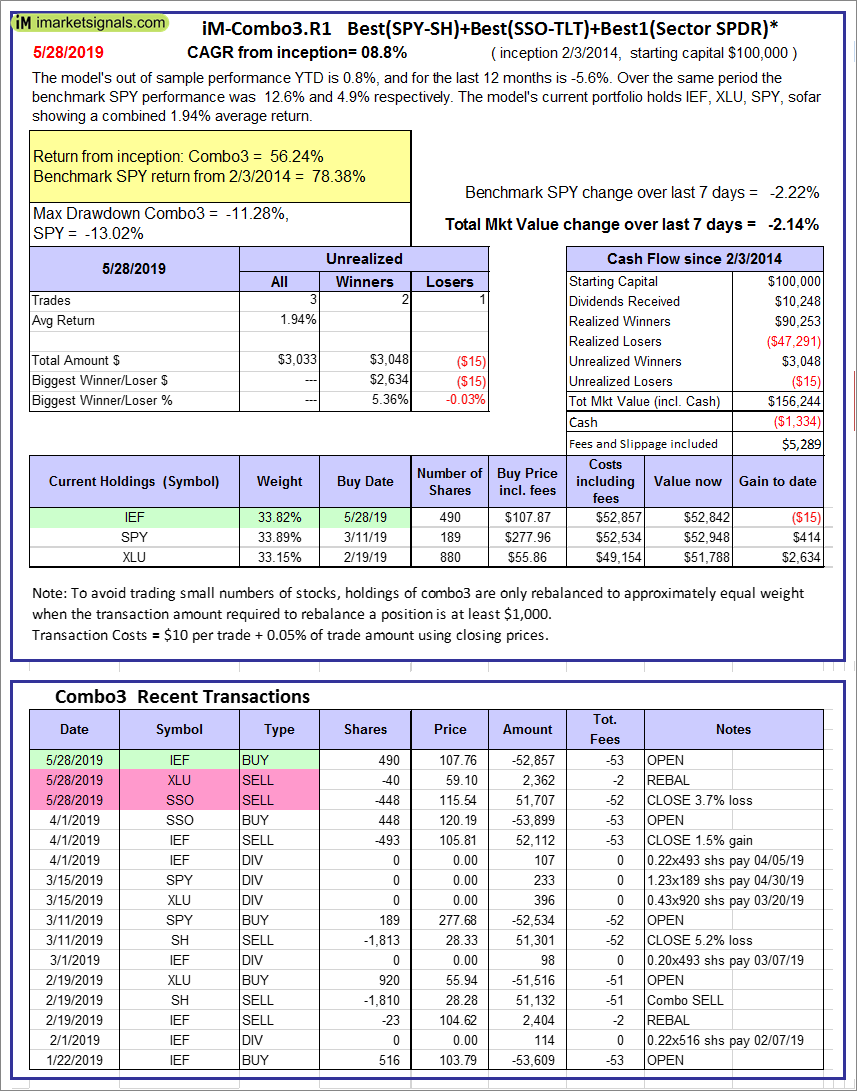
iM-Combo3.R1: The model’s out of sample performance YTD is 0.8%, and for the last 12 months is -5.6%. Over the same period the benchmark SPY performance was 12.6% and 4.9% respectively. Over the previous week the market value of iM-Combo3.R1 gained -2.14% at a time when SPY gained -2.22%. A starting capital of $100,000 at inception on 2/3/2014 would have grown to $156,244 which includes -$1,334 cash and excludes $5,289 spent on fees and slippage. |
|
|
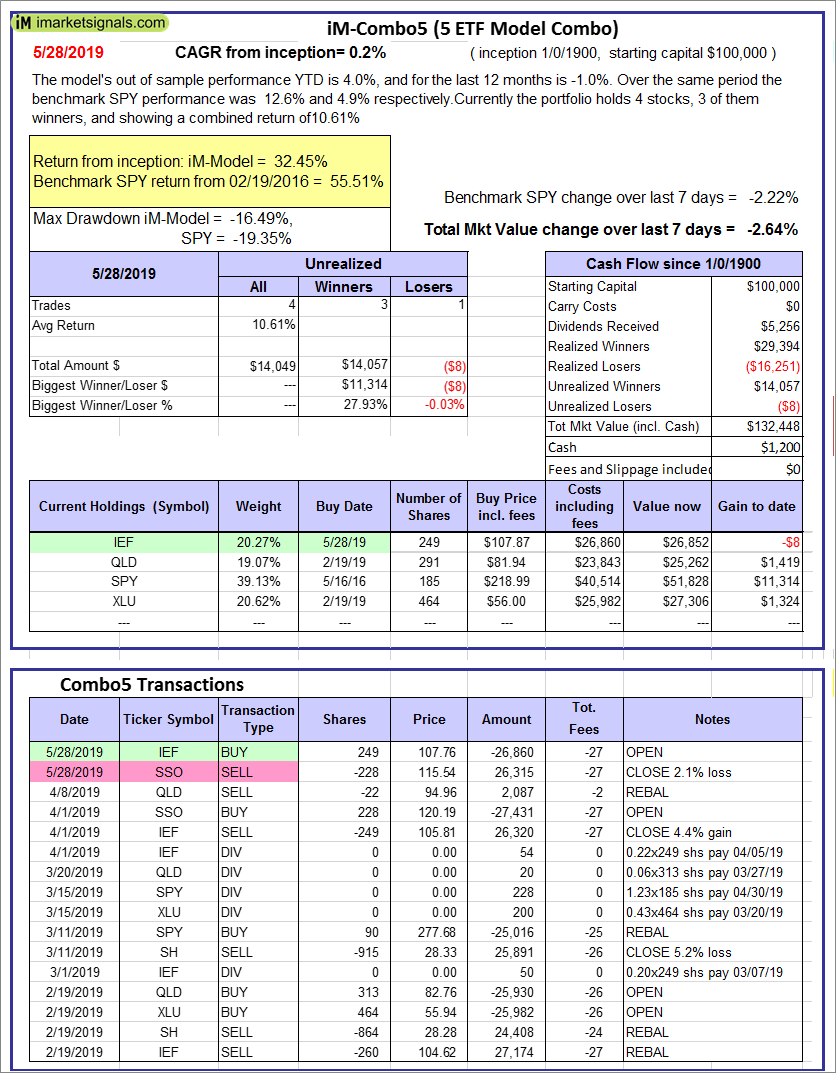
iM-Combo5: The model’s out of sample performance YTD is 4.0%, and for the last 12 months is -1.0%. Over the same period the benchmark SPY performance was 12.6% and 4.9% respectively. Over the previous week the market value of iM-Combo5 gained -2.64% at a time when SPY gained -2.22%. A starting capital of $100,000 at inception on 2/22/2016 would have grown to $132,448 which includes $1,200 cash and excludes $0 spent on fees and slippage. |
|
|
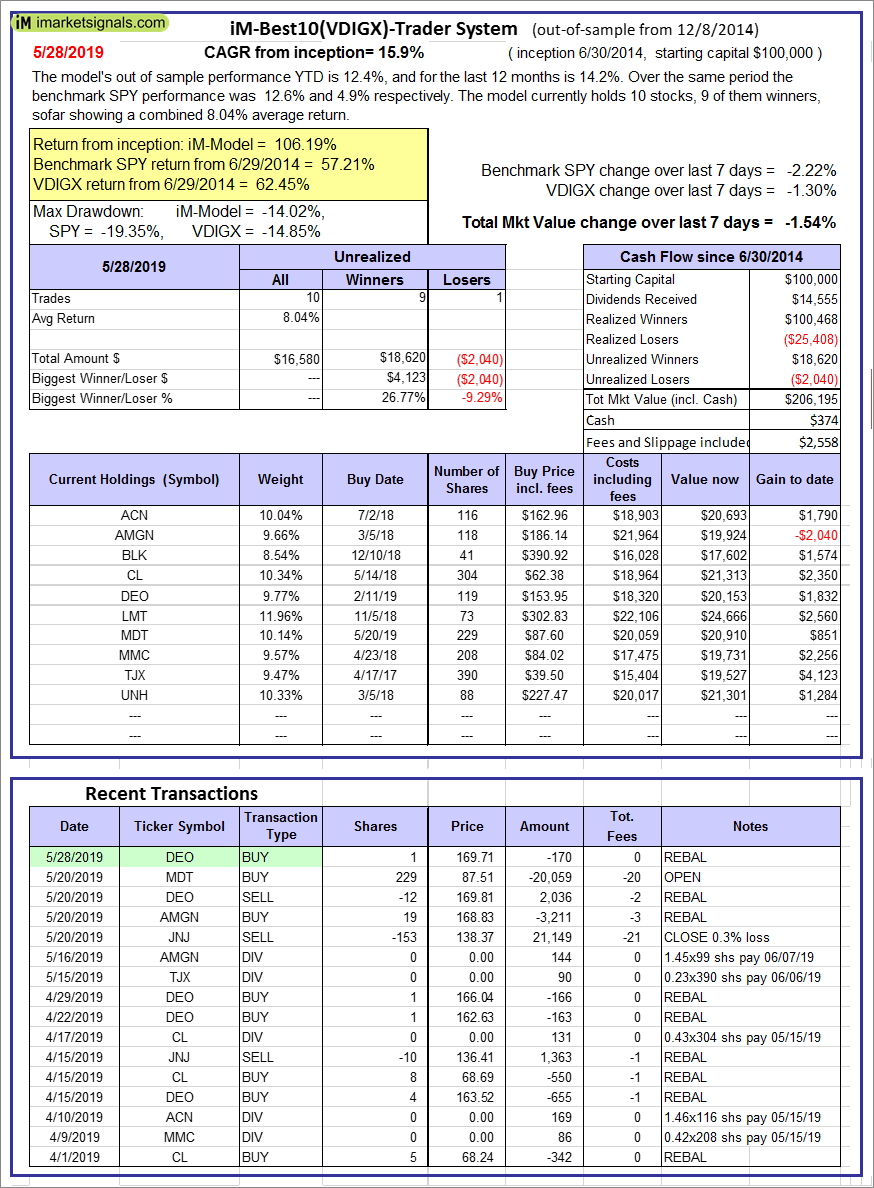
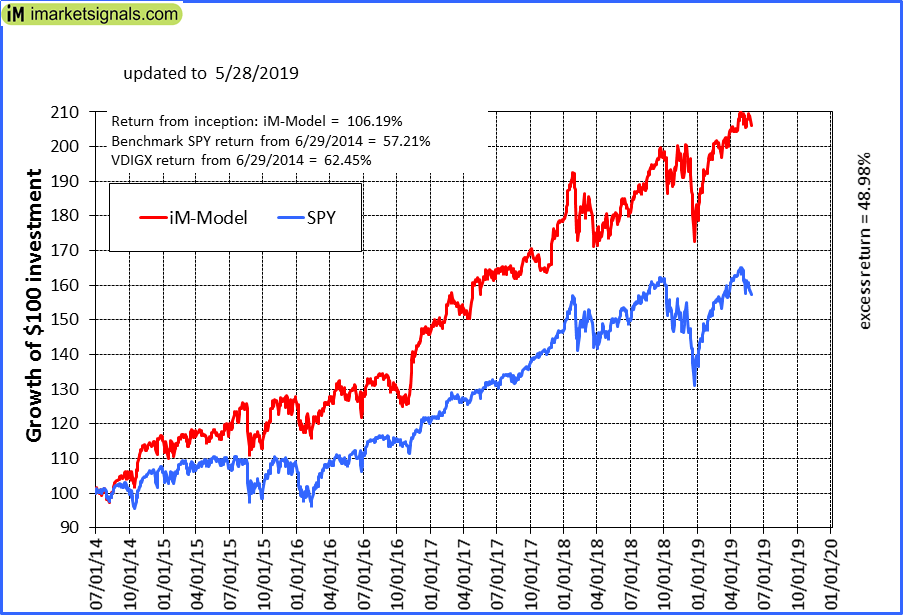
iM-Best10(VDIGX)-Trader: The model’s out of sample performance YTD is 12.4%, and for the last 12 months is 14.2%. Over the same period the benchmark SPY performance was 12.6% and 4.9% respectively. Since inception, on 7/1/2014, the model gained 106.19% while the benchmark SPY gained 57.21% and VDIGX gained 62.45% over the same period. Over the previous week the market value of iM-Best10(VDIGX) gained -1.54% at a time when SPY gained -2.22%. A starting capital of $100,000 at inception on 7/1/2014 would have grown to $206,195 which includes $374 cash and excludes $2,558 spent on fees and slippage. |
|
|
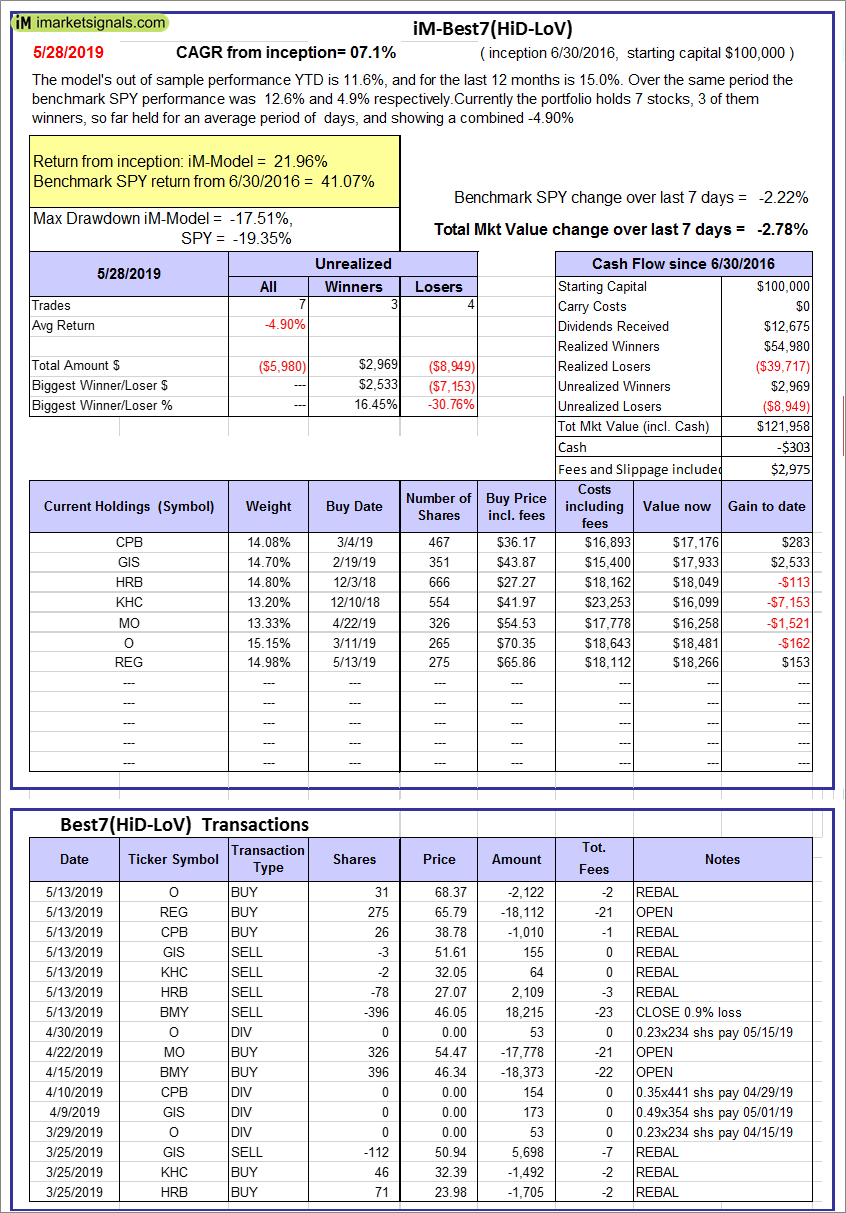
iM-Best7(HiD-LoV): The model’s out of sample performance YTD is 11.6%, and for the last 12 months is 15.0%. Over the same period the benchmark SPY performance was 12.6% and 4.9% respectively. Over the previous week the market value of iM-Best7(HiD-LoV) gained -2.78% at a time when SPY gained -2.22%. A starting capital of $100,000 at inception on 6/30/2016 would have grown to $121,958 which includes -$303 cash and excludes $2,975 spent on fees and slippage. |
|
|
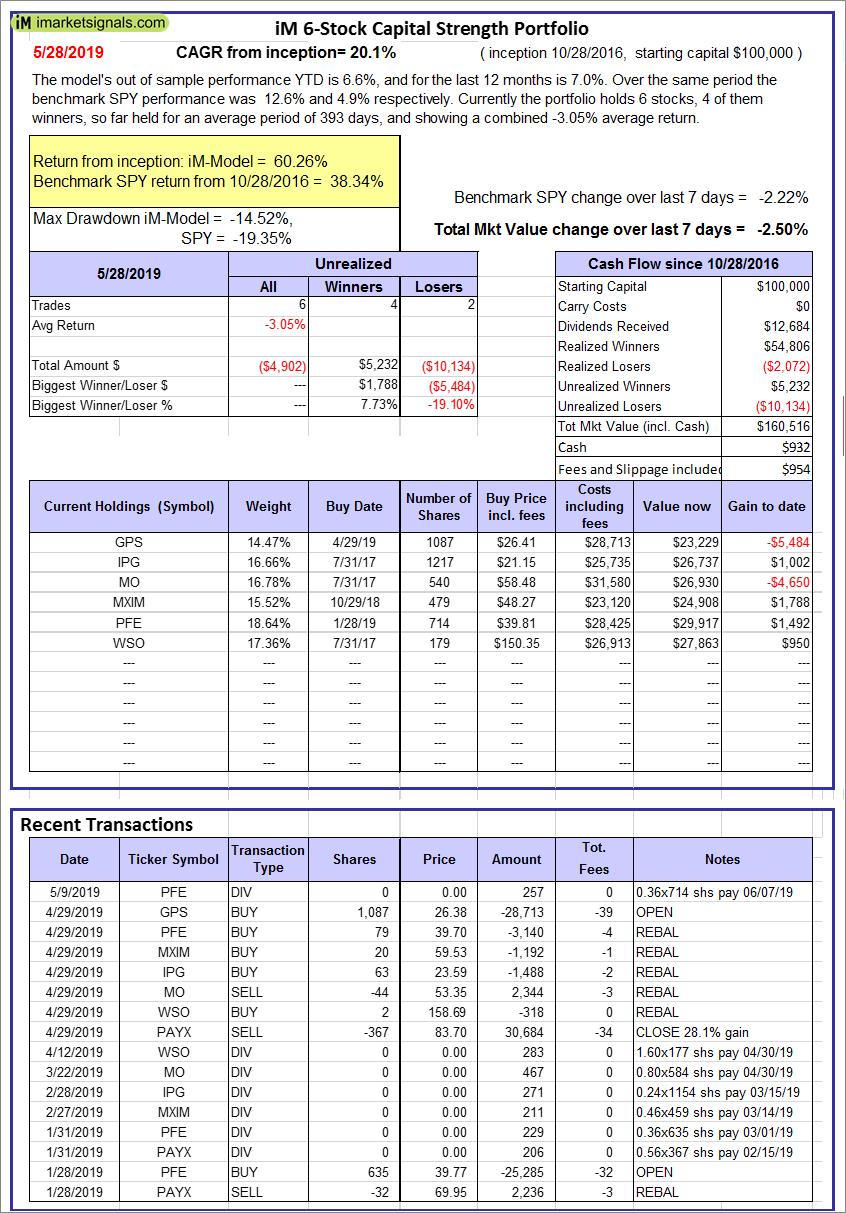
iM 6-Stock Capital Strength Portfolio: The model’s out of sample performance YTD is 6.6%, and for the last 12 months is 7.0%. Over the same period the benchmark SPY performance was 12.6% and 4.9% respectively. Over the previous week the market value of the iM 6-Stock Capital Strength Portfolio gained -2.50% at a time when SPY gained -2.22%. A starting capital of $100,000 at inception on 10/28/2016 would have grown to $160,516 which includes $932 cash and excludes $954 spent on fees and slippage. |
|
|
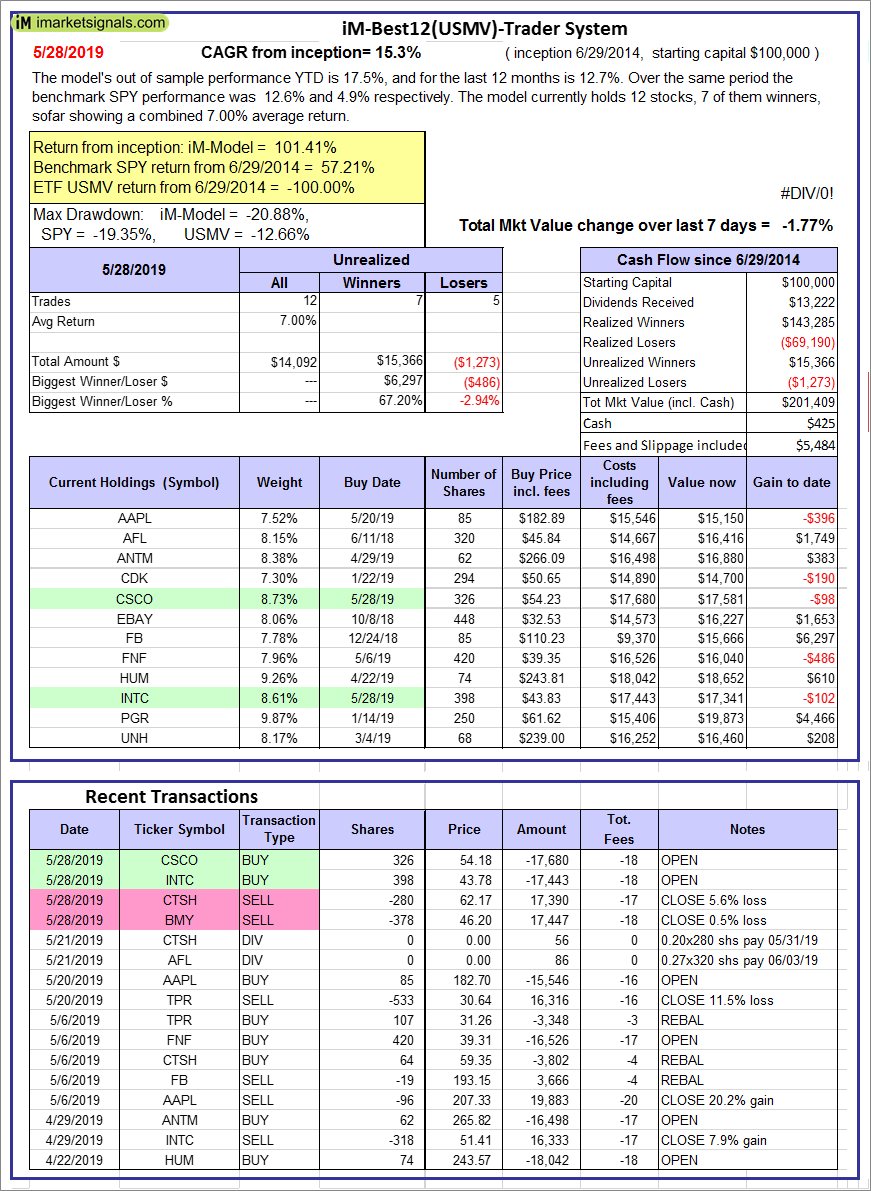
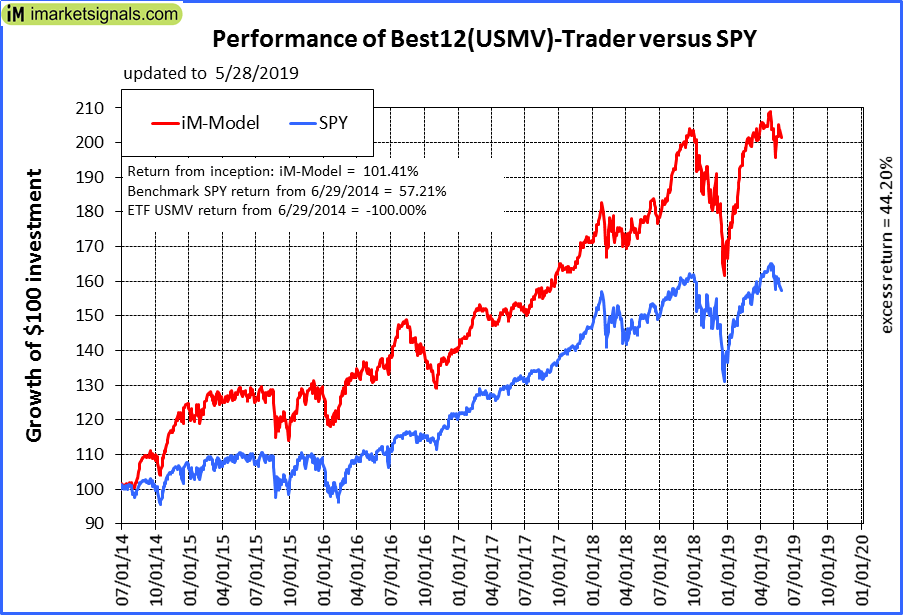
iM-Best12(USMV)-Trader: The model’s out of sample performance YTD is 17.5%, and for the last 12 months is 12.7%. Over the same period the benchmark SPY performance was 12.6% and 4.9% respectively. Since inception, on 6/30/2014, the model gained 101.41% while the benchmark SPY gained 57.21% and the ETF USMV gained -100.00% over the same period. Over the previous week the market value of iM-Best12(USMV)-Trader gained -1.77% at a time when SPY gained -2.22%. A starting capital of $100,000 at inception on 6/30/2014 would have grown to $201,409 which includes $425 cash and excludes $5,484 spent on fees and slippage. |
|
|
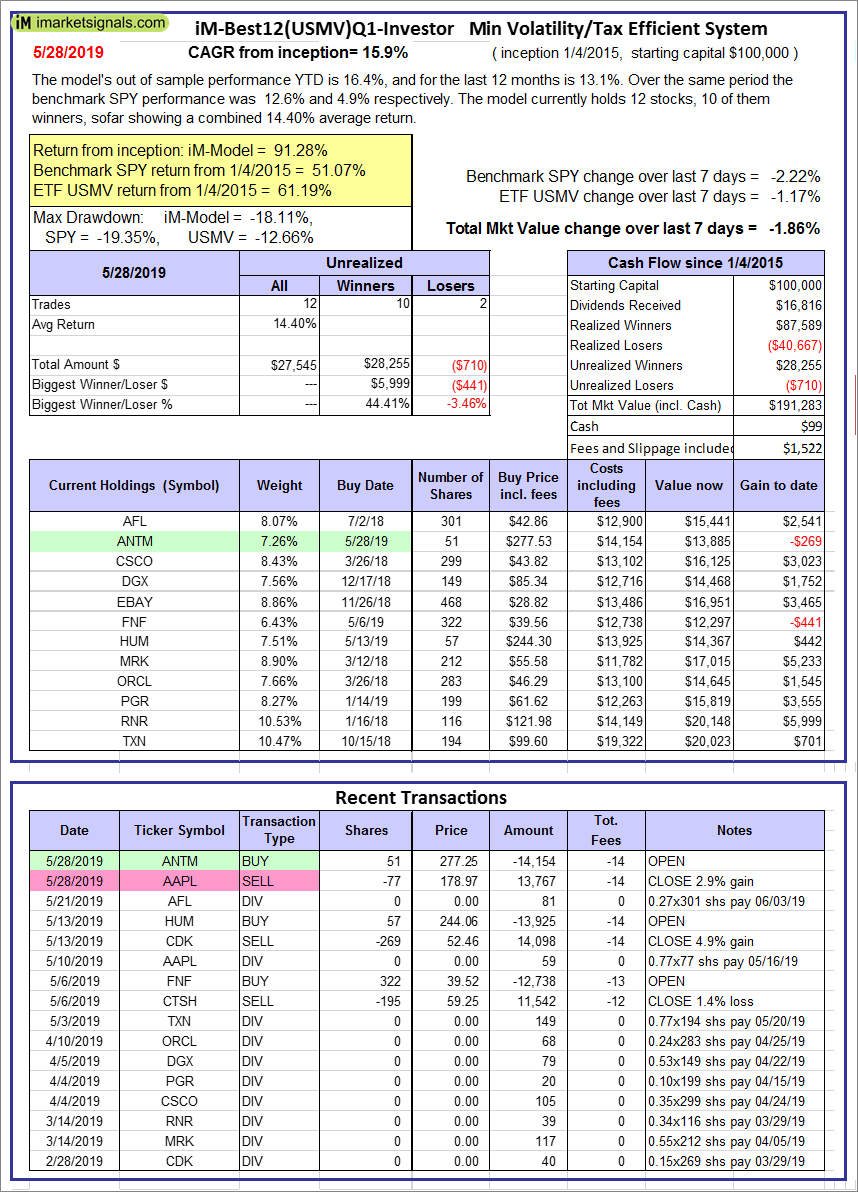
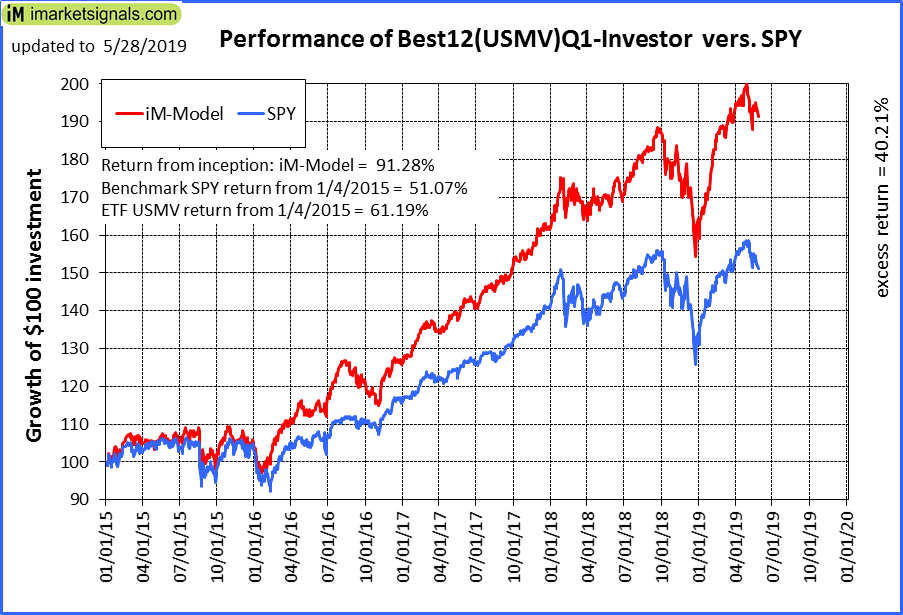
iM-Best12(USMV)Q1-Investor: The model’s out of sample performance YTD is 16.4%, and for the last 12 months is 13.1%. Over the same period the benchmark SPY performance was 12.6% and 4.9% respectively. Since inception, on 1/5/2015, the model gained 91.28% while the benchmark SPY gained 51.07% and the ETF USMV gained 61.19% over the same period. Over the previous week the market value of iM-Best12(USMV)Q1 gained -1.86% at a time when SPY gained -2.22%. A starting capital of $100,000 at inception on 1/5/2015 would have grown to $191,283 which includes $99 cash and excludes $1,522 spent on fees and slippage. |
|
|
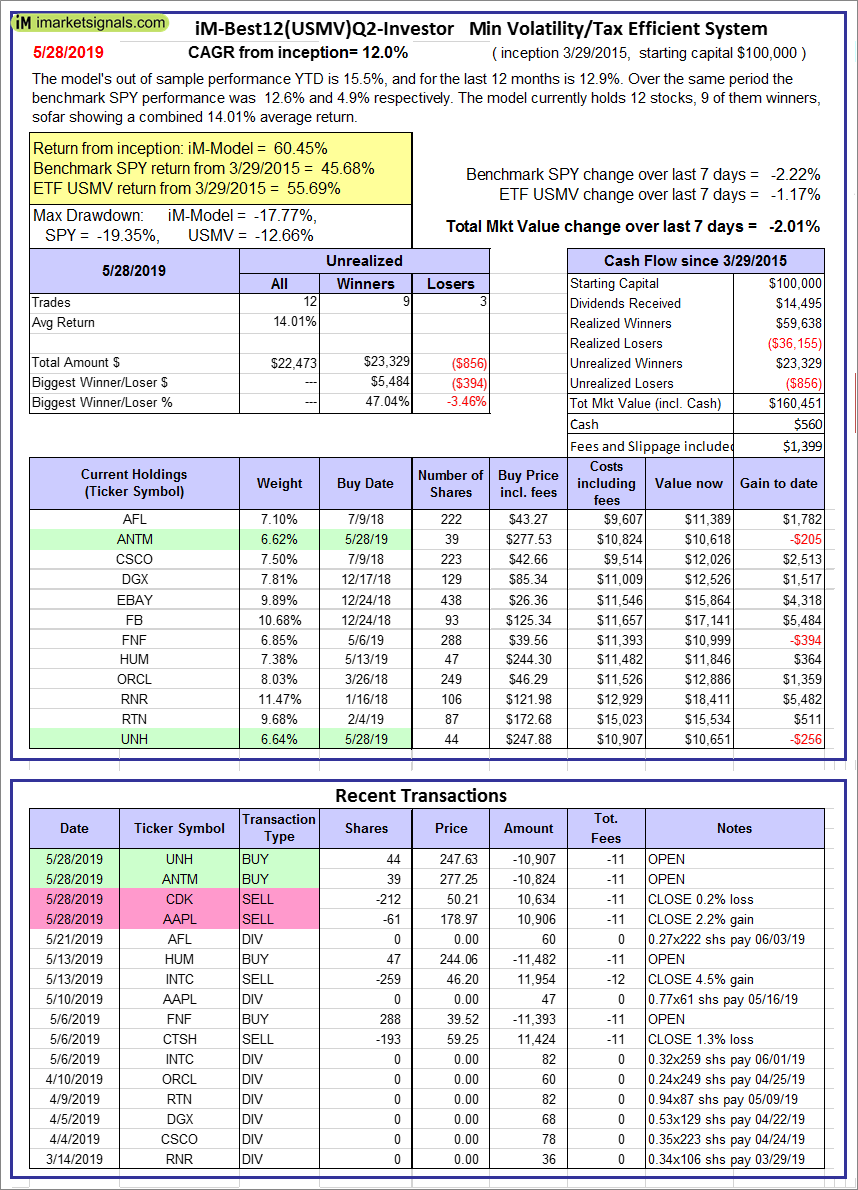
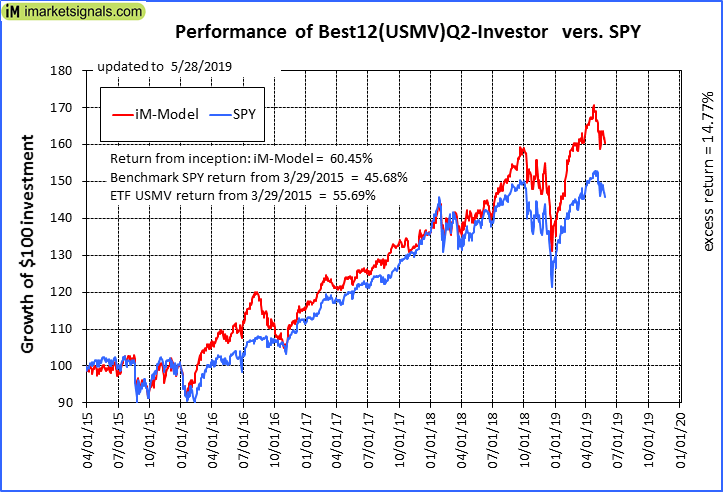
iM-Best12(USMV)Q2-Investor: The model’s out of sample performance YTD is 15.5%, and for the last 12 months is 12.9%. Over the same period the benchmark SPY performance was 12.6% and 4.9% respectively. Since inception, on 3/30/2015, the model gained 60.45% while the benchmark SPY gained 45.68% and the ETF USMV gained 55.69% over the same period. Over the previous week the market value of iM-Best12(USMV)Q2 gained -2.01% at a time when SPY gained -2.22%. A starting capital of $100,000 at inception on 3/30/2015 would have grown to $160,451 which includes $560 cash and excludes $1,399 spent on fees and slippage. |
|
|
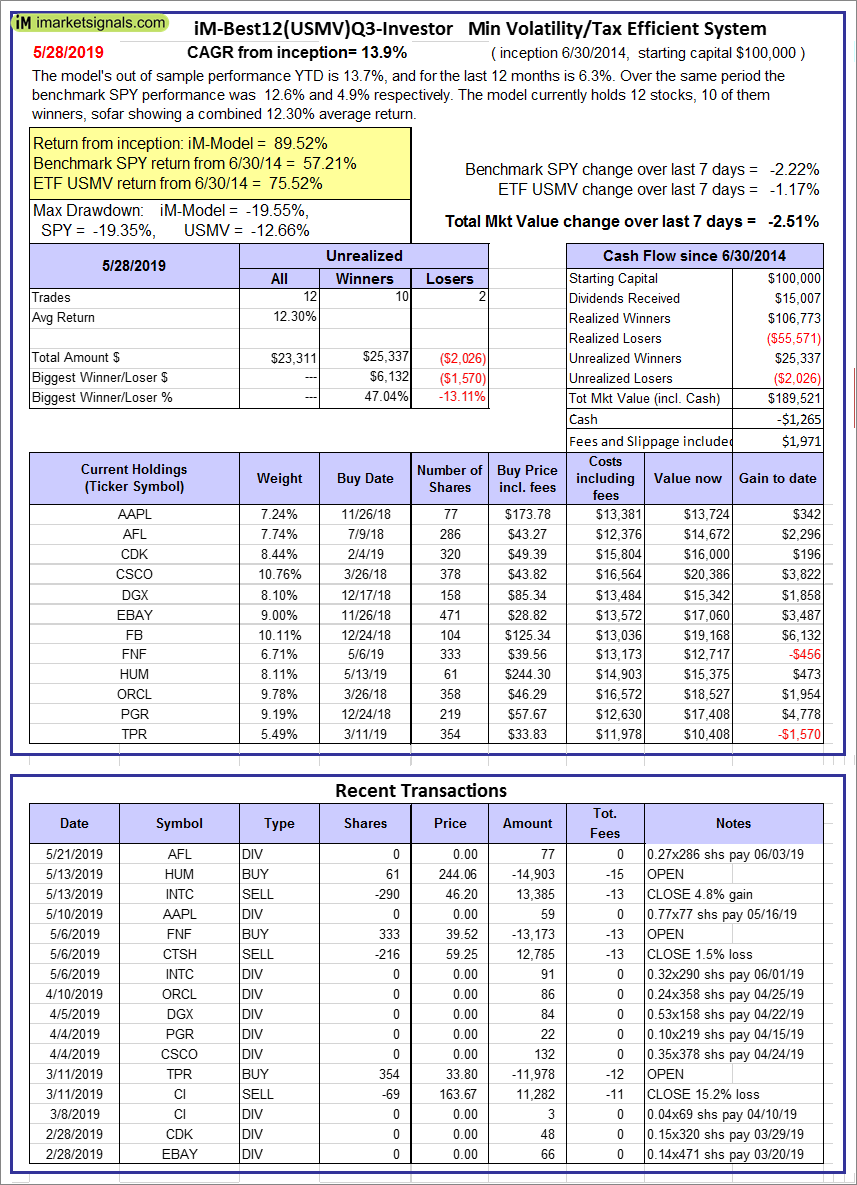
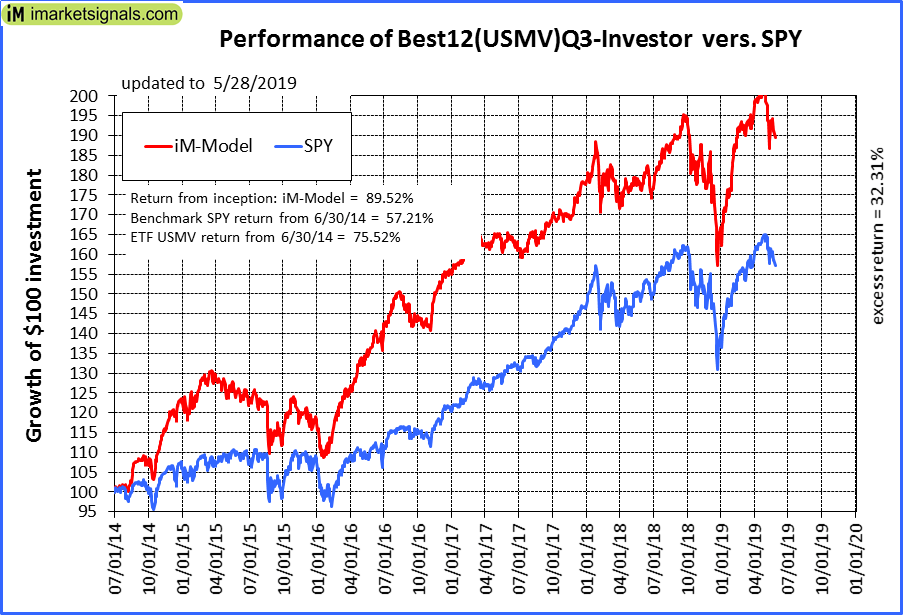
iM-Best12(USMV)Q3-Investor: The model’s out of sample performance YTD is 13.7%, and for the last 12 months is 6.3%. Over the same period the benchmark SPY performance was 12.6% and 4.9% respectively. Since inception, on 7/1/2014, the model gained 89.52% while the benchmark SPY gained 57.21% and the ETF USMV gained 75.52% over the same period. Over the previous week the market value of iM-Best12(USMV)Q3 gained -2.51% at a time when SPY gained -2.22%. A starting capital of $100,000 at inception on 7/1/2014 would have grown to $189,521 which includes -$1,265 cash and excludes $1,971 spent on fees and slippage. |
|
|
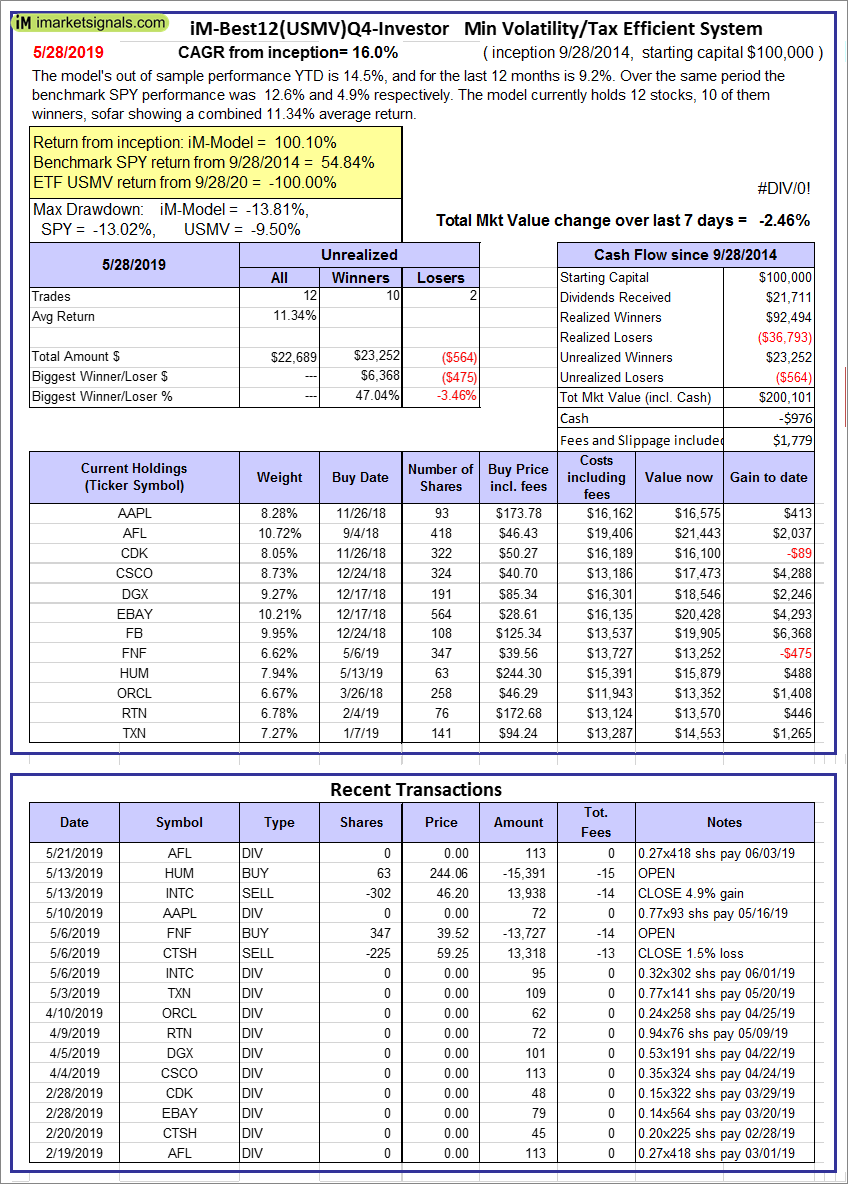
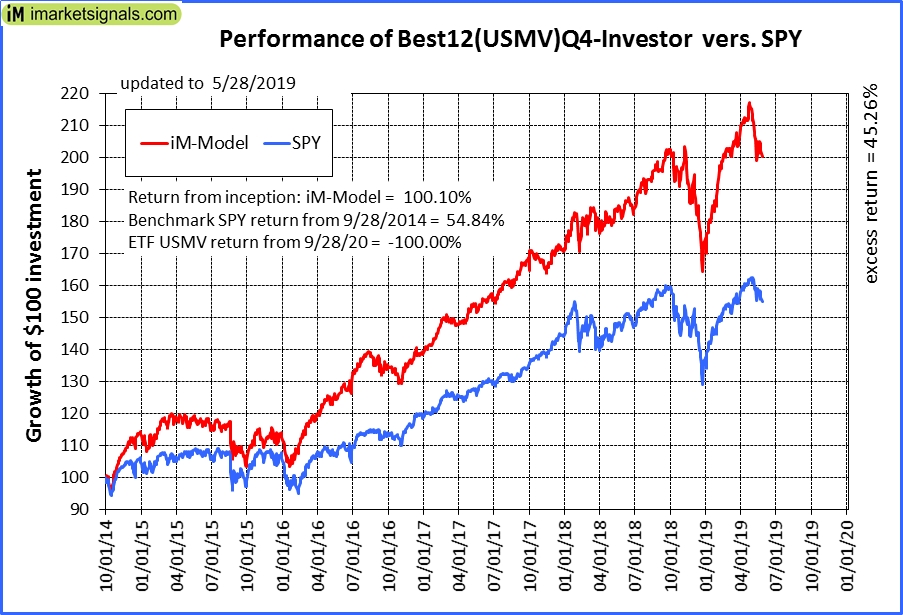
iM-Best12(USMV)Q4-Investor: Since inception, on 9/29/2014, the model gained 100.10% while the benchmark SPY gained 54.84% and the ETF USMV gained -100.00% over the same period. Over the previous week the market value of iM-Best12(USMV)Q4 gained -2.46% at a time when SPY gained -2.22%. A starting capital of $100,000 at inception on 9/29/2014 would have grown to $200,101 which includes -$976 cash and excludes $1,779 spent on fees and slippage. |
|
|
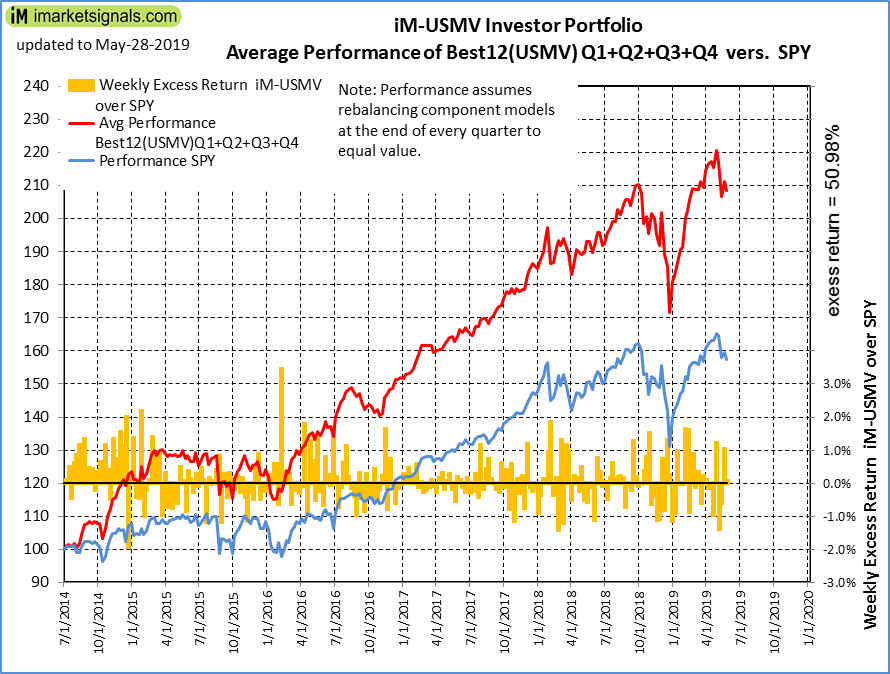
Average Performance of iM-Best12(USMV)Q1+Q2+Q3+Q4-Investor resulted in an excess return of 50.98% over SPY. (see iM-USMV Investor Portfolio) |
|
|
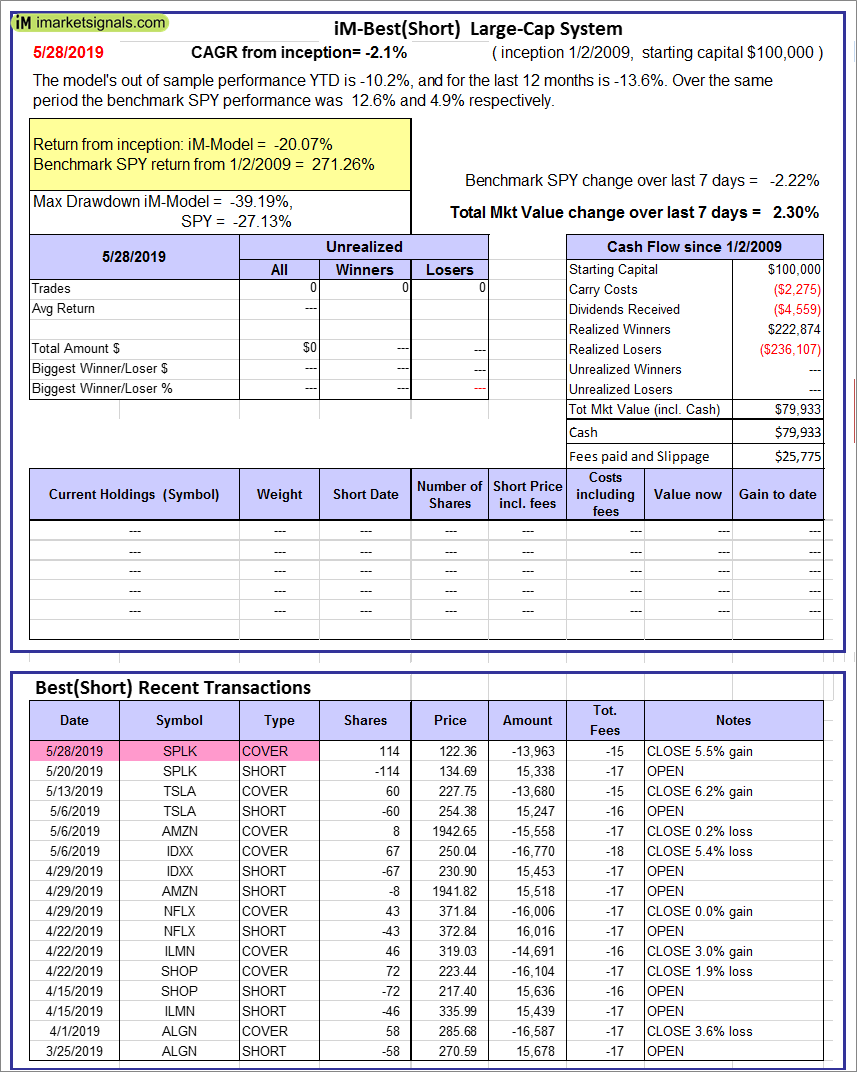
iM-Best(Short): The model’s out of sample performance YTD is -10.2%, and for the last 12 months is -13.6%. Over the same period the benchmark SPY performance was 12.6% and 4.9% respectively. Over the previous week the market value of iM-Best(Short) gained 2.30% at a time when SPY gained -2.22%. Over the period 1/2/2009 to 5/28/2019 the starting capital of $100,000 would have grown to $79,933 which includes $79,933 cash and excludes $25,775 spent on fees and slippage. |
|
|
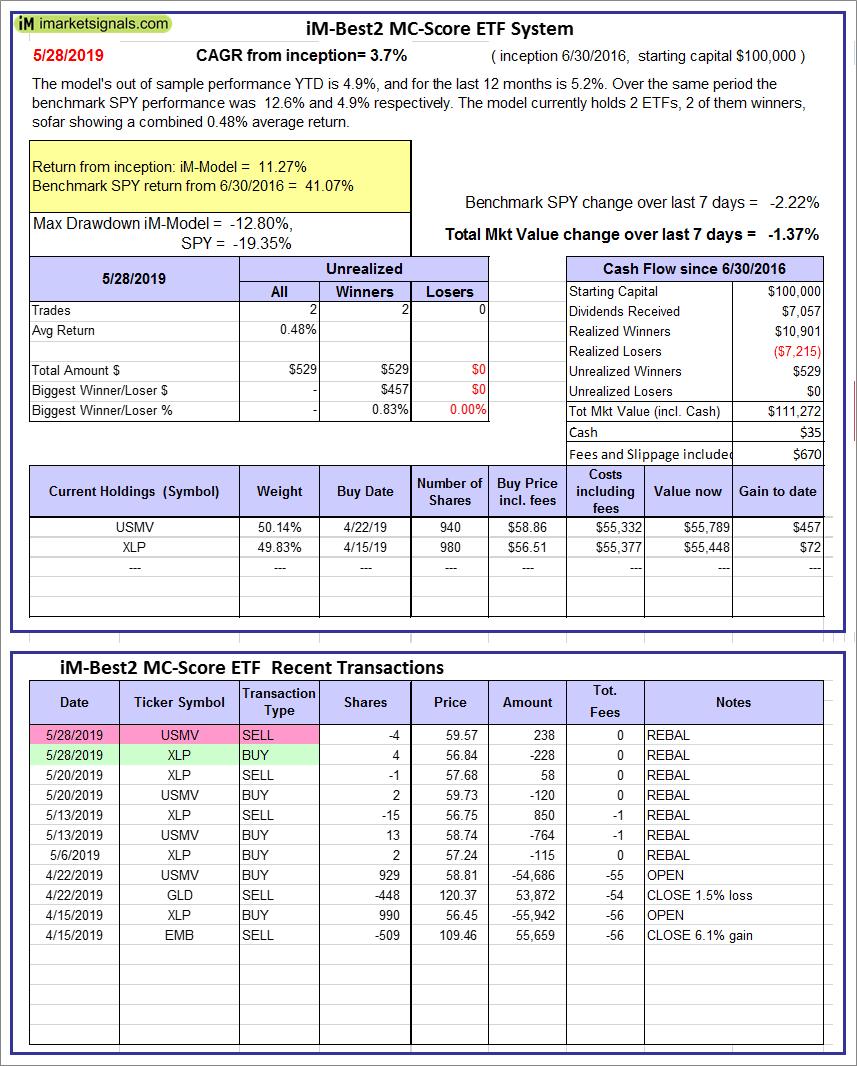
iM-Best2 MC-Score ETF System: The model’s out of sample performance YTD is 4.9%, and for the last 12 months is 5.2%. Over the same period the benchmark SPY performance was 12.6% and 4.9% respectively. Over the previous week the market value of the iM-Best2 MC-Score ETF System gained -1.37% at a time when SPY gained -2.22%. A starting capital of $100,000 at inception on 6/30/2016 would have grown to $111,272 which includes $35 cash and excludes $670 spent on fees and slippage. |
|
|
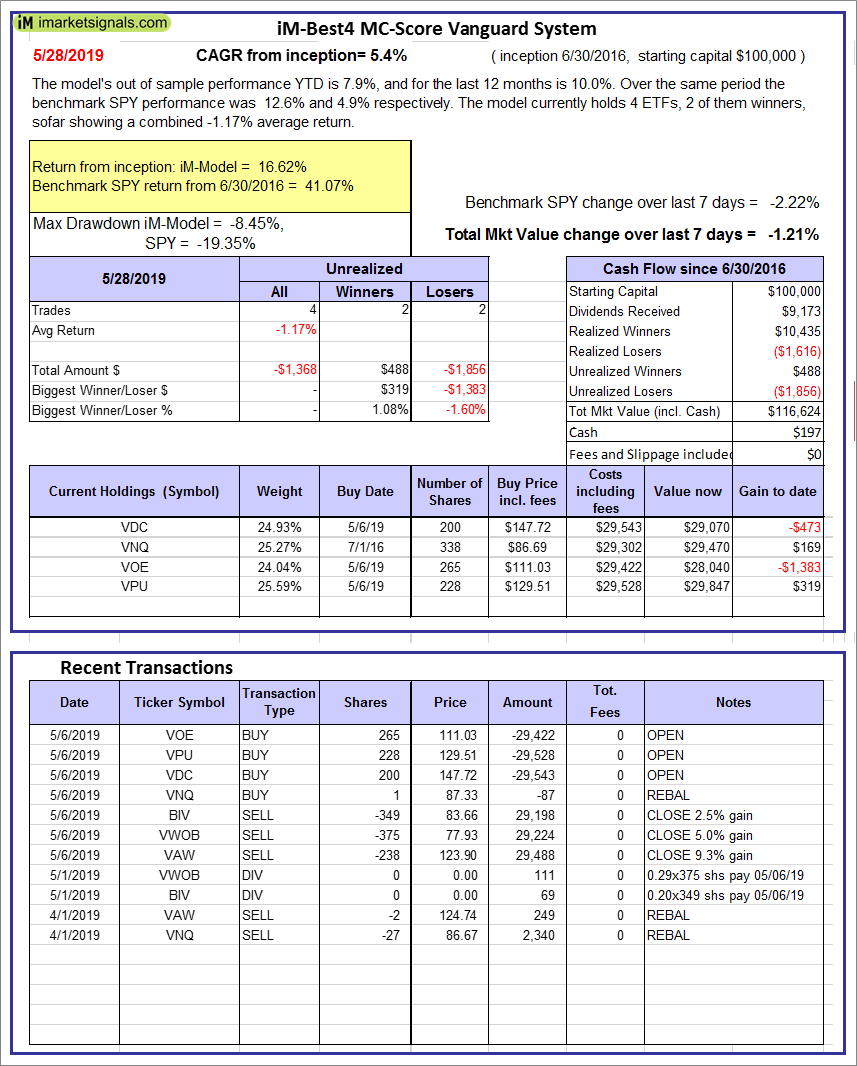
iM-Best4 MC-Score Vanguard System: The model’s out of sample performance YTD is 7.9%, and for the last 12 months is 10.0%. Over the same period the benchmark SPY performance was 12.6% and 4.9% respectively. Over the previous week the market value of the iM-Best4 MC-Score Vanguard System gained -1.21% at a time when SPY gained -2.22%. A starting capital of $100,000 at inception on 6/30/2016 would have grown to $116,624 which includes $197 cash and excludes $00 spent on fees and slippage. |
|
|
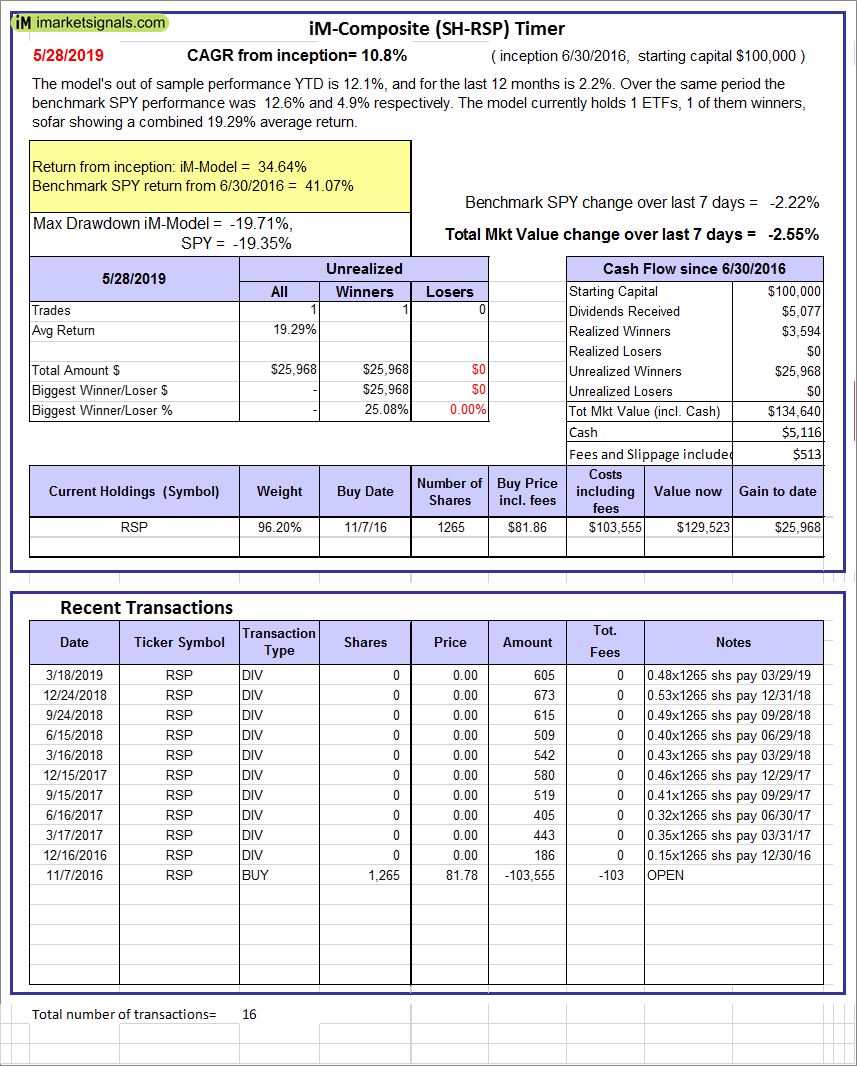
iM-Composite (SH-RSP) Timer: The model’s out of sample performance YTD is 12.1%, and for the last 12 months is 2.2%. Over the same period the benchmark SPY performance was 12.6% and 4.9% respectively. Over the previous week the market value of the iM-Composite (SH-RSP) Timer gained -2.55% at a time when SPY gained -2.22%. A starting capital of $100,000 at inception on 6/30/2016 would have grown to $134,640 which includes $5,116 cash and excludes $513 spent on fees and slippage. |
|
|
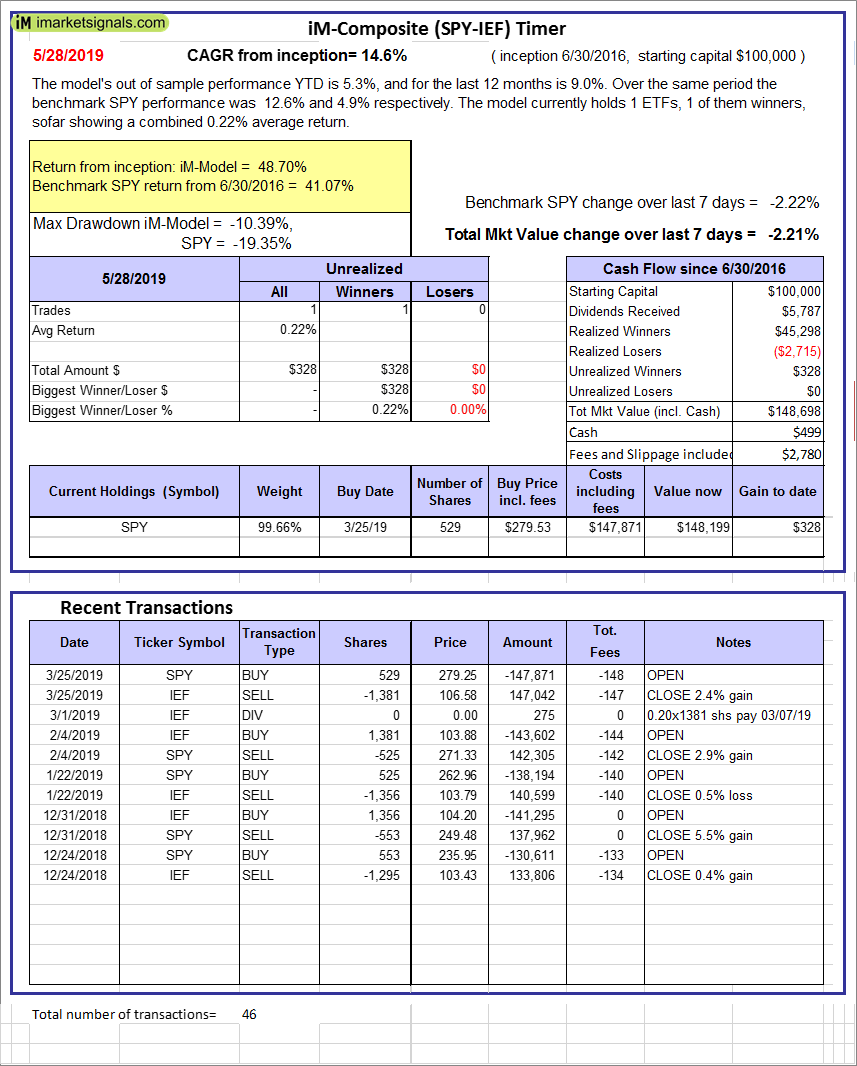
iM-Composite (SPY-IEF) Timer: The model’s out of sample performance YTD is 5.3%, and for the last 12 months is 9.0%. Over the same period the benchmark SPY performance was 12.6% and 4.9% respectively. Over the previous week the market value of the iM-Composite (SPY-IEF) Timer gained -2.21% at a time when SPY gained -2.22%. A starting capital of $100,000 at inception on 6/30/2016 would have grown to $148,698 which includes $499 cash and excludes $2,780 spent on fees and slippage. |
|
|
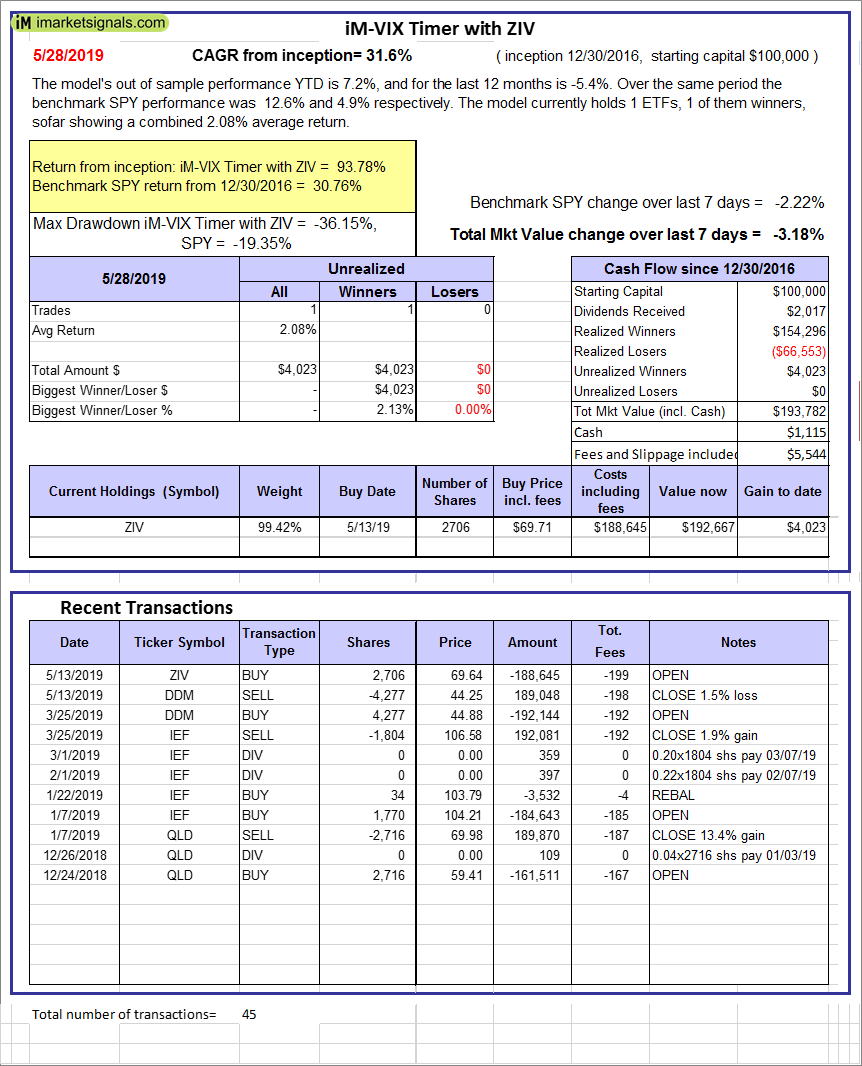
iM-VIX Timer with ZIV: The model’s out of sample performance YTD is 7.2%, and for the last 12 months is -5.4%. Over the same period the benchmark SPY performance was 12.6% and 4.9% respectively. Over the previous week the market value of the iM-VIX Timer with ZIV gained -3.18% at a time when SPY gained -2.22%. A starting capital of $100,000 at inception on 6/30/2016 would have grown to $193,782 which includes $1,115 cash and excludes $5,544 spent on fees and slippage. |
|
|
iM-Composite(Gold-Stocks-Bond) Timer: The model’s out of sample performance YTD is 8.5%, and for the last 12 months is -7.2%. Over the same period the benchmark SPY performance was 12.6% and 4.9% respectively. Over the previous week the market value of the iM-Composite(Gold-Stocks-Bond) Timer gained -3.57% at a time when SPY gained -2.22%. A starting capital of $100,000 at inception on 6/30/2016 would have grown to $119,064 which includes $258 cash and excludes $2,889 spent on fees and slippage. |
|
|
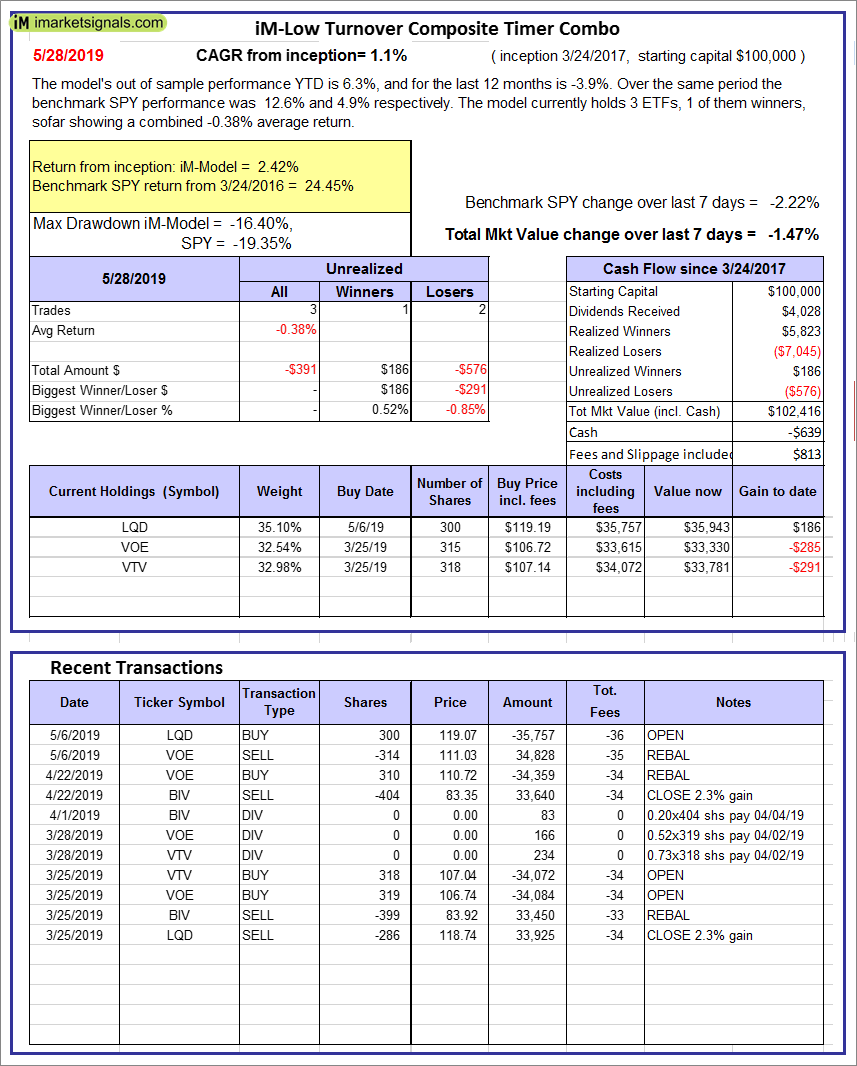
iM-Low Turnover Composite Timer Combo: The model’s out of sample performance YTD is 6.3%, and for the last 12 months is -3.9%. Over the same period the benchmark SPY performance was 12.6% and 4.9% respectively. Over the previous week the market value of the iM-Low Turnover Composite Timer Combo gained -1.47% at a time when SPY gained -2.22%. A starting capital of $100,000 at inception on 3/24/27 would have grown to $102,416 which includes -$639 cash and excludes $813 spent on fees and slippage. |
|
|
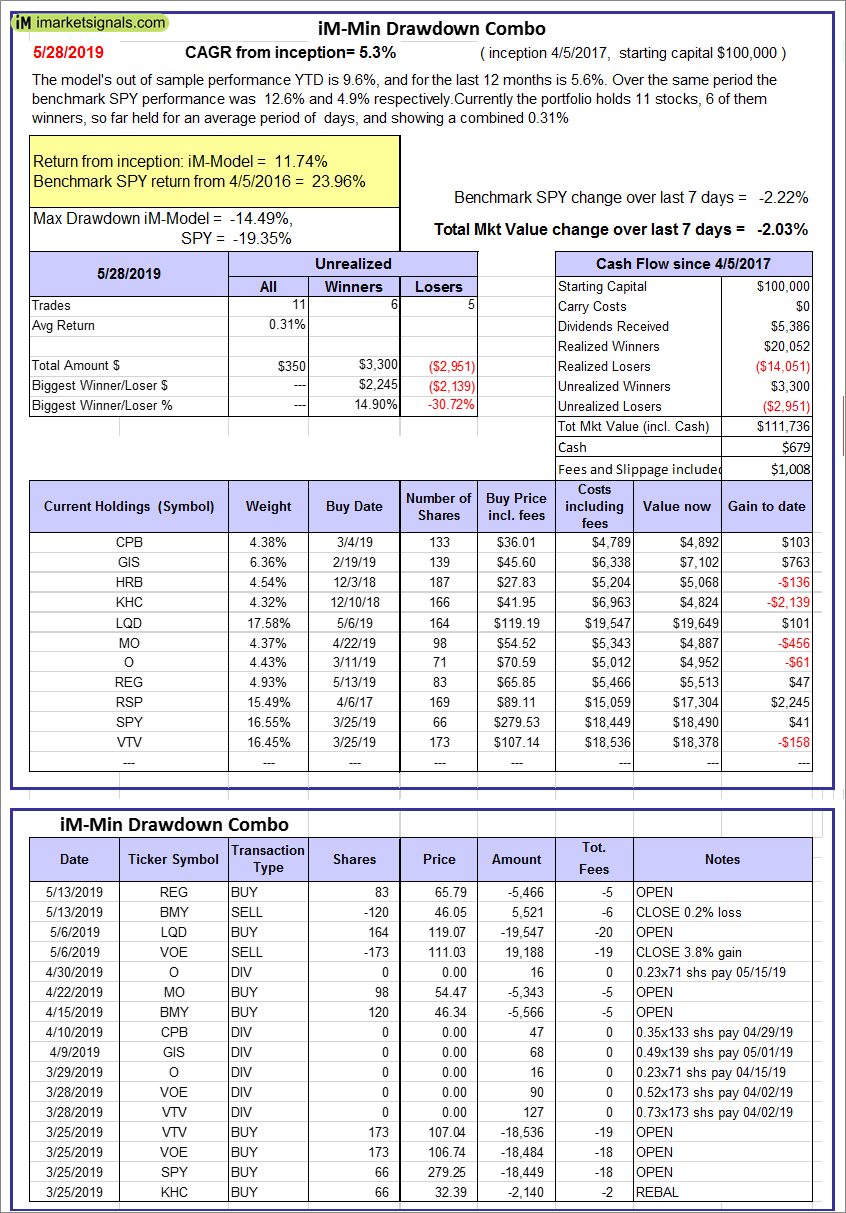
iM-Min Drawdown Combo: The model’s out of sample performance YTD is 9.6%, and for the last 12 months is 5.6%. Over the same period the benchmark SPY performance was 12.6% and 4.9% respectively. Over the previous week the market value of the iM-Min Drawdown Combo gained -2.03% at a time when SPY gained -2.22%. A starting capital of $100,000 at inception on 4/5/2017 would have grown to $111,736 which includes $679 cash and excludes $1,008 spent on fees and slippage. |
|
|
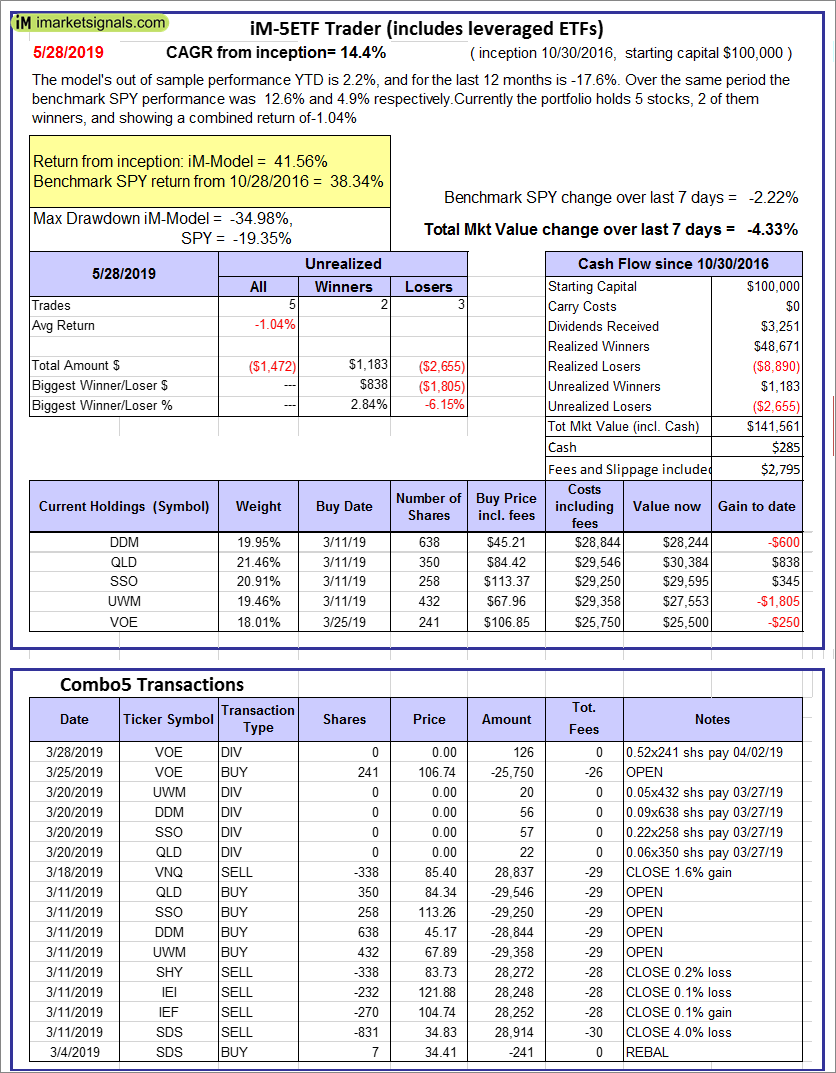
iM-5ETF Trader (includes leveraged ETFs): The model’s out of sample performance YTD is 2.2%, and for the last 12 months is -17.6%. Over the same period the benchmark SPY performance was 12.6% and 4.9% respectively. Over the previous week the market value of the iM-5ETF Trader (includes leveraged ETFs) gained -4.33% at a time when SPY gained -2.22%. A starting capital of $100,000 at inception on 10/30/2016 would have grown to $141,561 which includes $285 cash and excludes $2,795 spent on fees and slippage. |
|
|
iM-Standard 5ETF Trader (excludes leveraged ETFs): The model’s out of sample performance YTD is 4.1%, and for the last 12 months is -4.5%. Over the same period the benchmark SPY performance was 12.6% and 4.9% respectively. Over the previous week the market value of the iM-Standard 5ETF Trader (excludes leveraged ETFs) gained -2.13% at a time when SPY gained -2.22%. A starting capital of $100,000 at inception on 10/30/2016 would have grown to $122,047 which includes -$316 cash and excludes $2,670 spent on fees and slippage. |


Leave a Reply
You must be logged in to post a comment.