
  |
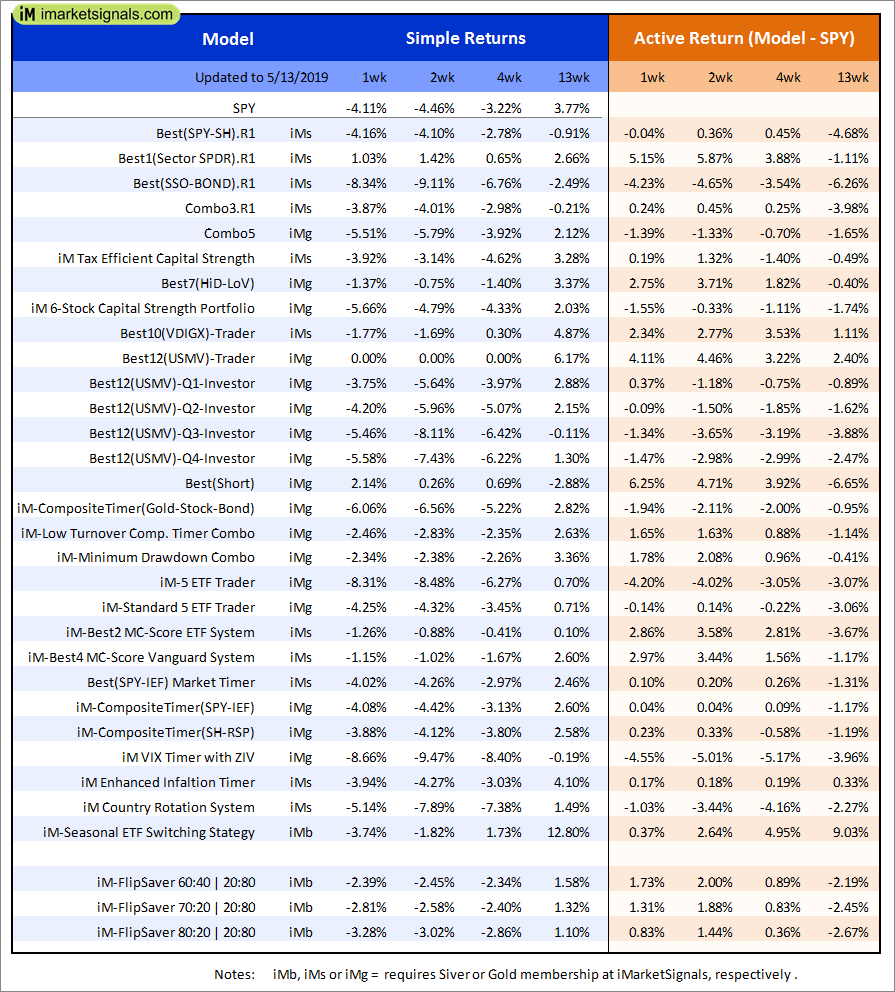
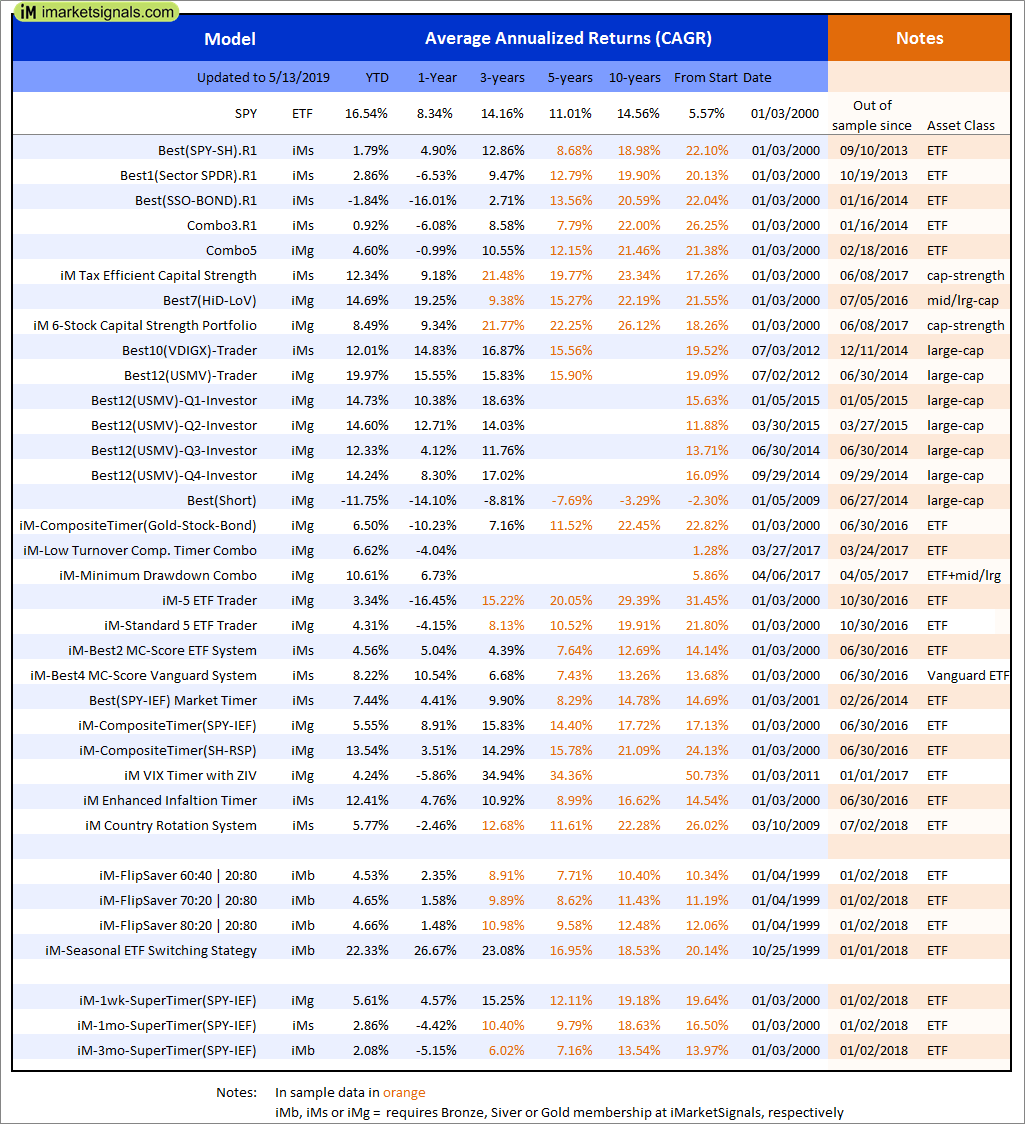
Out of sample performance summary of our models for the past 1, 2, 4 and 13 week periods. The active active return indicates how the models over- or underperformed the benchmark ETF SPY. Also the YTD, and the 1-, 3-, 5- and 10-year annualized returns are shown in the second table |
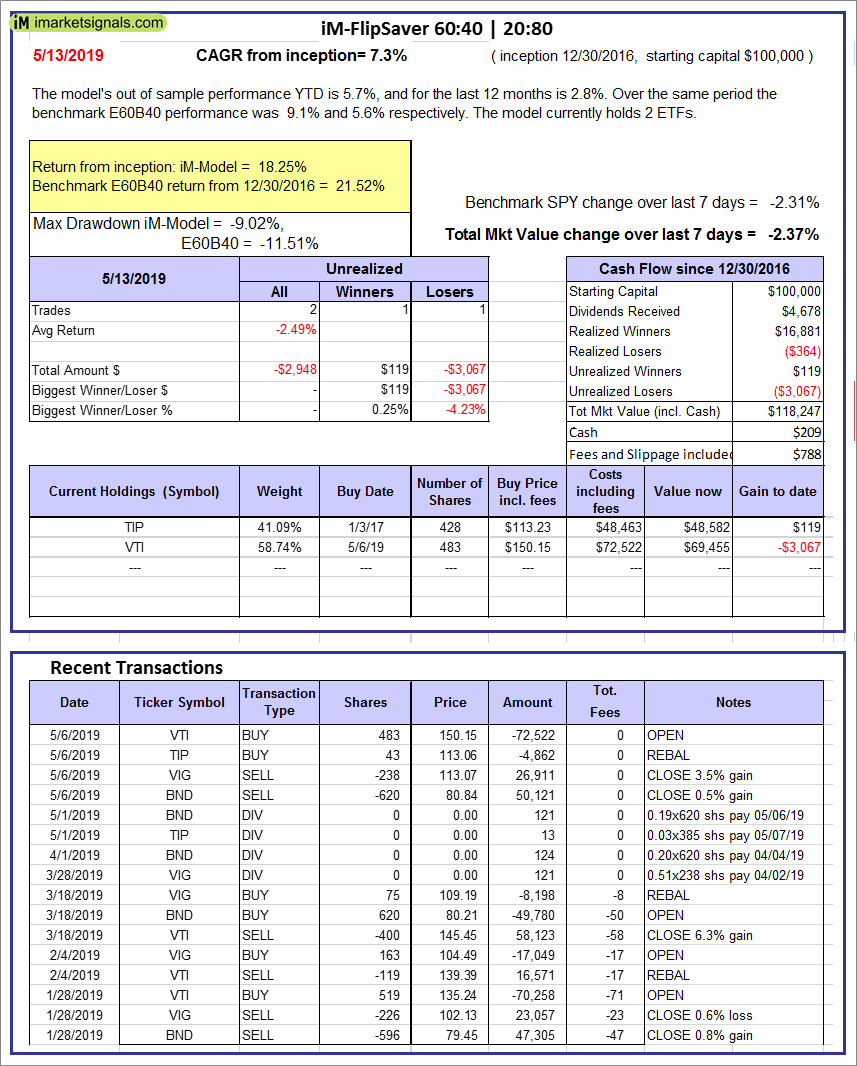 |
iM-FlipSaver 60:40 | 20:80 – 2017: The model’s out of sample performance YTD is 5.7%, and for the last 12 months is 2.8%. Over the same period the benchmark E60B40 performance was 9.1% and 5.6% respectively. Over the previous week the market value of iM-FlipSaver 80:20 | 20:80 gained -2.37% at a time when SPY gained -2.31%. A starting capital of $100,000 at inception on 7/16/2015 would have grown to $118,247 which includes $209 cash and excludes $788 spent on fees and slippage. |
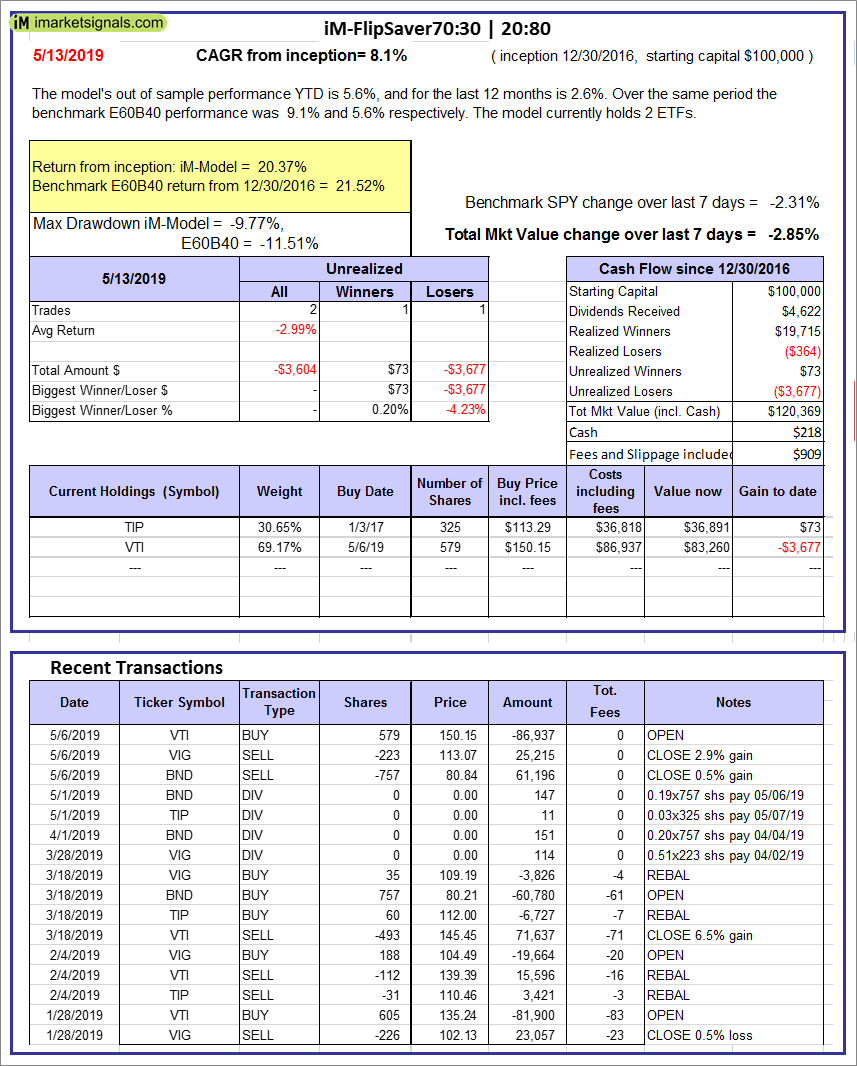 |
iM-FlipSaver 70:30 | 20:80 – 2017: The model’s out of sample performance YTD is 5.6%, and for the last 12 months is 2.6%. Over the same period the benchmark E60B40 performance was 9.1% and 5.6% respectively. Over the previous week the market value of iM-FlipSaver 70:30 | 20:80 gained -2.85% at a time when SPY gained -2.31%. A starting capital of $100,000 at inception on 7/15/2015 would have grown to $120,369 which includes $218 cash and excludes $909 spent on fees and slippage. |
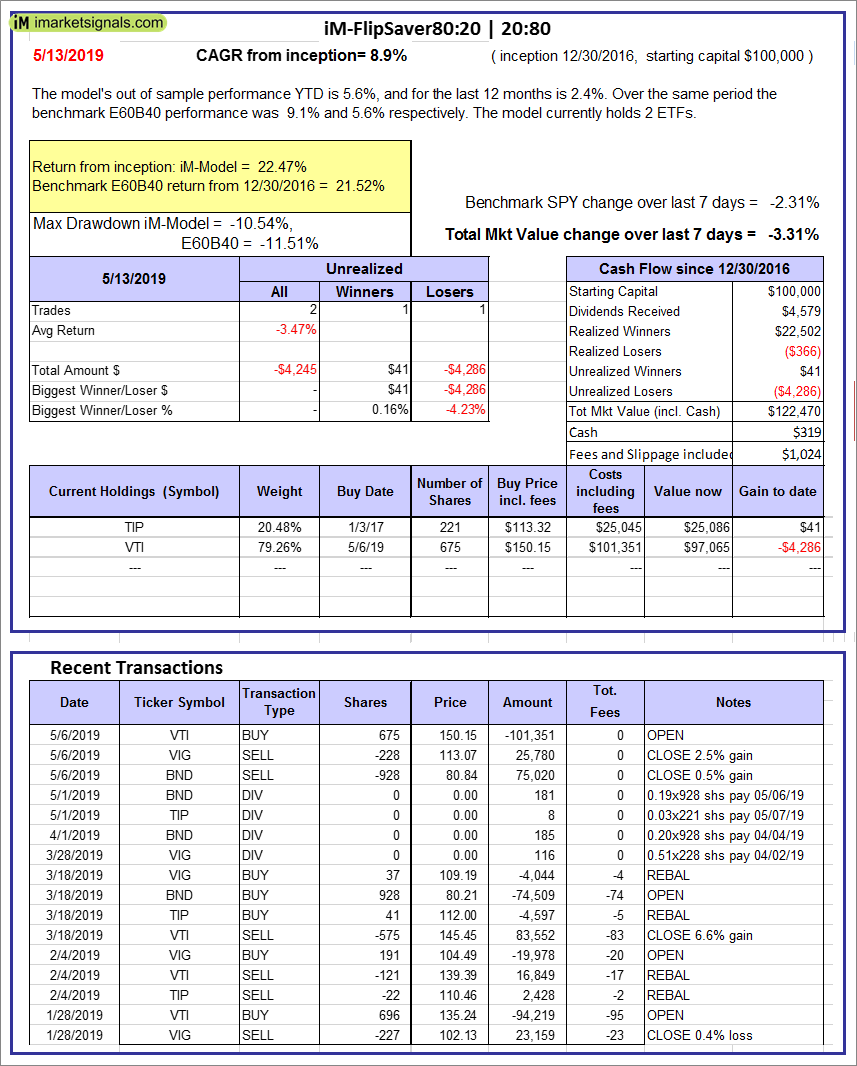 |
iM-FlipSaver 80:20 | 20:80 – 2017: The model’s out of sample performance YTD is 5.6%, and for the last 12 months is 2.4%. Over the same period the benchmark E60B40 performance was 9.1% and 5.6% respectively. Over the previous week the market value of iM-FlipSaver 80:20 | 20:80 gained -3.31% at a time when SPY gained -2.31%. A starting capital of $100,000 at inception on 1/2/2017 would have grown to $122,470 which includes $319 cash and excludes $1,024 spent on fees and slippage. |
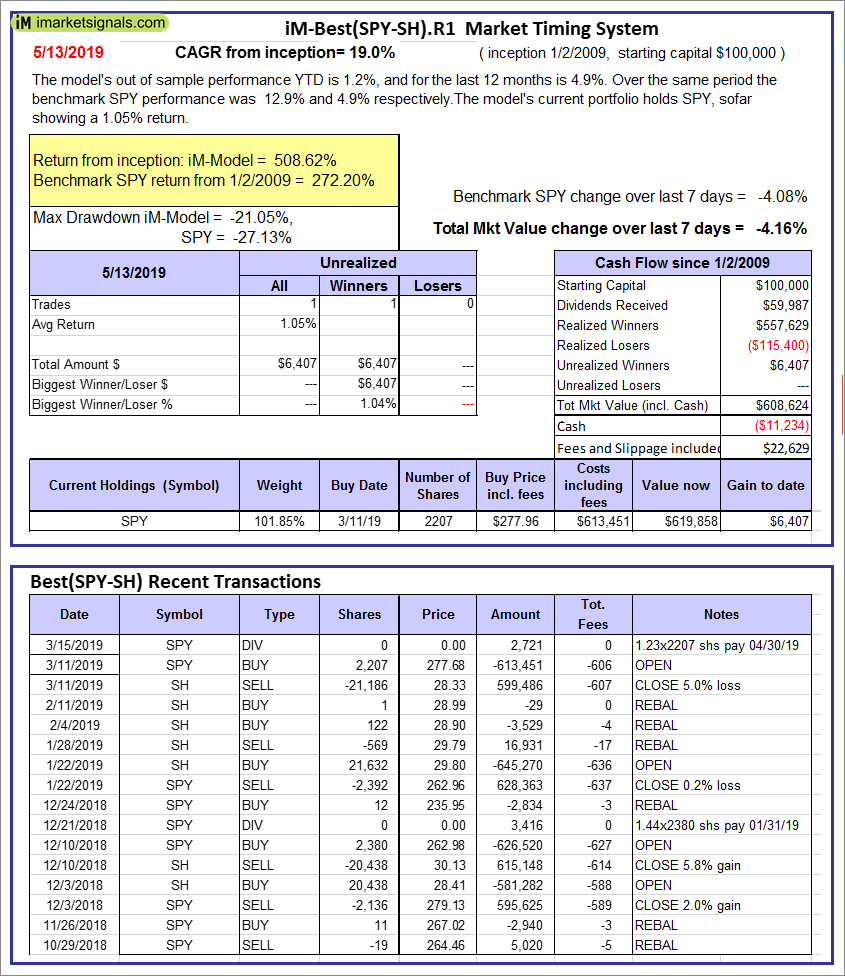 |
iM-Best(SPY-SH).R1: The model’s out of sample performance YTD is 1.2%, and for the last 12 months is 4.9%. Over the same period the benchmark SPY performance was 12.9% and 4.9% respectively. Over the previous week the market value of Best(SPY-SH) gained -4.16% at a time when SPY gained -4.08%. A starting capital of $100,000 at inception on 1/2/2009 would have grown to $608,624 which includes -$11,234 cash and excludes $22,629 spent on fees and slippage. |
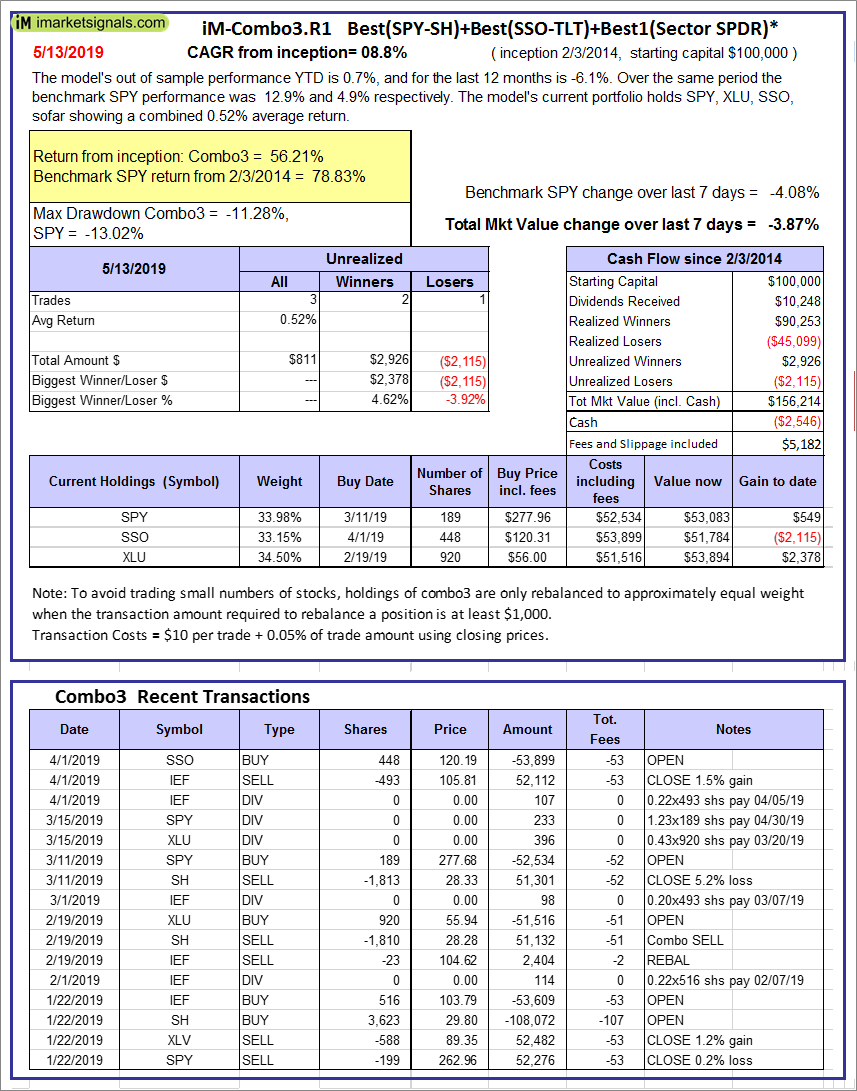 |
iM-Combo3.R1: The model’s out of sample performance YTD is 0.7%, and for the last 12 months is -6.1%. Over the same period the benchmark SPY performance was 12.9% and 4.9% respectively. Over the previous week the market value of iM-Combo3.R1 gained -3.87% at a time when SPY gained -4.08%. A starting capital of $100,000 at inception on 2/3/2014 would have grown to $156,214 which includes -$2,546 cash and excludes $5,182 spent on fees and slippage. |
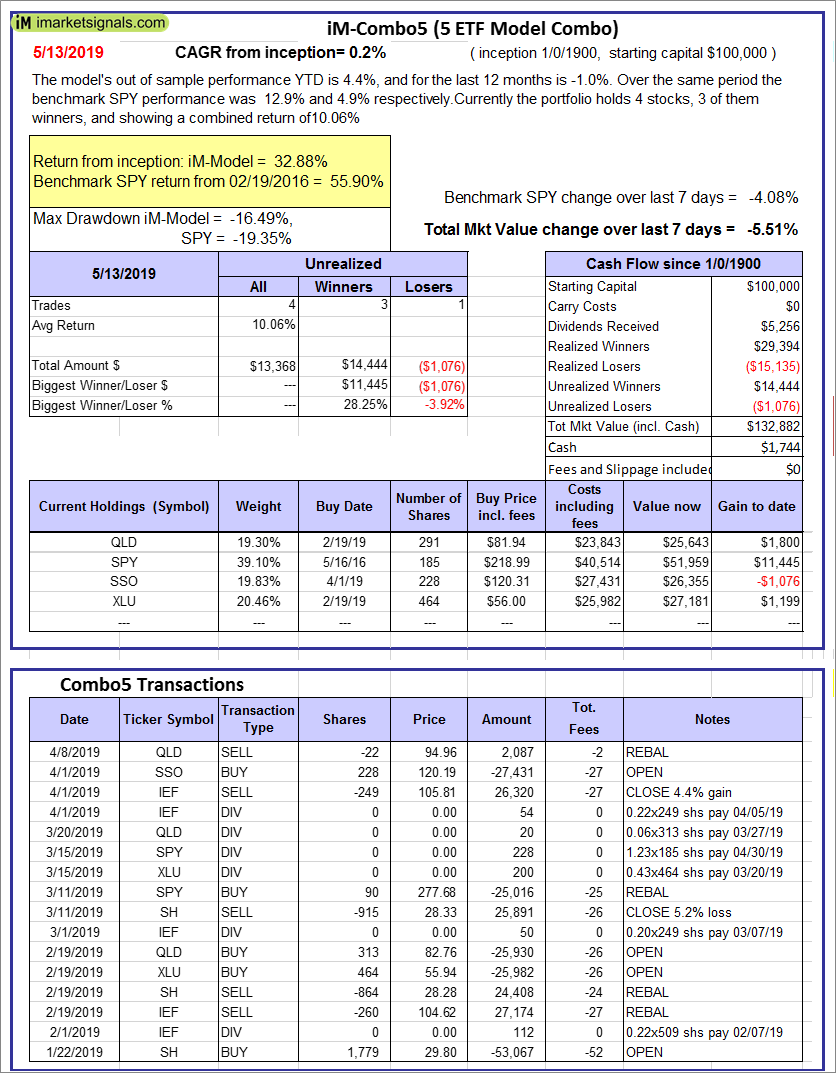 |
iM-Combo5: The model’s out of sample performance YTD is 4.4%, and for the last 12 months is -1.0%. Over the same period the benchmark SPY performance was 12.9% and 4.9% respectively. Over the previous week the market value of iM-Combo5 gained -5.51% at a time when SPY gained -4.08%. A starting capital of $100,000 at inception on 2/22/2016 would have grown to $132,882 which includes $1,744 cash and excludes $0 spent on fees and slippage. |
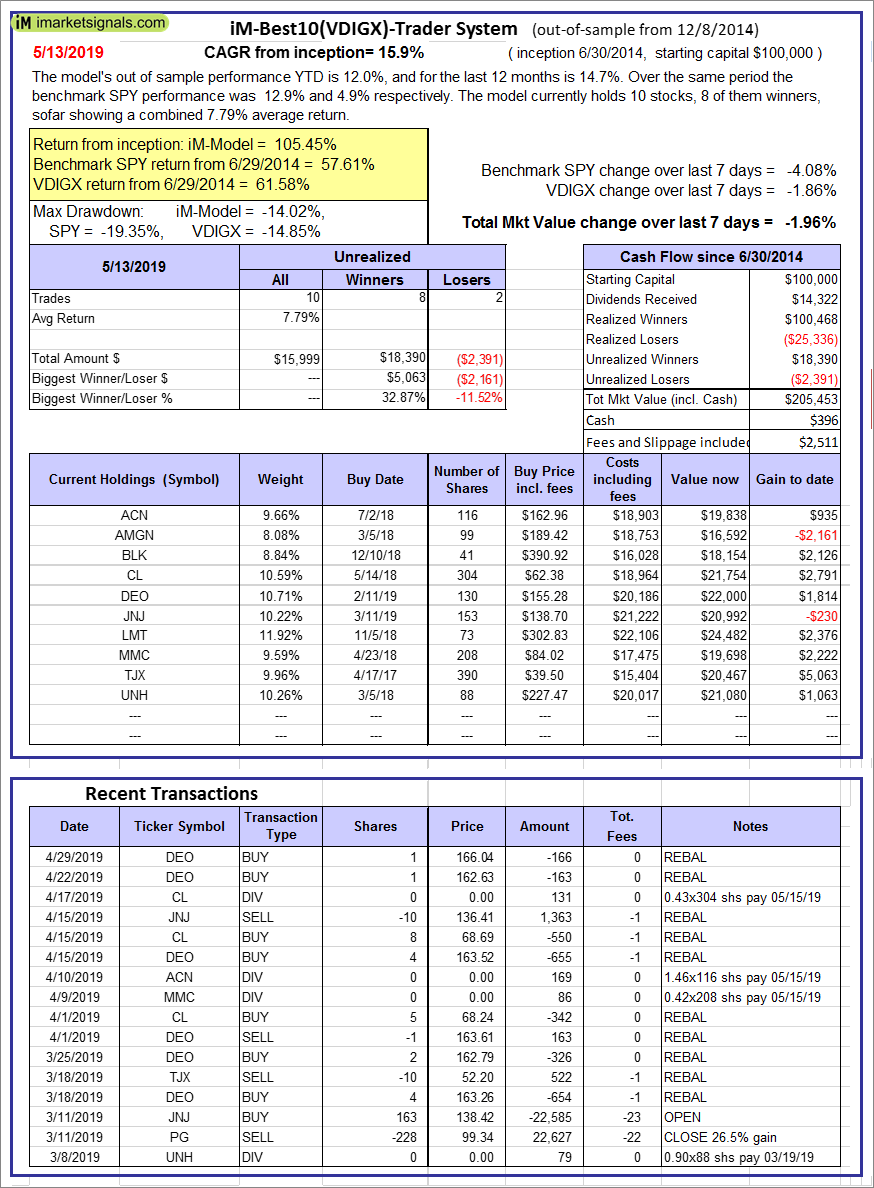  |
iM-Best10(VDIGX)-Trader: The model’s out of sample performance YTD is 12.0%, and for the last 12 months is 14.7%. Over the same period the benchmark SPY performance was 12.9% and 4.9% respectively. Since inception, on 7/1/2014, the model gained 105.45% while the benchmark SPY gained 57.61% and VDIGX gained 61.58% over the same period. Over the previous week the market value of iM-Best10(VDIGX) gained -1.96% at a time when SPY gained -4.08%. A starting capital of $100,000 at inception on 7/1/2014 would have grown to $205,453 which includes $396 cash and excludes $2,511 spent on fees and slippage. |
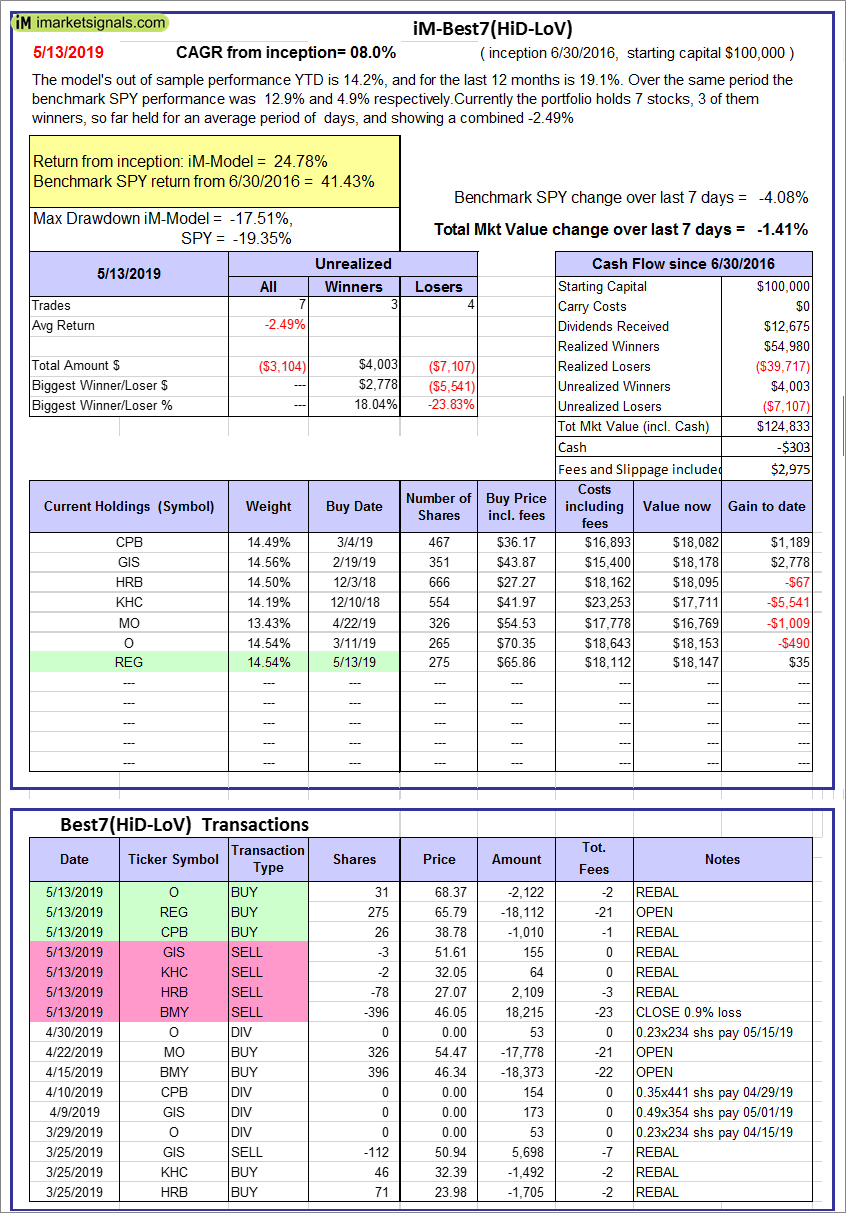 |
iM-Best7(HiD-LoV): The model’s out of sample performance YTD is 14.2%, and for the last 12 months is 19.1%. Over the same period the benchmark SPY performance was 12.9% and 4.9% respectively. Over the previous week the market value of iM-Best7(HiD-LoV) gained -1.41% at a time when SPY gained -4.08%. A starting capital of $100,000 at inception on 6/30/2016 would have grown to $124,833 which includes -$303 cash and excludes $2,975 spent on fees and slippage. |
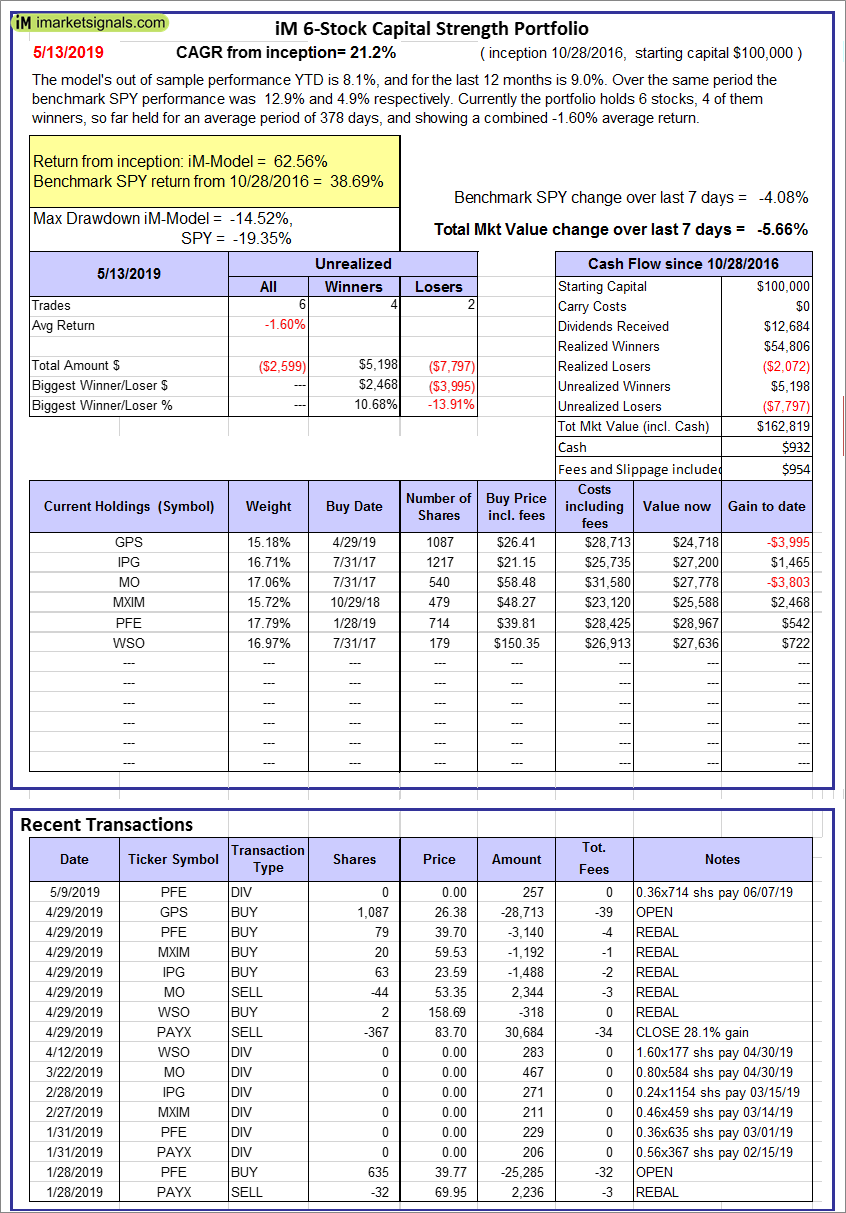 |
iM 6-Stock Capital Strength Portfolio: The model’s out of sample performance YTD is 8.1%, and for the last 12 months is 9.0%. Over the same period the benchmark SPY performance was 12.9% and 4.9% respectively. Over the previous week the market value of the iM 6-Stock Capital Strength Portfolio gained -5.66% at a time when SPY gained -4.08%. A starting capital of $100,000 at inception on 10/28/2016 would have grown to $162,819 which includes $932 cash and excludes $954 spent on fees and slippage. |
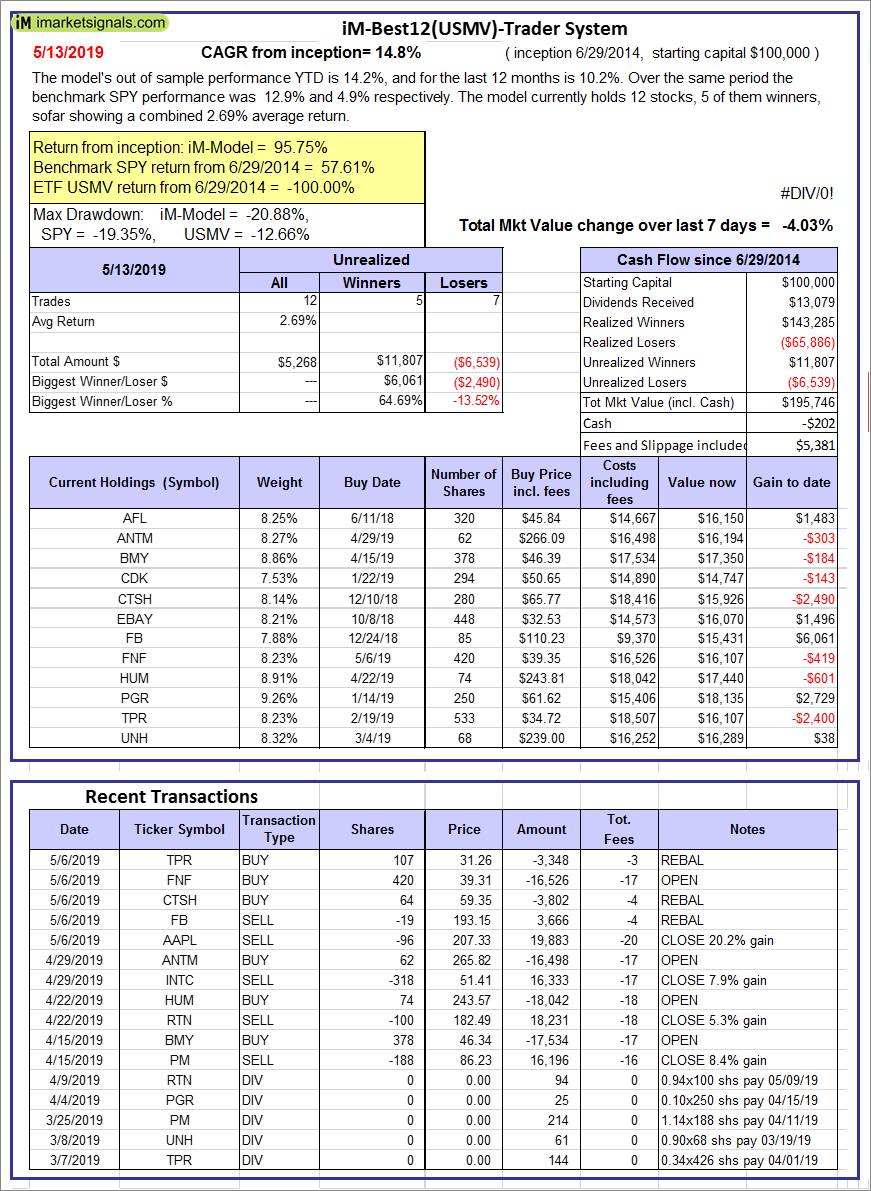  |
iM-Best12(USMV)-Trader: The model’s out of sample performance YTD is 14.2%, and for the last 12 months is 10.2%. Over the same period the benchmark SPY performance was 12.9% and 4.9% respectively. Since inception, on 6/30/2014, the model gained 95.75% while the benchmark SPY gained 57.61% and the ETF USMV gained -100.00% over the same period. Over the previous week the market value of iM-Best12(USMV)-Trader gained -4.03% at a time when SPY gained -4.08%. A starting capital of $100,000 at inception on 6/30/2014 would have grown to $195,746 which includes -$202 cash and excludes $5,381 spent on fees and slippage. |
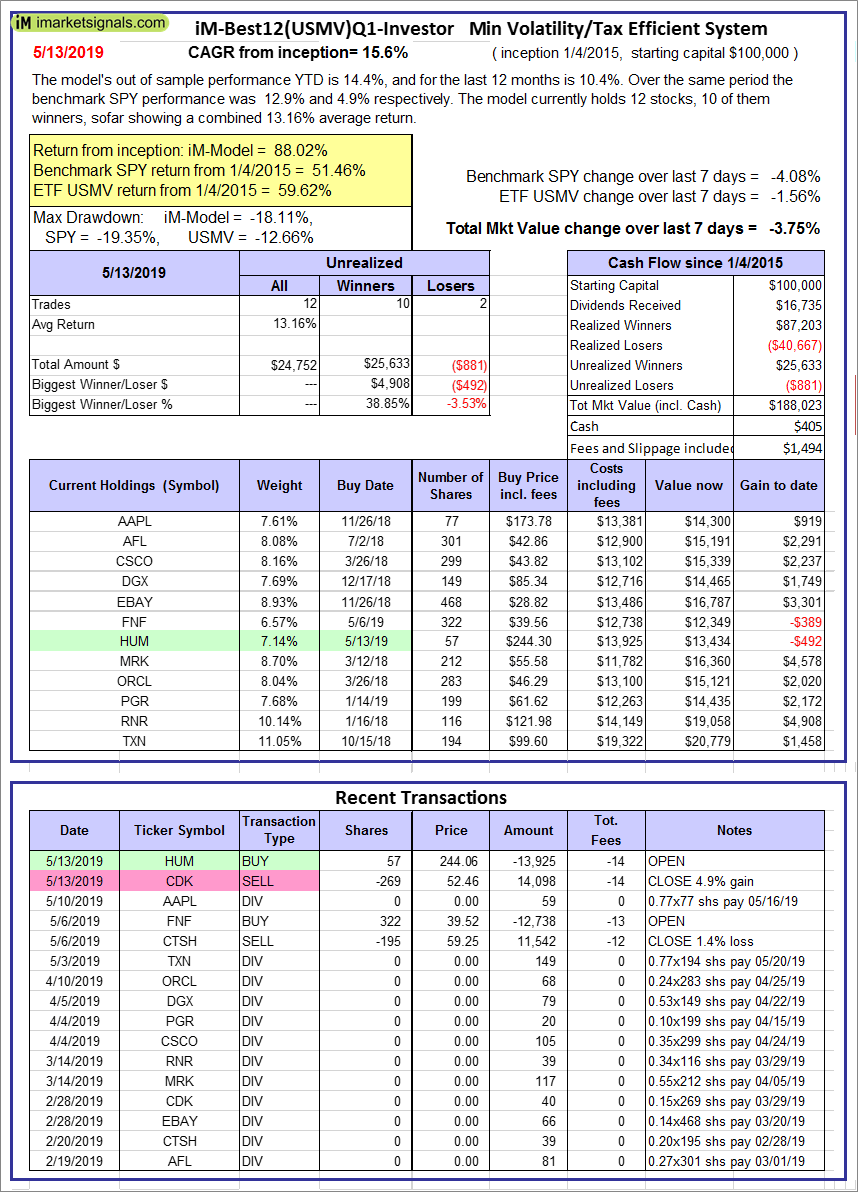 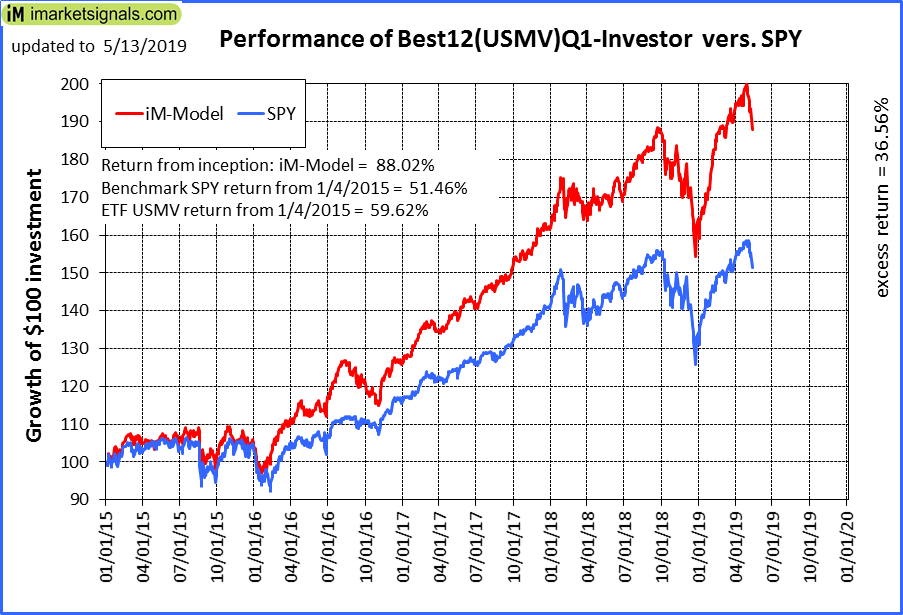 |
iM-Best12(USMV)Q1-Investor: The model’s out of sample performance YTD is 14.4%, and for the last 12 months is 10.4%. Over the same period the benchmark SPY performance was 12.9% and 4.9% respectively. Since inception, on 1/5/2015, the model gained 88.02% while the benchmark SPY gained 51.46% and the ETF USMV gained 59.62% over the same period. Over the previous week the market value of iM-Best12(USMV)Q1 gained -3.75% at a time when SPY gained -4.08%. A starting capital of $100,000 at inception on 1/5/2015 would have grown to $188,023 which includes $405 cash and excludes $1,494 spent on fees and slippage. |
  |
iM-Best12(USMV)Q2-Investor: The model’s out of sample performance YTD is 14.3%, and for the last 12 months is 12.7%. Over the same period the benchmark SPY performance was 12.9% and 4.9% respectively. Since inception, on 3/30/2015, the model gained 58.79% while the benchmark SPY gained 46.06% and the ETF USMV gained 54.17% over the same period. Over the previous week the market value of iM-Best12(USMV)Q2 gained -4.20% at a time when SPY gained -4.08%. A starting capital of $100,000 at inception on 3/30/2015 would have grown to $158,793 which includes $690 cash and excludes $1,356 spent on fees and slippage. |
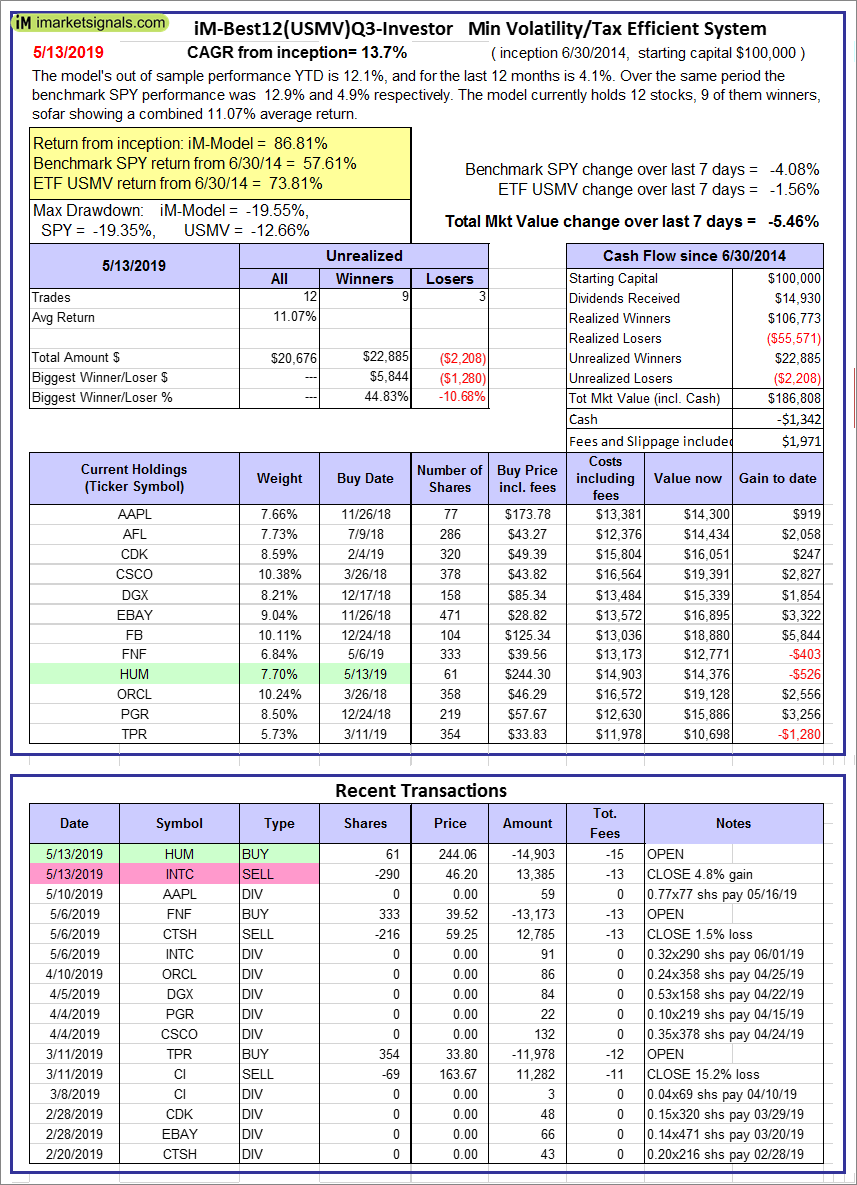 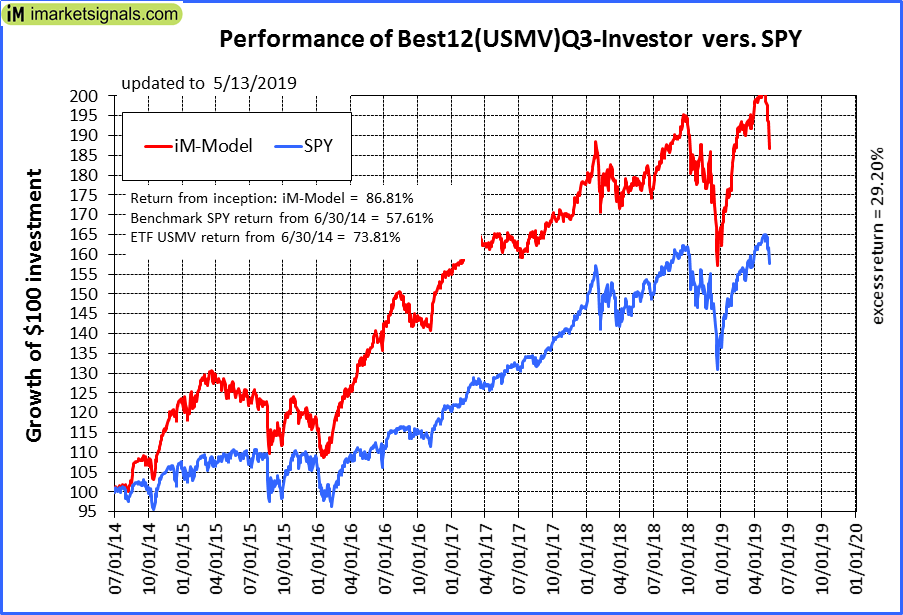 |
iM-Best12(USMV)Q3-Investor: The model’s out of sample performance YTD is 12.1%, and for the last 12 months is 4.1%. Over the same period the benchmark SPY performance was 12.9% and 4.9% respectively. Since inception, on 7/1/2014, the model gained 86.81% while the benchmark SPY gained 57.61% and the ETF USMV gained 73.81% over the same period. Over the previous week the market value of iM-Best12(USMV)Q3 gained -5.46% at a time when SPY gained -4.08%. A starting capital of $100,000 at inception on 7/1/2014 would have grown to $186,808 which includes -$1,342 cash and excludes $1,971 spent on fees and slippage. |
 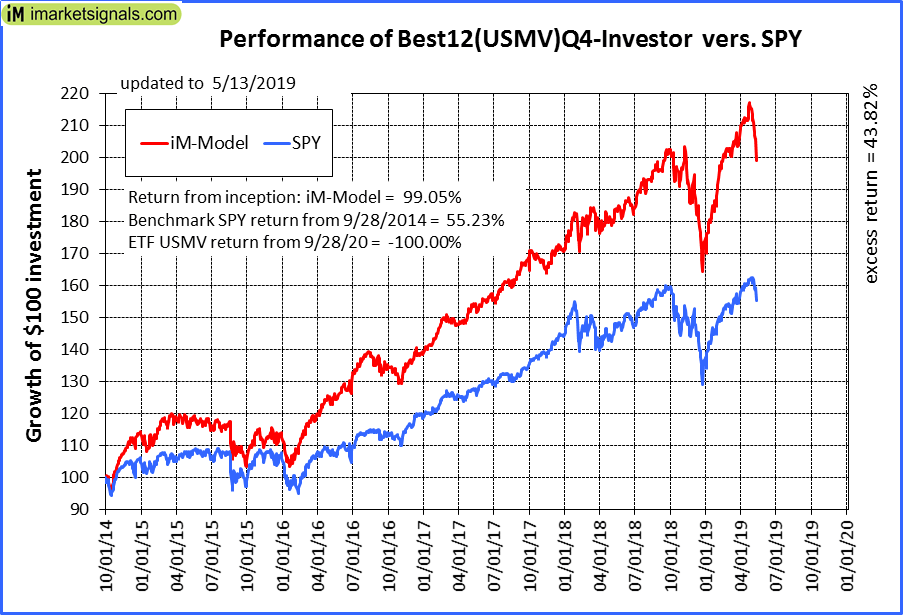 |
iM-Best12(USMV)Q4-Investor: Since inception, on 9/29/2014, the model gained 99.05% while the benchmark SPY gained 55.23% and the ETF USMV gained -100.00% over the same period. Over the previous week the market value of iM-Best12(USMV)Q4 gained -5.71% at a time when SPY gained -4.08%. A starting capital of $100,000 at inception on 9/29/2014 would have grown to $199,048 which includes -$1,089 cash and excludes $1,779 spent on fees and slippage. |
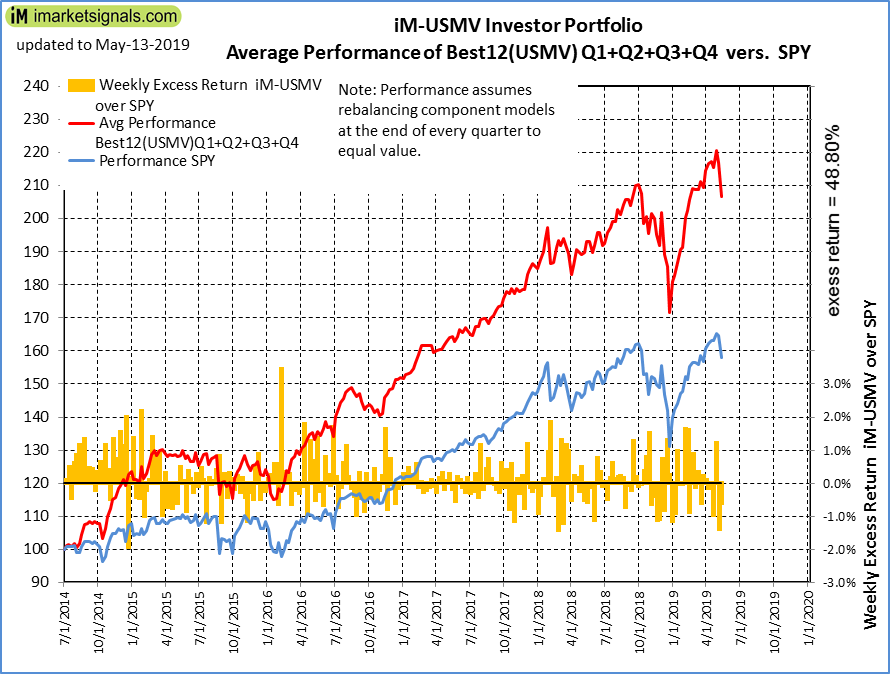 |
Average Performance of iM-Best12(USMV)Q1+Q2+Q3+Q4-Investor resulted in an excess return of 48.80% over SPY. (see iM-USMV Investor Portfolio) |
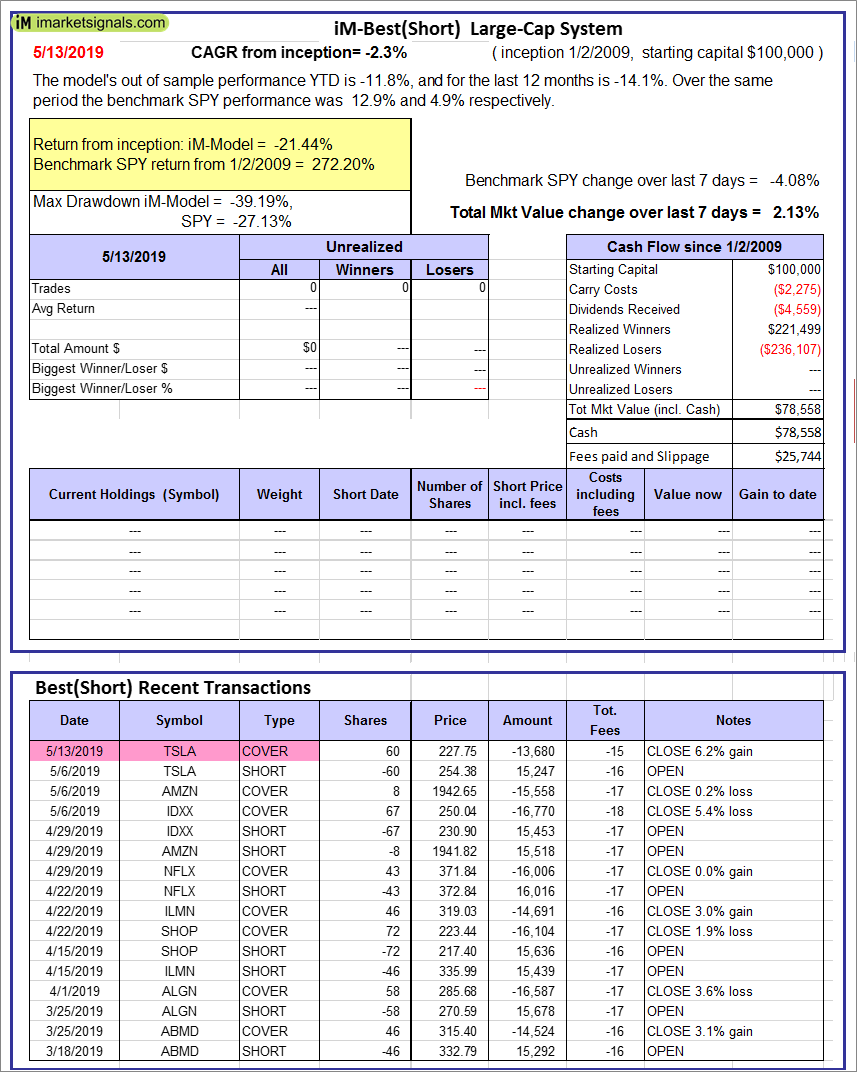 |
iM-Best(Short): The model’s out of sample performance YTD is -11.8%, and for the last 12 months is -14.1%. Over the same period the benchmark SPY performance was 12.9% and 4.9% respectively. Over the previous week the market value of iM-Best(Short) gained 2.13% at a time when SPY gained -4.08%. Over the period 1/2/2009 to 5/13/2019 the starting capital of $100,000 would have grown to $78,558 which includes $78,558 cash and excludes $25,744 spent on fees and slippage. |
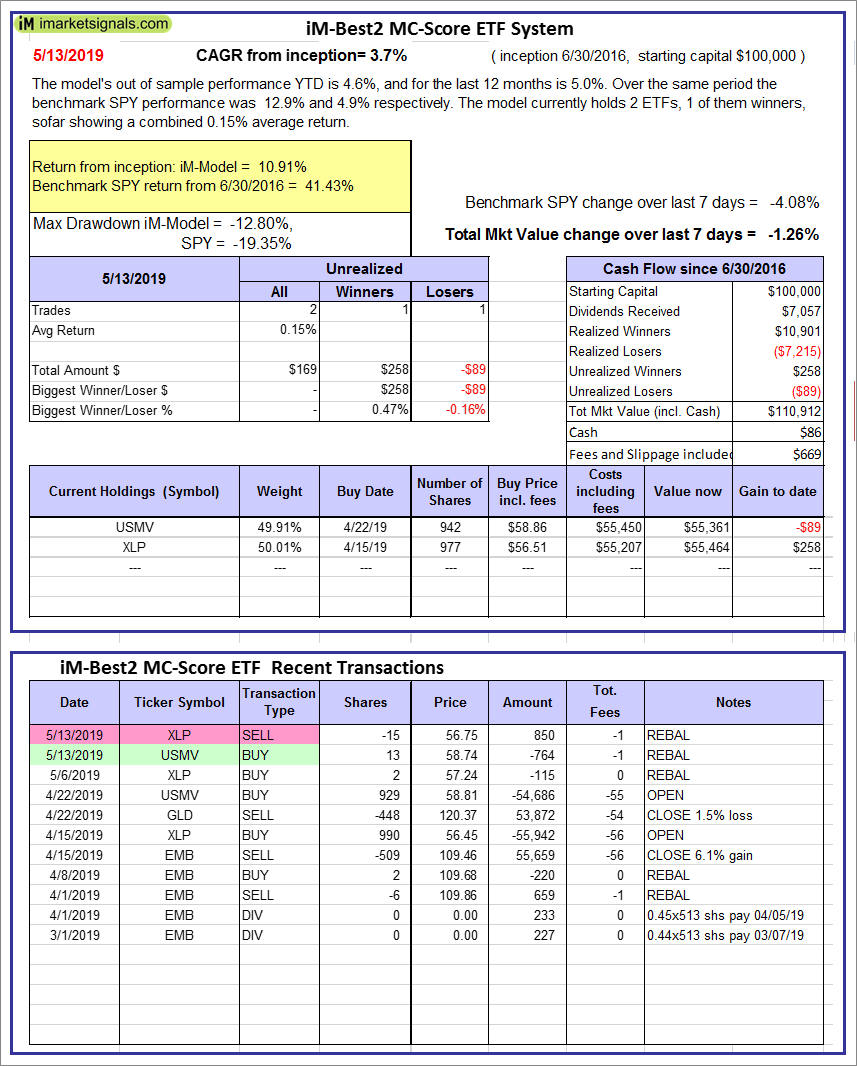 |
iM-Best2 MC-Score ETF System: The model’s out of sample performance YTD is 4.6%, and for the last 12 months is 5.0%. Over the same period the benchmark SPY performance was 12.9% and 4.9% respectively. Over the previous week the market value of the iM-Best2 MC-Score ETF System gained -1.26% at a time when SPY gained -4.08%. A starting capital of $100,000 at inception on 6/30/2016 would have grown to $110,912 which includes $86 cash and excludes $669 spent on fees and slippage. |
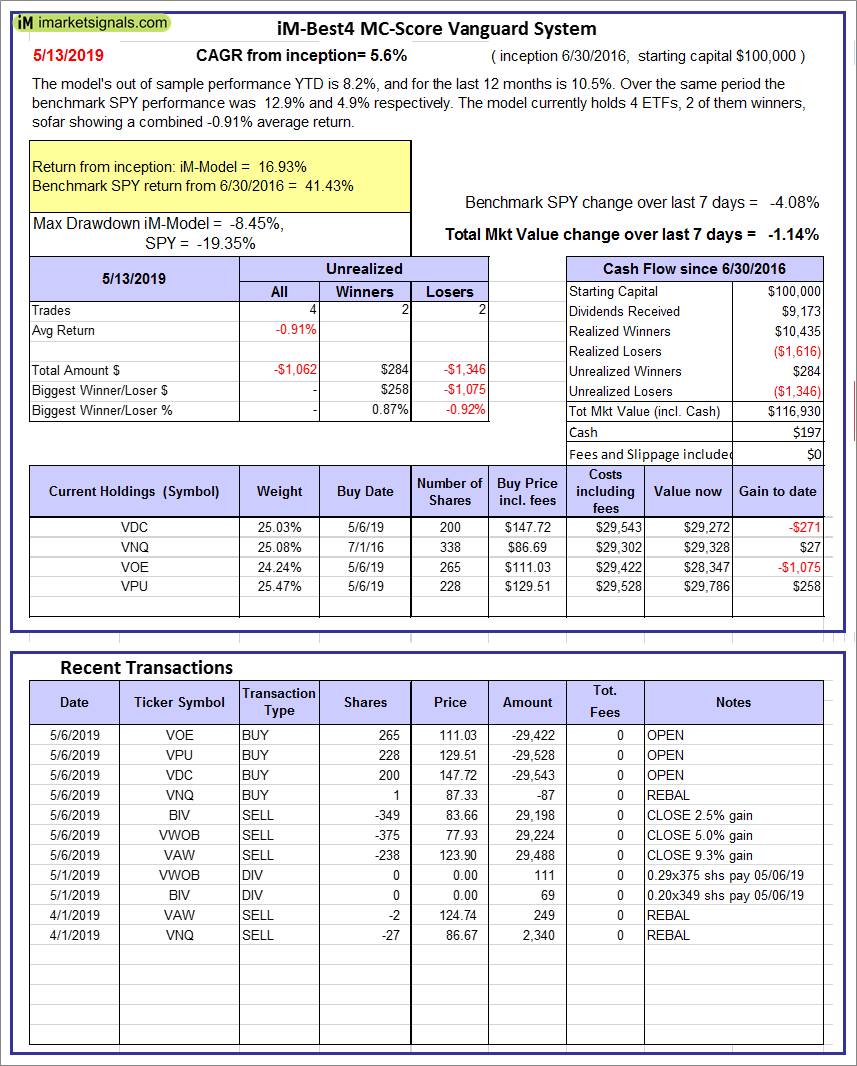 |
iM-Best4 MC-Score Vanguard System: The model’s out of sample performance YTD is 8.2%, and for the last 12 months is 10.5%. Over the same period the benchmark SPY performance was 12.9% and 4.9% respectively. Over the previous week the market value of the iM-Best4 MC-Score Vanguard System gained -1.14% at a time when SPY gained -4.08%. A starting capital of $100,000 at inception on 6/30/2016 would have grown to $116,930 which includes $197 cash and excludes $00 spent on fees and slippage. |
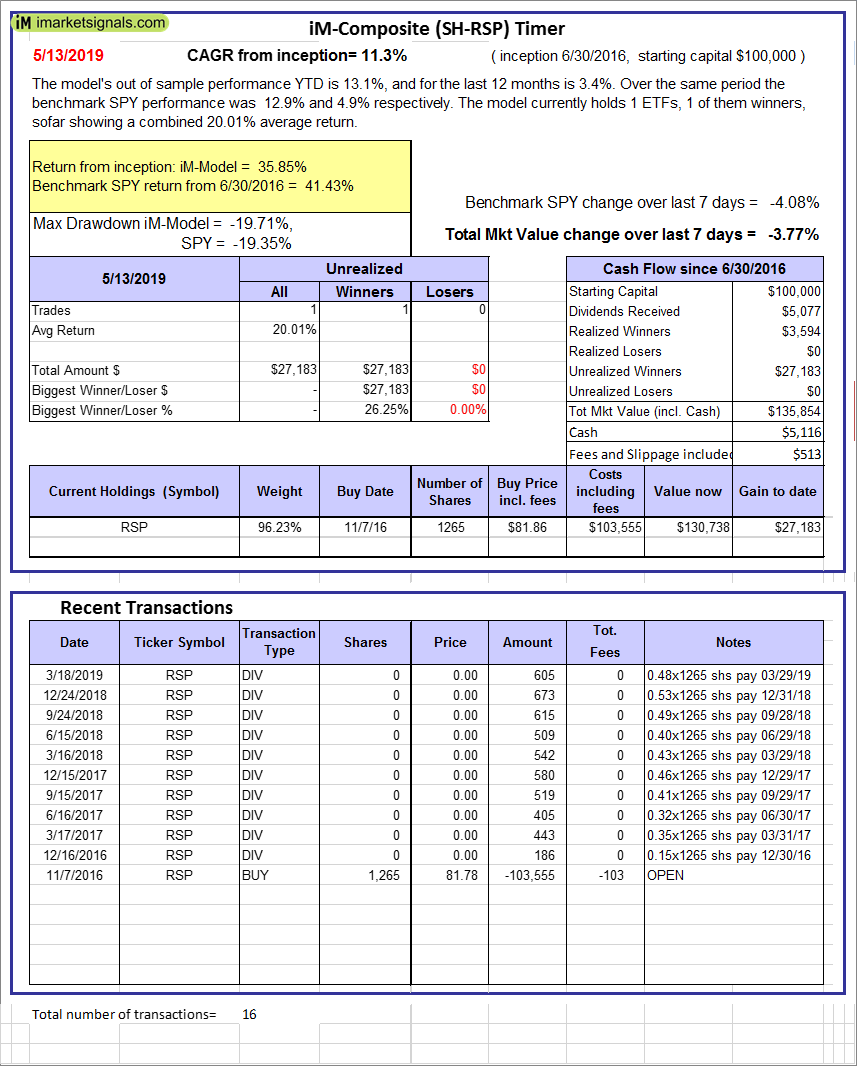 |
iM-Composite (SH-RSP) Timer: The model’s out of sample performance YTD is 13.1%, and for the last 12 months is 3.4%. Over the same period the benchmark SPY performance was 12.9% and 4.9% respectively. Over the previous week the market value of the iM-Composite (SH-RSP) Timer gained -3.77% at a time when SPY gained -4.08%. A starting capital of $100,000 at inception on 6/30/2016 would have grown to $135,854 which includes $5,116 cash and excludes $513 spent on fees and slippage. |
 |
iM-Composite (SPY-IEF) Timer: The model’s out of sample performance YTD is 5.5%, and for the last 12 months is 8.9%. Over the same period the benchmark SPY performance was 12.9% and 4.9% respectively. Over the previous week the market value of the iM-Composite (SPY-IEF) Timer gained -4.07% at a time when SPY gained -4.08%. A starting capital of $100,000 at inception on 6/30/2016 would have grown to $149,074 which includes $499 cash and excludes $2,780 spent on fees and slippage. |
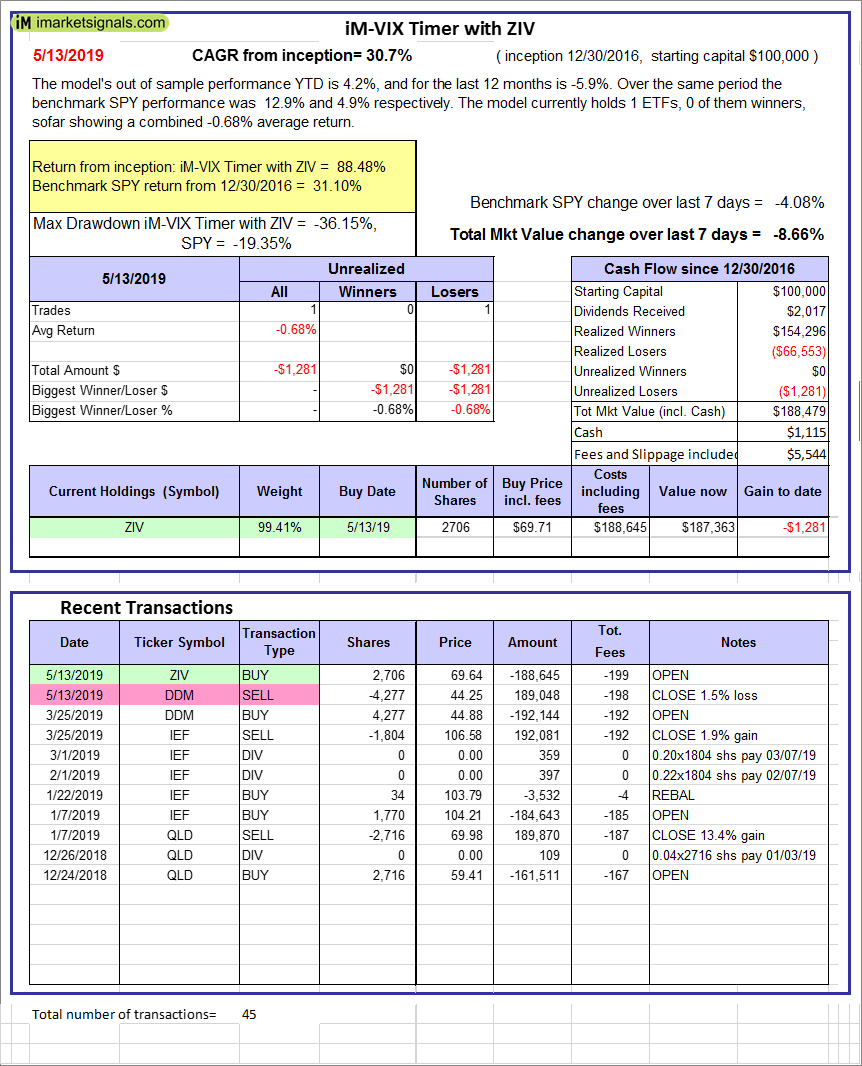 |
iM-VIX Timer with ZIV: The model’s out of sample performance YTD is 4.2%, and for the last 12 months is -5.9%. Over the same period the benchmark SPY performance was 12.9% and 4.9% respectively. Over the previous week the market value of the iM-VIX Timer with ZIV gained -8.66% at a time when SPY gained -4.08%. A starting capital of $100,000 at inception on 6/30/2016 would have grown to $188,479 which includes $1,115 cash and excludes $5,544 spent on fees and slippage. |
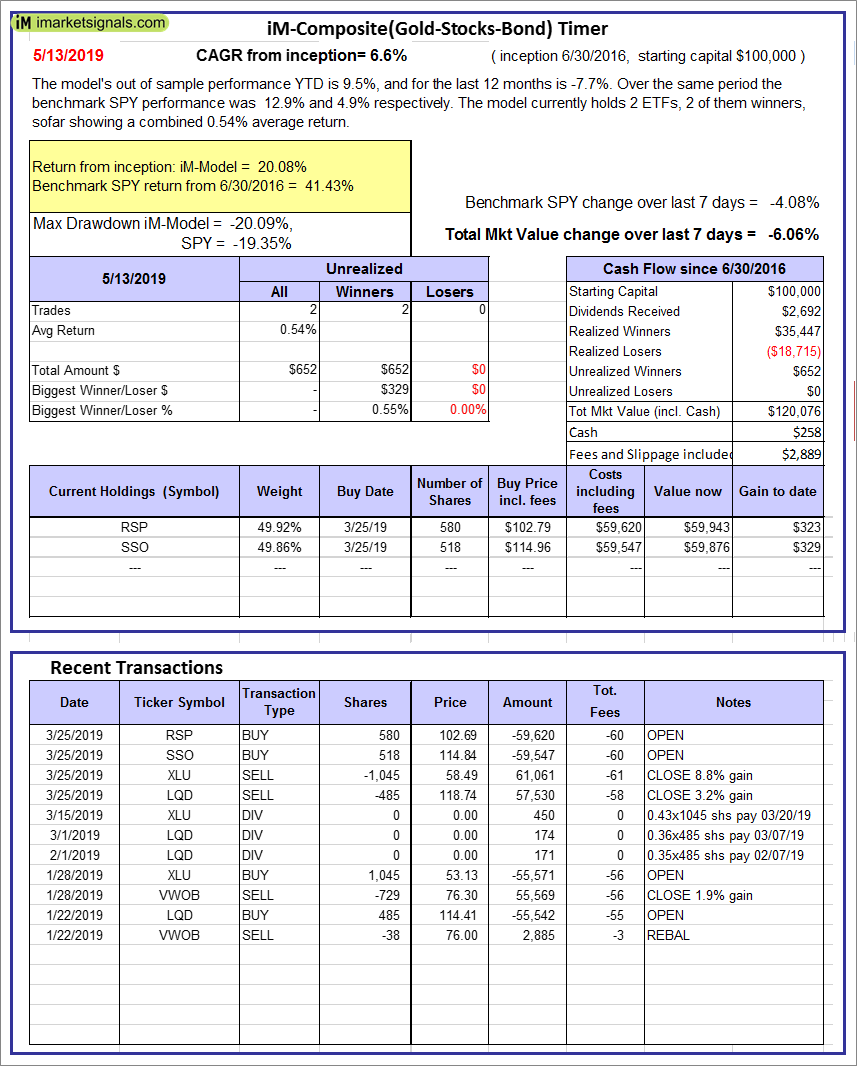 |
iM-Composite(Gold-Stocks-Bond) Timer: The model’s out of sample performance YTD is 9.5%, and for the last 12 months is -7.7%. Over the same period the benchmark SPY performance was 12.9% and 4.9% respectively. Over the previous week the market value of the iM-Composite(Gold-Stocks-Bond) Timer gained -6.06% at a time when SPY gained -4.08%. A starting capital of $100,000 at inception on 6/30/2016 would have grown to $120,076 which includes $258 cash and excludes $2,889 spent on fees and slippage. |
 |
iM-Low Turnover Composite Timer Combo: The model’s out of sample performance YTD is 6.6%, and for the last 12 months is -4.0%. Over the same period the benchmark SPY performance was 12.9% and 4.9% respectively. Over the previous week the market value of the iM-Low Turnover Composite Timer Combo gained -2.46% at a time when SPY gained -4.08%. A starting capital of $100,000 at inception on 3/24/27 would have grown to $102,727 which includes -$639 cash and excludes $813 spent on fees and slippage. |
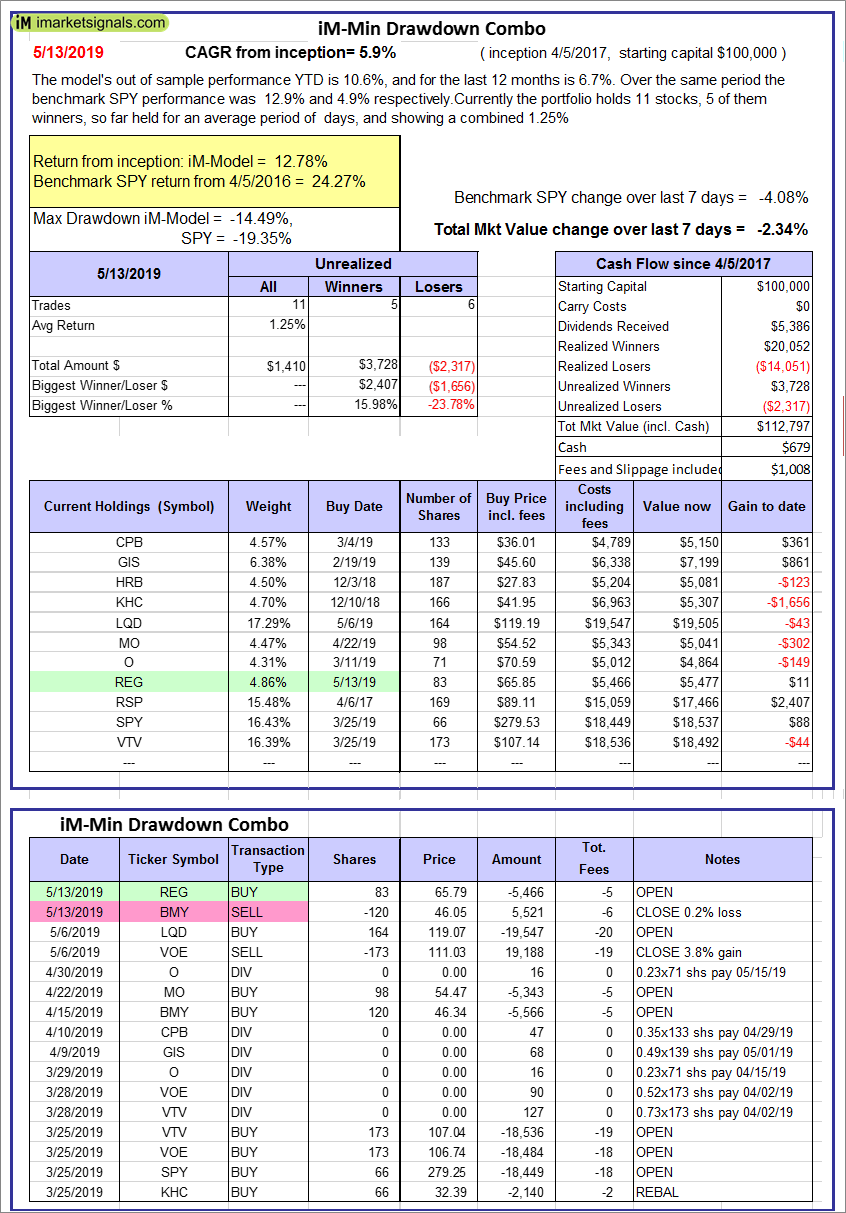 |
iM-Min Drawdown Combo: The model’s out of sample performance YTD is 10.6%, and for the last 12 months is 6.7%. Over the same period the benchmark SPY performance was 12.9% and 4.9% respectively. Over the previous week the market value of the iM-Min Drawdown Combo gained -2.34% at a time when SPY gained -4.08%. A starting capital of $100,000 at inception on 4/5/2017 would have grown to $112,797 which includes $679 cash and excludes $1,008 spent on fees and slippage. |
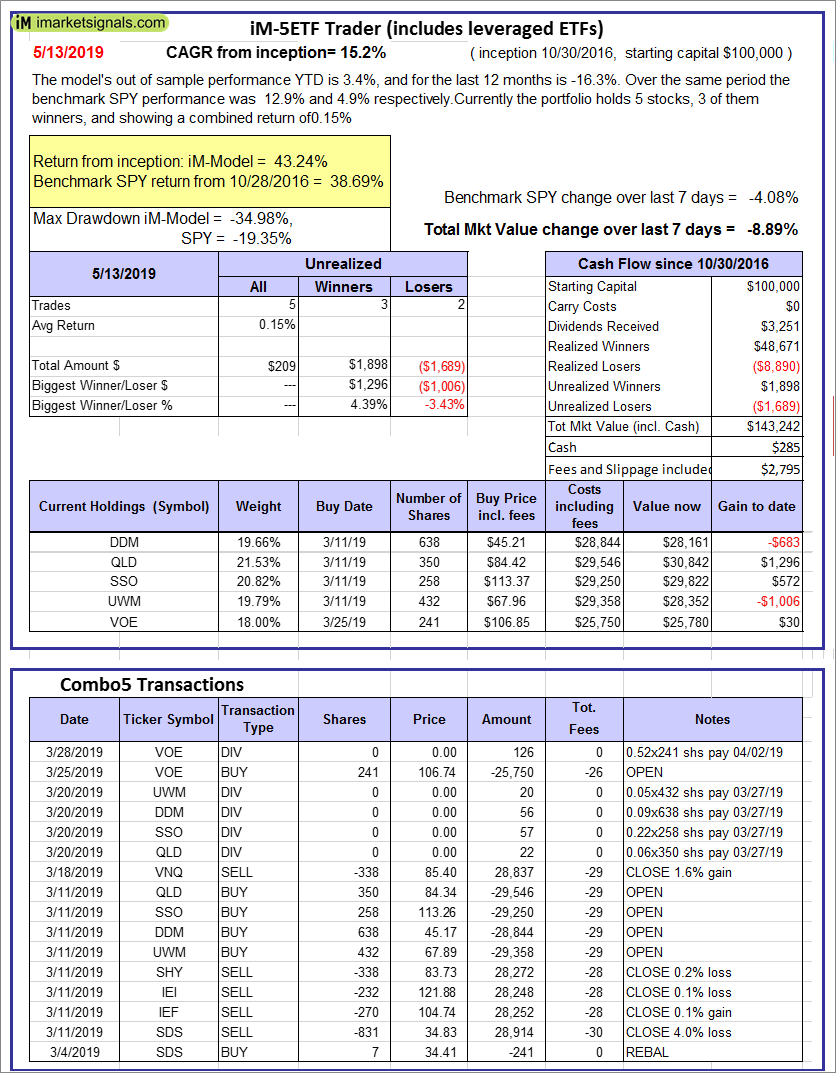 |
iM-5ETF Trader (includes leveraged ETFs): The model’s out of sample performance YTD is 3.4%, and for the last 12 months is -16.3%. Over the same period the benchmark SPY performance was 12.9% and 4.9% respectively. Over the previous week the market value of the iM-5ETF Trader (includes leveraged ETFs) gained -8.89% at a time when SPY gained -4.08%. A starting capital of $100,000 at inception on 10/30/2016 would have grown to $143,242 which includes $285 cash and excludes $2,795 spent on fees and slippage. |
 |
iM-Standard 5ETF Trader (excludes leveraged ETFs): The model’s out of sample performance YTD is 4.3%, and for the last 12 months is -4.1%. Over the same period the benchmark SPY performance was 12.9% and 4.9% respectively. Over the previous week the market value of the iM-Standard 5ETF Trader (excludes leveraged ETFs) gained -4.25% at a time when SPY gained -4.08%. A starting capital of $100,000 at inception on 10/30/2016 would have grown to $122,311 which includes -$316 cash and excludes $2,670 spent on fees and slippage. |
iM-Best Reports – 5/13/2019
Posted in pmp SPY-SH
Leave a Reply
You must be logged in to post a comment.