
  |
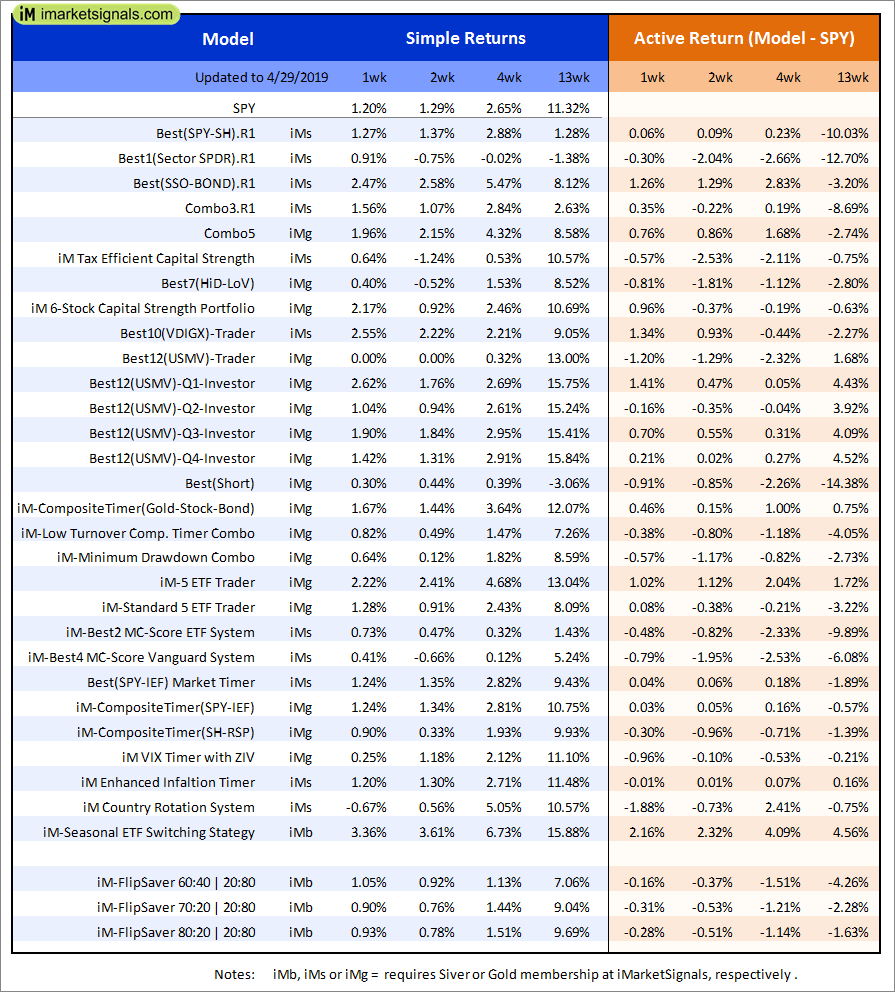
Out of sample performance summary of our models for the past 1, 2, 4 and 13 week periods. The active active return indicates how the models over- or underperformed the benchmark ETF SPY. Also the YTD, and the 1-, 3-, 5- and 10-year annualized returns are shown in the second table |
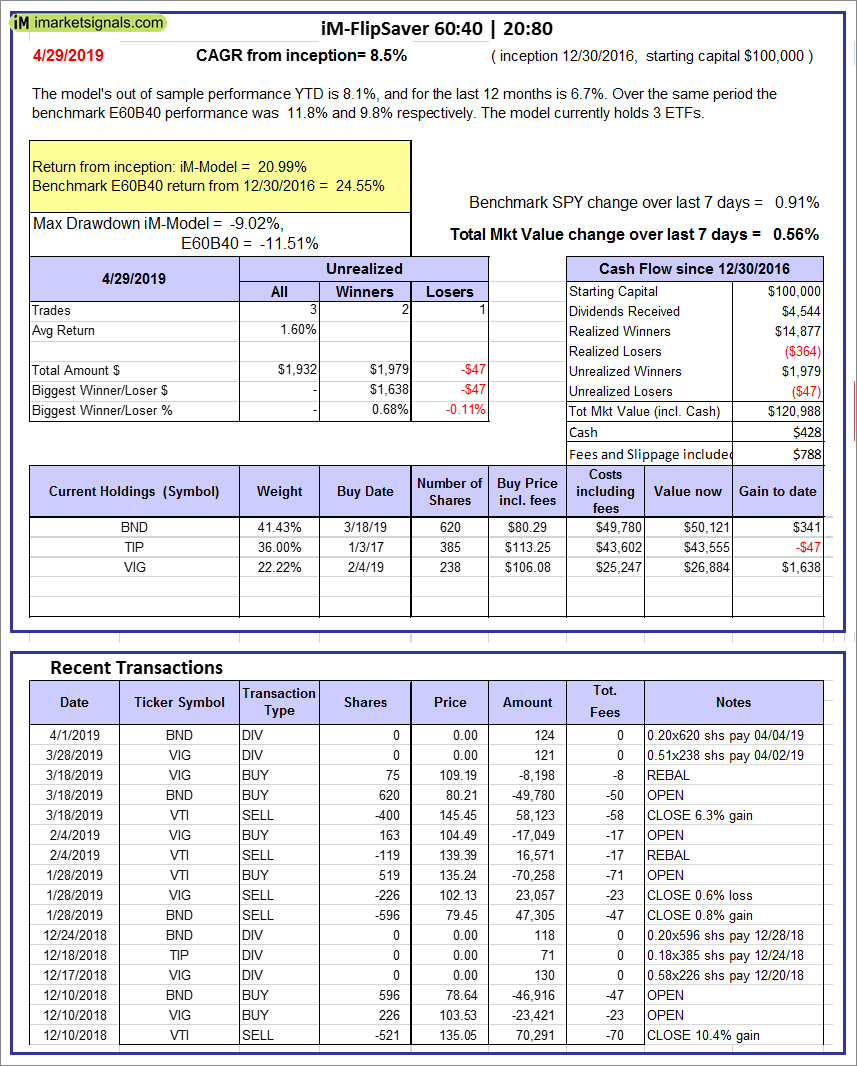 |
iM-FlipSaver 60:40 | 20:80 – 2017: The model’s out of sample performance YTD is 8.1%, and for the last 12 months is 6.7%. Over the same period the benchmark E60B40 performance was 11.8% and 9.8% respectively. Over the previous week the market value of iM-FlipSaver 80:20 | 20:80 gained 0.56% at a time when SPY gained 0.91%. A starting capital of $100,000 at inception on 7/16/2015 would have grown to $120,988 which includes $428 cash and excludes $788 spent on fees and slippage. |
 |
iM-FlipSaver 70:30 | 20:80 – 2017: The model’s out of sample performance YTD is 8.6%, and for the last 12 months is 7.3%. Over the same period the benchmark E60B40 performance was 11.8% and 9.8% respectively. Over the previous week the market value of iM-FlipSaver 70:30 | 20:80 gained 0.55% at a time when SPY gained 0.91%. A starting capital of $100,000 at inception on 7/15/2015 would have grown to $123,739 which includes $586 cash and excludes $909 spent on fees and slippage. |
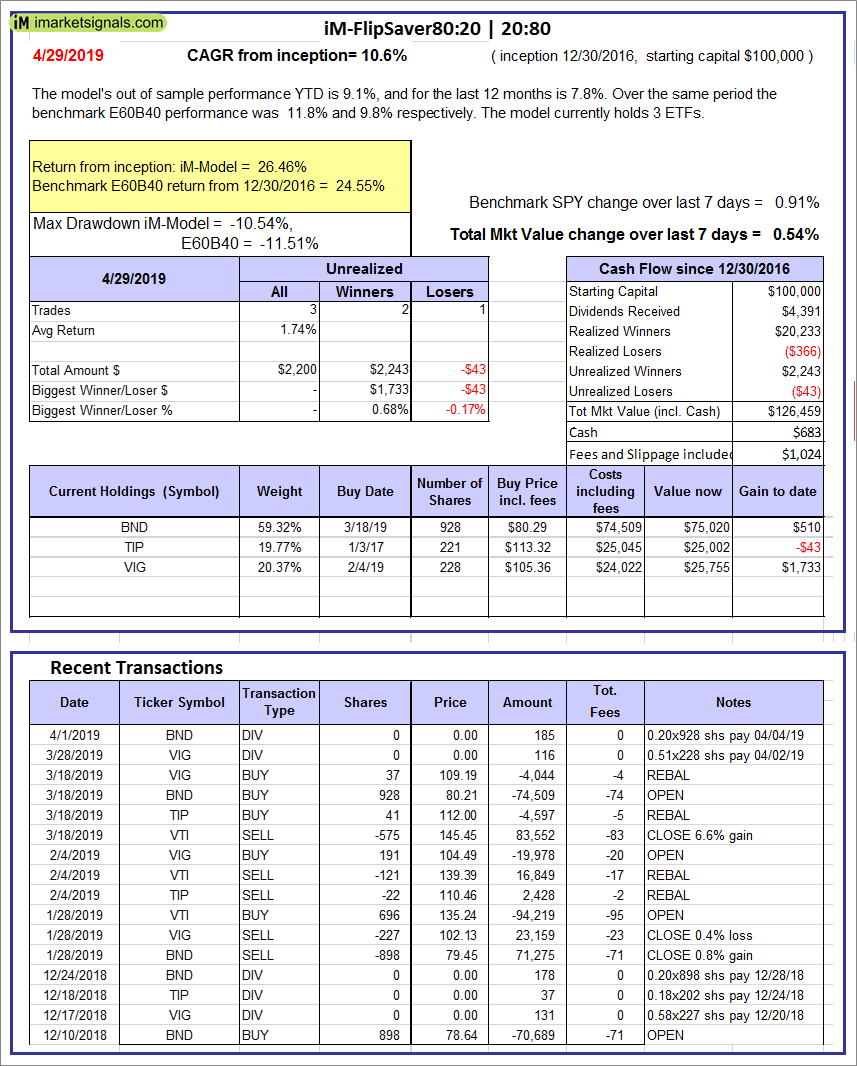 |
iM-FlipSaver 80:20 | 20:80 – 2017: The model’s out of sample performance YTD is 9.1%, and for the last 12 months is 7.8%. Over the same period the benchmark E60B40 performance was 11.8% and 9.8% respectively. Over the previous week the market value of iM-FlipSaver 80:20 | 20:80 gained 0.54% at a time when SPY gained 0.91%. A starting capital of $100,000 at inception on 1/2/2017 would have grown to $126,459 which includes $683 cash and excludes $1,024 spent on fees and slippage. |
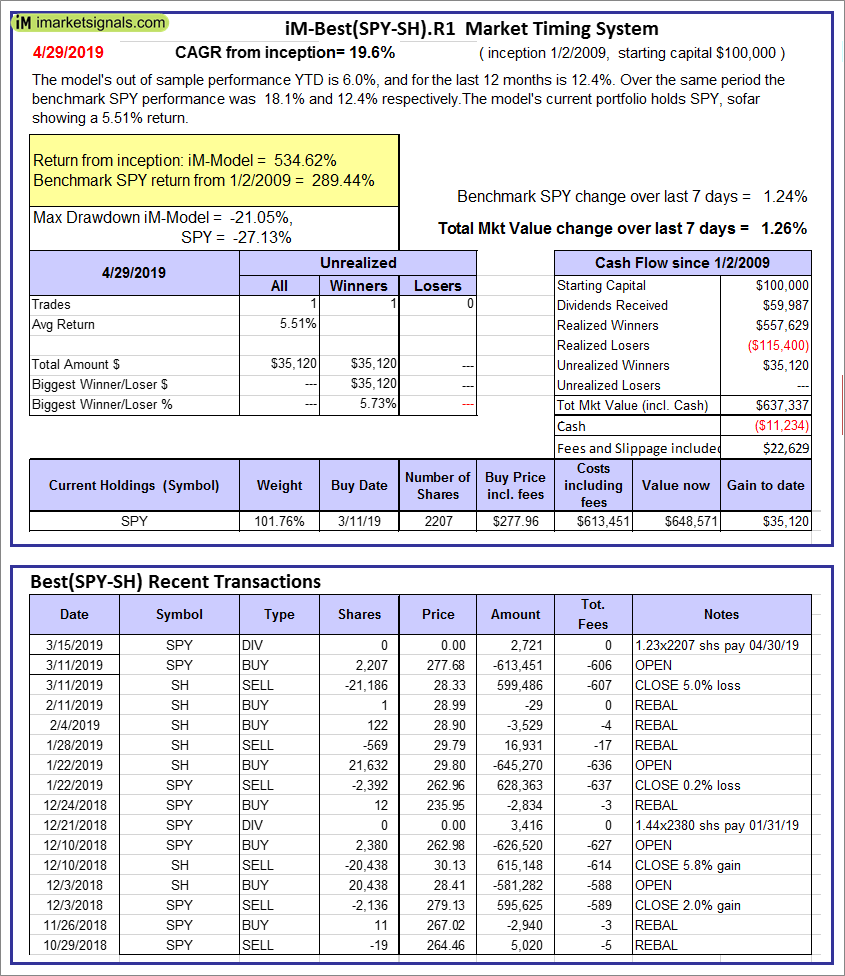 |
iM-Best(SPY-SH).R1: The model’s out of sample performance YTD is 6.0%, and for the last 12 months is 12.4%. Over the same period the benchmark SPY performance was 18.1% and 12.4% respectively. Over the previous week the market value of Best(SPY-SH) gained 1.26% at a time when SPY gained 1.24%. A starting capital of $100,000 at inception on 1/2/2009 would have grown to $637,337 which includes -$11,234 cash and excludes $22,629 spent on fees and slippage. |
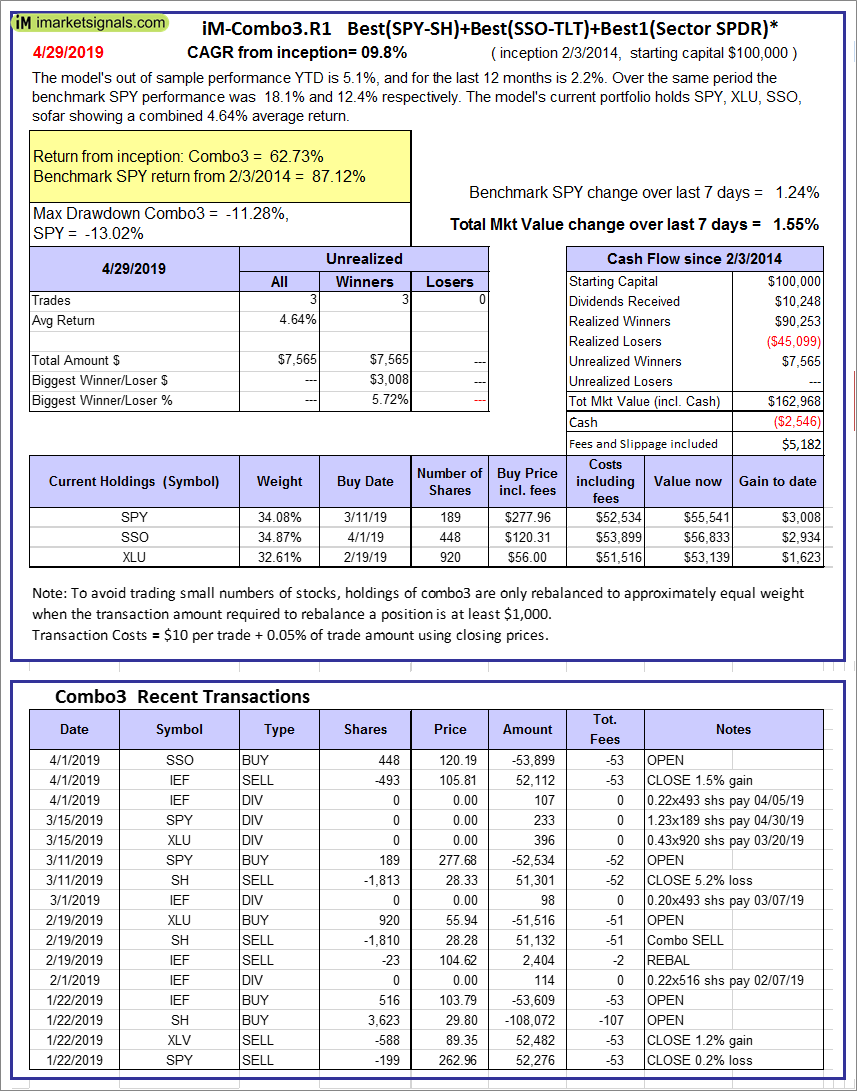 |
iM-Combo3.R1: The model’s out of sample performance YTD is 5.1%, and for the last 12 months is 2.2%. Over the same period the benchmark SPY performance was 18.1% and 12.4% respectively. Over the previous week the market value of iM-Combo3.R1 gained 1.55% at a time when SPY gained 1.24%. A starting capital of $100,000 at inception on 2/3/2014 would have grown to $162,968 which includes -$2,546 cash and excludes $5,182 spent on fees and slippage. |
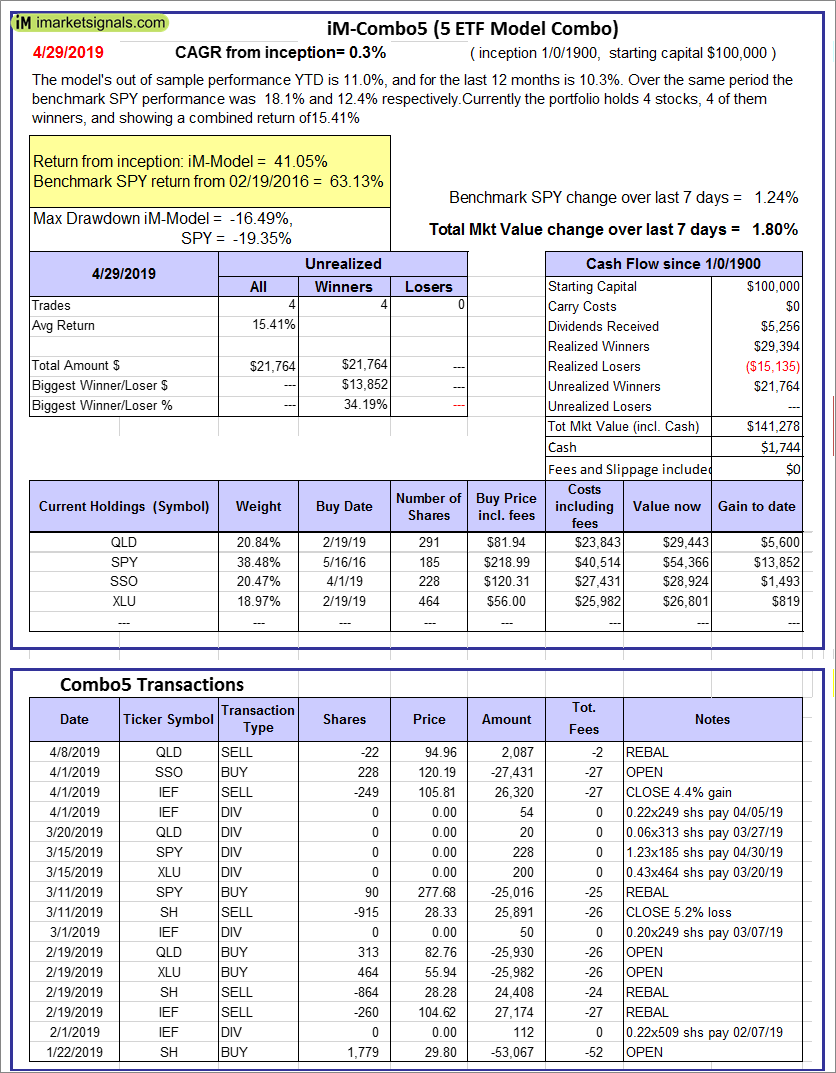 |
iM-Combo5: The model’s out of sample performance YTD is 11.0%, and for the last 12 months is 10.3%. Over the same period the benchmark SPY performance was 18.1% and 12.4% respectively. Over the previous week the market value of iM-Combo5 gained 1.80% at a time when SPY gained 1.24%. A starting capital of $100,000 at inception on 2/22/2016 would have grown to $141,278 which includes $1,744 cash and excludes $0 spent on fees and slippage. |
 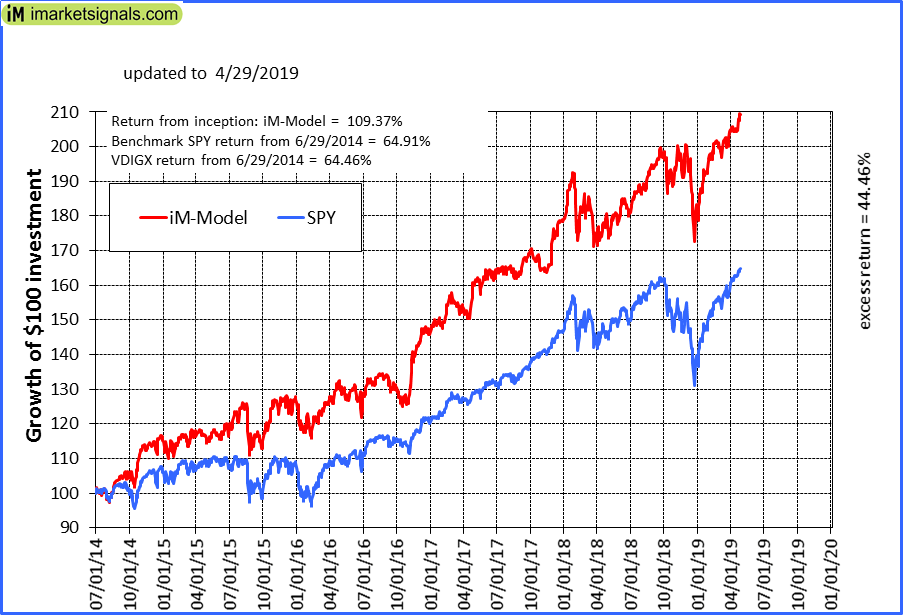 |
iM-Best10(VDIGX)-Trader: The model’s out of sample performance YTD is 14.1%, and for the last 12 months is 15.9%. Over the same period the benchmark SPY performance was 18.1% and 12.4% respectively. Since inception, on 7/1/2014, the model gained 109.37% while the benchmark SPY gained 64.91% and VDIGX gained 64.46% over the same period. Over the previous week the market value of iM-Best10(VDIGX) gained 2.35% at a time when SPY gained 1.24%. A starting capital of $100,000 at inception on 7/1/2014 would have grown to $209,372 which includes $396 cash and excludes $2,511 spent on fees and slippage. |
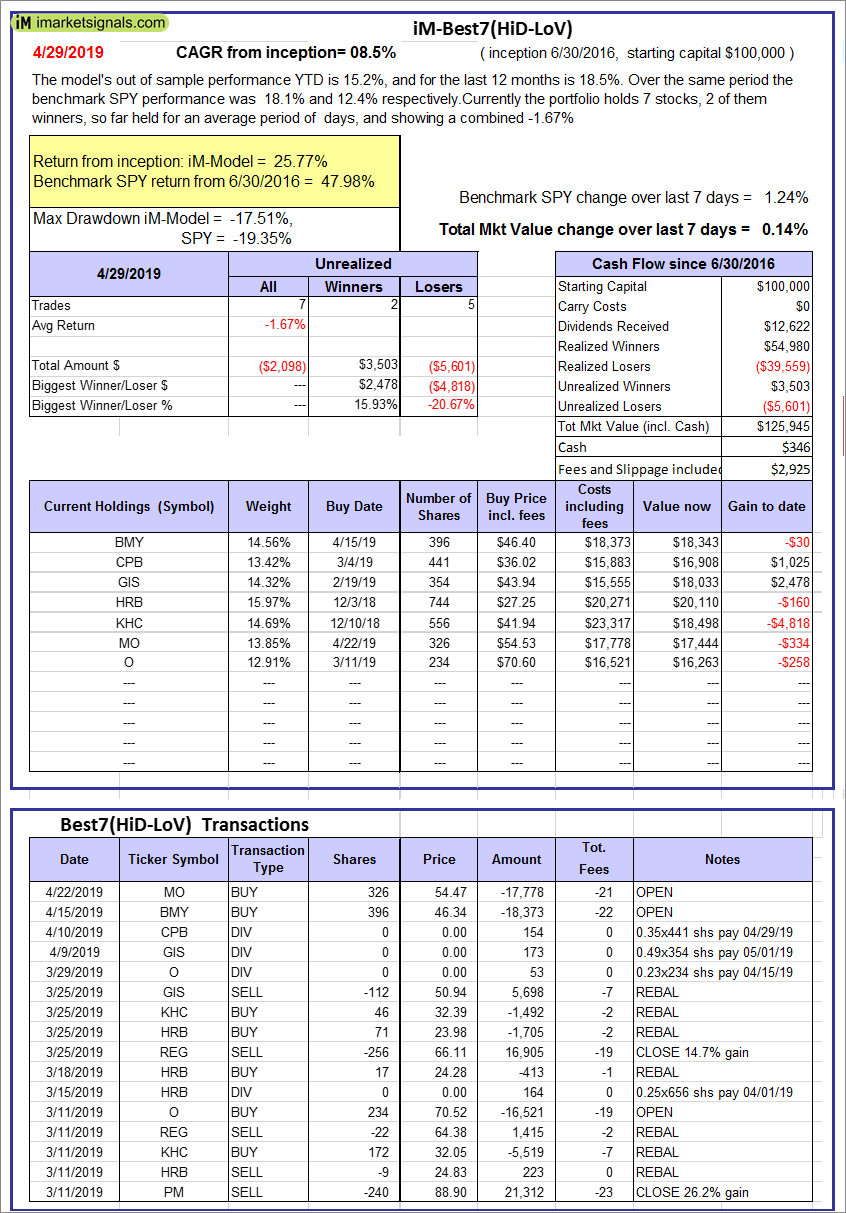 |
iM-Best7(HiD-LoV): The model’s out of sample performance YTD is 15.2%, and for the last 12 months is 18.5%. Over the same period the benchmark SPY performance was 18.1% and 12.4% respectively. Over the previous week the market value of iM-Best7(HiD-LoV) gained 0.14% at a time when SPY gained 1.24%. A starting capital of $100,000 at inception on 6/30/2016 would have grown to $125,945 which includes $346 cash and excludes $2,925 spent on fees and slippage. |
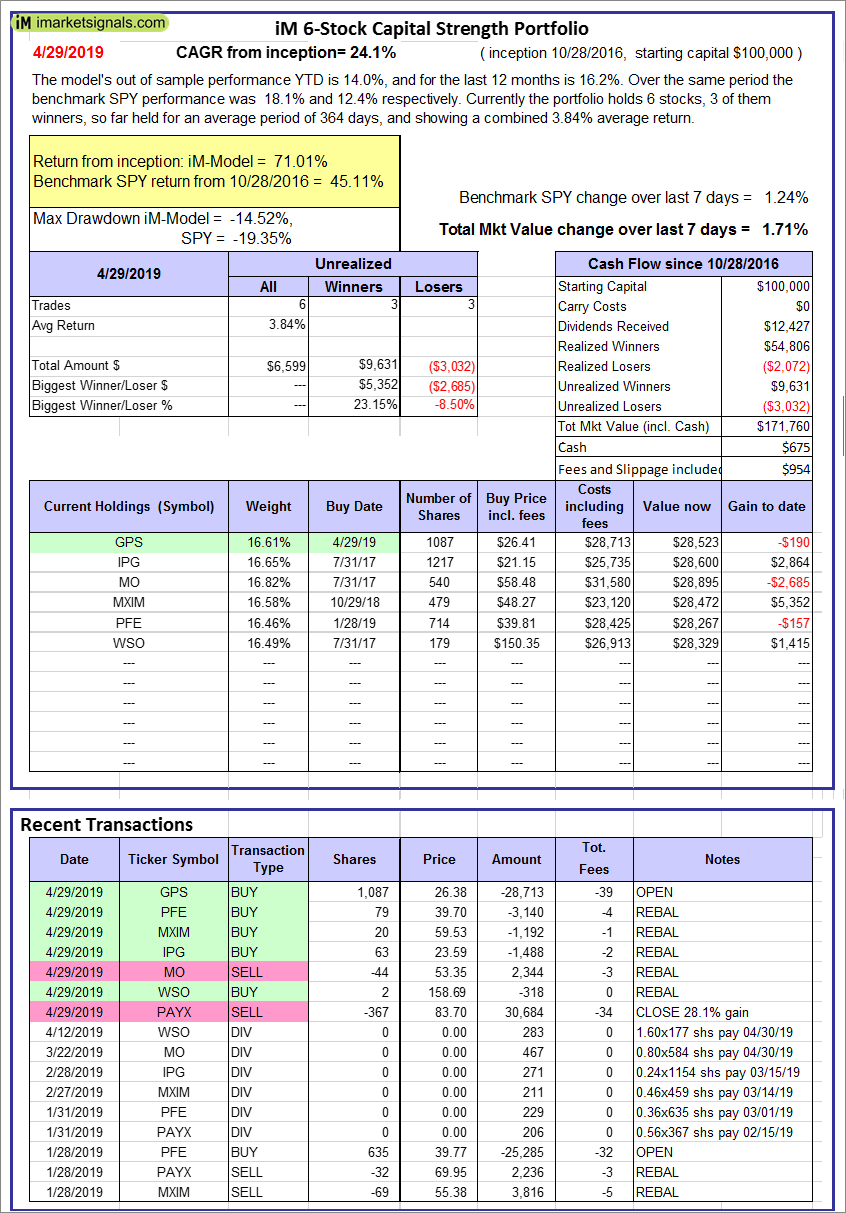 |
iM 6-Stock Capital Strength Portfolio: The model’s out of sample performance YTD is 14.0%, and for the last 12 months is 16.2%. Over the same period the benchmark SPY performance was 18.1% and 12.4% respectively. Over the previous week the market value of the iM 6-Stock Capital Strength Portfolio gained 1.71% at a time when SPY gained 1.24%. A starting capital of $100,000 at inception on 10/28/2016 would have grown to $171,760 which includes $675 cash and excludes $954 spent on fees and slippage. |
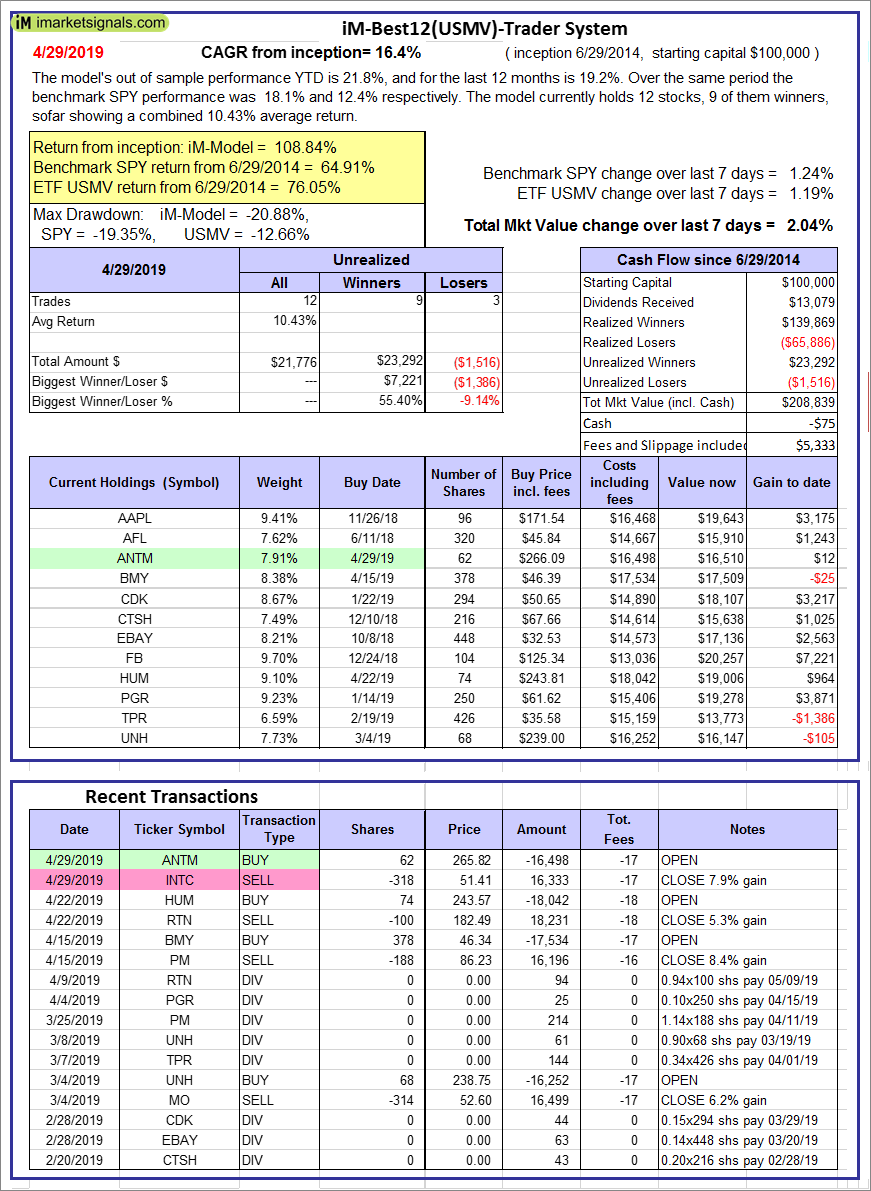  |
iM-Best12(USMV)-Trader: The model’s out of sample performance YTD is 21.8%, and for the last 12 months is 19.2%. Over the same period the benchmark SPY performance was 18.1% and 12.4% respectively. Since inception, on 6/30/2014, the model gained 108.84% while the benchmark SPY gained 64.91% and the ETF USMV gained 76.05% over the same period. Over the previous week the market value of iM-Best12(USMV)-Trader gained 2.04% at a time when SPY gained 1.24%. A starting capital of $100,000 at inception on 6/30/2014 would have grown to $208,839 which includes -$75 cash and excludes $5,333 spent on fees and slippage. |
  |
iM-Best12(USMV)Q1-Investor: The model’s out of sample performance YTD is 21.2%, and for the last 12 months is 17.1%. Over the same period the benchmark SPY performance was 18.1% and 12.4% respectively. Since inception, on 1/5/2015, the model gained 99.25% while the benchmark SPY gained 58.48% and the ETF USMV gained 61.68% over the same period. Over the previous week the market value of iM-Best12(USMV)Q1 gained 2.62% at a time when SPY gained 1.24%. A starting capital of $100,000 at inception on 1/5/2015 would have grown to $199,253 which includes $1,220 cash and excludes $1,442 spent on fees and slippage. |
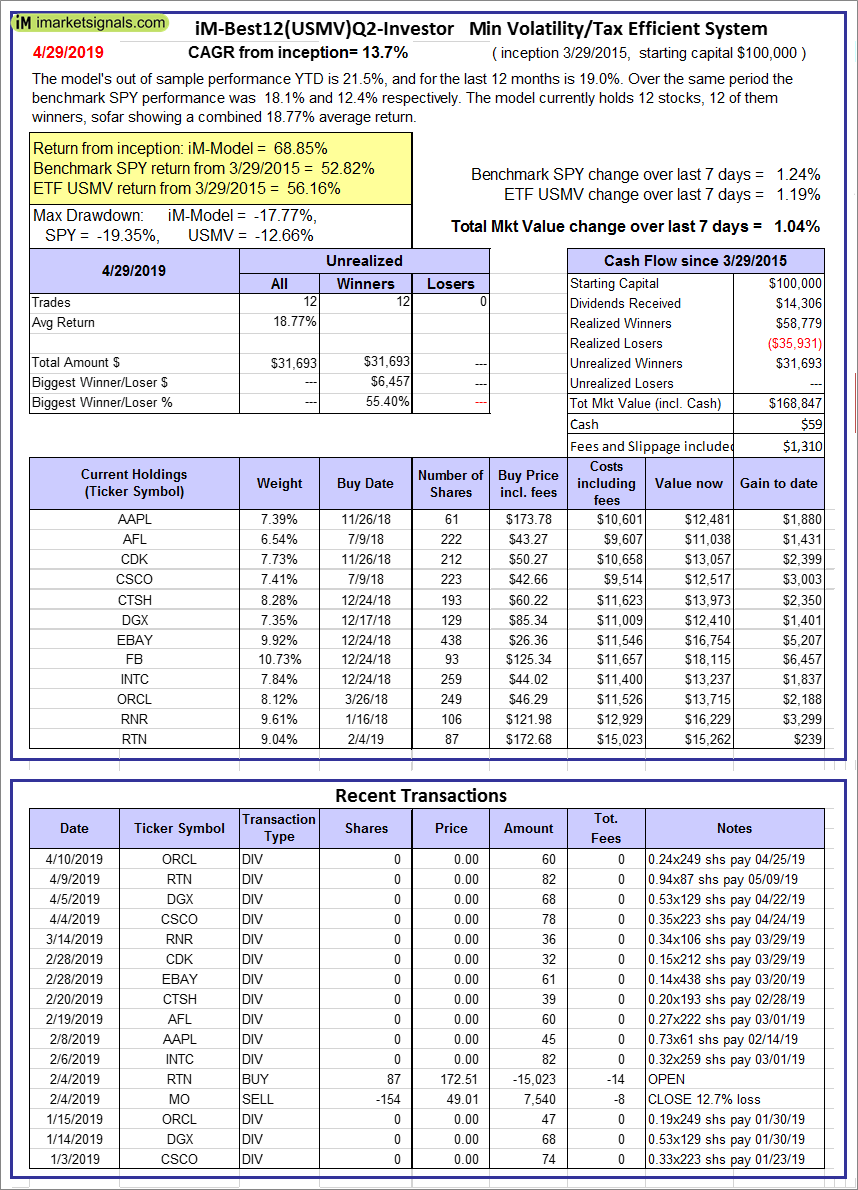 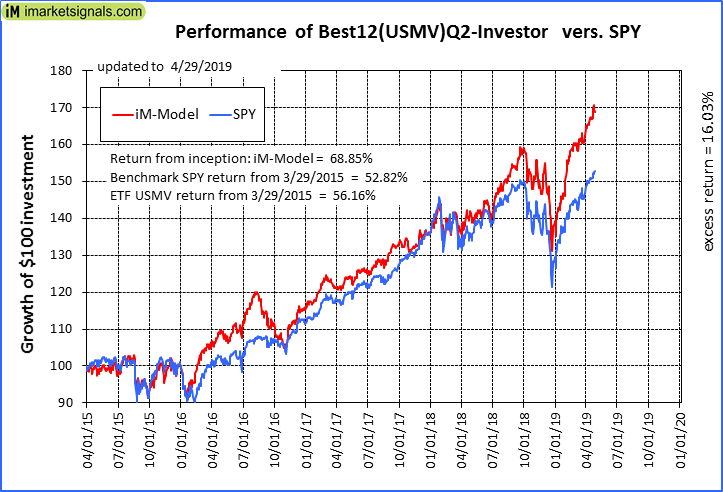 |
iM-Best12(USMV)Q2-Investor: The model’s out of sample performance YTD is 21.5%, and for the last 12 months is 19.0%. Over the same period the benchmark SPY performance was 18.1% and 12.4% respectively. Since inception, on 3/30/2015, the model gained 68.85% while the benchmark SPY gained 52.82% and the ETF USMV gained 56.16% over the same period. Over the previous week the market value of iM-Best12(USMV)Q2 gained 1.04% at a time when SPY gained 1.24%. A starting capital of $100,000 at inception on 3/30/2015 would have grown to $168,847 which includes $59 cash and excludes $1,310 spent on fees and slippage. |
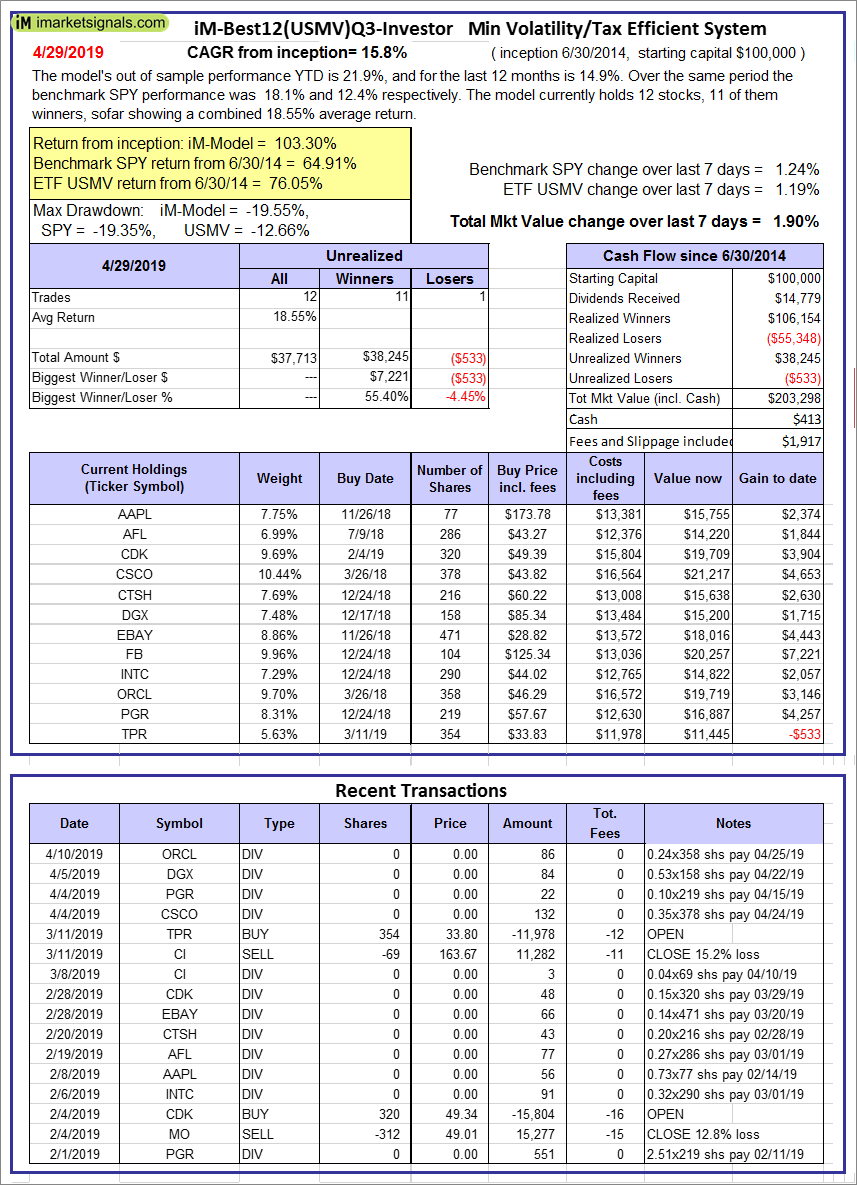 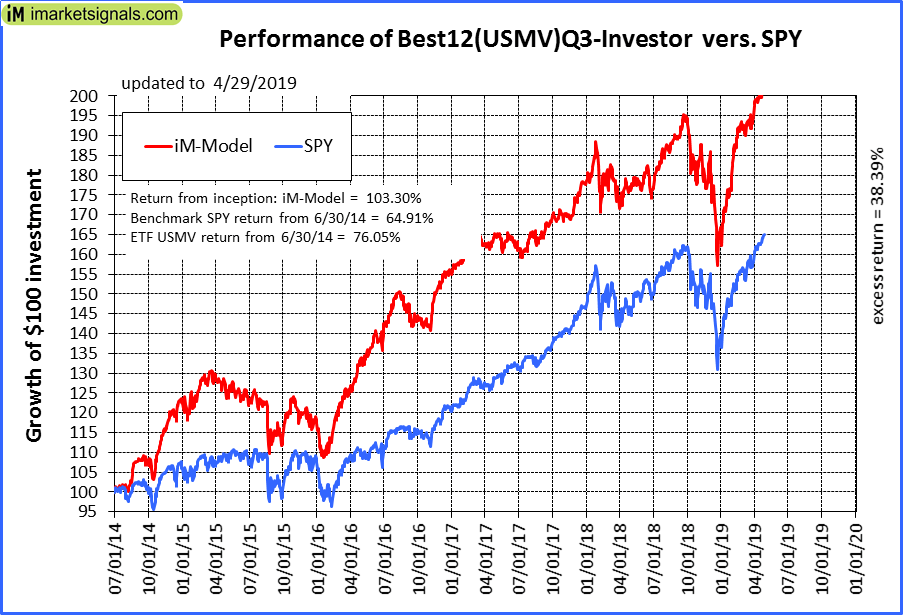 |
iM-Best12(USMV)Q3-Investor: The model’s out of sample performance YTD is 21.9%, and for the last 12 months is 14.9%. Over the same period the benchmark SPY performance was 18.1% and 12.4% respectively. Since inception, on 7/1/2014, the model gained 103.30% while the benchmark SPY gained 64.91% and the ETF USMV gained 76.05% over the same period. Over the previous week the market value of iM-Best12(USMV)Q3 gained 1.90% at a time when SPY gained 1.24%. A starting capital of $100,000 at inception on 7/1/2014 would have grown to $203,298 which includes $413 cash and excludes $1,917 spent on fees and slippage. |
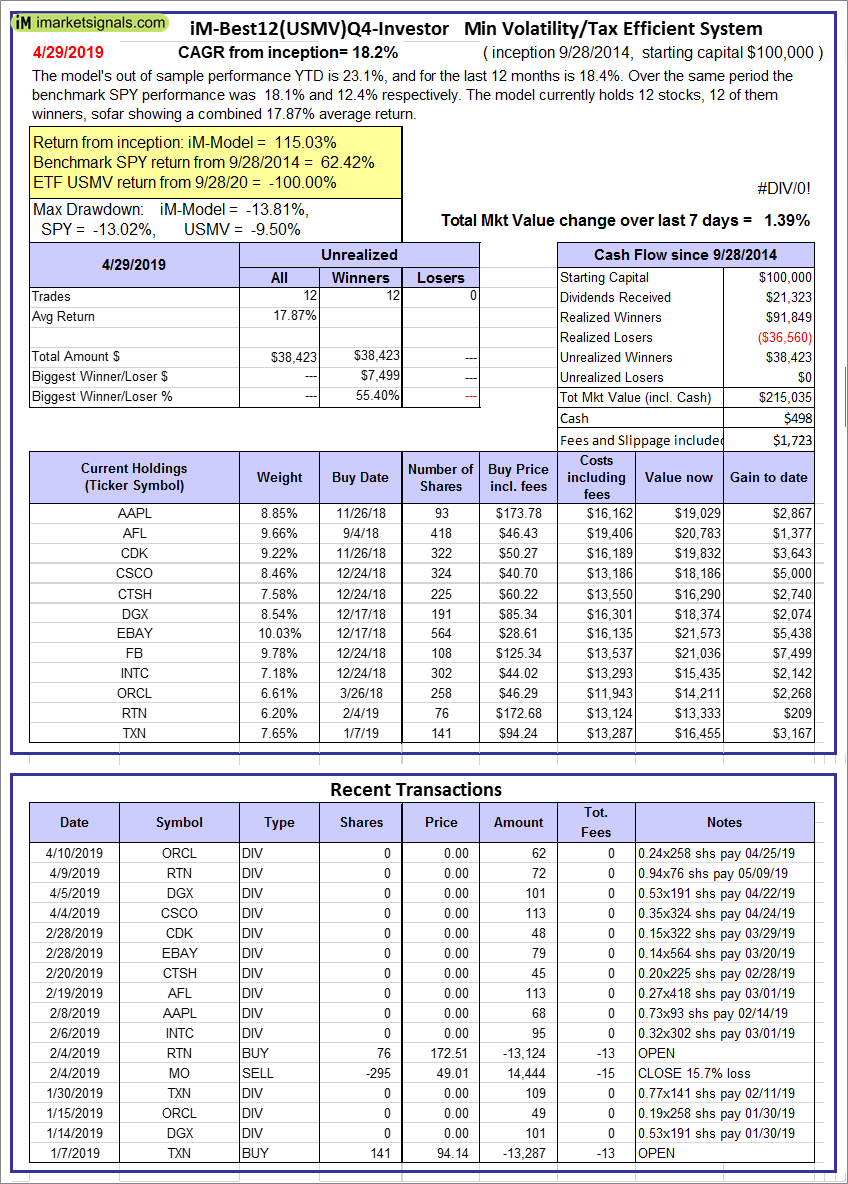  |
iM-Best12(USMV)Q4-Investor: Since inception, on 9/29/2014, the model gained 115.03% while the benchmark SPY gained 62.42% and the ETF USMV gained -100.00% over the same period. Over the previous week the market value of iM-Best12(USMV)Q4 gained 1.39% at a time when SPY gained 1.24%. A starting capital of $100,000 at inception on 9/29/2014 would have grown to $215,035 which includes $498 cash and excludes $1,723 spent on fees and slippage. |
 |
Average Performance of iM-Best12(USMV)Q1+Q2+Q3+Q4-Investor resulted in an excess return of 55.52% over SPY. (see iM-USMV Investor Portfolio) |
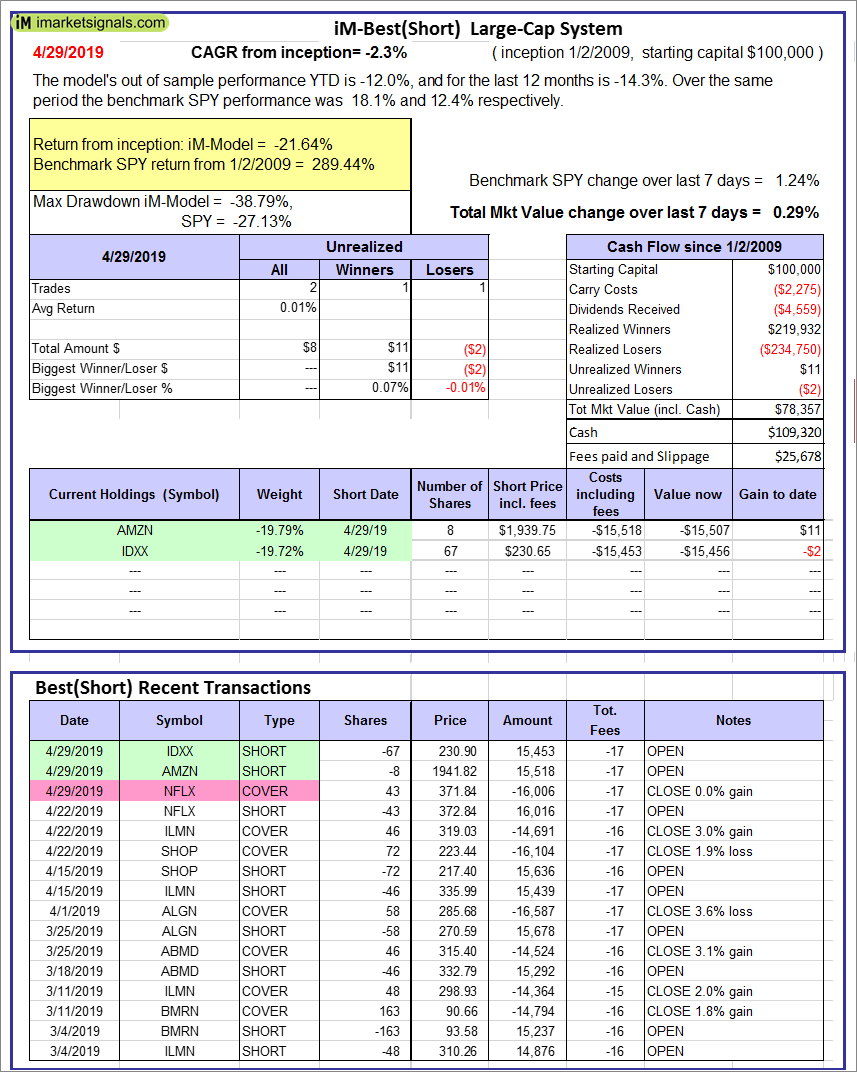 |
iM-Best(Short): The model’s out of sample performance YTD is -12.0%, and for the last 12 months is -14.3%. Over the same period the benchmark SPY performance was 18.1% and 12.4% respectively. Over the previous week the market value of iM-Best(Short) gained 0.29% at a time when SPY gained 1.24%. Over the period 1/2/2009 to 4/29/2019 the starting capital of $100,000 would have grown to $78,357 which includes $109,320 cash and excludes $25,678 spent on fees and slippage. |
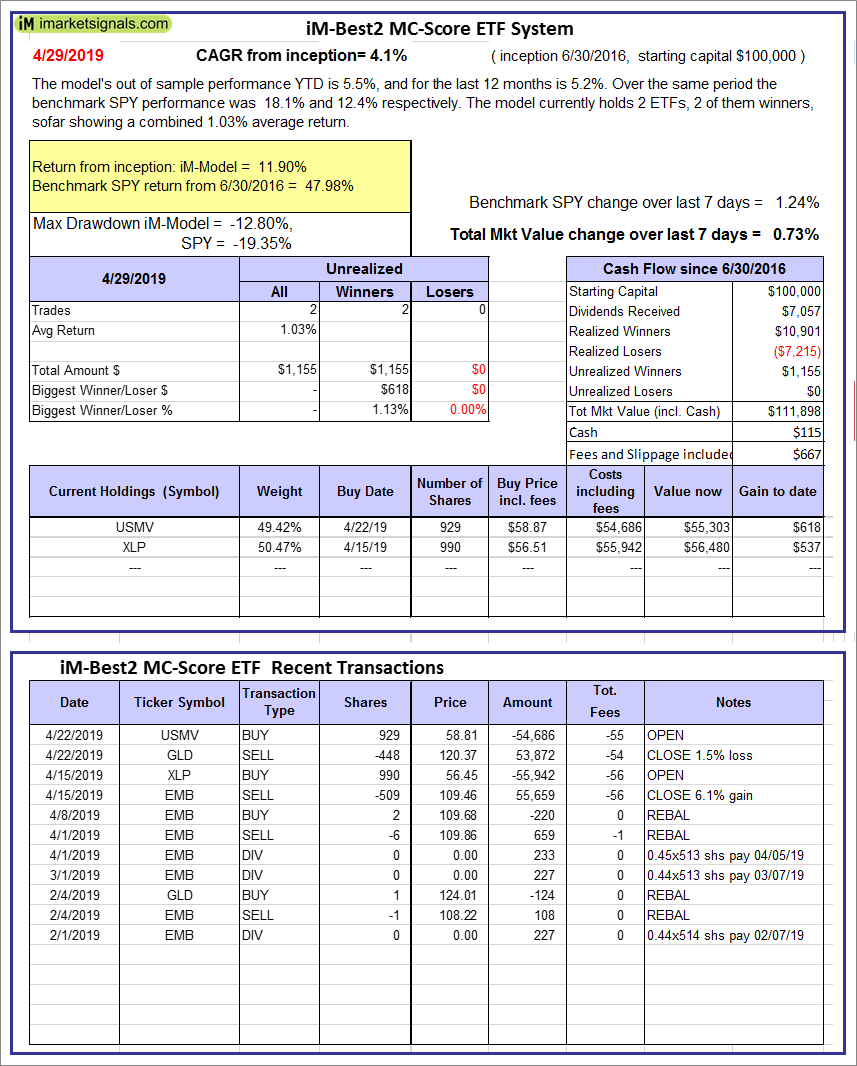 |
iM-Best2 MC-Score ETF System: The model’s out of sample performance YTD is 5.5%, and for the last 12 months is 5.2%. Over the same period the benchmark SPY performance was 18.1% and 12.4% respectively. Over the previous week the market value of the iM-Best2 MC-Score ETF System gained 0.73% at a time when SPY gained 1.24%. A starting capital of $100,000 at inception on 6/30/2016 would have grown to $111,898 which includes $115 cash and excludes $667 spent on fees and slippage. |
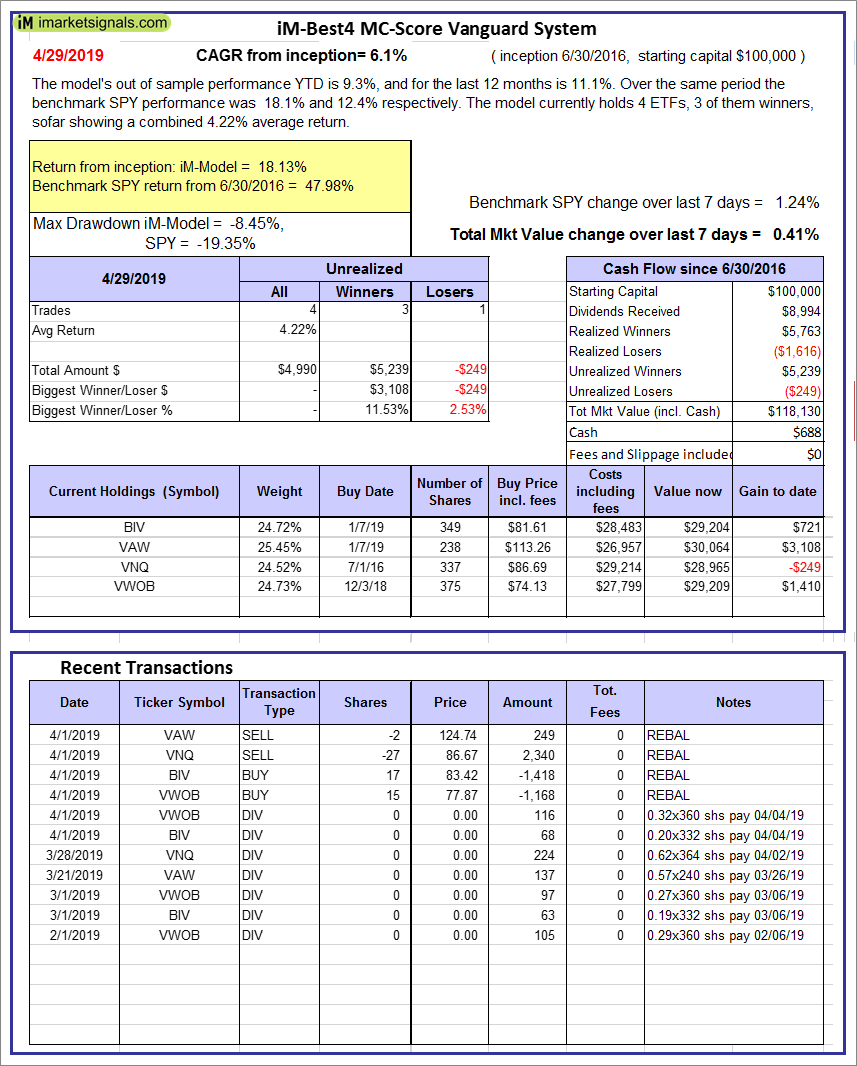 |
iM-Best4 MC-Score Vanguard System: The model’s out of sample performance YTD is 9.3%, and for the last 12 months is 11.1%. Over the same period the benchmark SPY performance was 18.1% and 12.4% respectively. Over the previous week the market value of the iM-Best4 MC-Score Vanguard System gained 0.41% at a time when SPY gained 1.24%. A starting capital of $100,000 at inception on 6/30/2016 would have grown to $118,130 which includes $688 cash and excludes $00 spent on fees and slippage. |
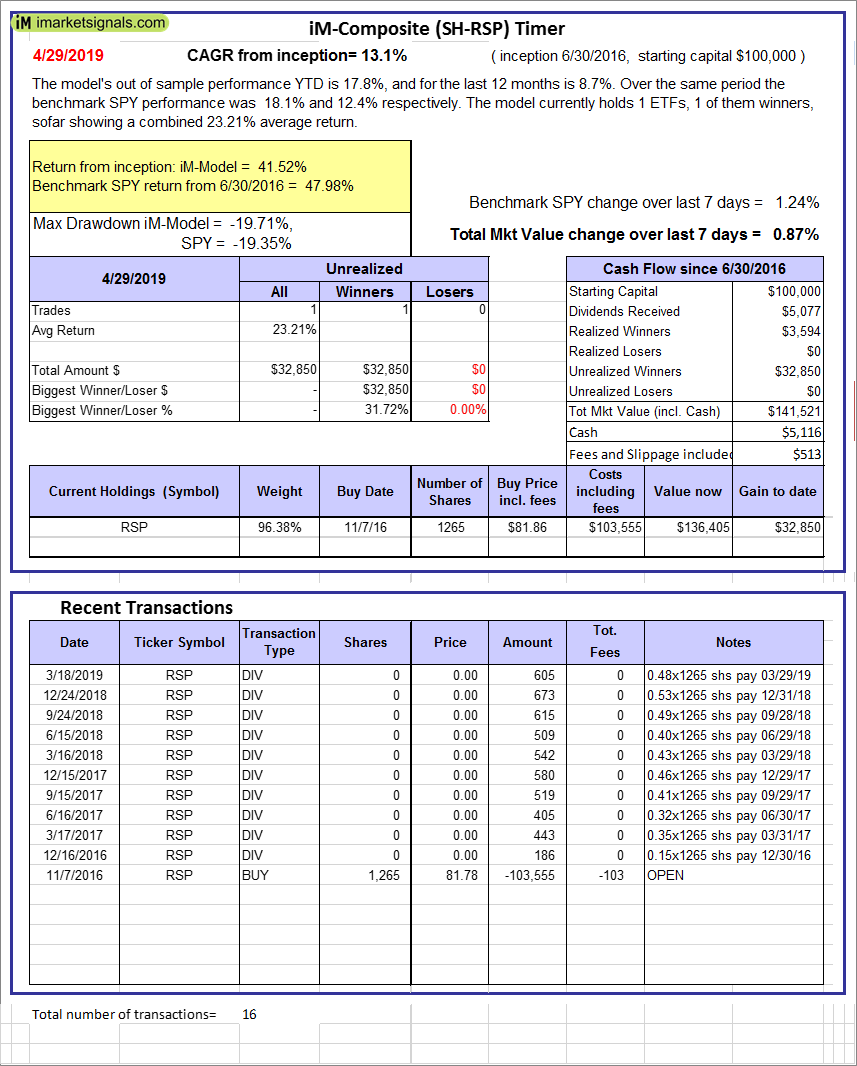 |
iM-Composite (SH-RSP) Timer: The model’s out of sample performance YTD is 17.8%, and for the last 12 months is 8.7%. Over the same period the benchmark SPY performance was 18.1% and 12.4% respectively. Over the previous week the market value of the iM-Composite (SH-RSP) Timer gained 0.87% at a time when SPY gained 1.24%. A starting capital of $100,000 at inception on 6/30/2016 would have grown to $141,521 which includes $5,116 cash and excludes $513 spent on fees and slippage. |
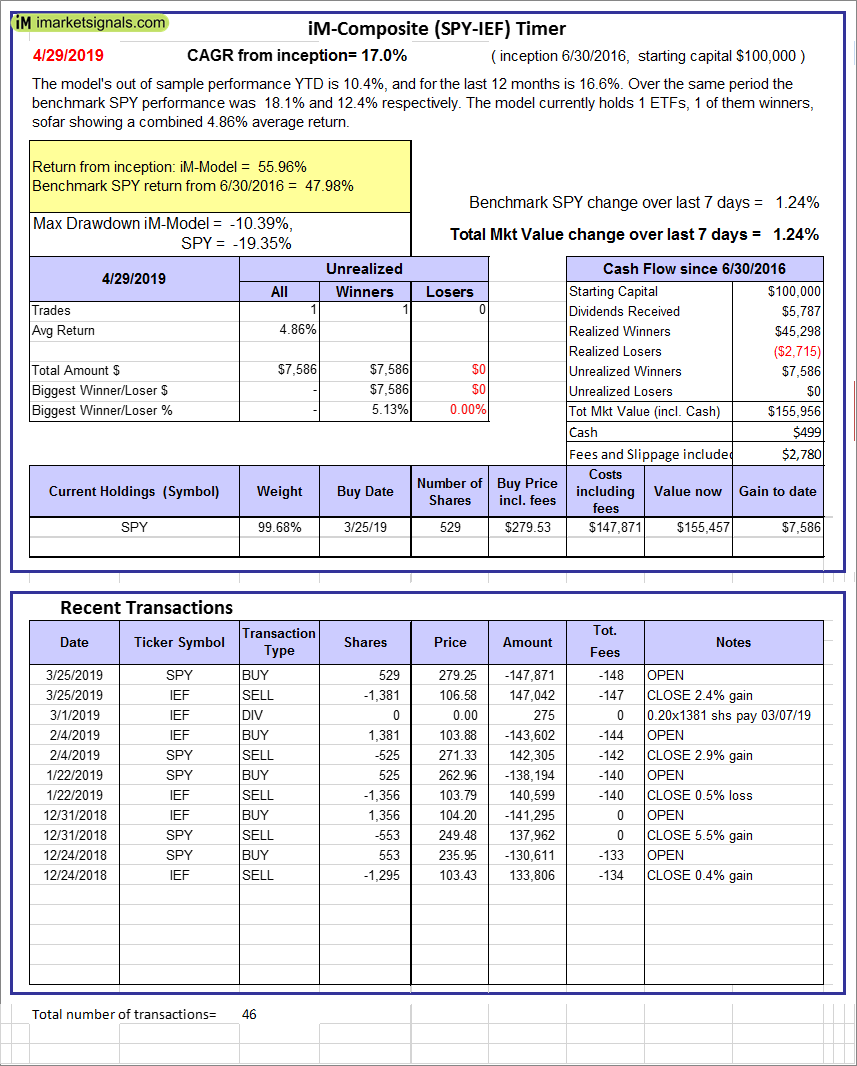 |
iM-Composite (SPY-IEF) Timer: The model’s out of sample performance YTD is 10.4%, and for the last 12 months is 16.6%. Over the same period the benchmark SPY performance was 18.1% and 12.4% respectively. Over the previous week the market value of the iM-Composite (SPY-IEF) Timer gained 1.24% at a time when SPY gained 1.24%. A starting capital of $100,000 at inception on 6/30/2016 would have grown to $155,956 which includes $499 cash and excludes $2,780 spent on fees and slippage. |
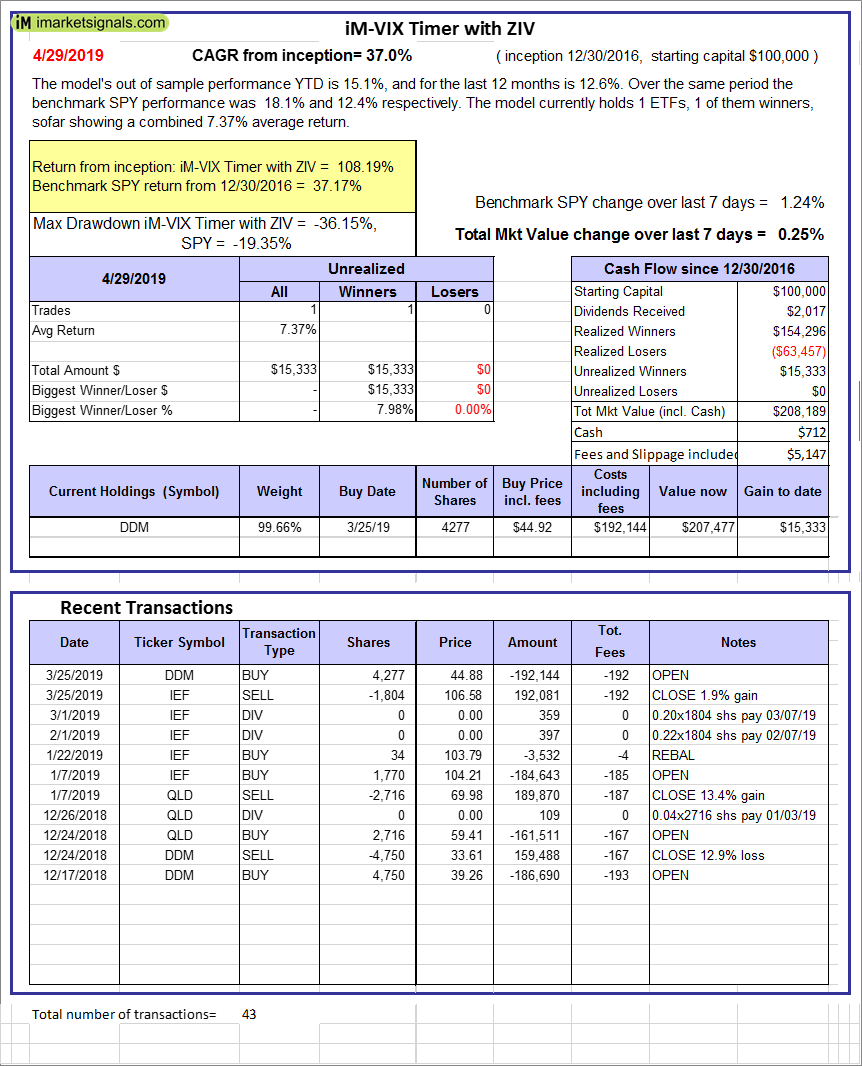 |
iM-VIX Timer with ZIV: The model’s out of sample performance YTD is 15.1%, and for the last 12 months is 12.6%. Over the same period the benchmark SPY performance was 18.1% and 12.4% respectively. Over the previous week the market value of the iM-VIX Timer with ZIV gained 0.25% at a time when SPY gained 1.24%. A starting capital of $100,000 at inception on 6/30/2016 would have grown to $208,189 which includes $712 cash and excludes $5,147 spent on fees and slippage. |
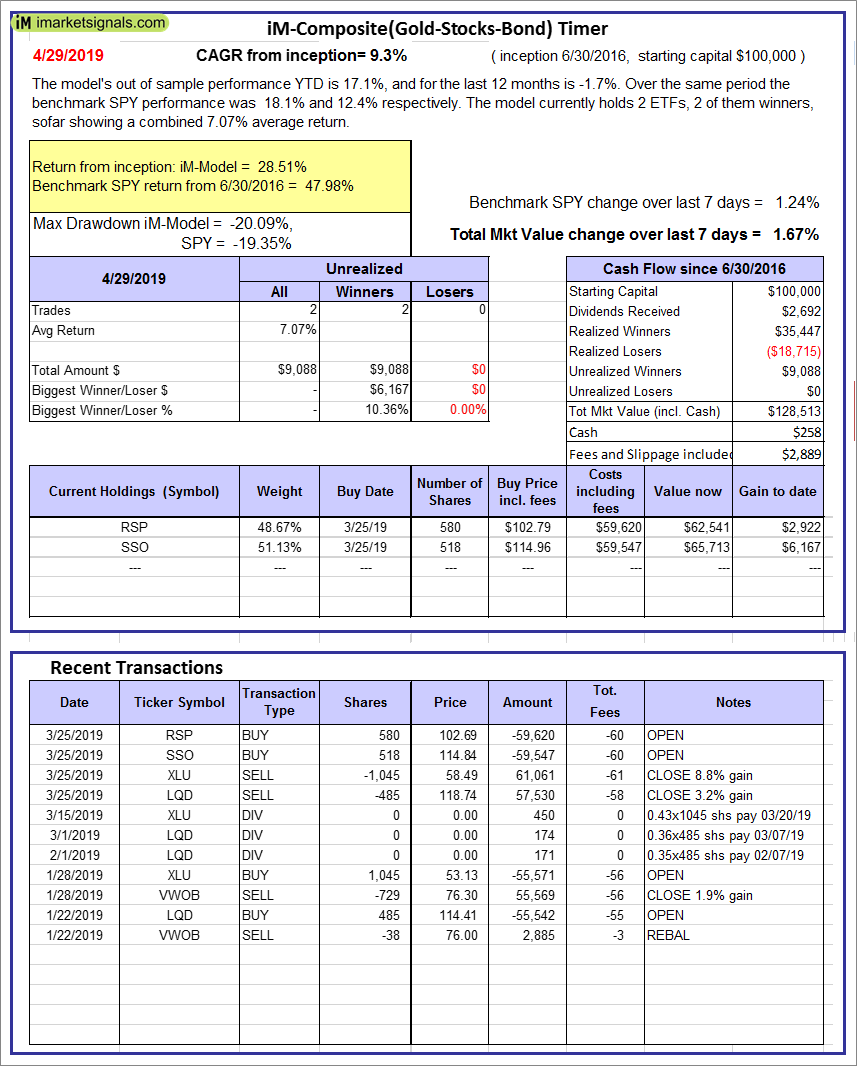 |
iM-Composite(Gold-Stocks-Bond) Timer: The model’s out of sample performance YTD is 17.1%, and for the last 12 months is -1.7%. Over the same period the benchmark SPY performance was 18.1% and 12.4% respectively. Over the previous week the market value of the iM-Composite(Gold-Stocks-Bond) Timer gained 1.67% at a time when SPY gained 1.24%. A starting capital of $100,000 at inception on 6/30/2016 would have grown to $128,513 which includes $258 cash and excludes $2,889 spent on fees and slippage. |
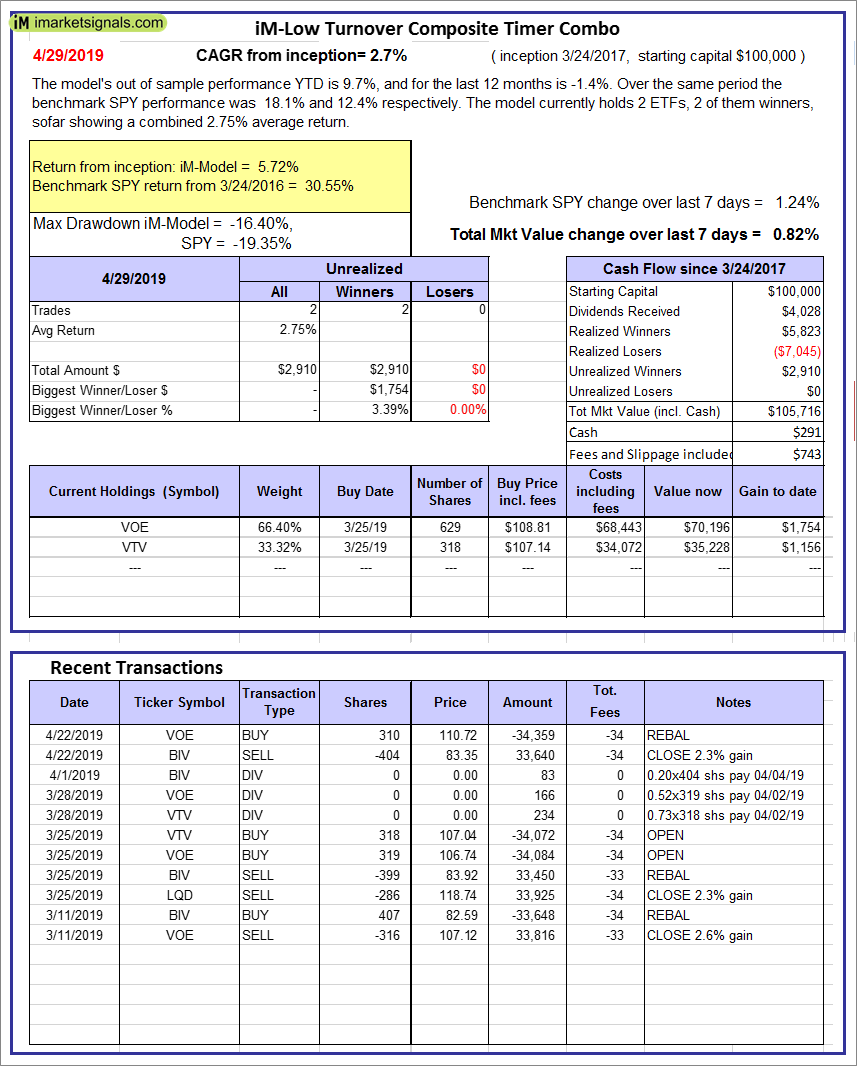 |
iM-Low Turnover Composite Timer Combo: The model’s out of sample performance YTD is 9.7%, and for the last 12 months is -1.4%. Over the same period the benchmark SPY performance was 18.1% and 12.4% respectively. Over the previous week the market value of the iM-Low Turnover Composite Timer Combo gained 0.82% at a time when SPY gained 1.24%. A starting capital of $100,000 at inception on 3/24/27 would have grown to $105,716 which includes $291 cash and excludes $743 spent on fees and slippage. |
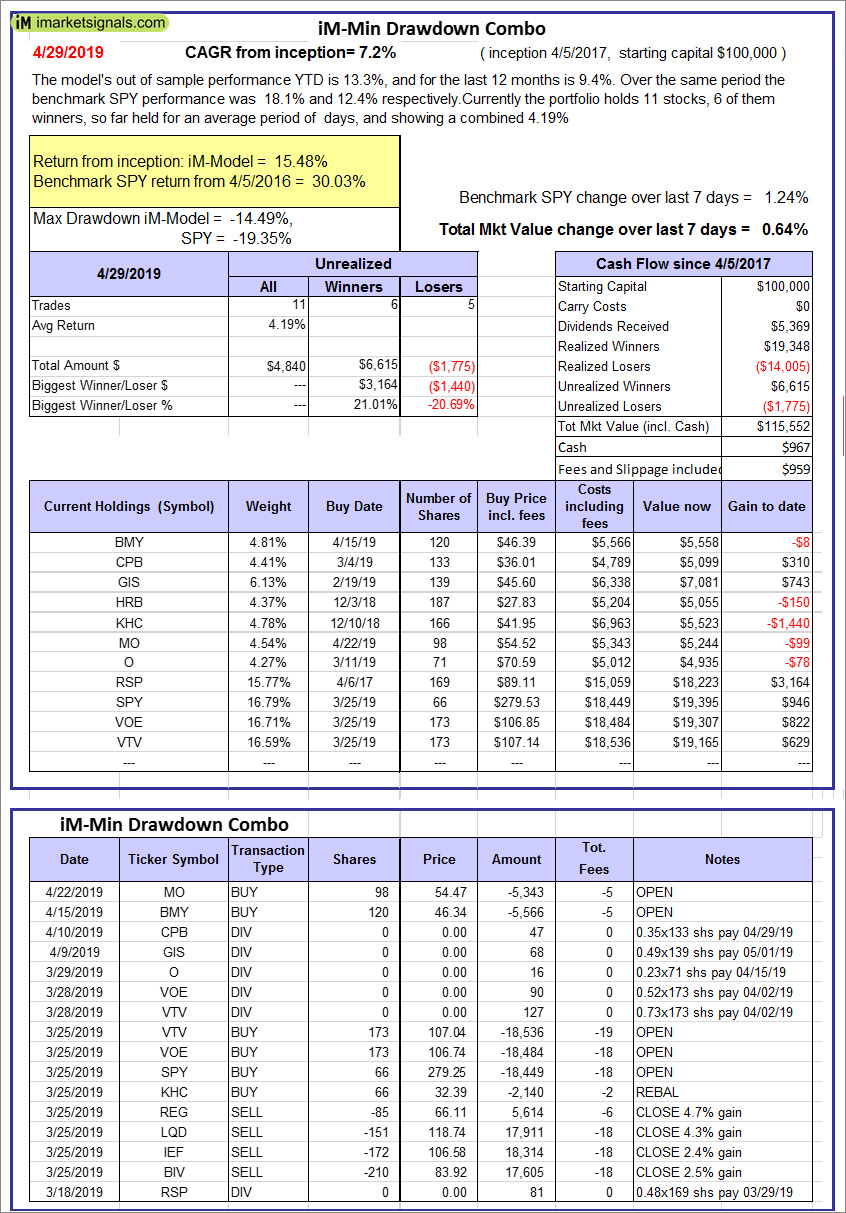 |
iM-Min Drawdown Combo: The model’s out of sample performance YTD is 13.3%, and for the last 12 months is 9.4%. Over the same period the benchmark SPY performance was 18.1% and 12.4% respectively. Over the previous week the market value of the iM-Min Drawdown Combo gained 0.64% at a time when SPY gained 1.24%. A starting capital of $100,000 at inception on 4/5/2017 would have grown to $115,552 which includes $967 cash and excludes $959 spent on fees and slippage. |
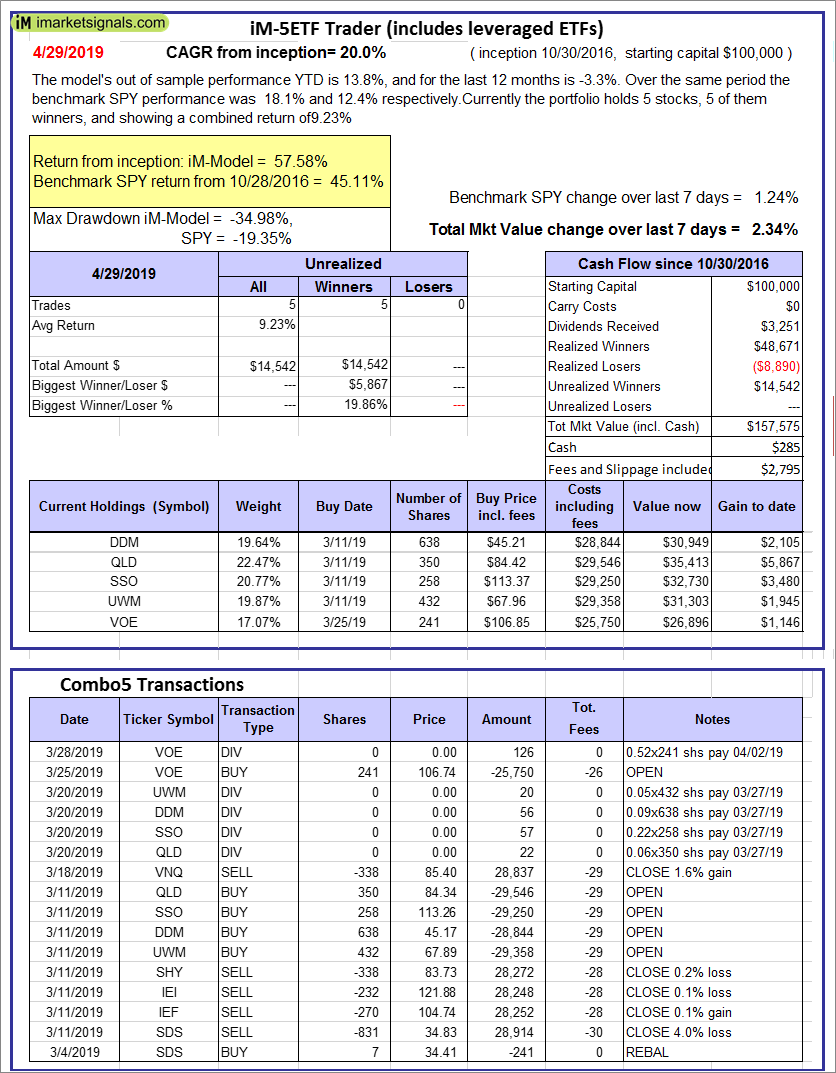 |
iM-5ETF Trader (includes leveraged ETFs): The model’s out of sample performance YTD is 13.8%, and for the last 12 months is -3.3%. Over the same period the benchmark SPY performance was 18.1% and 12.4% respectively. Over the previous week the market value of the iM-5ETF Trader (includes leveraged ETFs) gained 2.34% at a time when SPY gained 1.24%. A starting capital of $100,000 at inception on 10/30/2016 would have grown to $157,575 which includes $285 cash and excludes $2,795 spent on fees and slippage. |
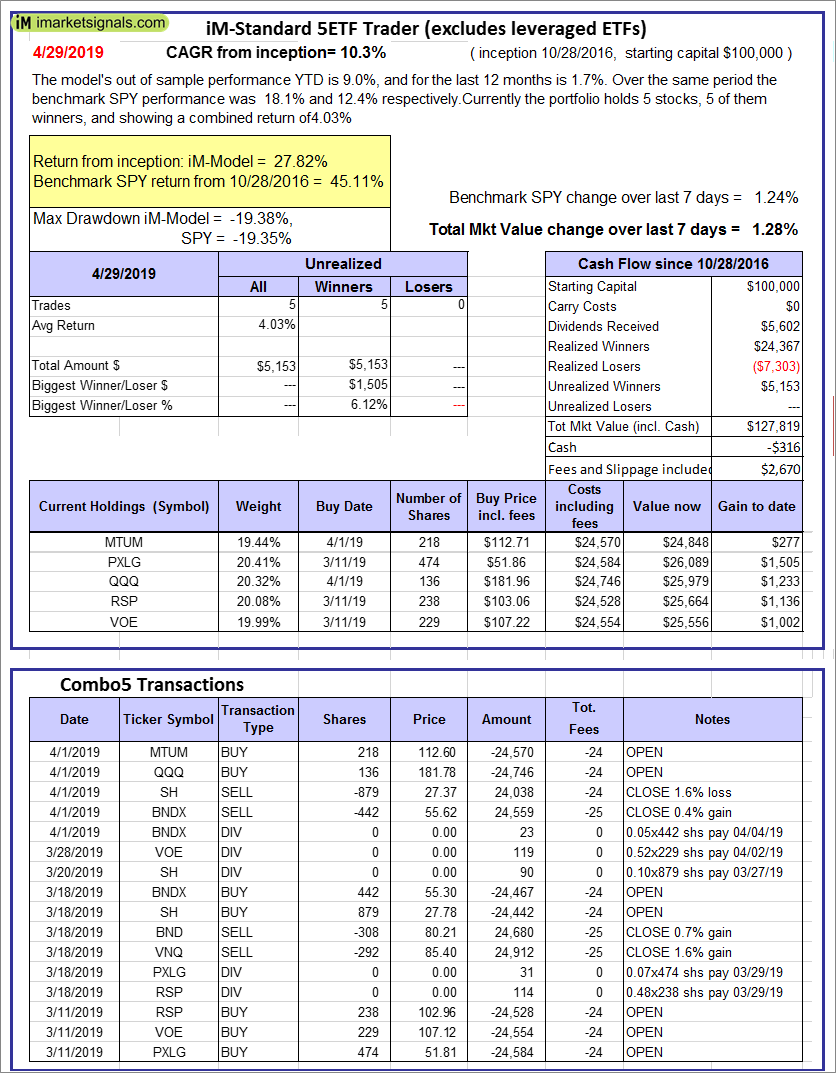 |
iM-Standard 5ETF Trader (excludes leveraged ETFs): The model’s out of sample performance YTD is 9.0%, and for the last 12 months is 1.7%. Over the same period the benchmark SPY performance was 18.1% and 12.4% respectively. Over the previous week the market value of the iM-Standard 5ETF Trader (excludes leveraged ETFs) gained 1.28% at a time when SPY gained 1.24%. A starting capital of $100,000 at inception on 10/30/2016 would have grown to $127,819 which includes -$316 cash and excludes $2,670 spent on fees and slippage. |
iM-Best Reports – 4/29/2019
Posted in pmp SPY-SH
Leave a Reply
You must be logged in to post a comment.