  |
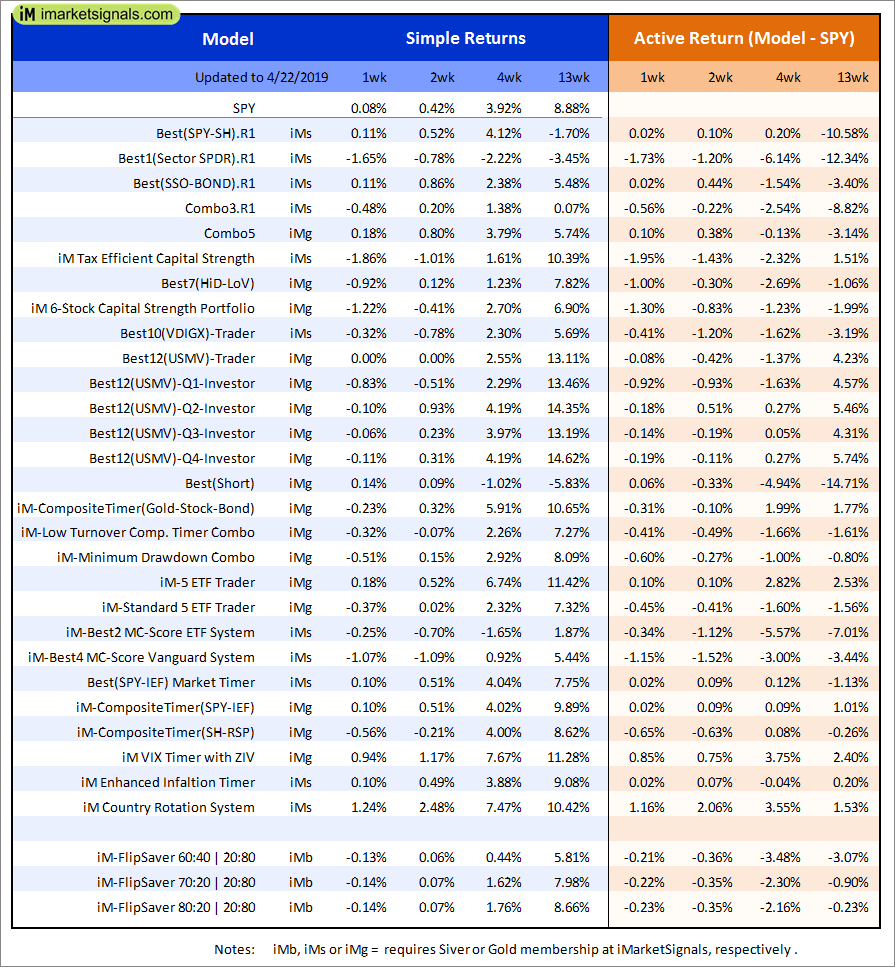
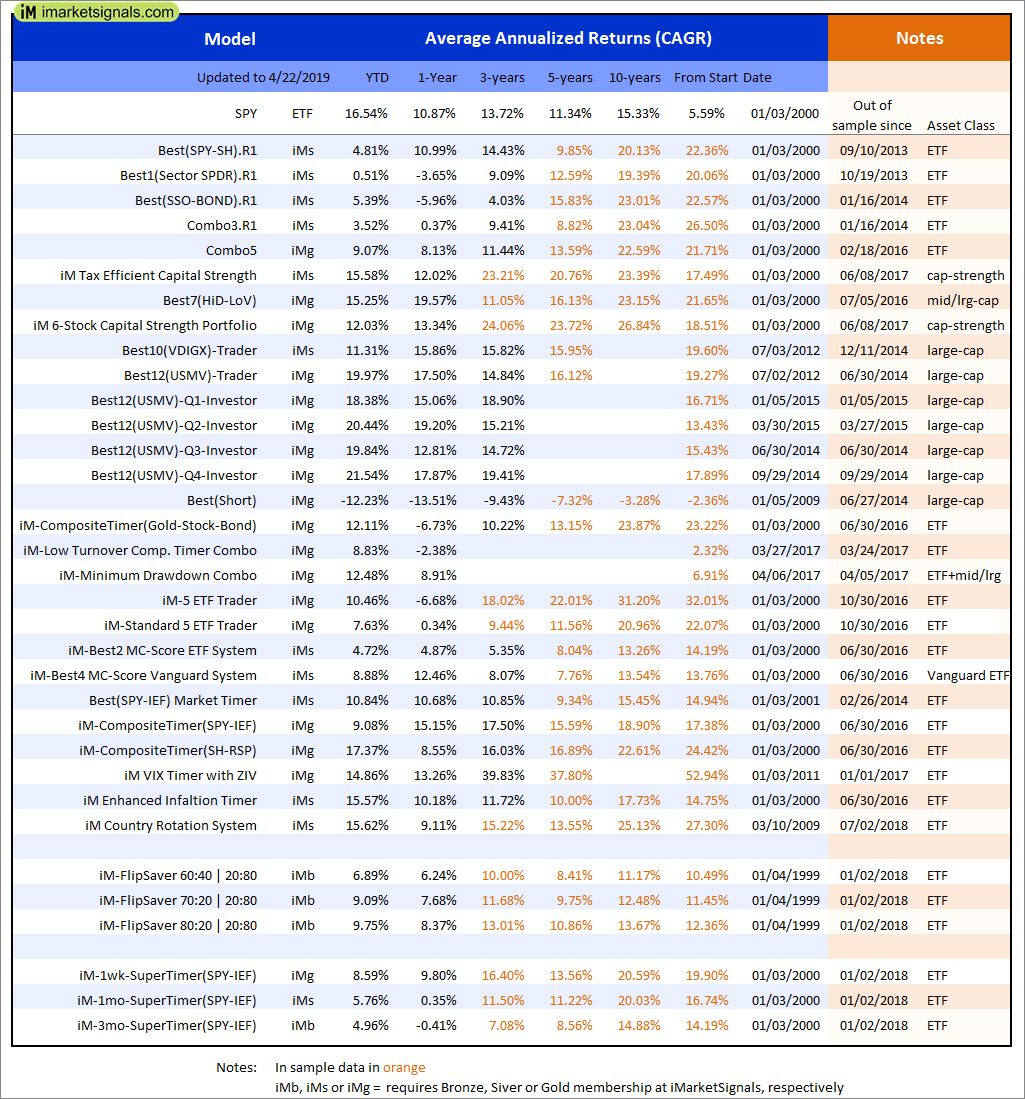
Out of sample performance summary of our models for the past 1, 2, 4 and 13 week periods. The active active return indicates how the models over- or underperformed the benchmark ETF SPY. Also the YTD, and the 1-, 3-, 5- and 10-year annualized returns are shown in the second table |
|
|
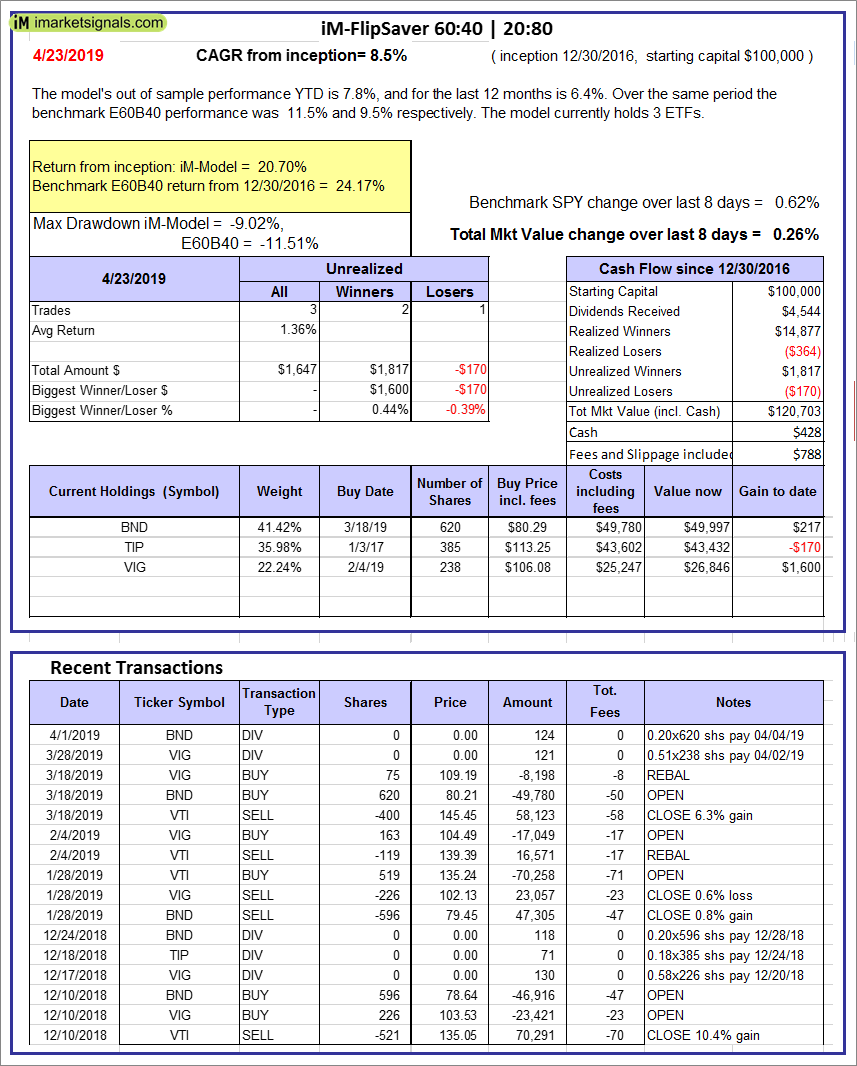
iM-FlipSaver 60:40 | 20:80 – 2017: The model’s out of sample performance YTD is 7.8%, and for the last 12 months is 6.4%. Over the same period the benchmark E60B40 performance was 11.5% and 9.5% respectively. Over the previous week the market value of iM-FlipSaver 80:20 | 20:80 gained 0.26% at a time when SPY gained 0.62%. A starting capital of $100,000 at inception on 7/16/2015 would have grown to $120,703 which includes $428 cash and excludes $788 spent on fees and slippage. |
|
|
iM-FlipSaver 70:30 | 20:80 – 2017: The model’s out of sample performance YTD is 8.3%, and for the last 12 months is 7.0%. Over the same period the benchmark E60B40 performance was 11.5% and 9.5% respectively. Over the previous week the market value of iM-FlipSaver 70:30 | 20:80 gained 0.23% at a time when SPY gained 0.62%. A starting capital of $100,000 at inception on 7/15/2015 would have grown to $123,448 which includes $586 cash and excludes $909 spent on fees and slippage. |
|
|
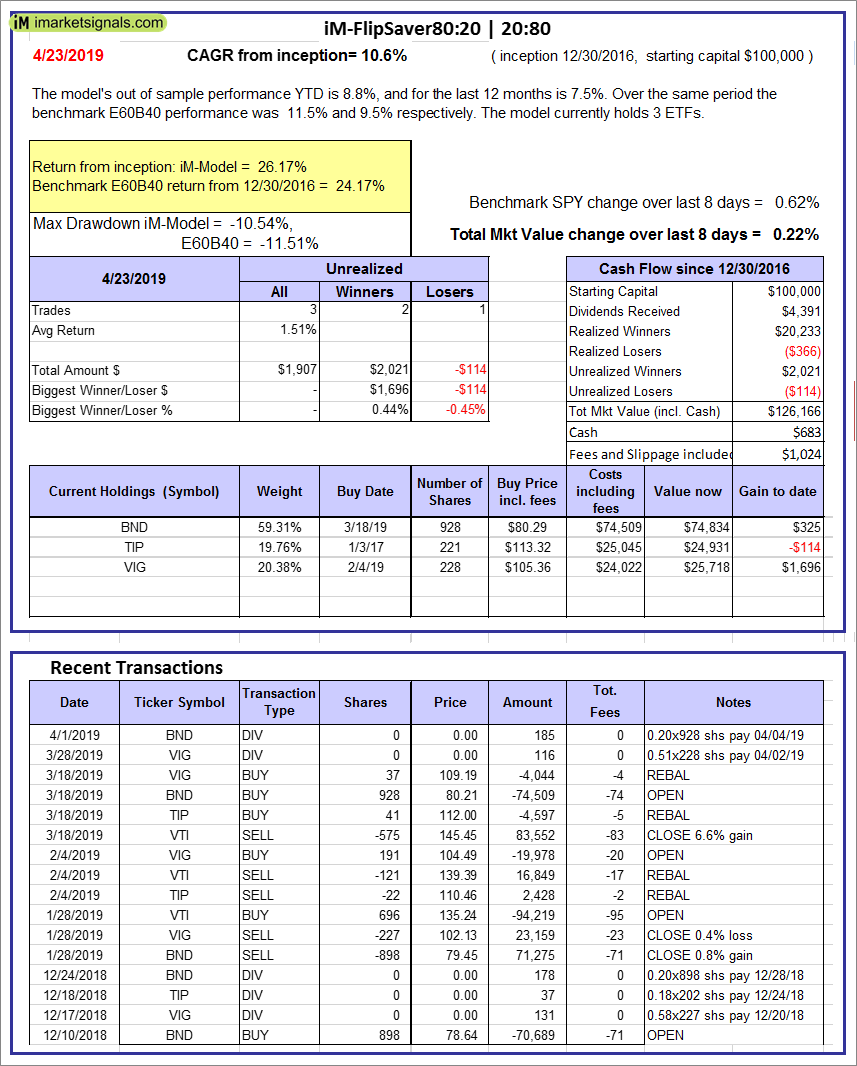
iM-FlipSaver 80:20 | 20:80 – 2017: The model’s out of sample performance YTD is 8.8%, and for the last 12 months is 7.5%. Over the same period the benchmark E60B40 performance was 11.5% and 9.5% respectively. Over the previous week the market value of iM-FlipSaver 80:20 | 20:80 gained 0.22% at a time when SPY gained 0.62%. A starting capital of $100,000 at inception on 1/2/2017 would have grown to $126,166 which includes $683 cash and excludes $1,024 spent on fees and slippage. |
|
|
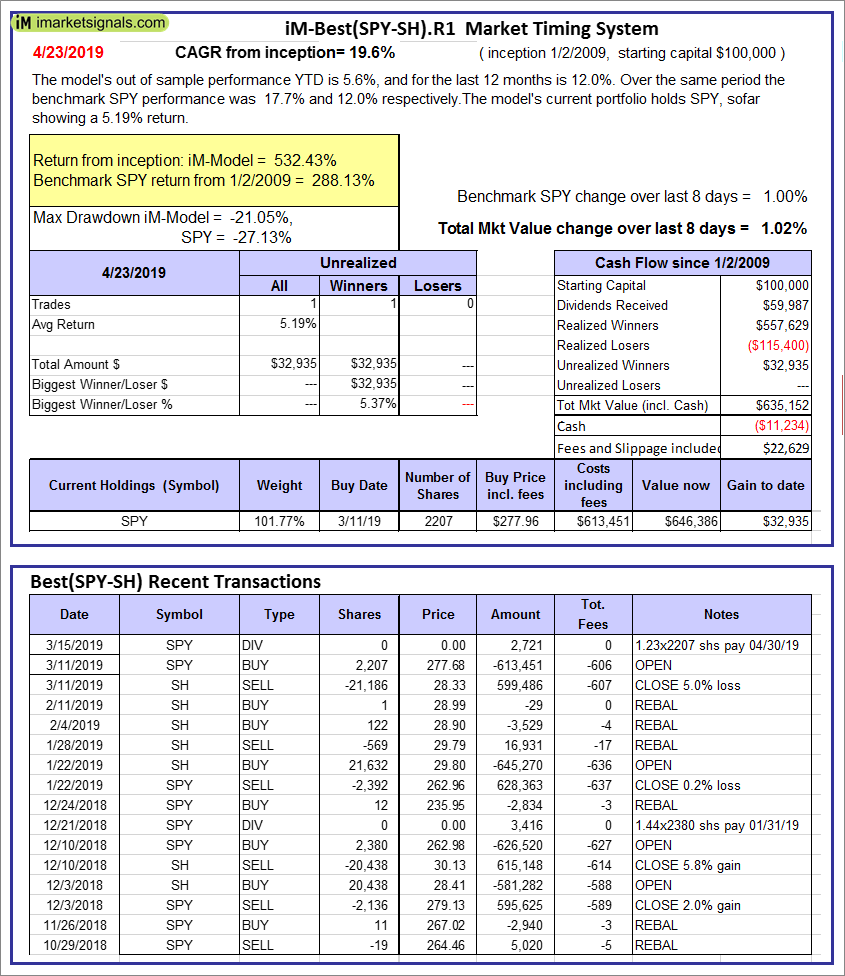
iM-Best(SPY-SH).R1: The model’s out of sample performance YTD is 5.6%, and for the last 12 months is 12.0%. Over the same period the benchmark SPY performance was 17.7% and 12.0% respectively. Over the previous week the market value of Best(SPY-SH) gained 1.02% at a time when SPY gained 1.00%. A starting capital of $100,000 at inception on 1/2/2009 would have grown to $635,152 which includes -$11,234 cash and excludes $22,629 spent on fees and slippage. |
|
|
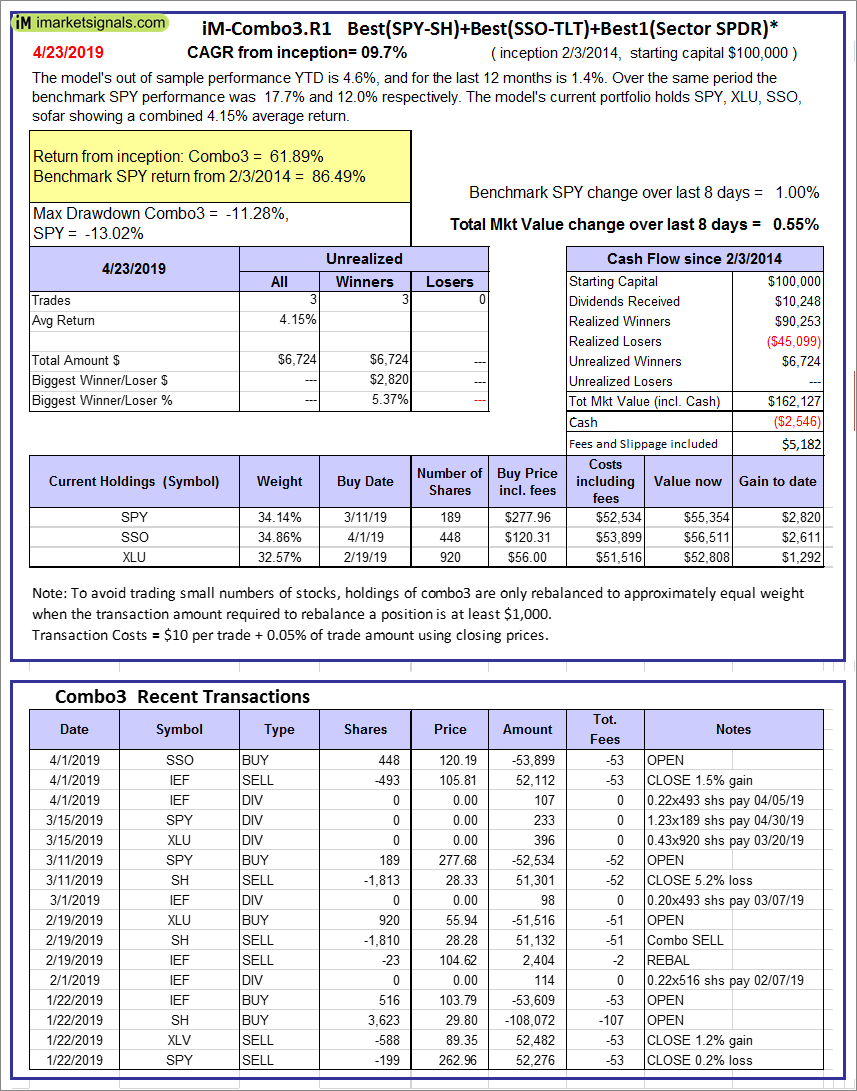
iM-Combo3.R1: The model’s out of sample performance YTD is 4.6%, and for the last 12 months is 1.4%. Over the same period the benchmark SPY performance was 17.7% and 12.0% respectively. Over the previous week the market value of iM-Combo3.R1 gained 0.55% at a time when SPY gained 1.00%. A starting capital of $100,000 at inception on 2/3/2014 would have grown to $162,127 which includes -$2,546 cash and excludes $5,182 spent on fees and slippage. |
|
|
iM-Combo5: The model’s out of sample performance YTD is 10.4%, and for the last 12 months is 9.5%. Over the same period the benchmark SPY performance was 17.7% and 12.0% respectively. Over the previous week the market value of iM-Combo5 gained 1.47% at a time when SPY gained 1.00%. A starting capital of $100,000 at inception on 2/22/2016 would have grown to $140,578 which includes $1,744 cash and excludes $0 spent on fees and slippage. |
|
|
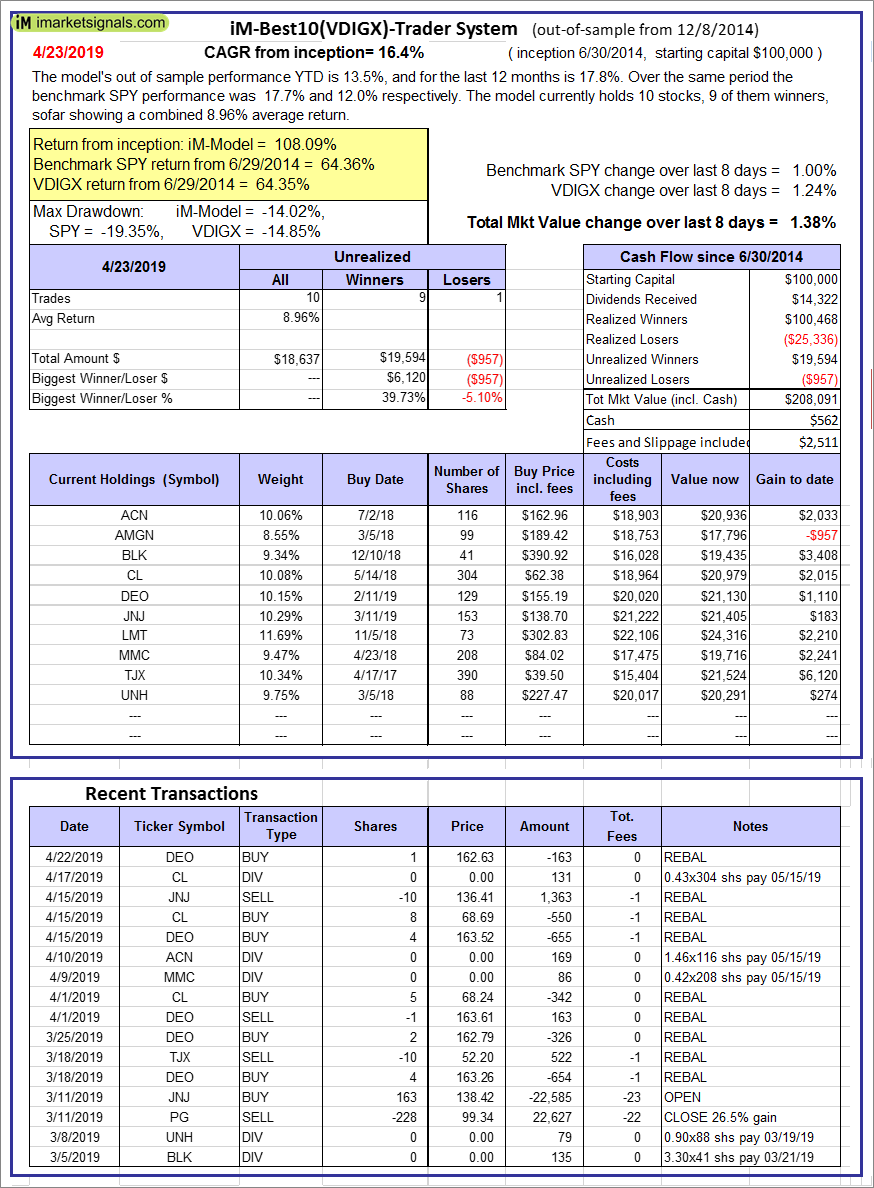
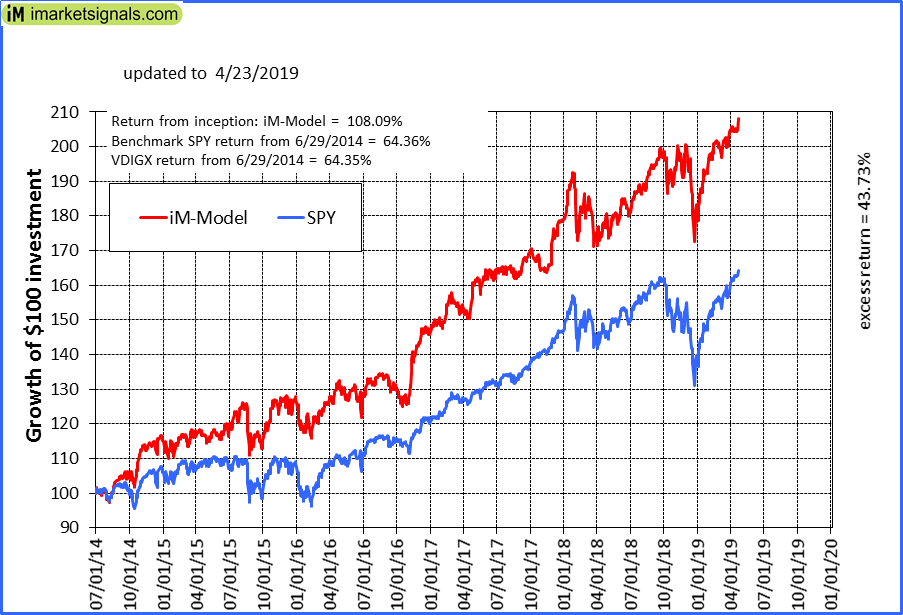
iM-Best10(VDIGX)-Trader: The model’s out of sample performance YTD is 13.5%, and for the last 12 months is 17.8%. Over the same period the benchmark SPY performance was 17.7% and 12.0% respectively. Since inception, on 7/1/2014, the model gained 108.09% while the benchmark SPY gained 64.36% and VDIGX gained 64.35% over the same period. Over the previous week the market value of iM-Best10(VDIGX) gained 1.38% at a time when SPY gained 1.00%. A starting capital of $100,000 at inception on 7/1/2014 would have grown to $208,091 which includes $562 cash and excludes $2,511 spent on fees and slippage. |
|
|
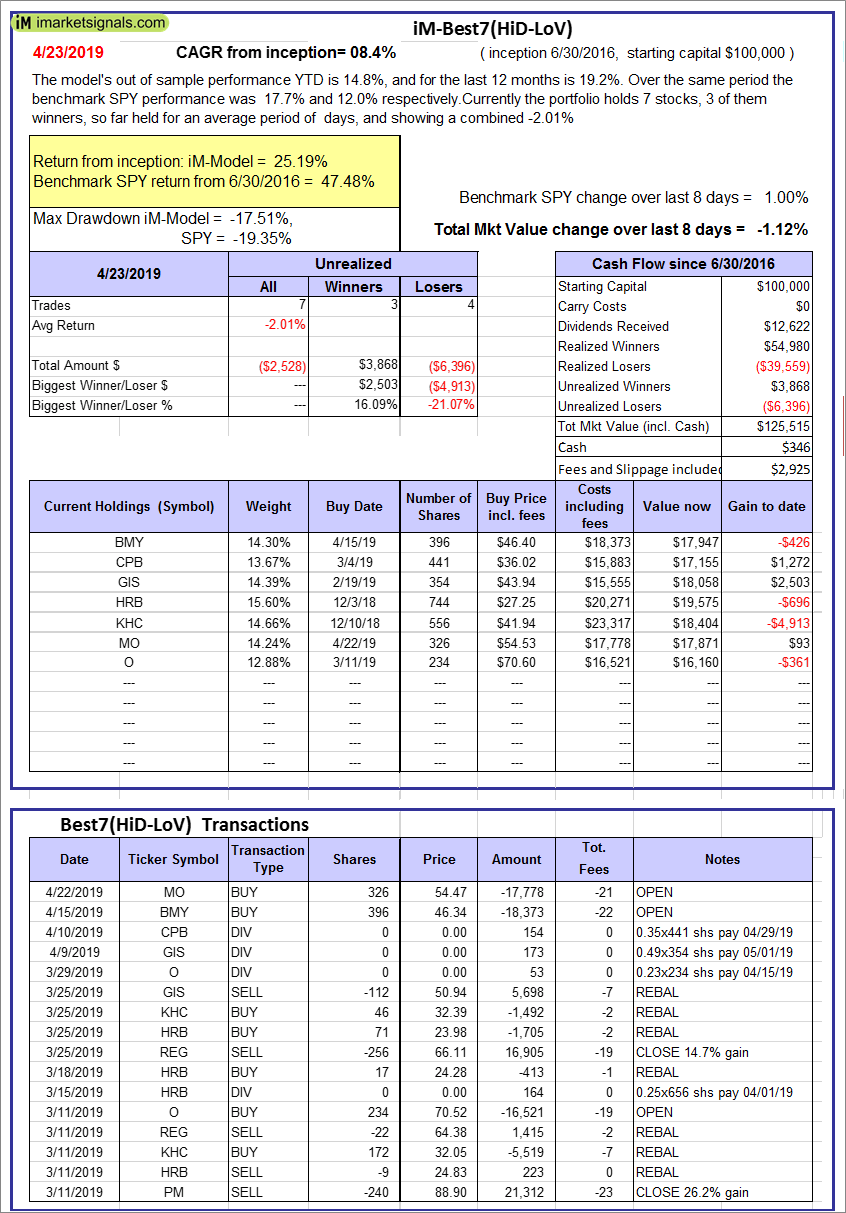
iM-Best7(HiD-LoV): The model’s out of sample performance YTD is 14.8%, and for the last 12 months is 19.2%. Over the same period the benchmark SPY performance was 17.7% and 12.0% respectively. Over the previous week the market value of iM-Best7(HiD-LoV) gained -1.12% at a time when SPY gained 1.00%. A starting capital of $100,000 at inception on 6/30/2016 would have grown to $125,515 which includes $346 cash and excludes $2,925 spent on fees and slippage. |
|
|
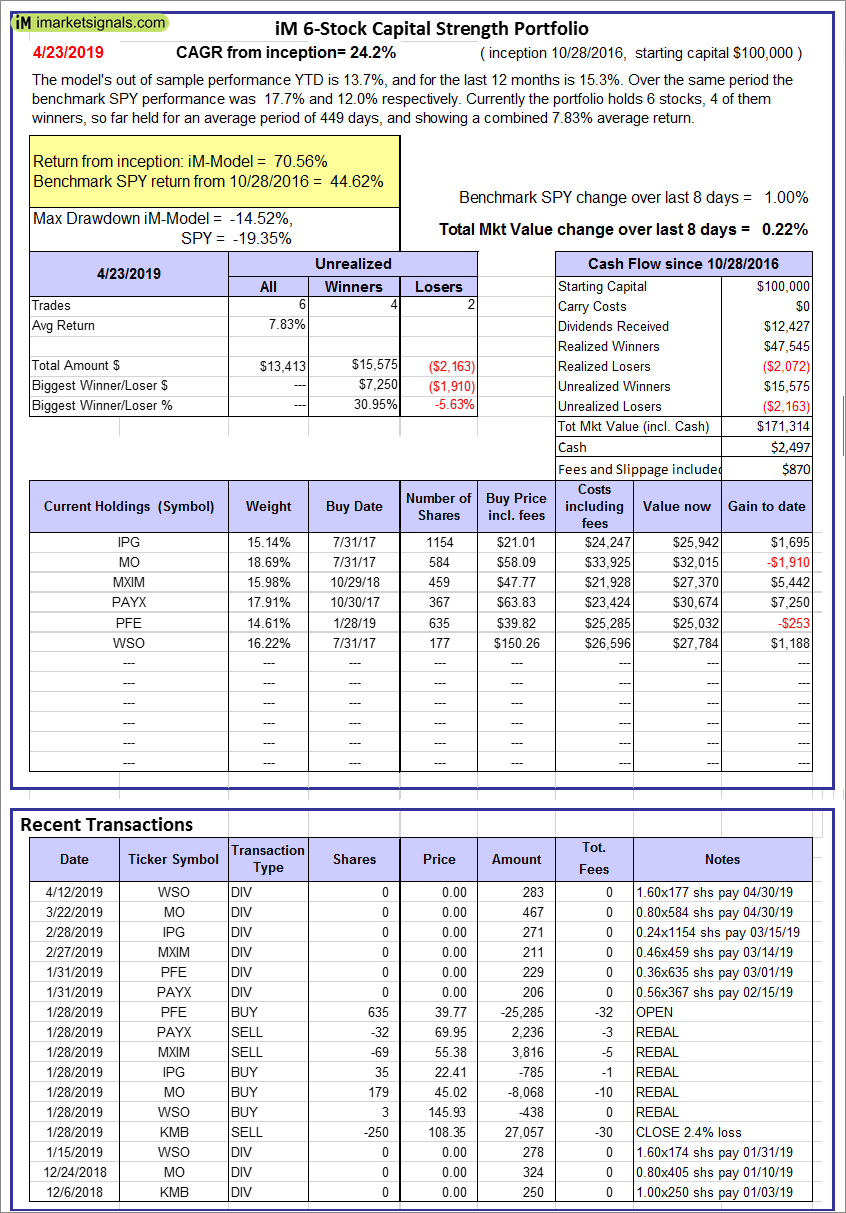
iM 6-Stock Capital Strength Portfolio: The model’s out of sample performance YTD is 13.7%, and for the last 12 months is 15.3%. Over the same period the benchmark SPY performance was 17.7% and 12.0% respectively. Over the previous week the market value of the iM 6-Stock Capital Strength Portfolio gained 0.22% at a time when SPY gained 1.00%. A starting capital of $100,000 at inception on 10/28/2016 would have grown to $171,314 which includes $2,497 cash and excludes $870 spent on fees and slippage. |
|
|
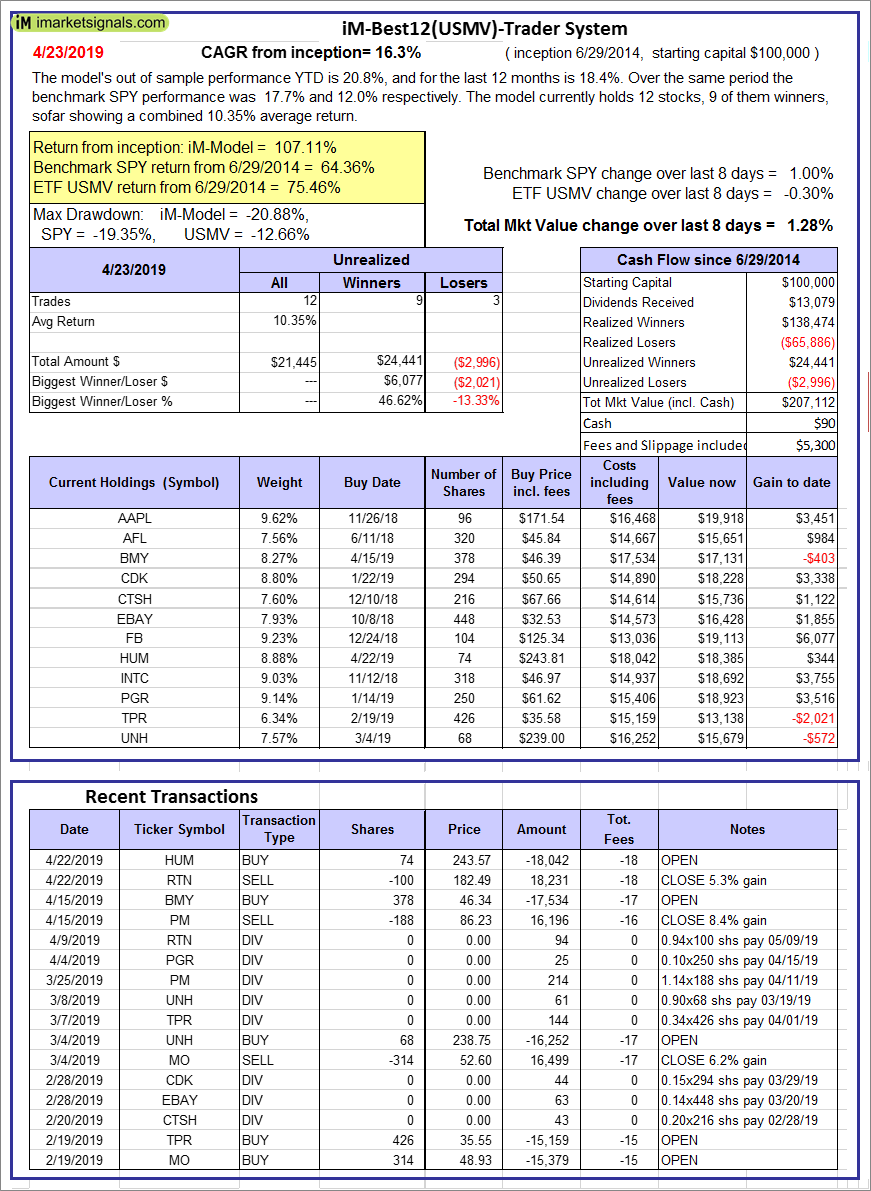
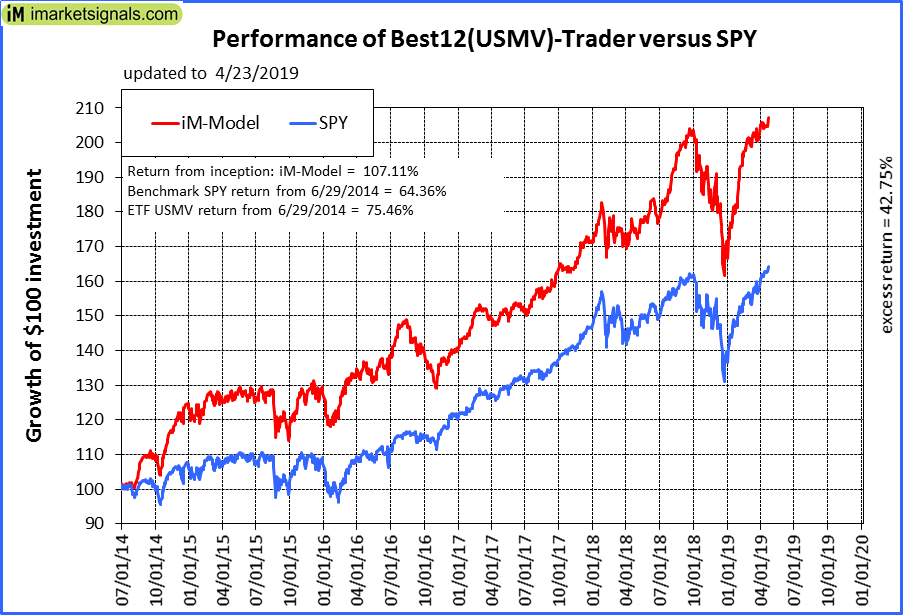
iM-Best12(USMV)-Trader: The model’s out of sample performance YTD is 20.8%, and for the last 12 months is 18.4%. Over the same period the benchmark SPY performance was 17.7% and 12.0% respectively. Since inception, on 6/30/2014, the model gained 107.11% while the benchmark SPY gained 64.36% and the ETF USMV gained 75.46% over the same period. Over the previous week the market value of iM-Best12(USMV)-Trader gained 1.28% at a time when SPY gained 1.00%. A starting capital of $100,000 at inception on 6/30/2014 would have grown to $207,112 which includes $90 cash and excludes $5,300 spent on fees and slippage. |
|
|
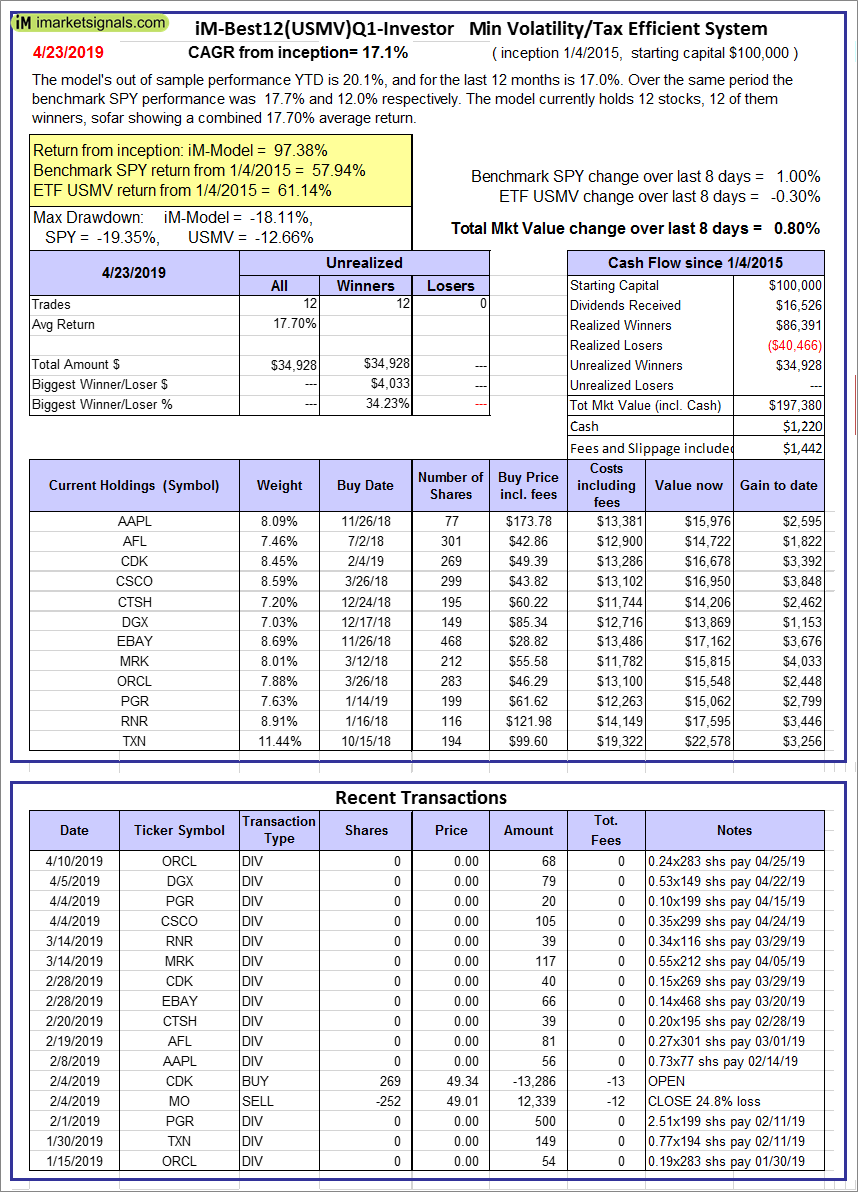
iM-Best12(USMV)Q1-Investor: The model’s out of sample performance YTD is 20.1%, and for the last 12 months is 17.0%. Over the same period the benchmark SPY performance was 17.7% and 12.0% respectively. Since inception, on 1/5/2015, the model gained 97.38% while the benchmark SPY gained 57.94% and the ETF USMV gained 61.14% over the same period. Over the previous week the market value of iM-Best12(USMV)Q1 gained 0.80% at a time when SPY gained 1.00%. A starting capital of $100,000 at inception on 1/5/2015 would have grown to $197,380 which includes $1,220 cash and excludes $1,442 spent on fees and slippage. |
|
|
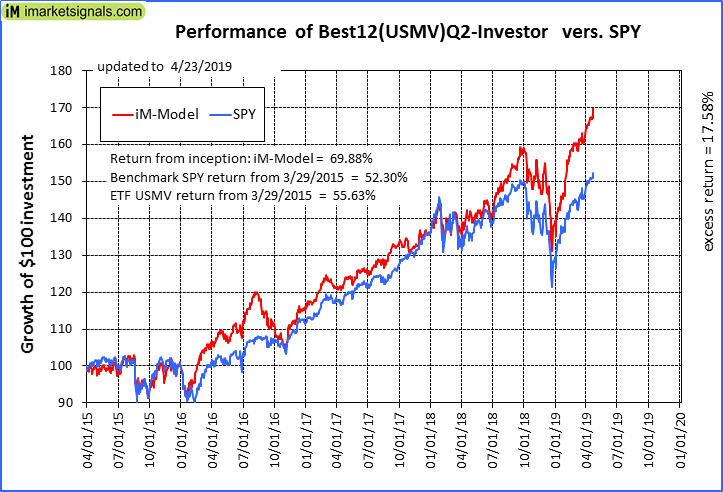
iM-Best12(USMV)Q2-Investor: The model’s out of sample performance YTD is 22.3%, and for the last 12 months is 21.3%. Over the same period the benchmark SPY performance was 17.7% and 12.0% respectively. Since inception, on 3/30/2015, the model gained 69.88% while the benchmark SPY gained 52.30% and the ETF USMV gained 55.63% over the same period. Over the previous week the market value of iM-Best12(USMV)Q2 gained 1.56% at a time when SPY gained 1.00%. A starting capital of $100,000 at inception on 3/30/2015 would have grown to $169,881 which includes $59 cash and excludes $1,310 spent on fees and slippage. |
|
|
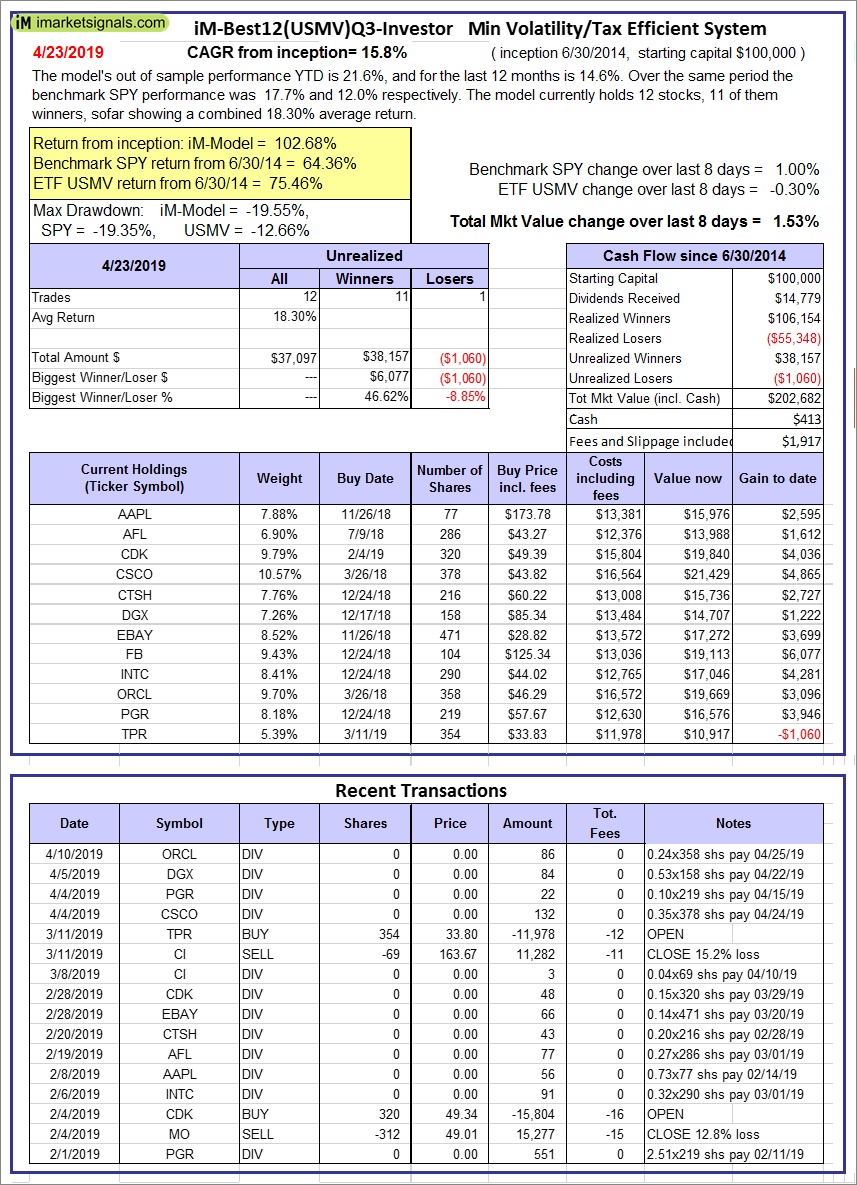
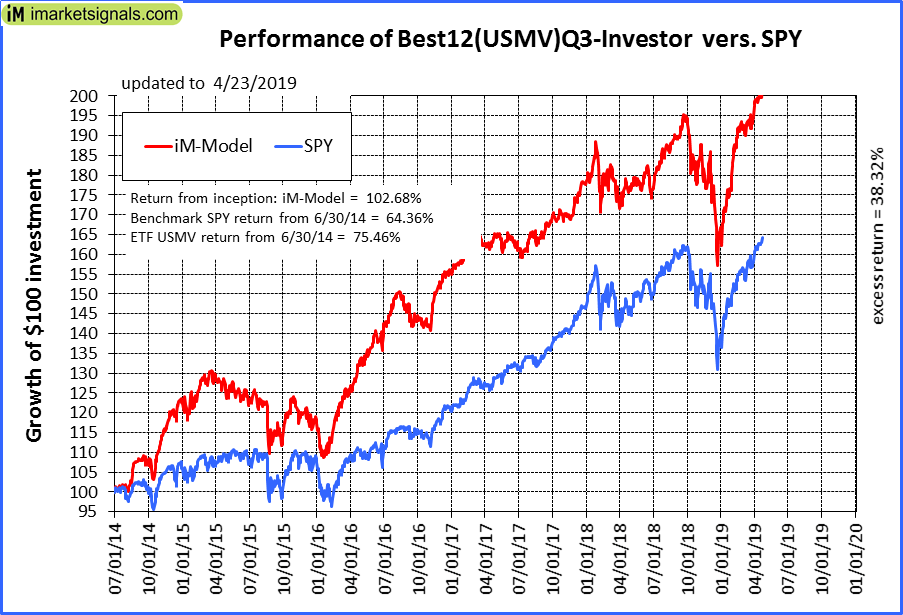
iM-Best12(USMV)Q3-Investor: The model’s out of sample performance YTD is 21.6%, and for the last 12 months is 14.6%. Over the same period the benchmark SPY performance was 17.7% and 12.0% respectively. Since inception, on 7/1/2014, the model gained 102.68% while the benchmark SPY gained 64.36% and the ETF USMV gained 75.46% over the same period. Over the previous week the market value of iM-Best12(USMV)Q3 gained 1.53% at a time when SPY gained 1.00%. A starting capital of $100,000 at inception on 7/1/2014 would have grown to $202,682 which includes $413 cash and excludes $1,917 spent on fees and slippage. |
|
|
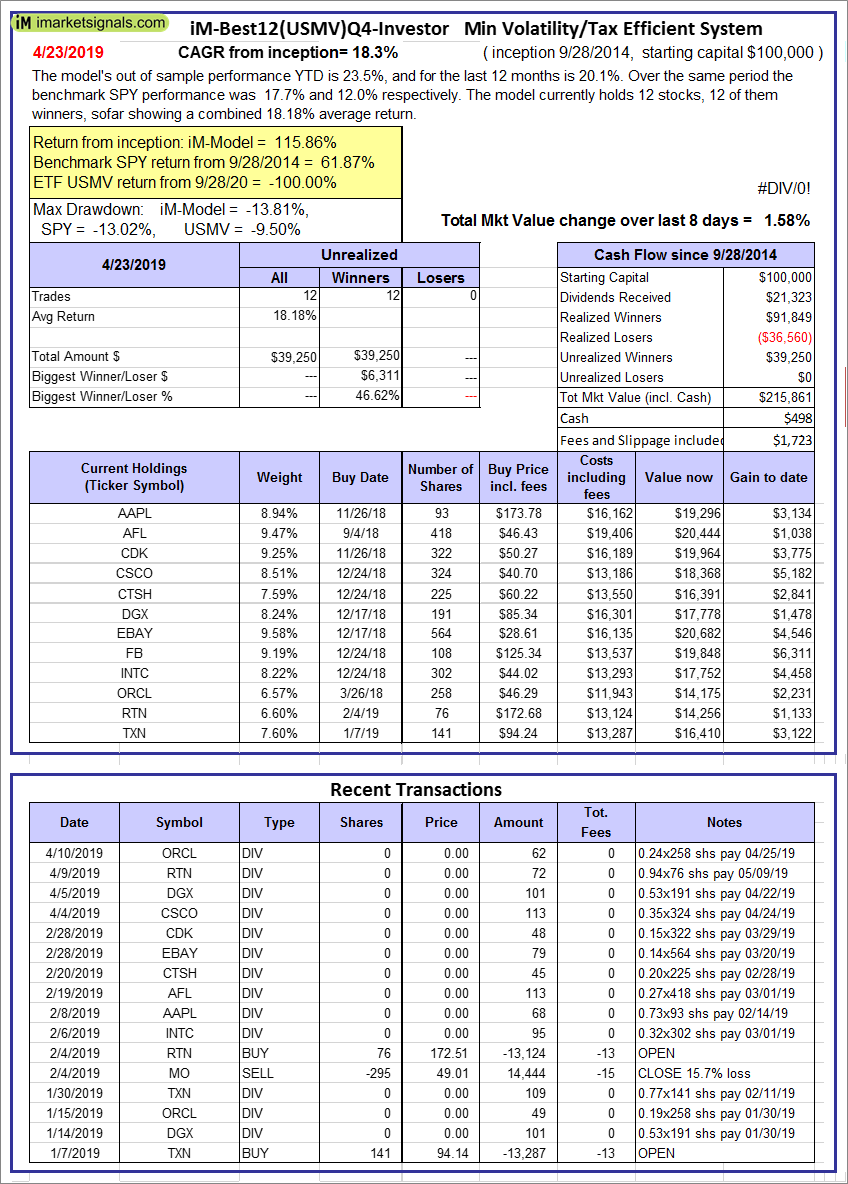
iM-Best12(USMV)Q4-Investor: Since inception, on 9/29/2014, the model gained 115.86% while the benchmark SPY gained 61.87% and the ETF USMV gained -100.00% over the same period. Over the previous week the market value of iM-Best12(USMV)Q4 gained 1.58% at a time when SPY gained 1.00%. A starting capital of $100,000 at inception on 9/29/2014 would have grown to $215,861 which includes $498 cash and excludes $1,723 spent on fees and slippage. |
|
|
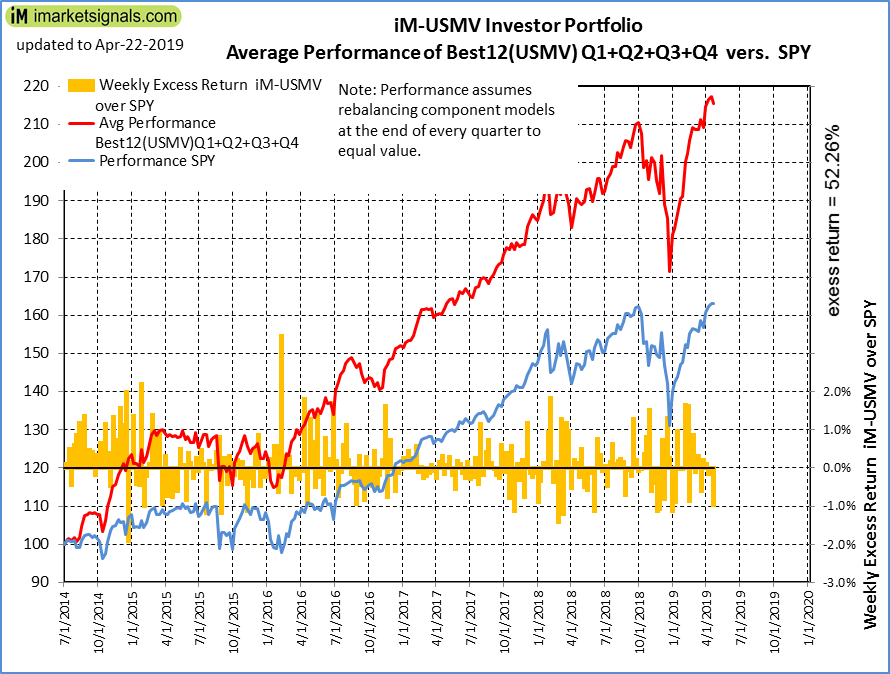
Average Performance of iM-Best12(USMV)Q1+Q2+Q3+Q4-Investor resulted in an excess return of 54.31% over SPY. (see iM-USMV Investor Portfolio) |
|
|
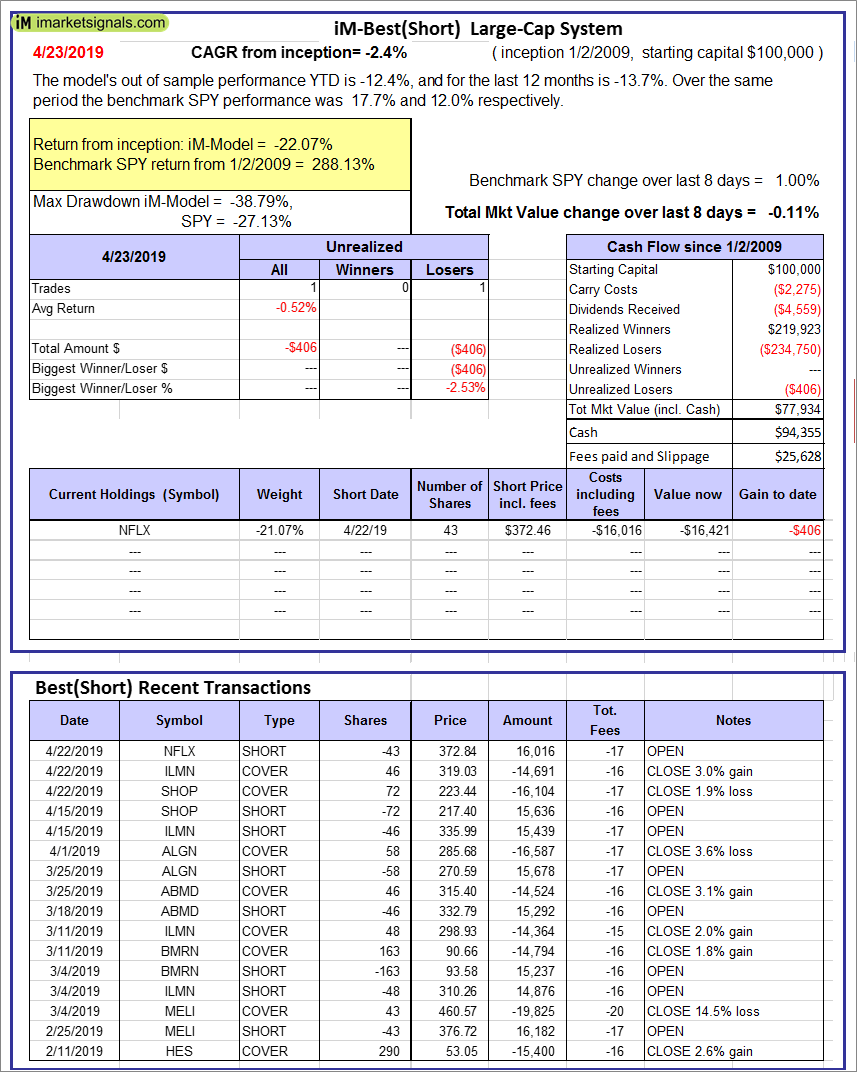
iM-Best(Short): The model’s out of sample performance YTD is -12.4%, and for the last 12 months is -13.7%. Over the same period the benchmark SPY performance was 17.7% and 12.0% respectively. Over the previous week the market value of iM-Best(Short) gained -0.11% at a time when SPY gained 1.00%. Over the period 1/2/2009 to 4/23/2019 the starting capital of $100,000 would have grown to $77,934 which includes $94,355 cash and excludes $25,628 spent on fees and slippage. |
|
|
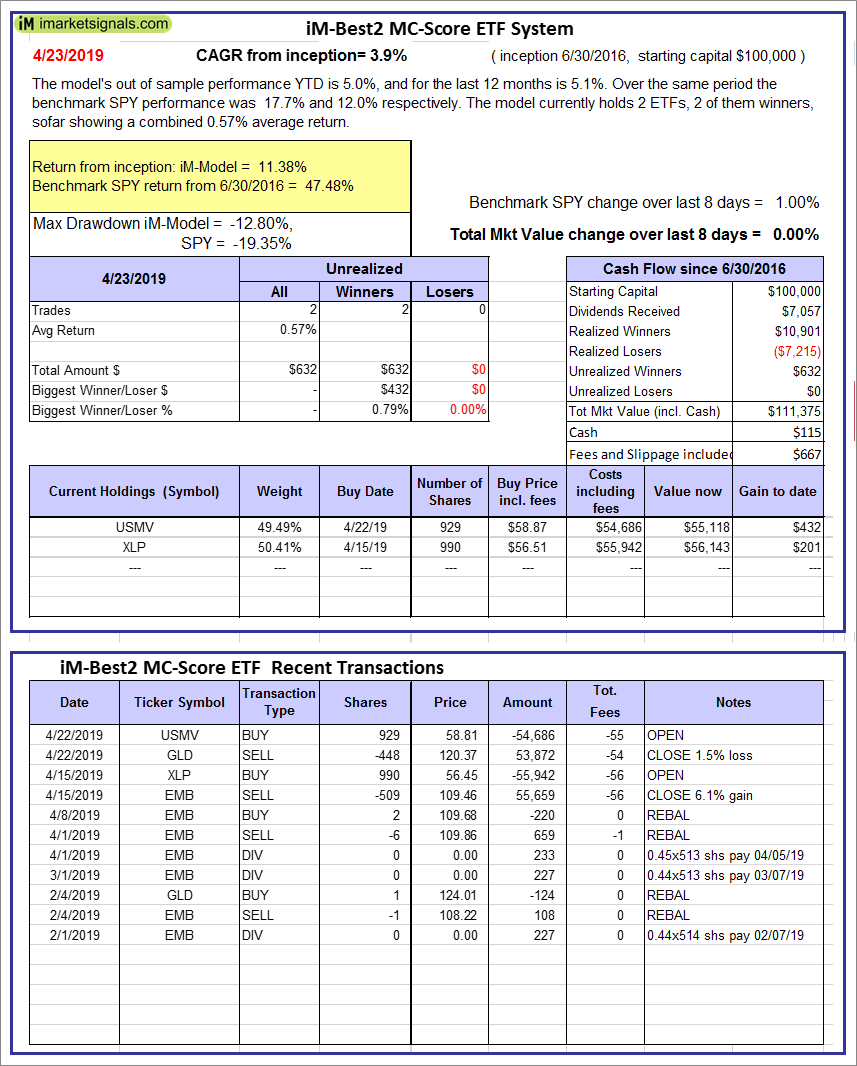
iM-Best2 MC-Score ETF System: The model’s out of sample performance YTD is 5.0%, and for the last 12 months is 5.1%. Over the same period the benchmark SPY performance was 17.7% and 12.0% respectively. Over the previous week the market value of the iM-Best2 MC-Score ETF System gained 0.00% at a time when SPY gained 1.00%. A starting capital of $100,000 at inception on 6/30/2016 would have grown to $111,375 which includes $115 cash and excludes $667 spent on fees and slippage. |
|
|
iM-Best4 MC-Score Vanguard System: The model’s out of sample performance YTD is 9.5%, and for the last 12 months is 13.1%. Over the same period the benchmark SPY performance was 17.7% and 12.0% respectively. Over the previous week the market value of the iM-Best4 MC-Score Vanguard System gained -0.50% at a time when SPY gained 1.00%. A starting capital of $100,000 at inception on 6/30/2016 would have grown to $118,311 which includes $688 cash and excludes $00 spent on fees and slippage. |
|
|
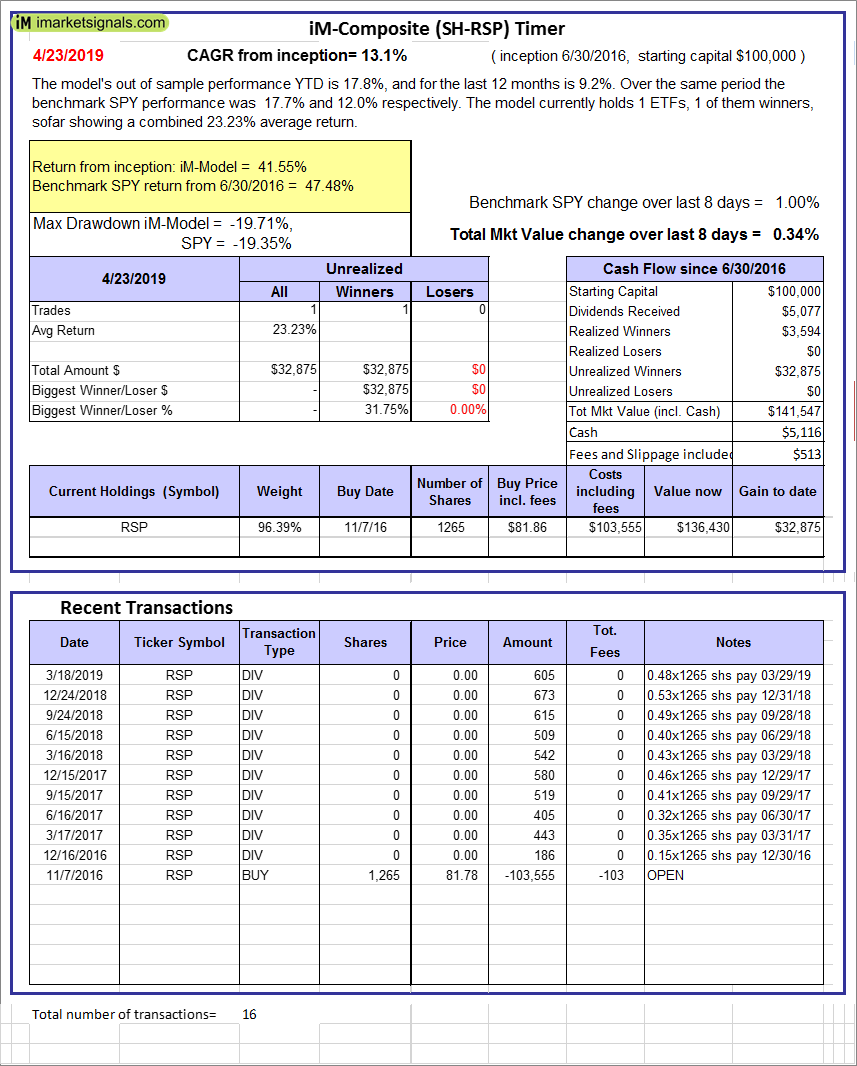
iM-Composite (SH-RSP) Timer: The model’s out of sample performance YTD is 17.8%, and for the last 12 months is 9.2%. Over the same period the benchmark SPY performance was 17.7% and 12.0% respectively. Over the previous week the market value of the iM-Composite (SH-RSP) Timer gained 0.34% at a time when SPY gained 1.00%. A starting capital of $100,000 at inception on 6/30/2016 would have grown to $141,547 which includes $5,116 cash and excludes $513 spent on fees and slippage. |
|
|
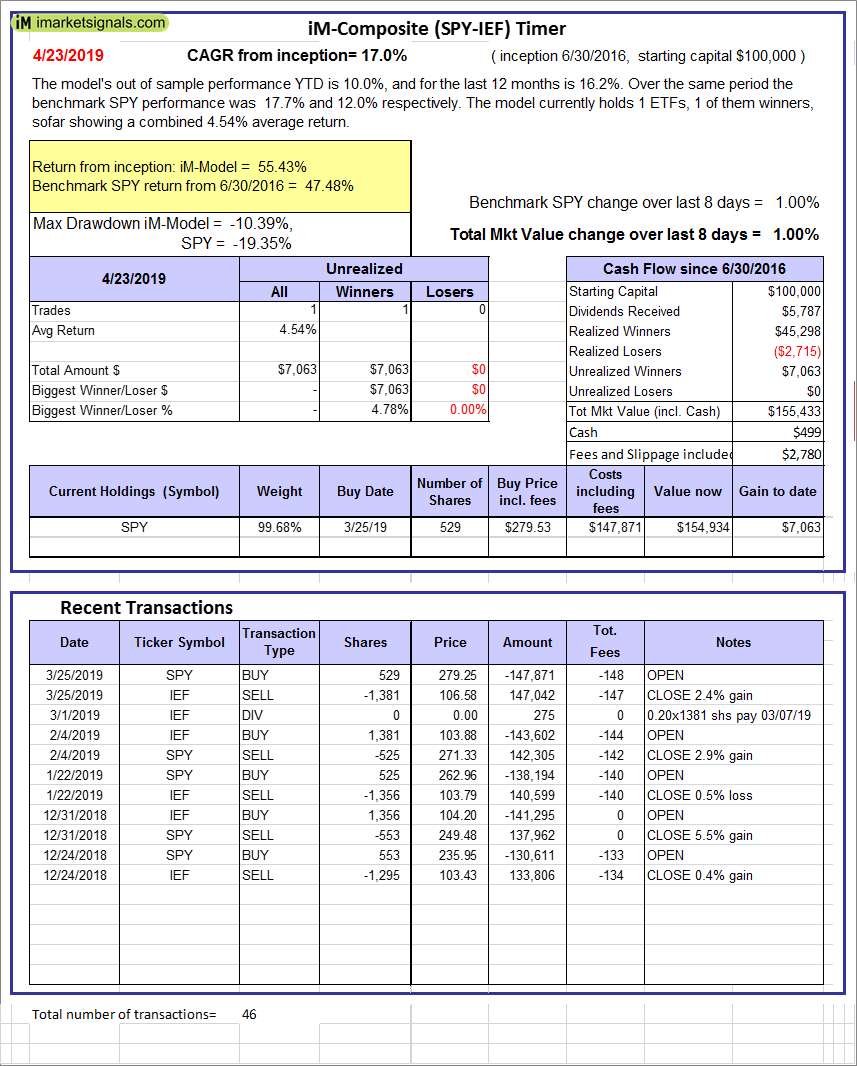
iM-Composite (SPY-IEF) Timer: The model’s out of sample performance YTD is 10.0%, and for the last 12 months is 16.2%. Over the same period the benchmark SPY performance was 17.7% and 12.0% respectively. Over the previous week the market value of the iM-Composite (SPY-IEF) Timer gained 1.00% at a time when SPY gained 1.00%. A starting capital of $100,000 at inception on 6/30/2016 would have grown to $155,433 which includes $499 cash and excludes $2,780 spent on fees and slippage. |
|
|
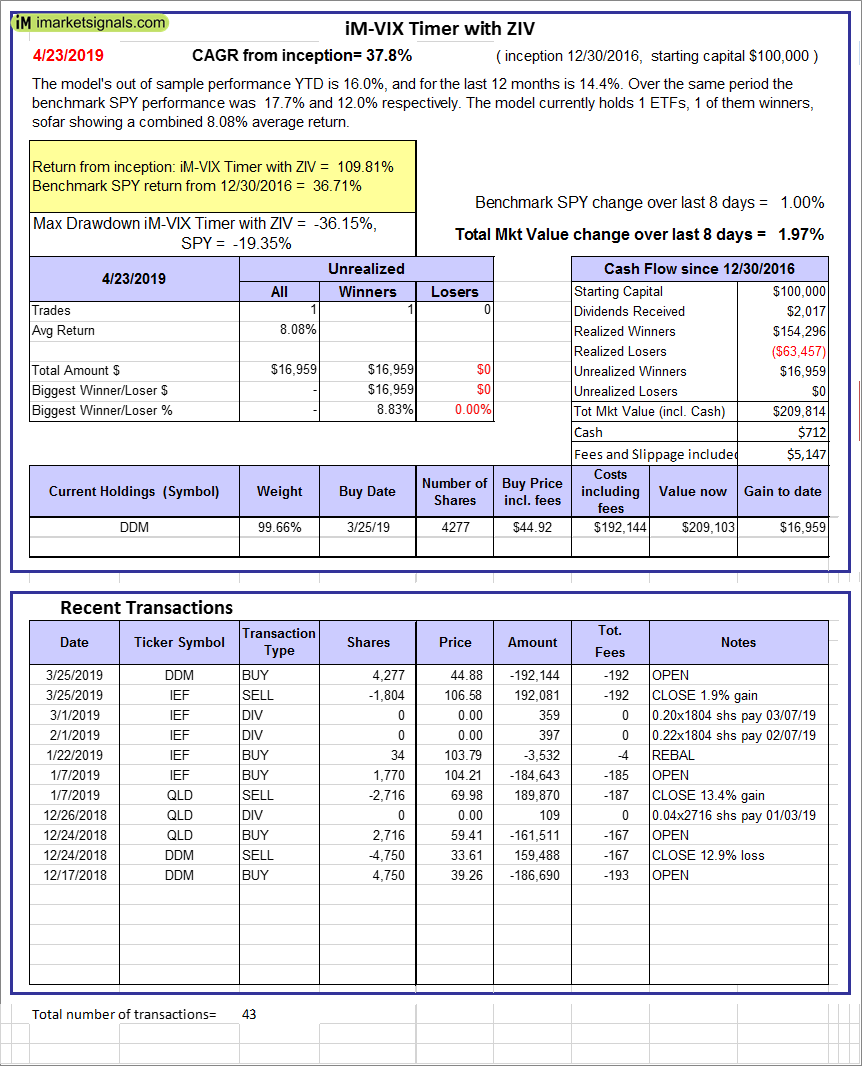
iM-VIX Timer with ZIV: The model’s out of sample performance YTD is 16.0%, and for the last 12 months is 14.4%. Over the same period the benchmark SPY performance was 17.7% and 12.0% respectively. Over the previous week the market value of the iM-VIX Timer with ZIV gained 1.97% at a time when SPY gained 1.00%. A starting capital of $100,000 at inception on 6/30/2016 would have grown to $209,814 which includes $712 cash and excludes $5,147 spent on fees and slippage. |
|
|
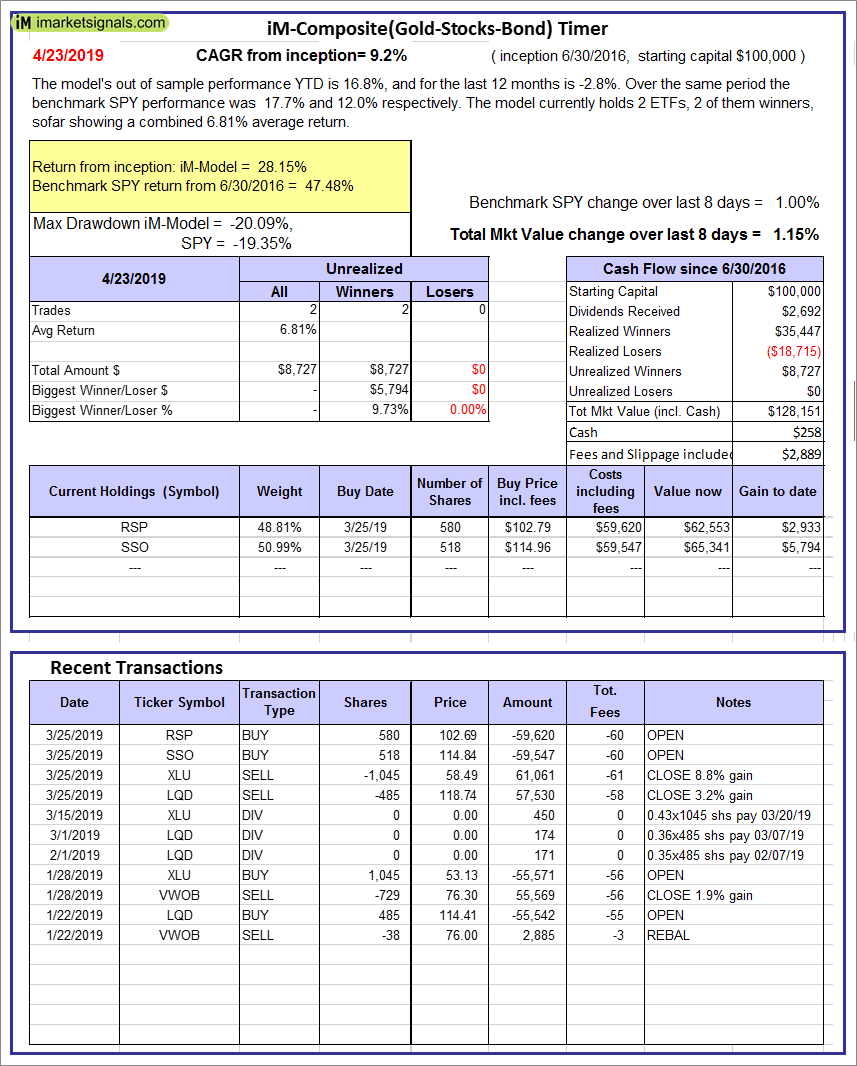
iM-Composite(Gold-Stocks-Bond) Timer: The model’s out of sample performance YTD is 16.8%, and for the last 12 months is -2.8%. Over the same period the benchmark SPY performance was 17.7% and 12.0% respectively. Over the previous week the market value of the iM-Composite(Gold-Stocks-Bond) Timer gained 1.15% at a time when SPY gained 1.00%. A starting capital of $100,000 at inception on 6/30/2016 would have grown to $128,151 which includes $258 cash and excludes $2,889 spent on fees and slippage. |
|
|
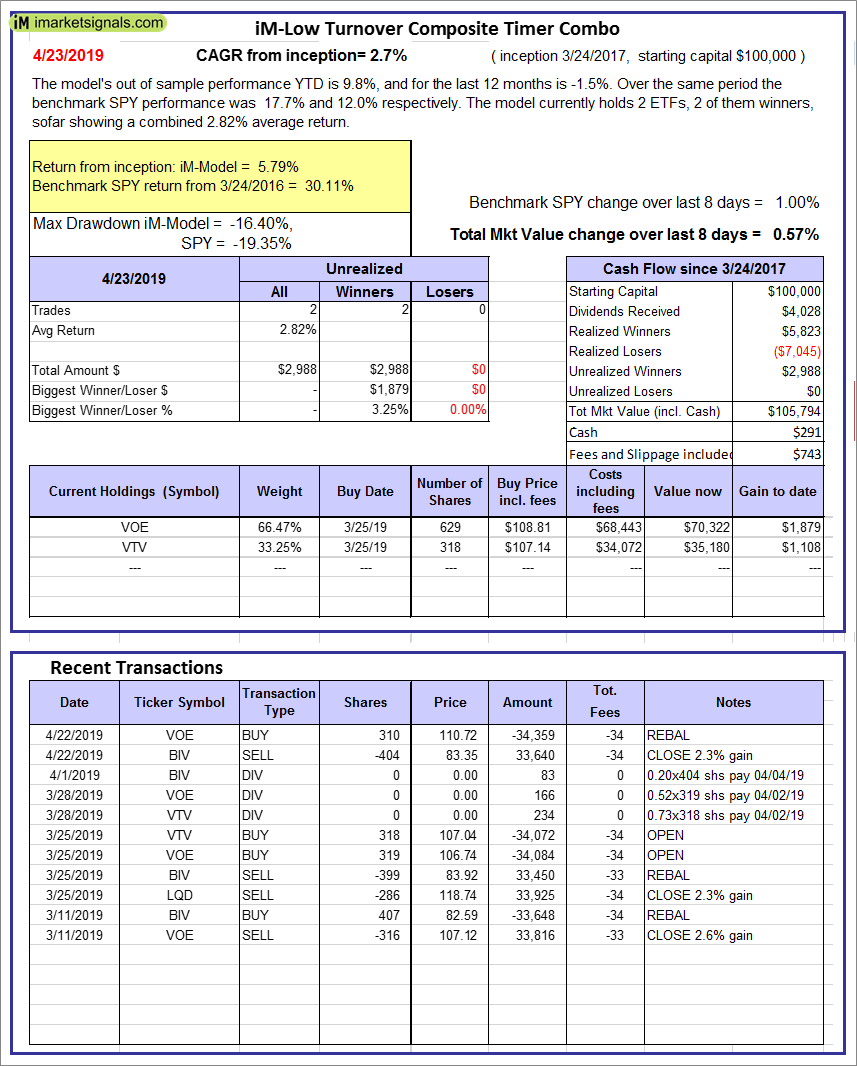
iM-Low Turnover Composite Timer Combo: The model’s out of sample performance YTD is 9.8%, and for the last 12 months is -1.5%. Over the same period the benchmark SPY performance was 17.7% and 12.0% respectively. Over the previous week the market value of the iM-Low Turnover Composite Timer Combo gained 0.57% at a time when SPY gained 1.00%. A starting capital of $100,000 at inception on 3/24/27 would have grown to $105,794 which includes $291 cash and excludes $743 spent on fees and slippage. |
|
|
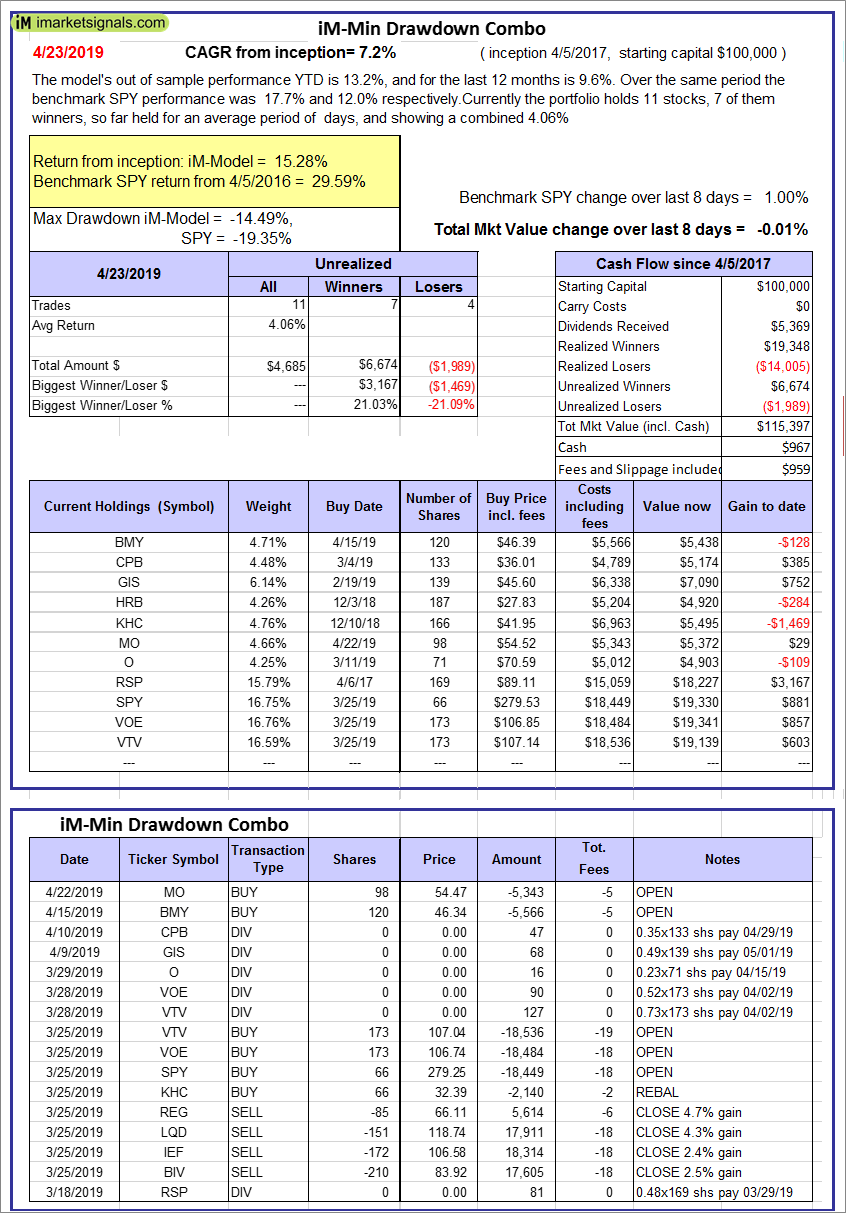
iM-Min Drawdown Combo: The model’s out of sample performance YTD is 13.2%, and for the last 12 months is 9.6%. Over the same period the benchmark SPY performance was 17.7% and 12.0% respectively. Over the previous week the market value of the iM-Min Drawdown Combo gained -0.01% at a time when SPY gained 1.00%. A starting capital of $100,000 at inception on 4/5/2017 would have grown to $115,397 which includes $967 cash and excludes $959 spent on fees and slippage. |
|
|
iM-5ETF Trader (includes leveraged ETFs): The model’s out of sample performance YTD is 13.3%, and for the last 12 months is -4.2%. Over the same period the benchmark SPY performance was 17.7% and 12.0% respectively. Over the previous week the market value of the iM-5ETF Trader (includes leveraged ETFs) gained 1.98% at a time when SPY gained 1.00%. A starting capital of $100,000 at inception on 10/30/2016 would have grown to $156,925 which includes $285 cash and excludes $2,795 spent on fees and slippage. |
|
|
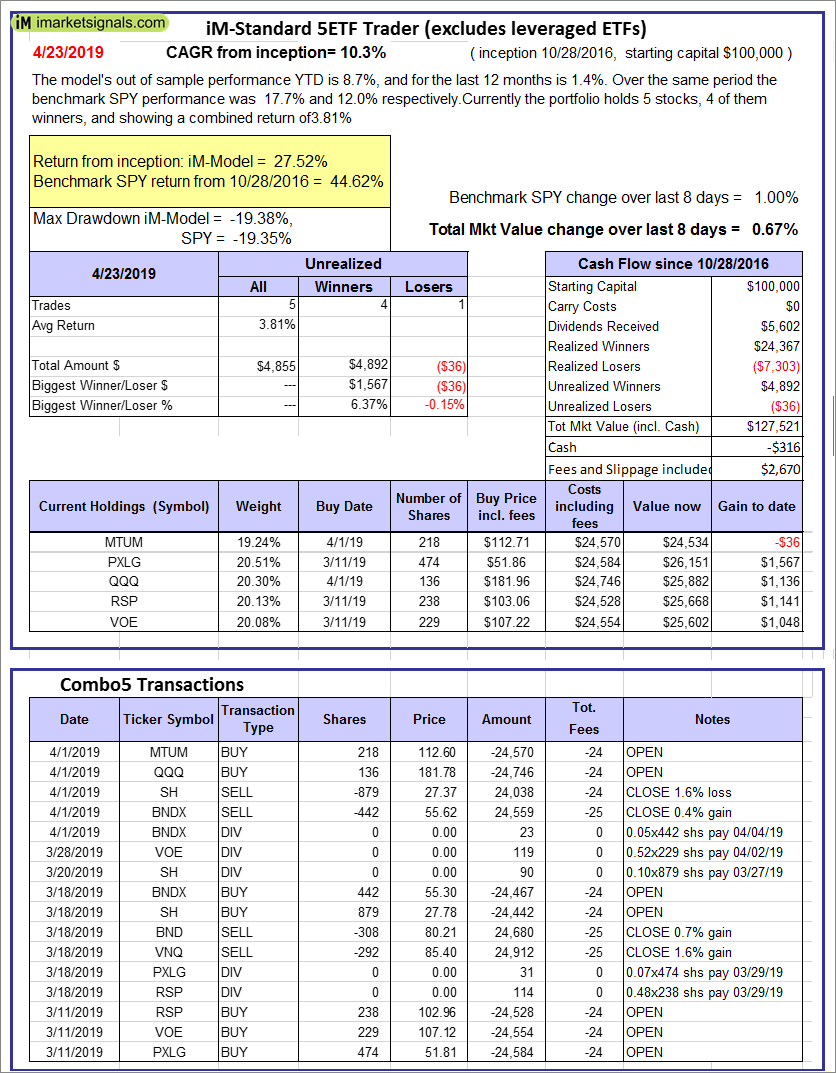
iM-Standard 5ETF Trader (excludes leveraged ETFs): The model’s out of sample performance YTD is 8.7%, and for the last 12 months is 1.4%. Over the same period the benchmark SPY performance was 17.7% and 12.0% respectively. Over the previous week the market value of the iM-Standard 5ETF Trader (excludes leveraged ETFs) gained 0.67% at a time when SPY gained 1.00%. A starting capital of $100,000 at inception on 10/30/2016 would have grown to $127,521 which includes -$316 cash and excludes $2,670 spent on fees and slippage. |


Leave a Reply
You must be logged in to post a comment.