
  |
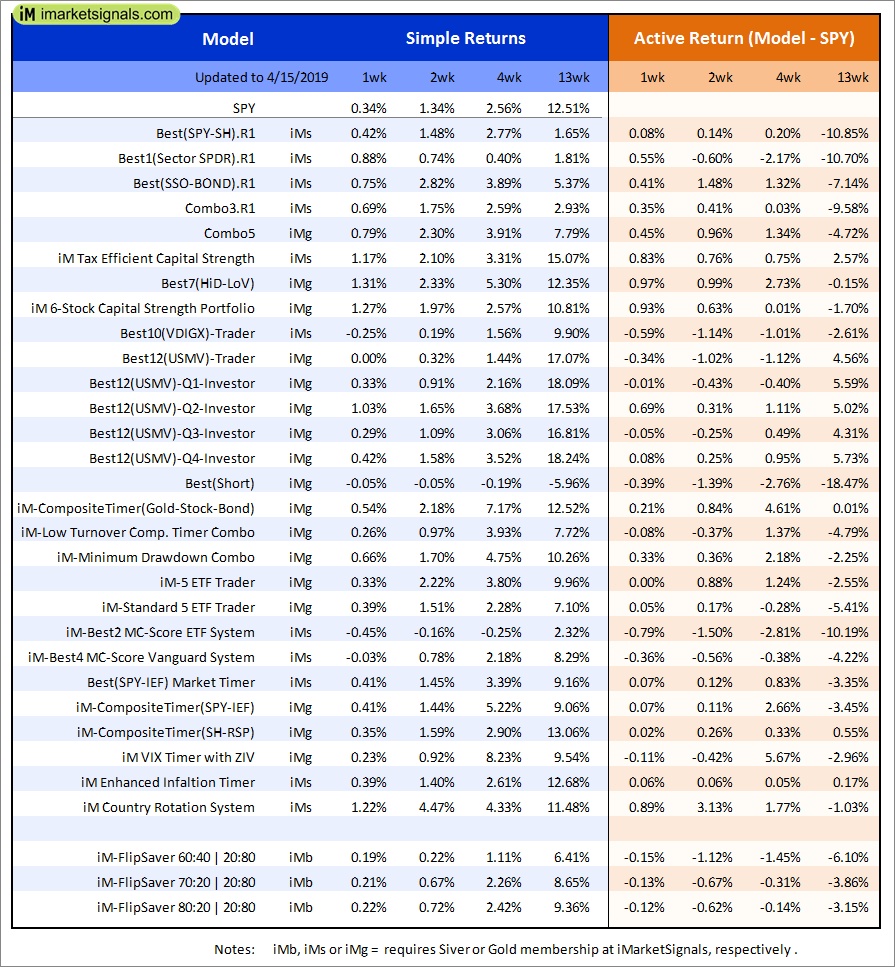
Out of sample performance summary of our models for the past 1, 2, 4 and 13 week periods. The active active return indicates how the models over- or underperformed the benchmark ETF SPY. Also the YTD, and the 1-, 3-, 5- and 10-year annualized returns are shown in the second table |
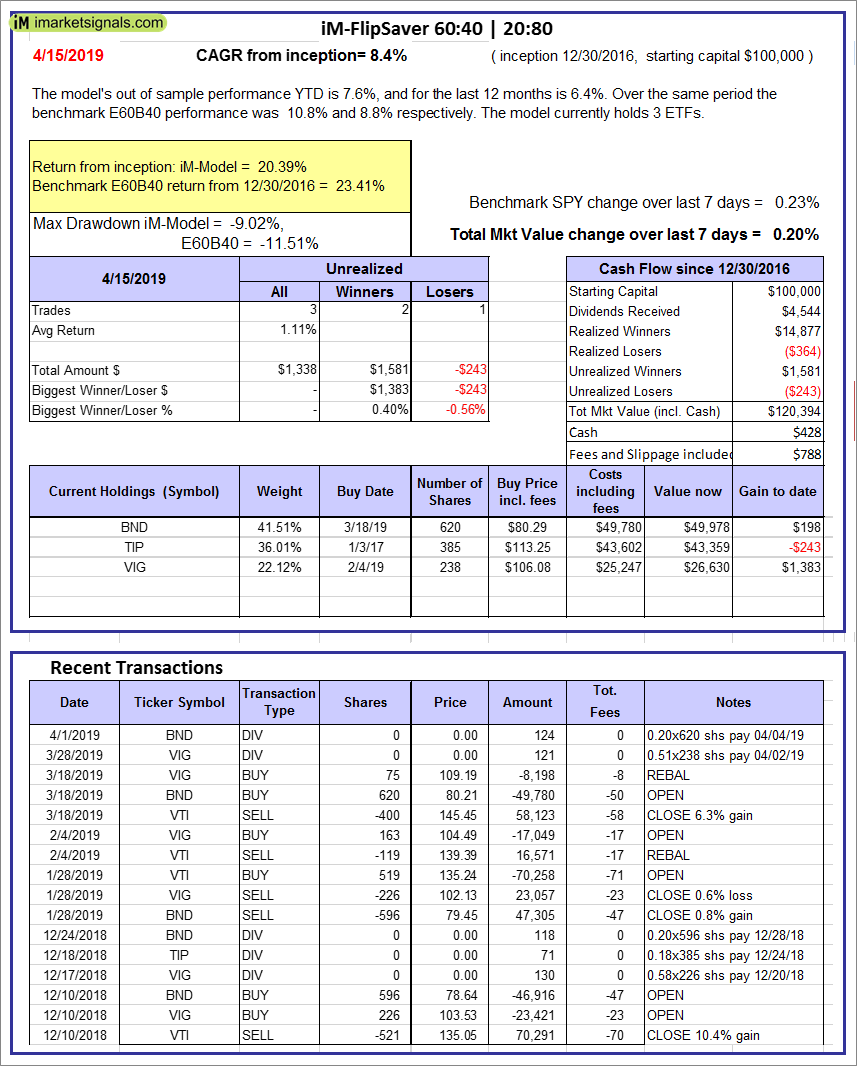 |
iM-FlipSaver 60:40 | 20:80 – 2017: The model’s out of sample performance YTD is 7.6%, and for the last 12 months is 6.4%. Over the same period the benchmark E60B40 performance was 10.8% and 8.8% respectively. Over the previous week the market value of iM-FlipSaver 80:20 | 20:80 gained 0.20% at a time when SPY gained 0.23%. A starting capital of $100,000 at inception on 7/16/2015 would have grown to $120,394 which includes $428 cash and excludes $788 spent on fees and slippage. |
 |
iM-FlipSaver 70:30 | 20:80 – 2017: The model’s out of sample performance YTD is 8.1%, and for the last 12 months is 7.0%. Over the same period the benchmark E60B40 performance was 10.8% and 8.8% respectively. Over the previous week the market value of iM-FlipSaver 70:30 | 20:80 gained 0.17% at a time when SPY gained 0.23%. A starting capital of $100,000 at inception on 7/15/2015 would have grown to $123,160 which includes $586 cash and excludes $909 spent on fees and slippage. |
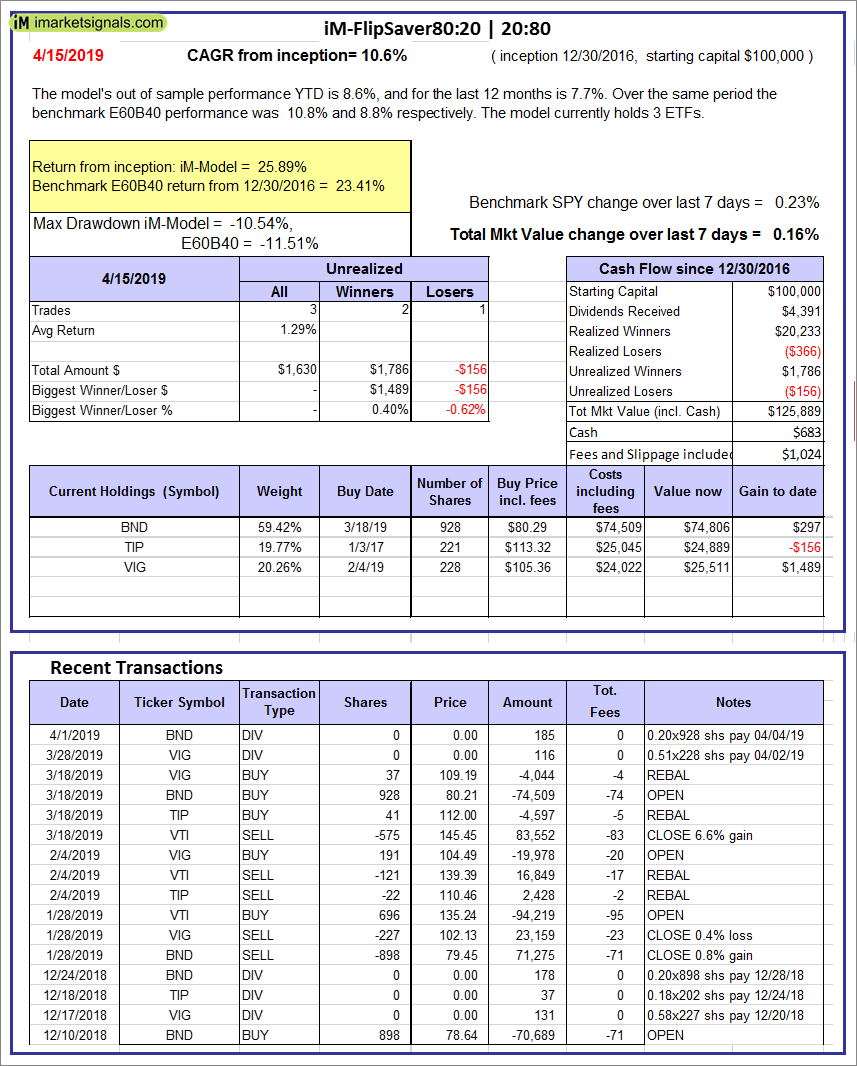 |
iM-FlipSaver 80:20 | 20:80 – 2017: The model’s out of sample performance YTD is 8.6%, and for the last 12 months is 7.7%. Over the same period the benchmark E60B40 performance was 10.8% and 8.8% respectively. Over the previous week the market value of iM-FlipSaver 80:20 | 20:80 gained 0.16% at a time when SPY gained 0.23%. A starting capital of $100,000 at inception on 1/2/2017 would have grown to $125,889 which includes $683 cash and excludes $1,024 spent on fees and slippage. |
 |
iM-Best(SPY-SH).R1: The model’s out of sample performance YTD is 4.6%, and for the last 12 months is 11.5%. Over the same period the benchmark SPY performance was 16.5% and 11.5% respectively. Over the previous week the market value of Best(SPY-SH) gained 0.42% at a time when SPY gained 0.41%. A starting capital of $100,000 at inception on 1/2/2009 would have grown to $628,729 which includes -$11,234 cash and excludes $22,629 spent on fees and slippage. |
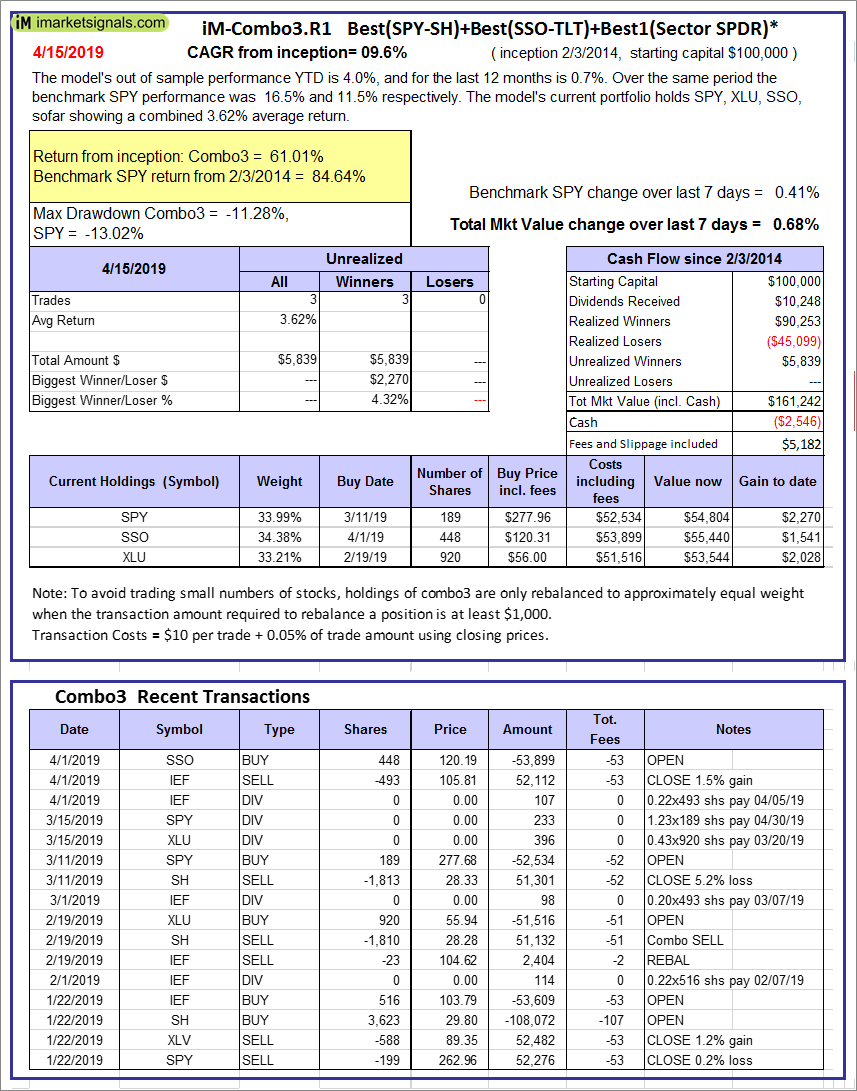 |
iM-Combo3.R1: The model’s out of sample performance YTD is 4.0%, and for the last 12 months is 0.7%. Over the same period the benchmark SPY performance was 16.5% and 11.5% respectively. Over the previous week the market value of iM-Combo3.R1 gained 0.68% at a time when SPY gained 0.41%. A starting capital of $100,000 at inception on 2/3/2014 would have grown to $161,242 which includes -$2,546 cash and excludes $5,182 spent on fees and slippage. |
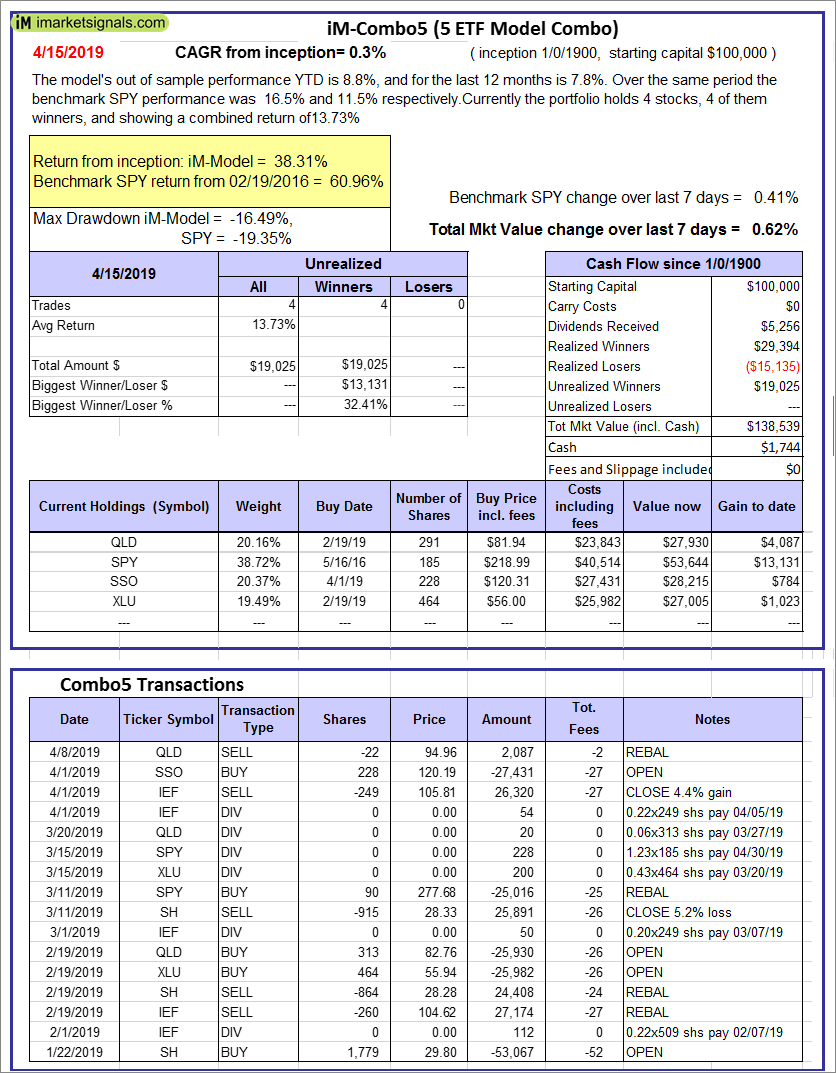 |
iM-Combo5: The model’s out of sample performance YTD is 8.8%, and for the last 12 months is 7.8%. Over the same period the benchmark SPY performance was 16.5% and 11.5% respectively. Over the previous week the market value of iM-Combo5 gained 0.62% at a time when SPY gained 0.41%. A starting capital of $100,000 at inception on 2/22/2016 would have grown to $138,539 which includes $1,744 cash and excludes $0 spent on fees and slippage. |
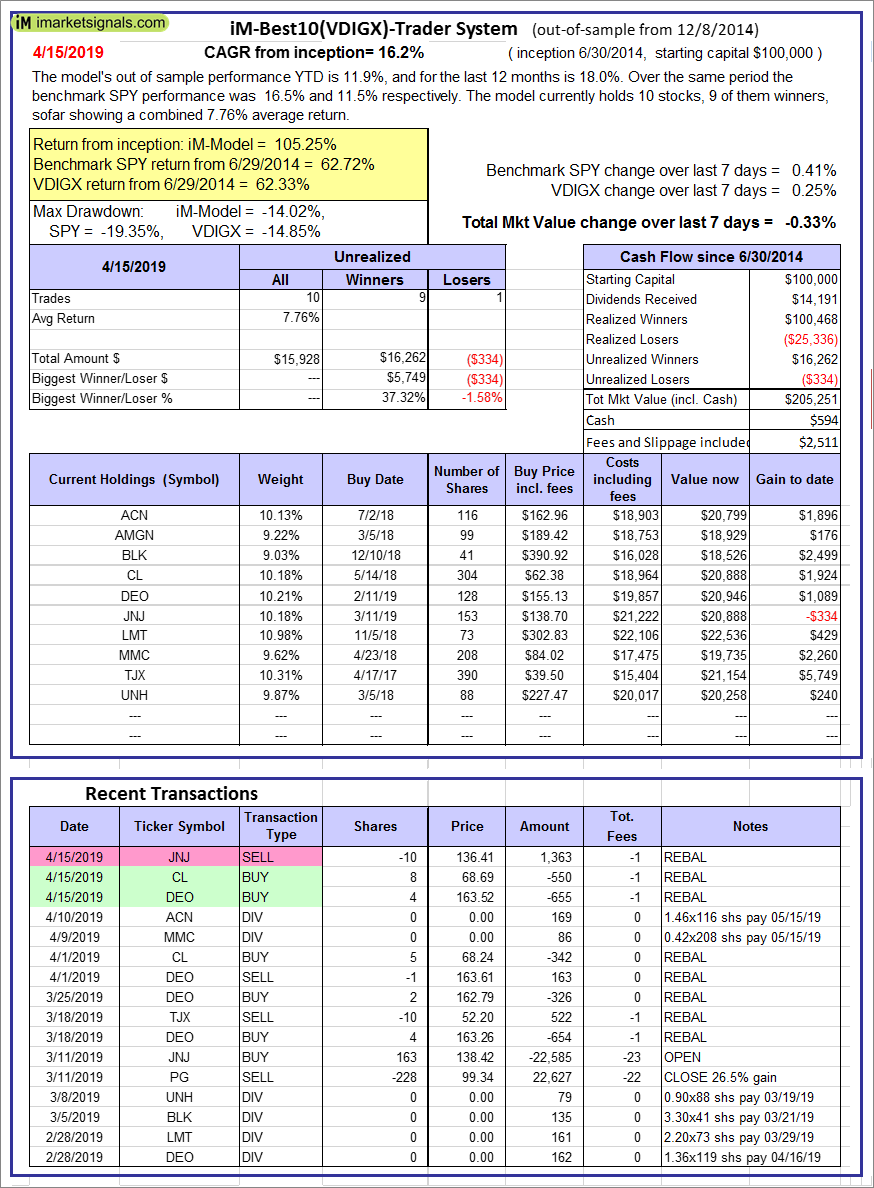 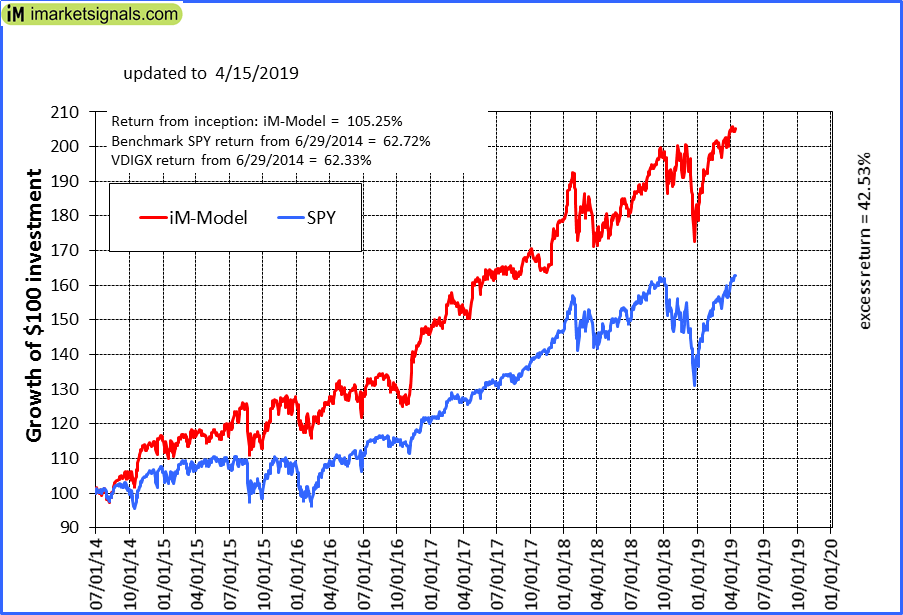 |
iM-Best10(VDIGX)-Trader: The model’s out of sample performance YTD is 11.9%, and for the last 12 months is 18.0%. Over the same period the benchmark SPY performance was 16.5% and 11.5% respectively. Since inception, on 7/1/2014, the model gained 105.25% while the benchmark SPY gained 62.72% and VDIGX gained 62.33% over the same period. Over the previous week the market value of iM-Best10(VDIGX) gained -0.33% at a time when SPY gained 0.41%. A starting capital of $100,000 at inception on 7/1/2014 would have grown to $205,251 which includes $594 cash and excludes $2,511 spent on fees and slippage. |
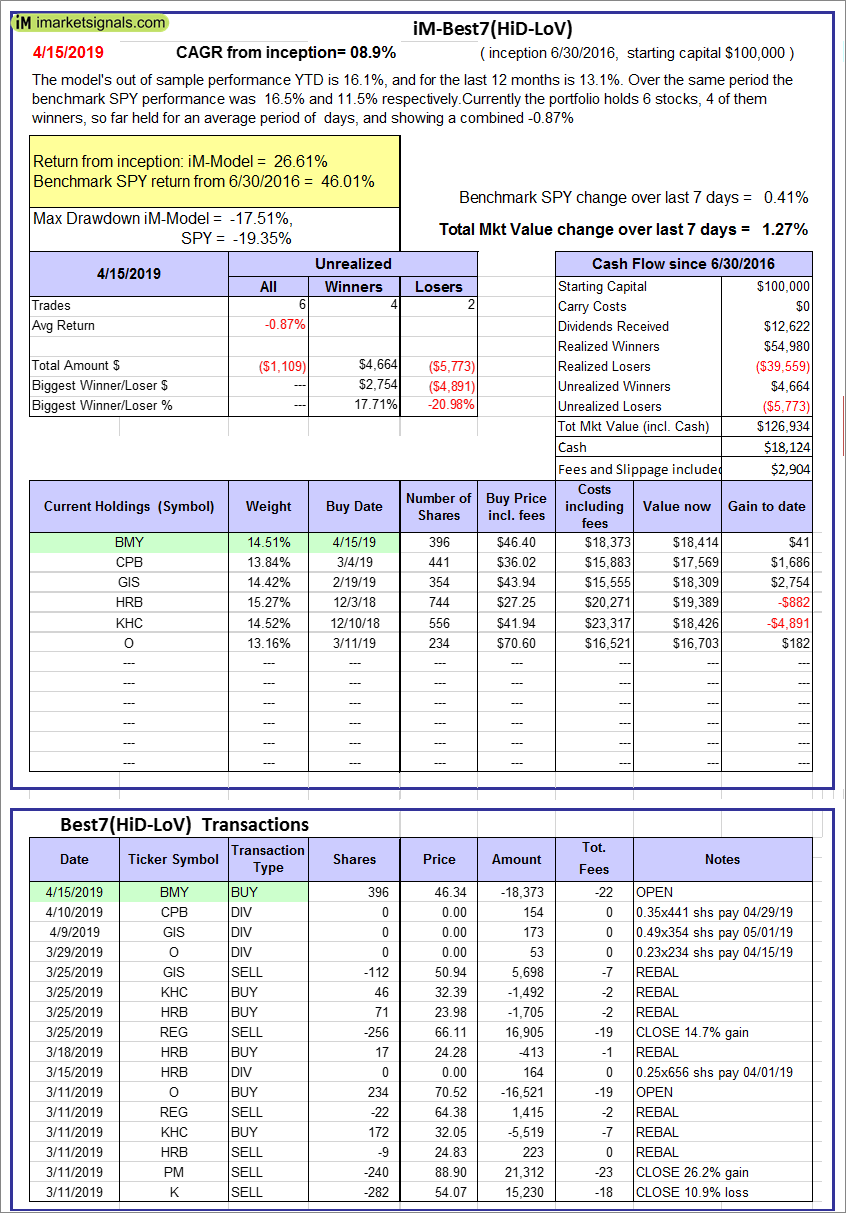 |
iM-Best7(HiD-LoV): The model’s out of sample performance YTD is 16.1%, and for the last 12 months is 13.1%. Over the same period the benchmark SPY performance was 16.5% and 11.5% respectively. Over the previous week the market value of iM-Best7(HiD-LoV) gained 1.27% at a time when SPY gained 0.41%. A starting capital of $100,000 at inception on 6/30/2016 would have grown to $126,934 which includes $18,124 cash and excludes $2,904 spent on fees and slippage. |
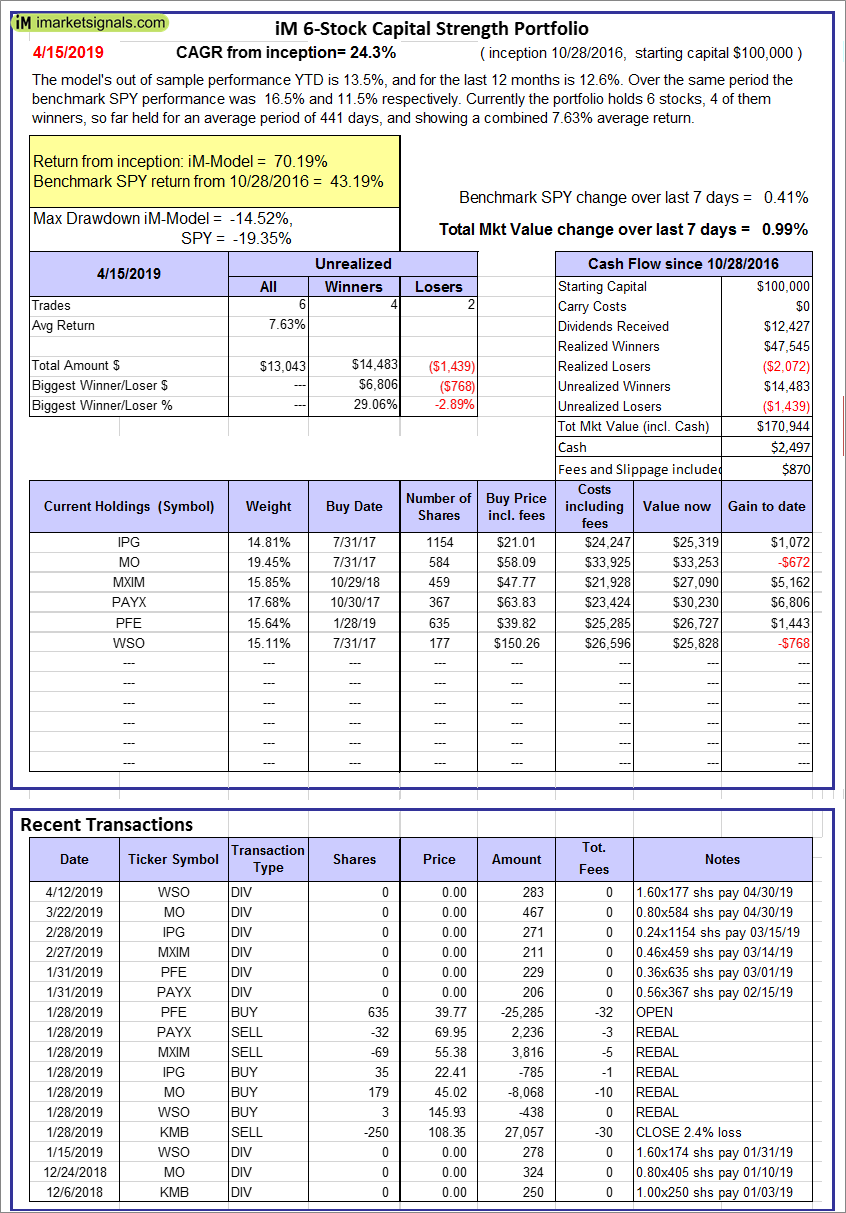 |
iM 6-Stock Capital Strength Portfolio: The model’s out of sample performance YTD is 13.5%, and for the last 12 months is 12.6%. Over the same period the benchmark SPY performance was 16.5% and 11.5% respectively. Over the previous week the market value of the iM 6-Stock Capital Strength Portfolio gained 0.99% at a time when SPY gained 0.41%. A starting capital of $100,000 at inception on 10/28/2016 would have grown to $170,944 which includes $2,497 cash and excludes $870 spent on fees and slippage. |
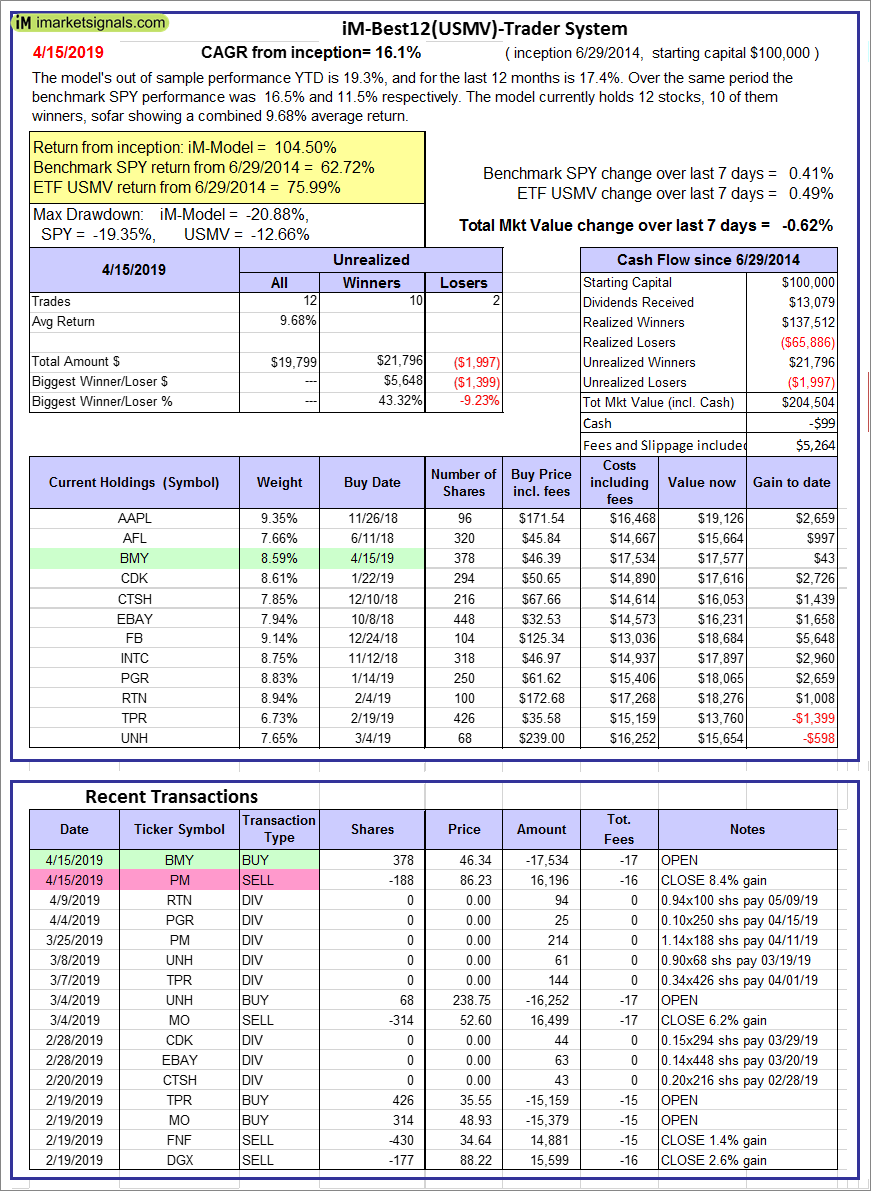  |
iM-Best12(USMV)-Trader: The model’s out of sample performance YTD is 19.3%, and for the last 12 months is 17.4%. Over the same period the benchmark SPY performance was 16.5% and 11.5% respectively. Since inception, on 6/30/2014, the model gained 104.50% while the benchmark SPY gained 62.72% and the ETF USMV gained 75.99% over the same period. Over the previous week the market value of iM-Best12(USMV)-Trader gained -0.62% at a time when SPY gained 0.41%. A starting capital of $100,000 at inception on 6/30/2014 would have grown to $204,504 which includes -$99 cash and excludes $5,264 spent on fees and slippage. |
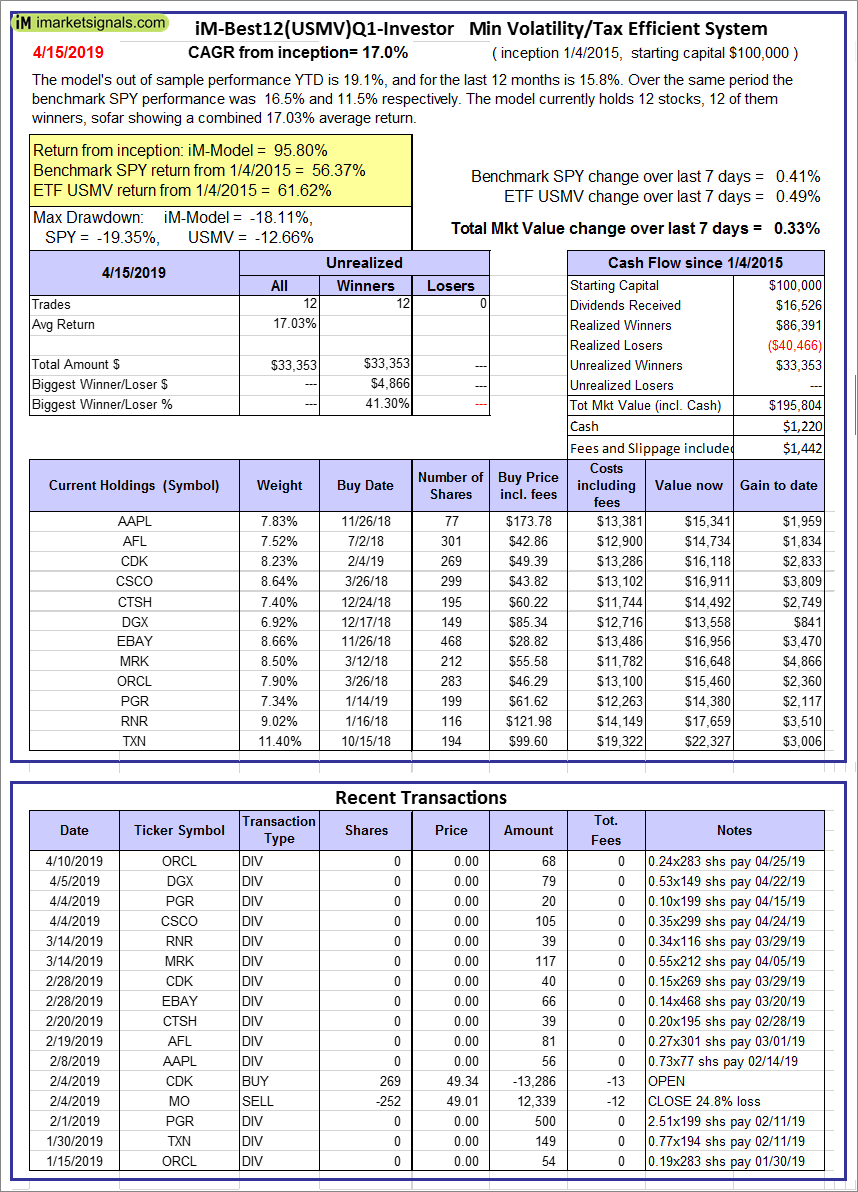 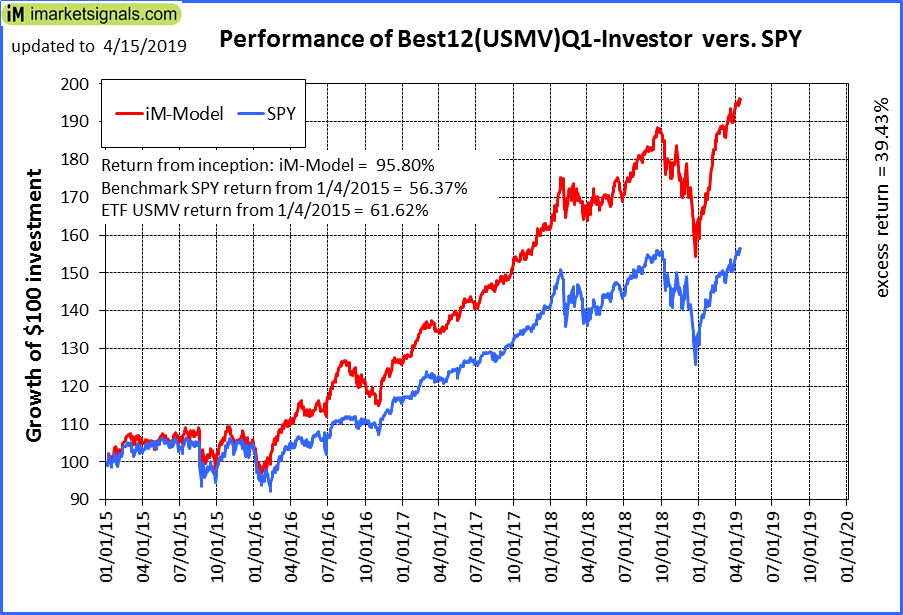 |
iM-Best12(USMV)Q1-Investor: The model’s out of sample performance YTD is 19.1%, and for the last 12 months is 15.8%. Over the same period the benchmark SPY performance was 16.5% and 11.5% respectively. Since inception, on 1/5/2015, the model gained 95.80% while the benchmark SPY gained 56.37% and the ETF USMV gained 61.62% over the same period. Over the previous week the market value of iM-Best12(USMV)Q1 gained 0.33% at a time when SPY gained 0.41%. A starting capital of $100,000 at inception on 1/5/2015 would have grown to $195,804 which includes $1,220 cash and excludes $1,442 spent on fees and slippage. |
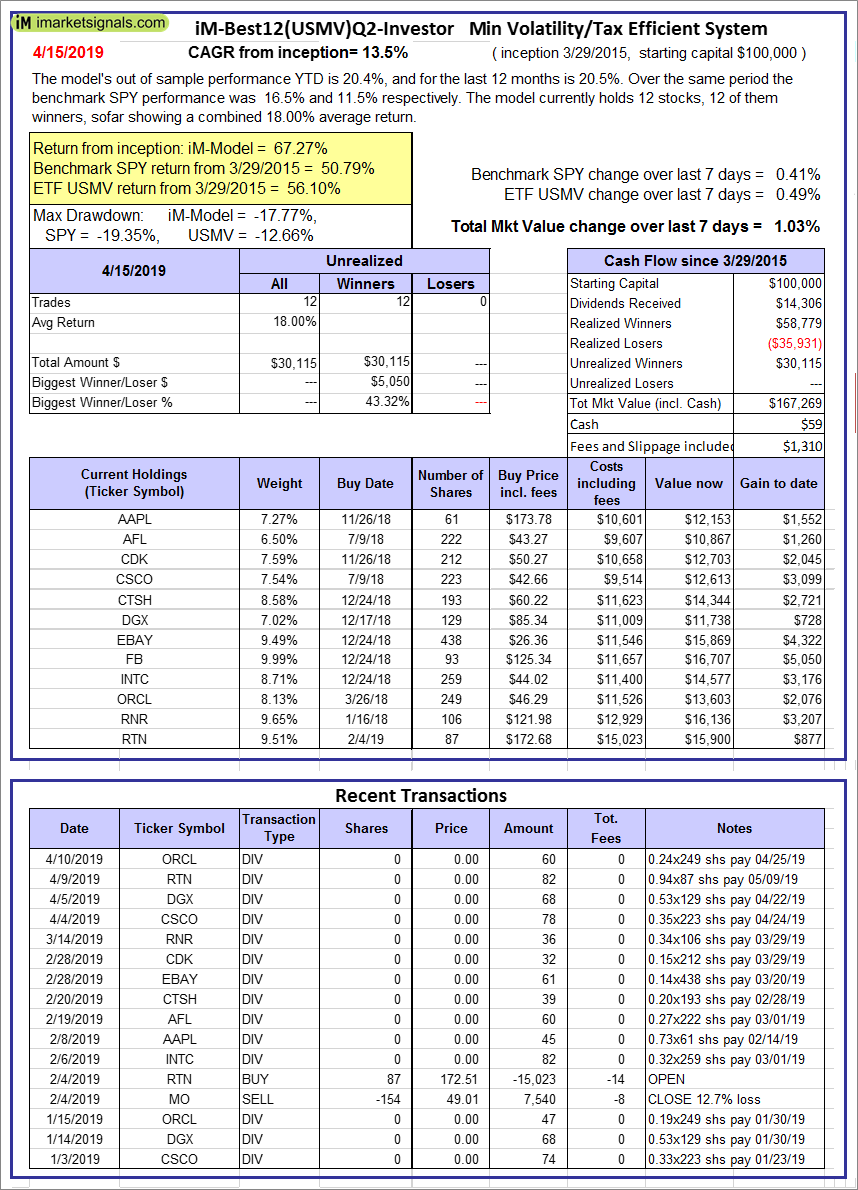 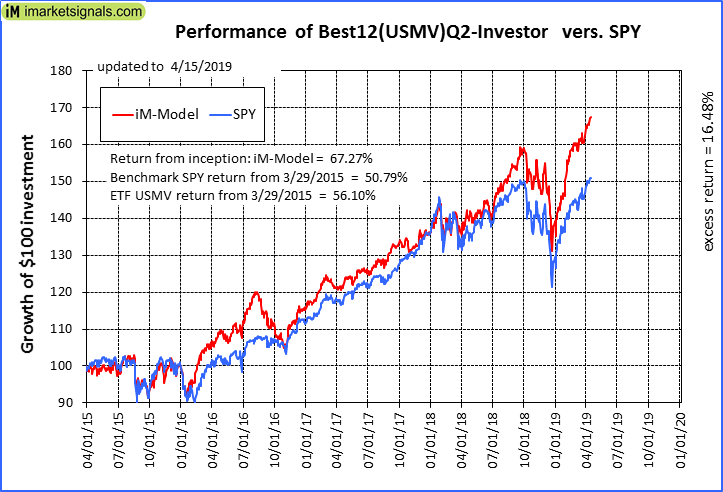 |
iM-Best12(USMV)Q2-Investor: The model’s out of sample performance YTD is 20.4%, and for the last 12 months is 20.5%. Over the same period the benchmark SPY performance was 16.5% and 11.5% respectively. Since inception, on 3/30/2015, the model gained 67.27% while the benchmark SPY gained 50.79% and the ETF USMV gained 56.10% over the same period. Over the previous week the market value of iM-Best12(USMV)Q2 gained 1.03% at a time when SPY gained 0.41%. A starting capital of $100,000 at inception on 3/30/2015 would have grown to $167,269 which includes $59 cash and excludes $1,310 spent on fees and slippage. |
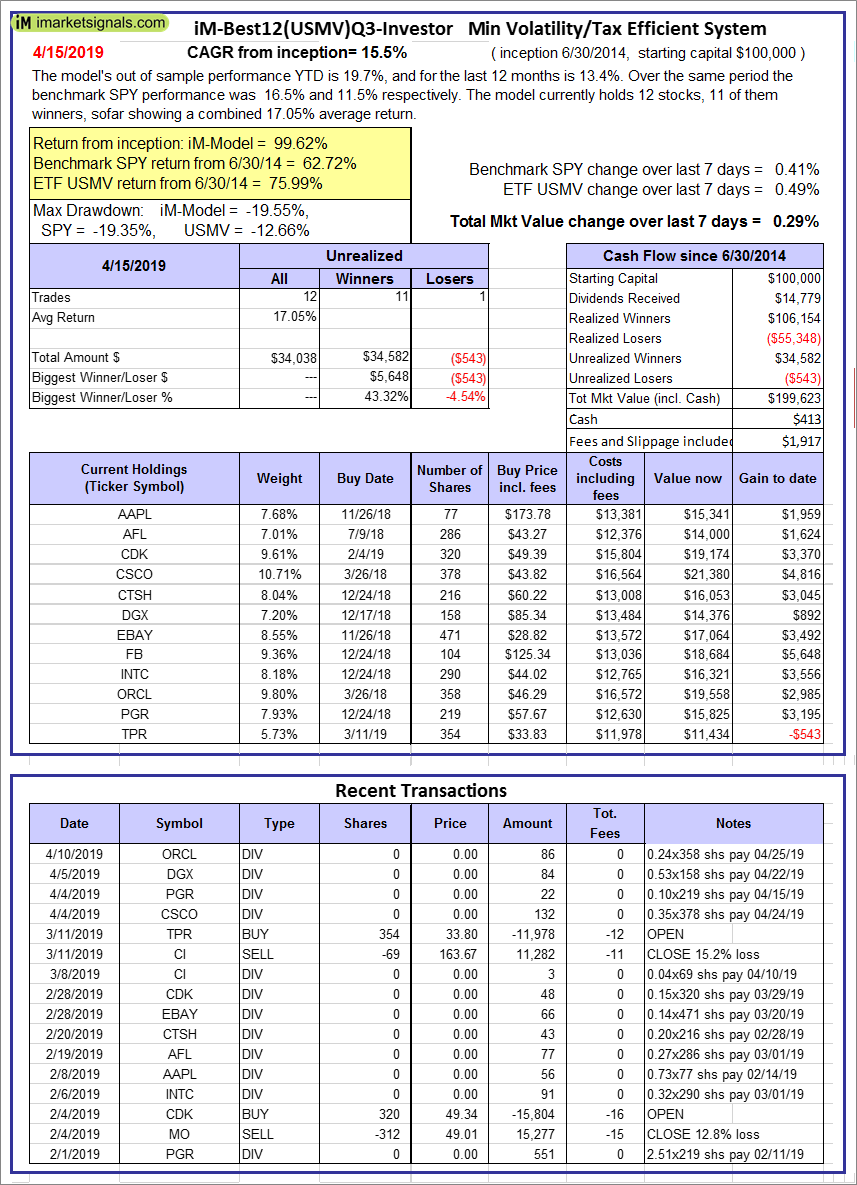 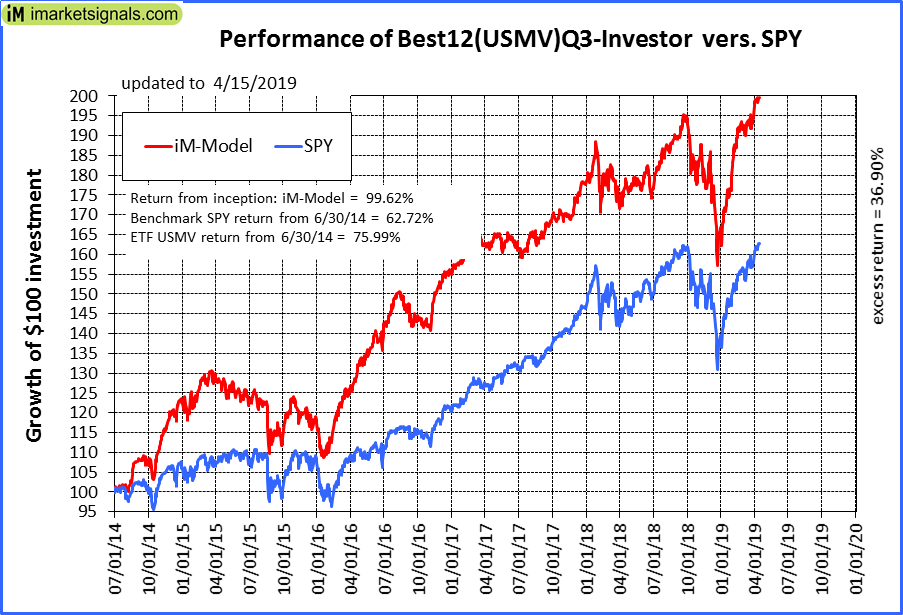 |
iM-Best12(USMV)Q3-Investor: The model’s out of sample performance YTD is 19.7%, and for the last 12 months is 13.4%. Over the same period the benchmark SPY performance was 16.5% and 11.5% respectively. Since inception, on 7/1/2014, the model gained 99.62% while the benchmark SPY gained 62.72% and the ETF USMV gained 75.99% over the same period. Over the previous week the market value of iM-Best12(USMV)Q3 gained 0.29% at a time when SPY gained 0.41%. A starting capital of $100,000 at inception on 7/1/2014 would have grown to $199,623 which includes $413 cash and excludes $1,917 spent on fees and slippage. |
 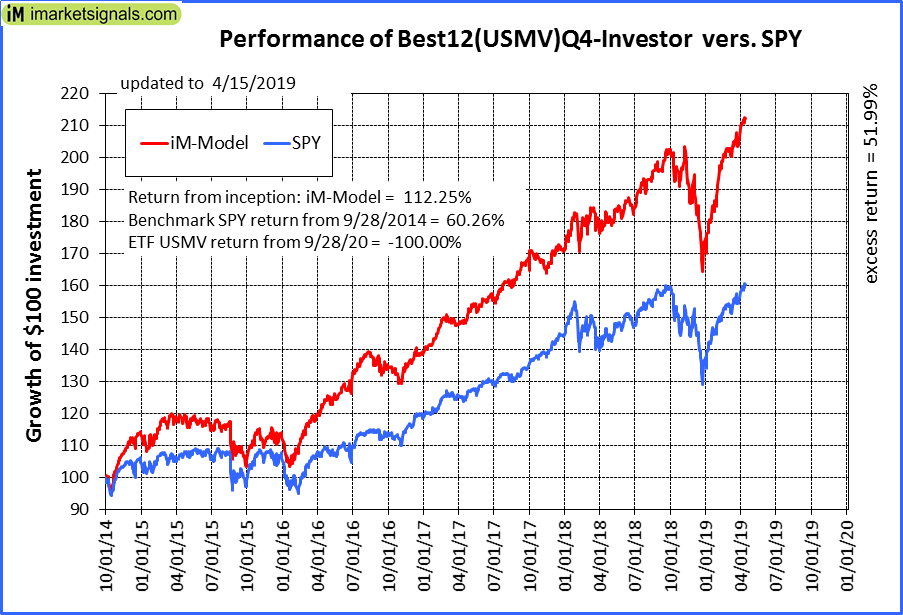 |
iM-Best12(USMV)Q4-Investor: Since inception, on 9/29/2014, the model gained 112.25% while the benchmark SPY gained 60.26% and the ETF USMV gained -100.00% over the same period. Over the previous week the market value of iM-Best12(USMV)Q4 gained 0.26% at a time when SPY gained 0.41%. A starting capital of $100,000 at inception on 9/29/2014 would have grown to $212,253 which includes $498 cash and excludes $1,723 spent on fees and slippage. |
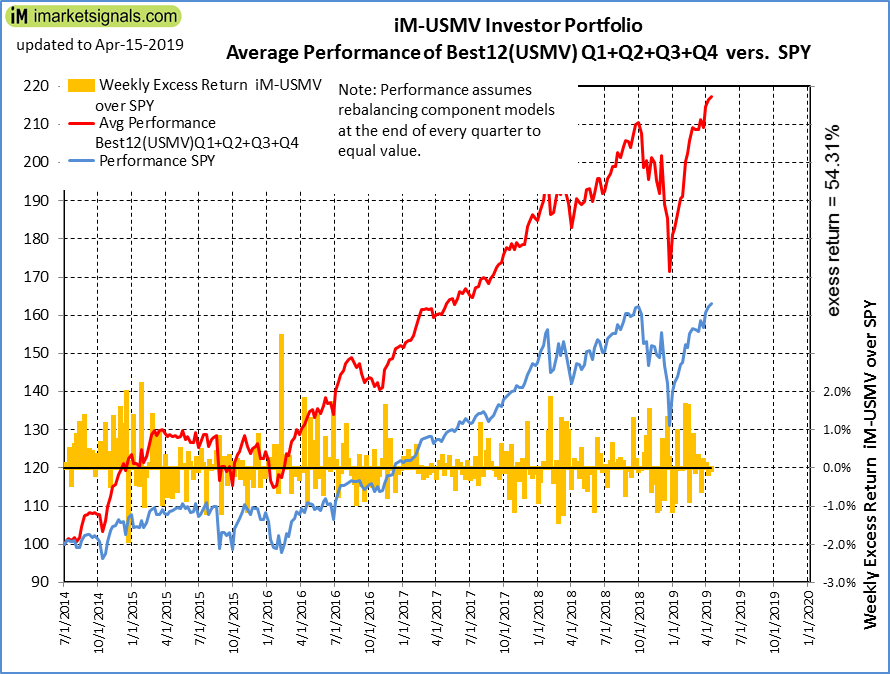 |
Average Performance of iM-Best12(USMV)Q1+Q2+Q3+Q4-Investor resulted in an excess return of 54.31% over SPY. (see iM-USMV Investor Portfolio) |
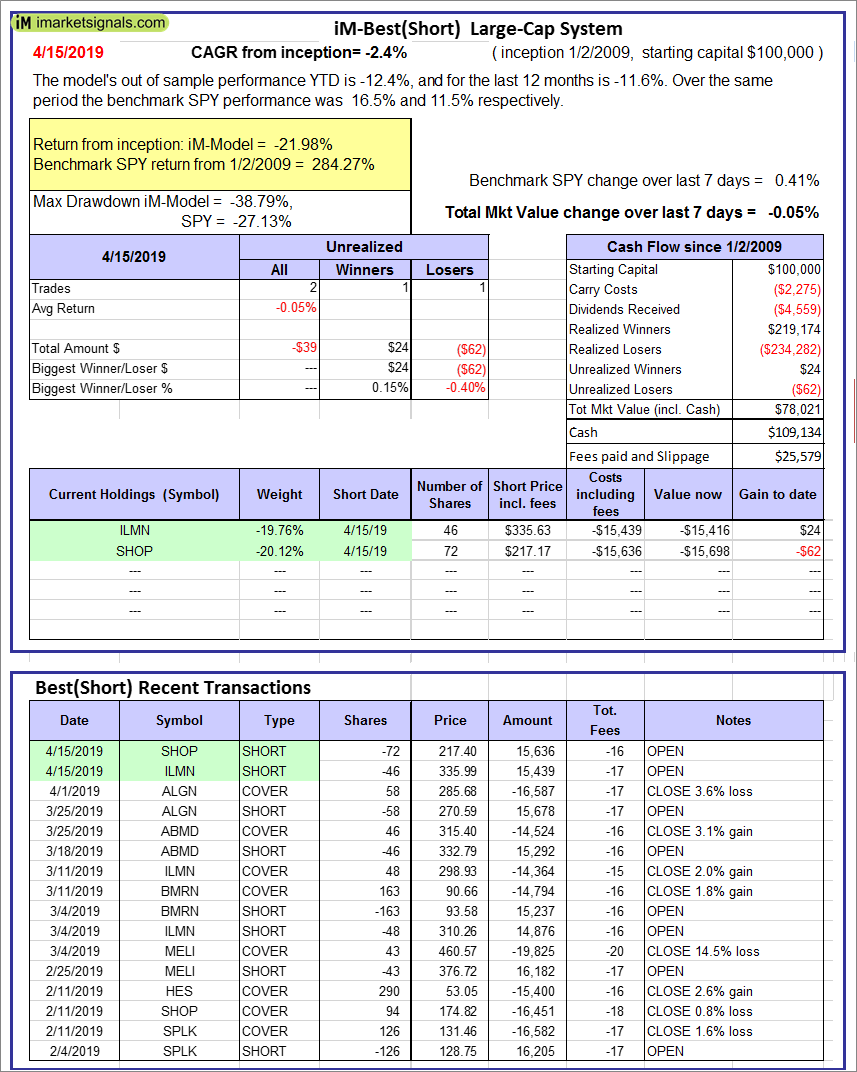 |
iM-Best(Short): The model’s out of sample performance YTD is -12.4%, and for the last 12 months is -11.6%. Over the same period the benchmark SPY performance was 16.5% and 11.5% respectively. Over the previous week the market value of iM-Best(Short) gained -0.05% at a time when SPY gained 0.41%. Over the period 1/2/2009 to 4/15/2019 the starting capital of $100,000 would have grown to $78,021 which includes $109,134 cash and excludes $25,579 spent on fees and slippage. |
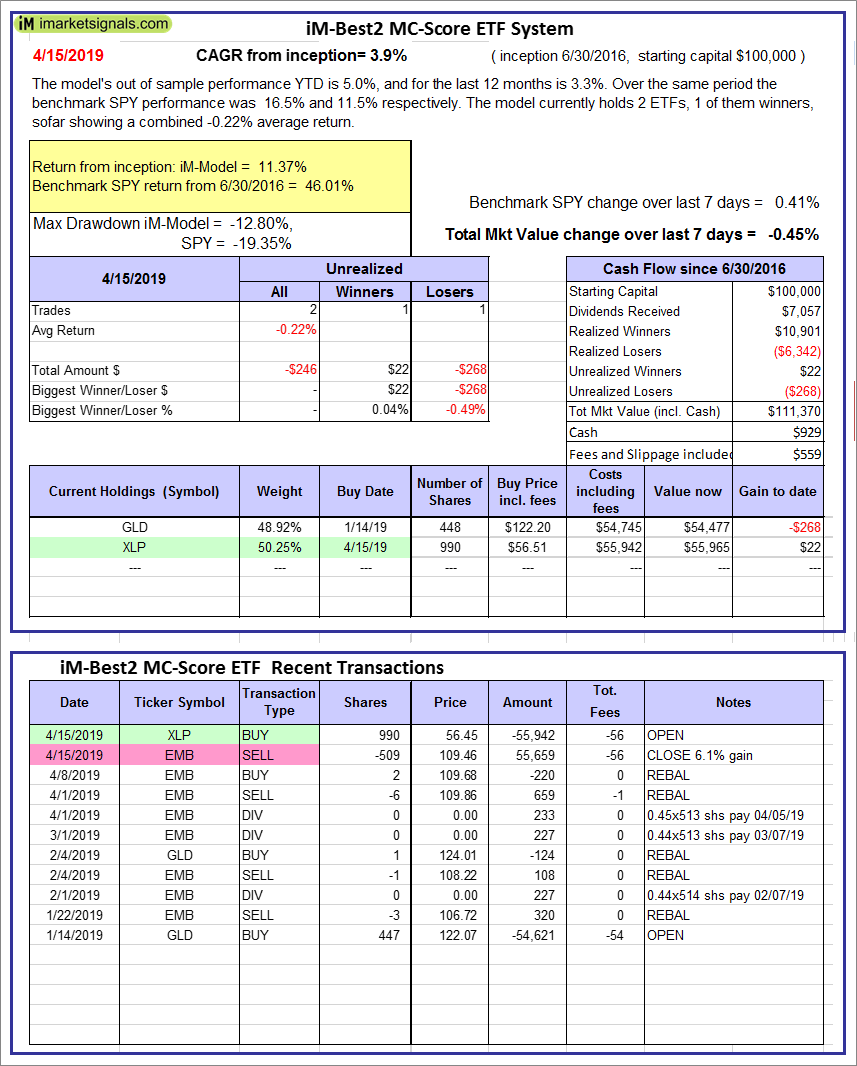 |
iM-Best2 MC-Score ETF System: The model’s out of sample performance YTD is 5.0%, and for the last 12 months is 3.3%. Over the same period the benchmark SPY performance was 16.5% and 11.5% respectively. Over the previous week the market value of the iM-Best2 MC-Score ETF System gained -0.45% at a time when SPY gained 0.41%. A starting capital of $100,000 at inception on 6/30/2016 would have grown to $111,370 which includes $929 cash and excludes $559 spent on fees and slippage. |
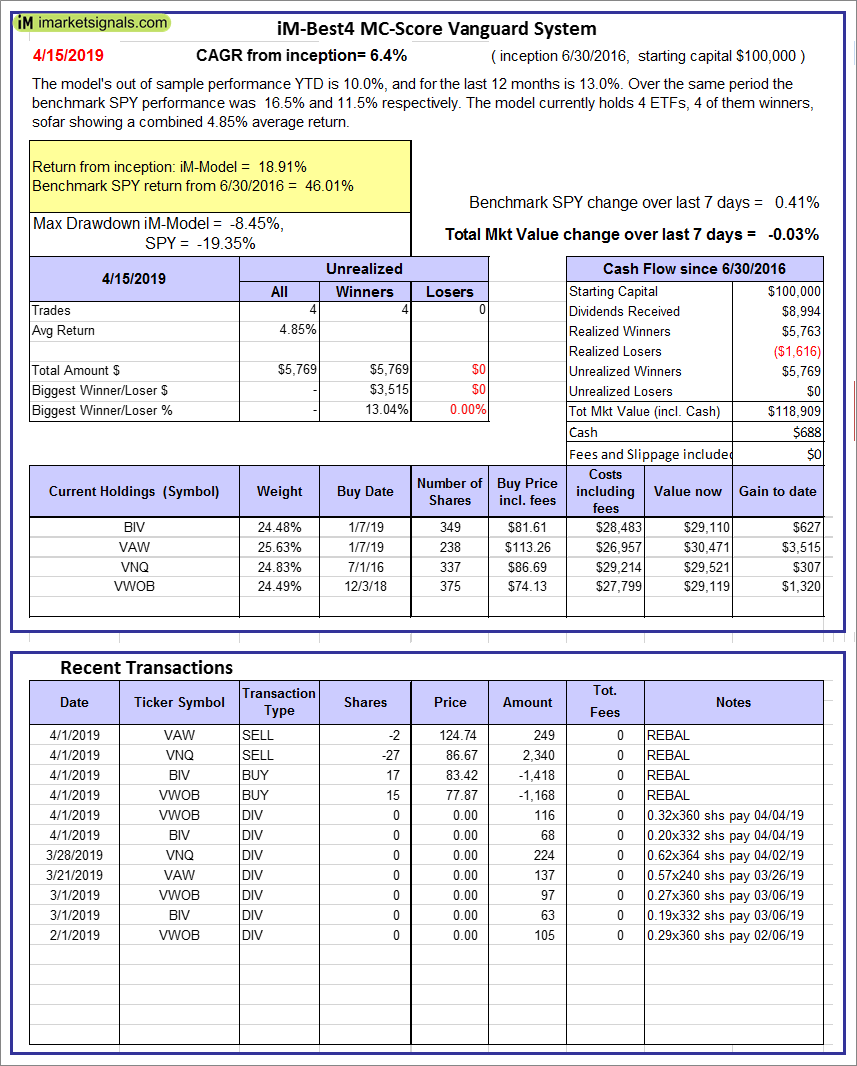 |
iM-Best4 MC-Score Vanguard System: The model’s out of sample performance YTD is 10.0%, and for the last 12 months is 13.0%. Over the same period the benchmark SPY performance was 16.5% and 11.5% respectively. Over the previous week the market value of the iM-Best4 MC-Score Vanguard System gained -0.03% at a time when SPY gained 0.41%. A starting capital of $100,000 at inception on 6/30/2016 would have grown to $118,909 which includes $688 cash and excludes $00 spent on fees and slippage. |
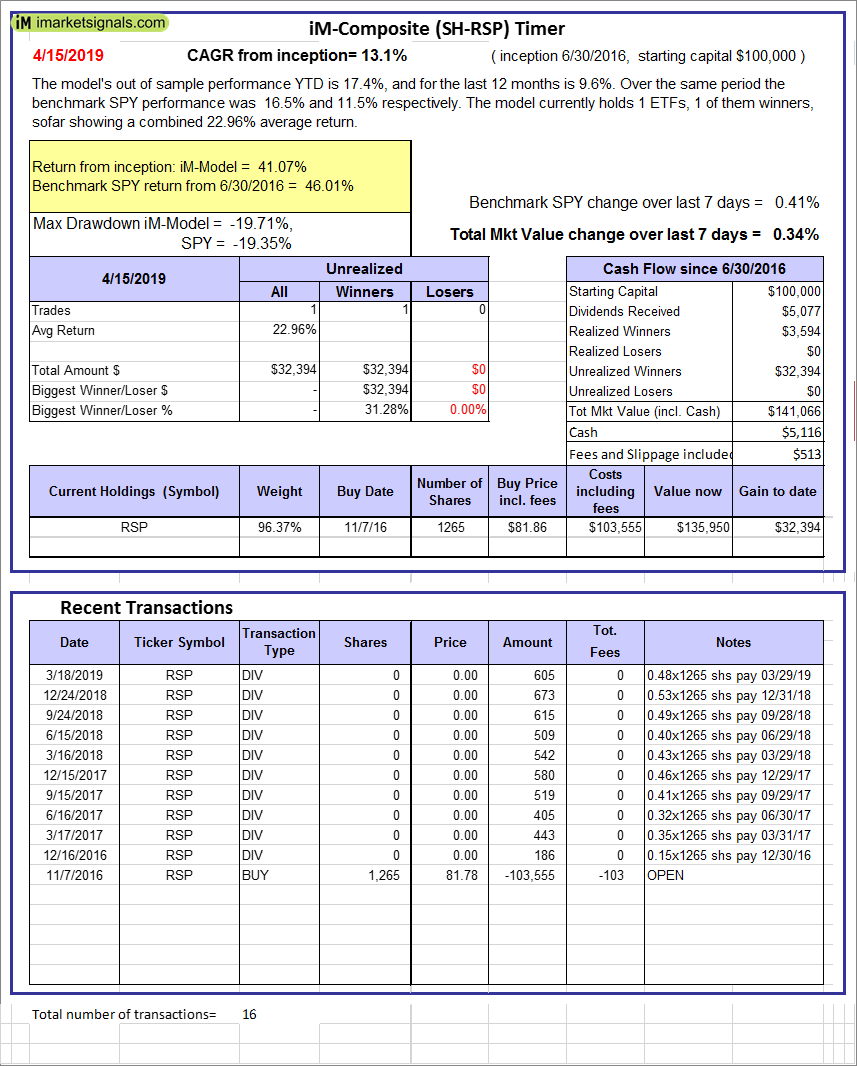 |
iM-Composite (SH-RSP) Timer: The model’s out of sample performance YTD is 17.4%, and for the last 12 months is 9.6%. Over the same period the benchmark SPY performance was 16.5% and 11.5% respectively. Over the previous week the market value of the iM-Composite (SH-RSP) Timer gained 0.34% at a time when SPY gained 0.41%. A starting capital of $100,000 at inception on 6/30/2016 would have grown to $141,066 which includes $5,116 cash and excludes $513 spent on fees and slippage. |
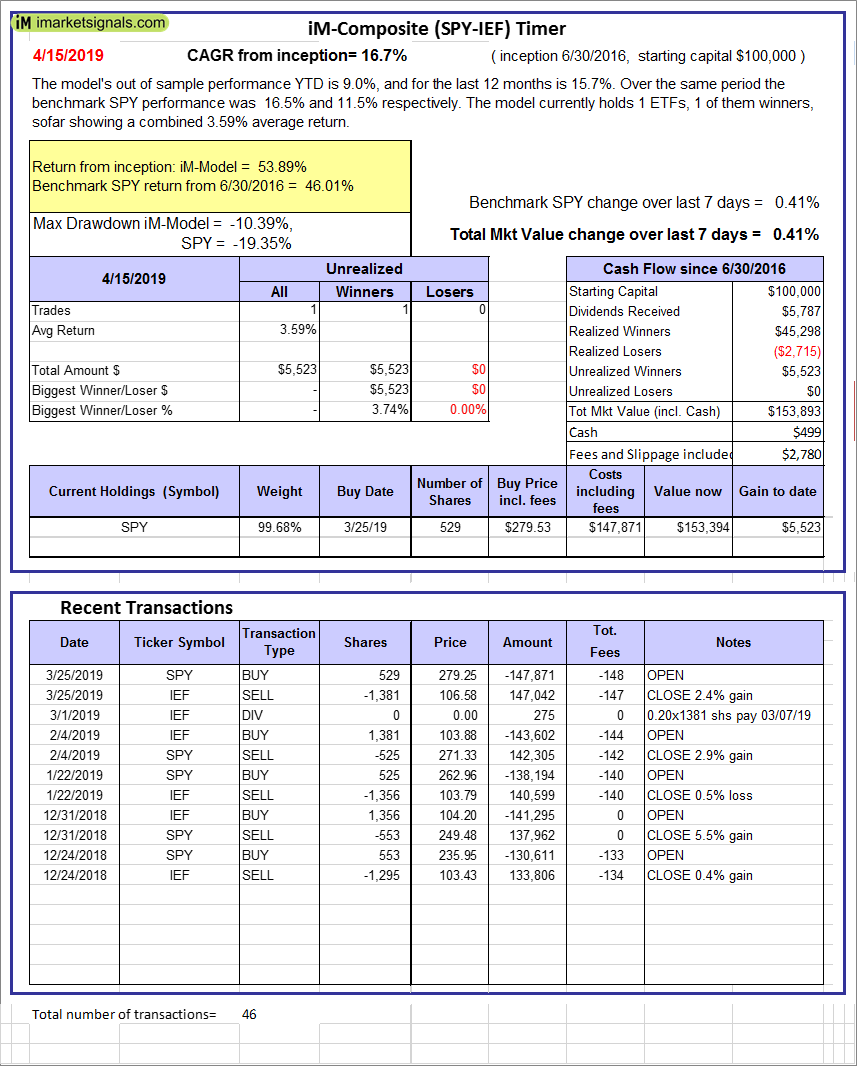 |
iM-Composite (SPY-IEF) Timer: The model’s out of sample performance YTD is 9.0%, and for the last 12 months is 15.7%. Over the same period the benchmark SPY performance was 16.5% and 11.5% respectively. Over the previous week the market value of the iM-Composite (SPY-IEF) Timer gained 0.41% at a time when SPY gained 0.41%. A starting capital of $100,000 at inception on 6/30/2016 would have grown to $153,893 which includes $499 cash and excludes $2,780 spent on fees and slippage. |
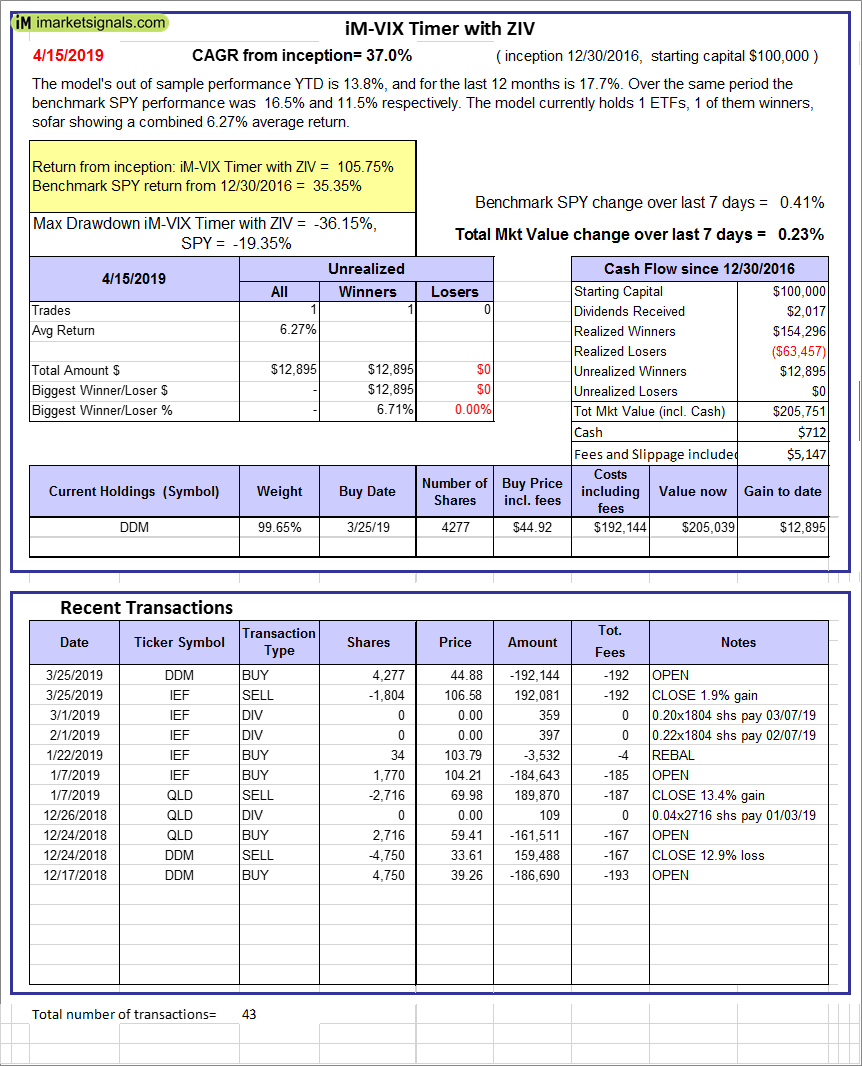 |
iM-VIX Timer with ZIV: The model’s out of sample performance YTD is 13.8%, and for the last 12 months is 17.7%. Over the same period the benchmark SPY performance was 16.5% and 11.5% respectively. Over the previous week the market value of the iM-VIX Timer with ZIV gained 0.23% at a time when SPY gained 0.41%. A starting capital of $100,000 at inception on 6/30/2016 would have grown to $205,751 which includes $712 cash and excludes $5,147 spent on fees and slippage. |
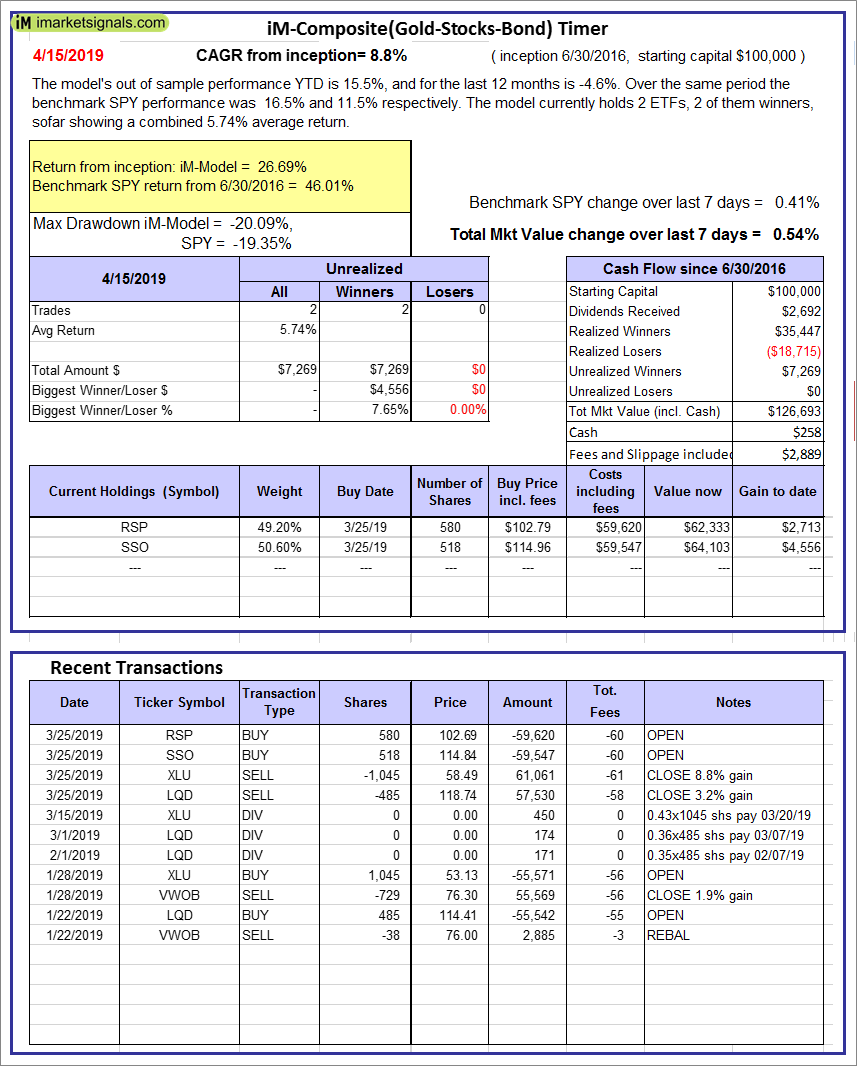 |
iM-Composite(Gold-Stocks-Bond) Timer: The model’s out of sample performance YTD is 15.5%, and for the last 12 months is -4.6%. Over the same period the benchmark SPY performance was 16.5% and 11.5% respectively. Over the previous week the market value of the iM-Composite(Gold-Stocks-Bond) Timer gained 0.54% at a time when SPY gained 0.41%. A starting capital of $100,000 at inception on 6/30/2016 would have grown to $126,693 which includes $258 cash and excludes $2,889 spent on fees and slippage. |
 |
iM-Low Turnover Composite Timer Combo: The model’s out of sample performance YTD is 9.2%, and for the last 12 months is -2.2%. Over the same period the benchmark SPY performance was 16.5% and 11.5% respectively. Over the previous week the market value of the iM-Low Turnover Composite Timer Combo gained 0.26% at a time when SPY gained 0.41%. A starting capital of $100,000 at inception on 3/24/27 would have grown to $105,196 which includes $1,010 cash and excludes $675 spent on fees and slippage. |
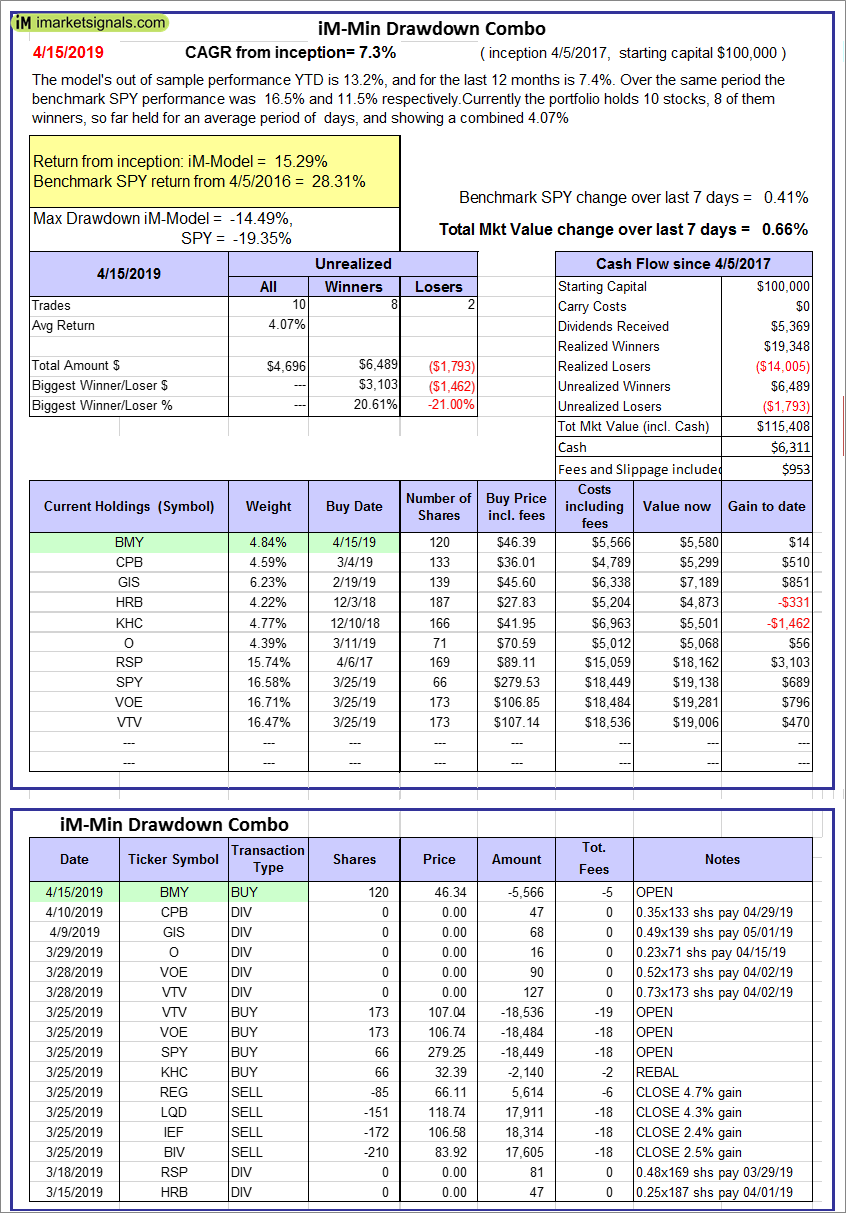 |
iM-Min Drawdown Combo: The model’s out of sample performance YTD is 13.2%, and for the last 12 months is 7.4%. Over the same period the benchmark SPY performance was 16.5% and 11.5% respectively. Over the previous week the market value of the iM-Min Drawdown Combo gained 0.66% at a time when SPY gained 0.41%. A starting capital of $100,000 at inception on 4/5/2017 would have grown to $115,408 which includes $6,311 cash and excludes $953 spent on fees and slippage. |
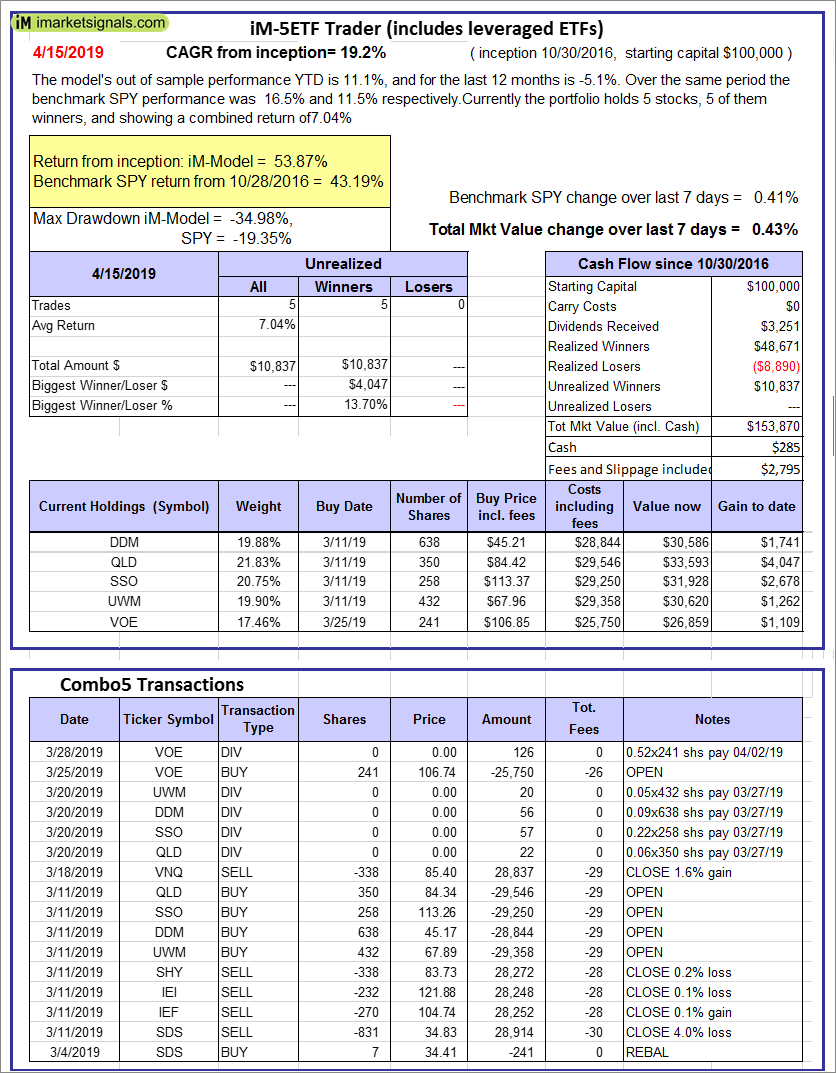 |
iM-5ETF Trader (includes leveraged ETFs): The model’s out of sample performance YTD is 11.1%, and for the last 12 months is -5.1%. Over the same period the benchmark SPY performance was 16.5% and 11.5% respectively. Over the previous week the market value of the iM-5ETF Trader (includes leveraged ETFs) gained 0.43% at a time when SPY gained 0.41%. A starting capital of $100,000 at inception on 10/30/2016 would have grown to $153,870 which includes $285 cash and excludes $2,795 spent on fees and slippage. |
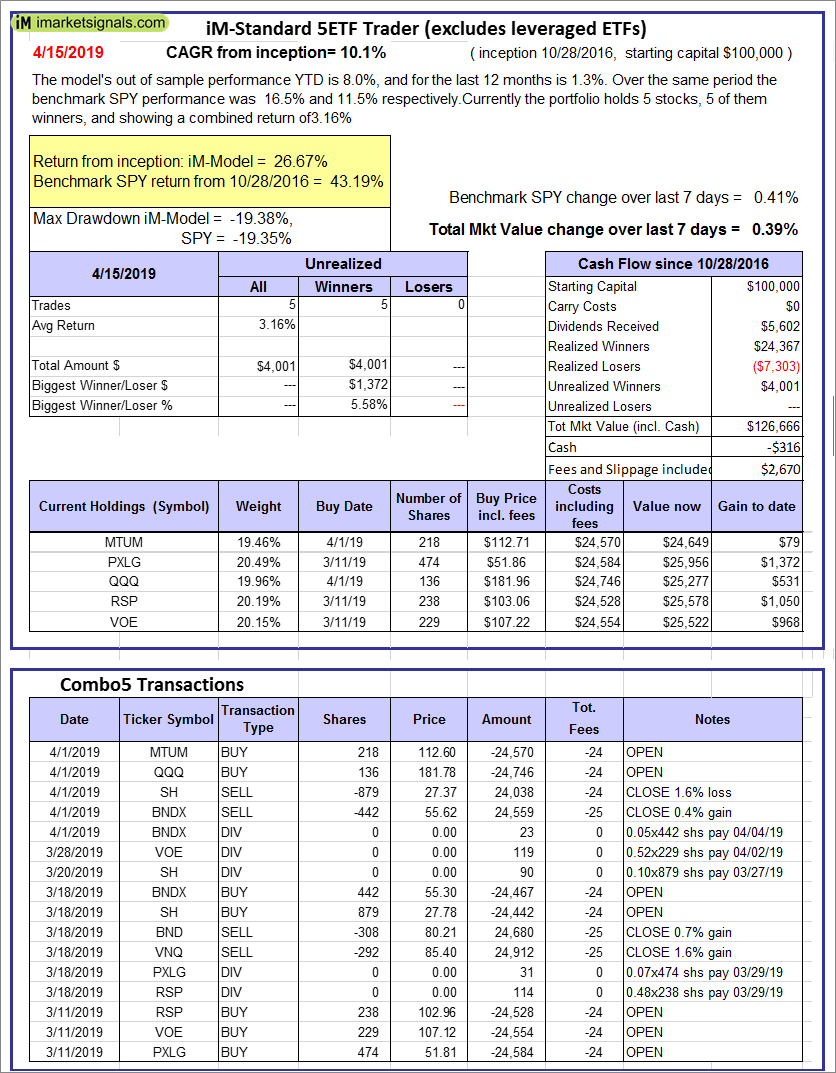 |
iM-Standard 5ETF Trader (excludes leveraged ETFs): The model’s out of sample performance YTD is 8.0%, and for the last 12 months is 1.3%. Over the same period the benchmark SPY performance was 16.5% and 11.5% respectively. Over the previous week the market value of the iM-Standard 5ETF Trader (excludes leveraged ETFs) gained 0.39% at a time when SPY gained 0.41%. A starting capital of $100,000 at inception on 10/30/2016 would have grown to $126,666 which includes -$316 cash and excludes $2,670 spent on fees and slippage. |
iM-Best Reports – 4/15/2019
Posted in pmp SPY-SH
Leave a Reply
You must be logged in to post a comment.