
  |
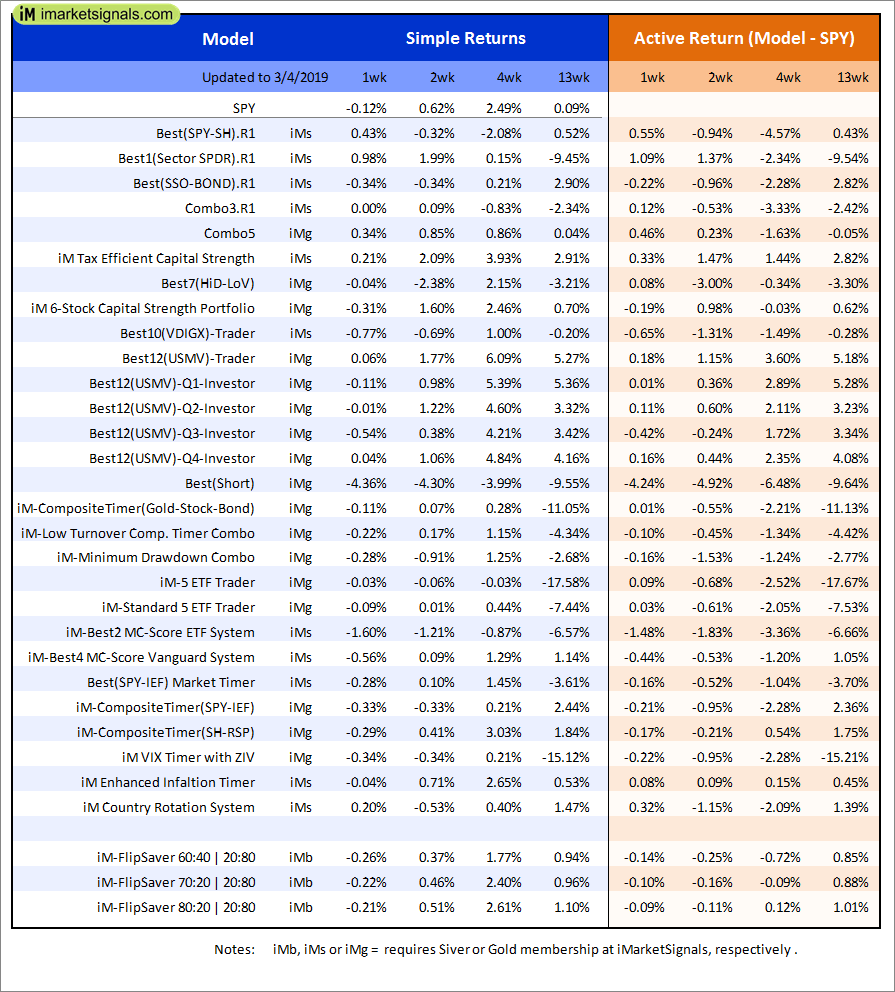
Out of sample performance summary of our models for the past 1, 2, 4 and 13 week periods. The active active return indicates how the models over- or underperformed the benchmark ETF SPY. Also the YTD, and the 1-, 3-, 5- and 10-year annualized returns are shown in the second table |
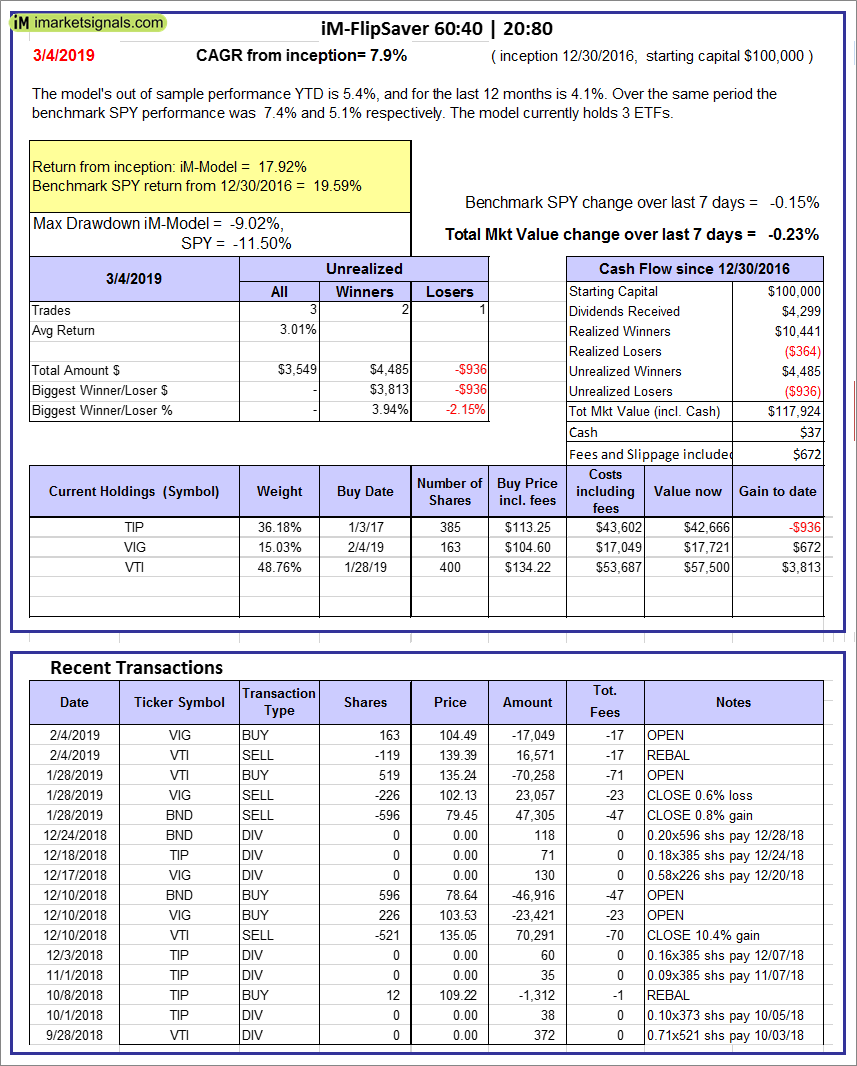 |
iM-FlipSaver 60:40 | 20:80 – 2017: The model’s out of sample performance YTD is 5.4%, and for the last 12 months is 4.1%. Over the same period the benchmark SPY performance was 7.4% and 5.1% respectively. Over the previous week the market value of iM-FlipSaver 80:20 | 20:80 gained -0.23% at a time when SPY gained -0.15%. A starting capital of $100,000 at inception on 7/16/2015 would have grown to $117,924 which includes $37 cash and excludes $672 spent on fees and slippage. |
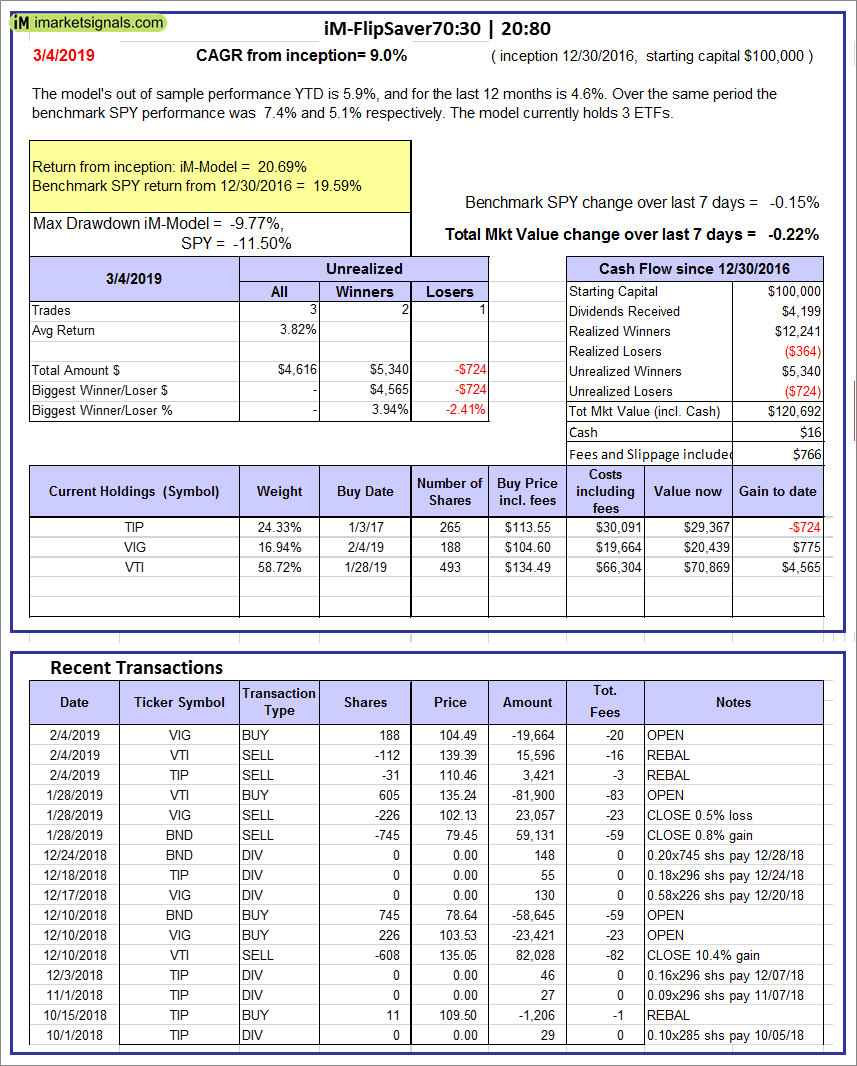 |
iM-FlipSaver 70:30 | 20:80 – 2017: The model’s out of sample performance YTD is 5.9%, and for the last 12 months is 4.6%. Over the same period the benchmark SPY performance was 7.4% and 5.1% respectively. Over the previous week the market value of iM-FlipSaver 70:30 | 20:80 gained -0.22% at a time when SPY gained -0.15%. A starting capital of $100,000 at inception on 7/15/2015 would have grown to $120,692 which includes $16 cash and excludes $766 spent on fees and slippage. |
 |
iM-FlipSaver 80:20 | 20:80 – 2017: The model’s out of sample performance YTD is 6.4%, and for the last 12 months is 5.0%. Over the same period the benchmark SPY performance was 7.4% and 5.1% respectively. Over the previous week the market value of iM-FlipSaver 80:20 | 20:80 gained -0.21% at a time when SPY gained -0.15%. A starting capital of $100,000 at inception on 1/2/2017 would have grown to $123,349 which includes -$21 cash and excludes $857 spent on fees and slippage. |
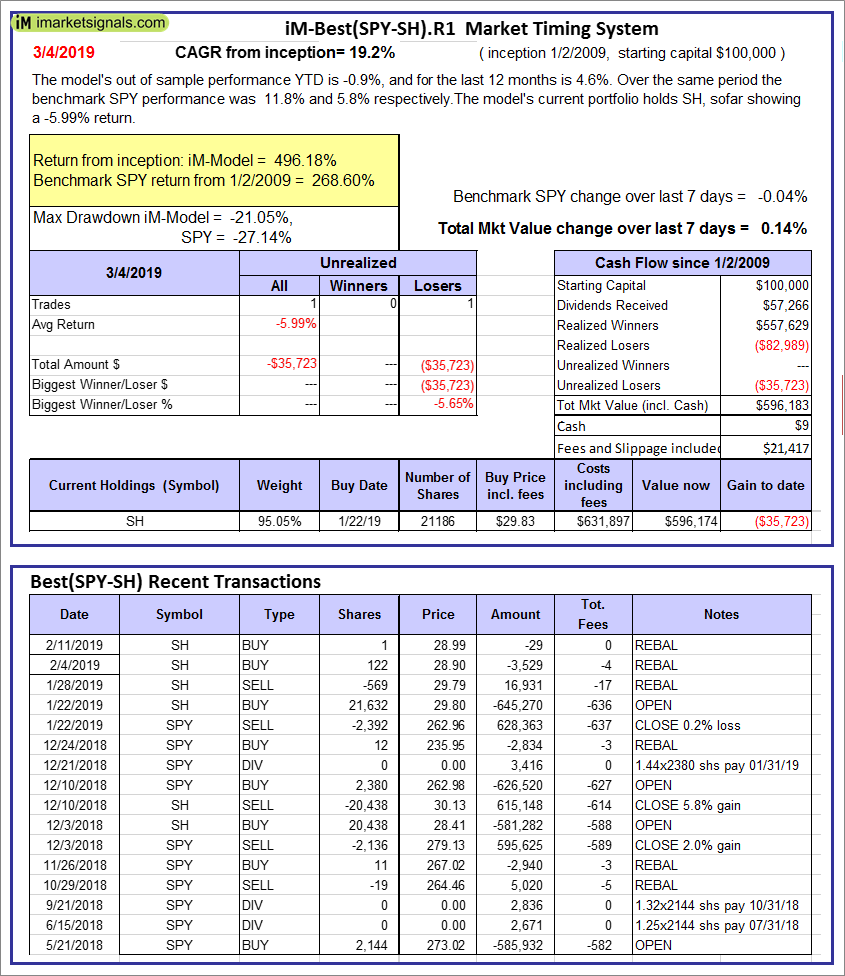 |
iM-Best(SPY-SH).R1: The model’s out of sample performance YTD is -0.9%, and for the last 12 months is 4.6%. Over the same period the benchmark SPY performance was 11.8% and 5.8% respectively. Over the previous week the market value of Best(SPY-SH) gained 0.14% at a time when SPY gained -0.04%. A starting capital of $100,000 at inception on 1/2/2009 would have grown to $596,183 which includes $9 cash and excludes $21,417 spent on fees and slippage. |
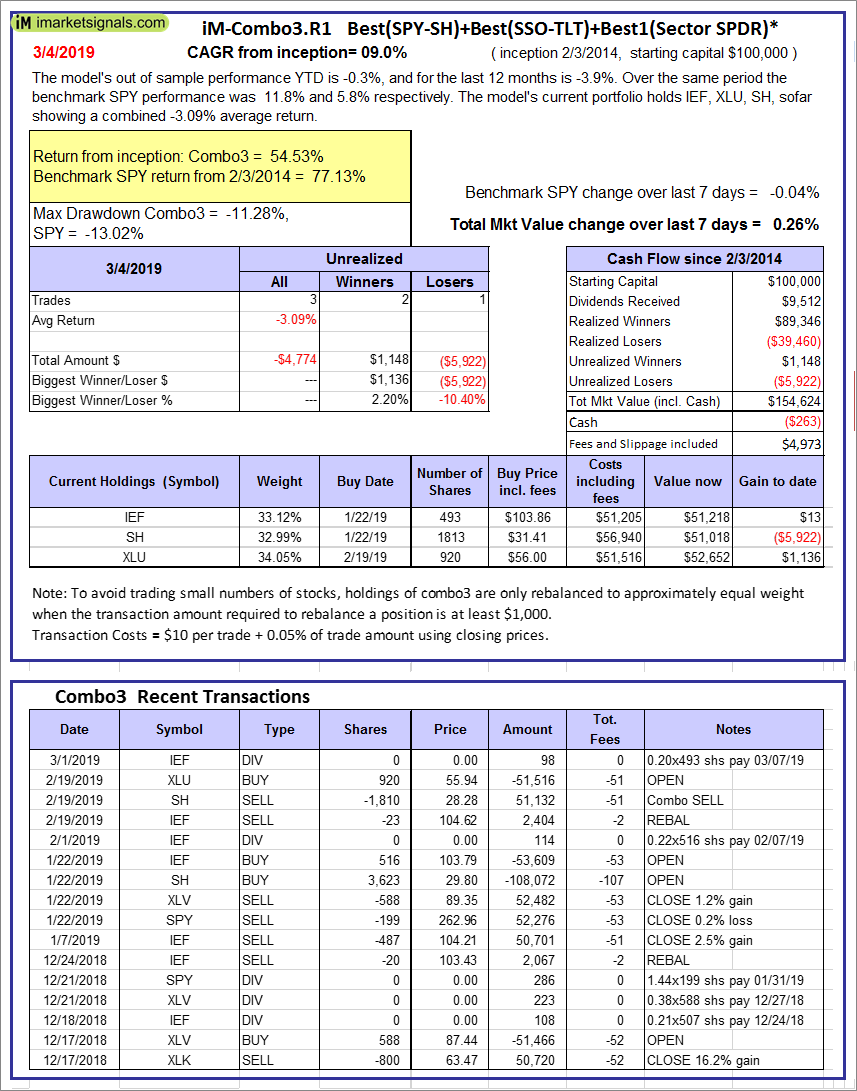 |
iM-Combo3.R1: The model’s out of sample performance YTD is -0.3%, and for the last 12 months is -3.9%. Over the same period the benchmark SPY performance was 11.8% and 5.8% respectively. Over the previous week the market value of iM-Combo3.R1 gained 0.26% at a time when SPY gained -0.04%. A starting capital of $100,000 at inception on 2/3/2014 would have grown to $154,624 which includes -$263 cash and excludes $4,973 spent on fees and slippage. |
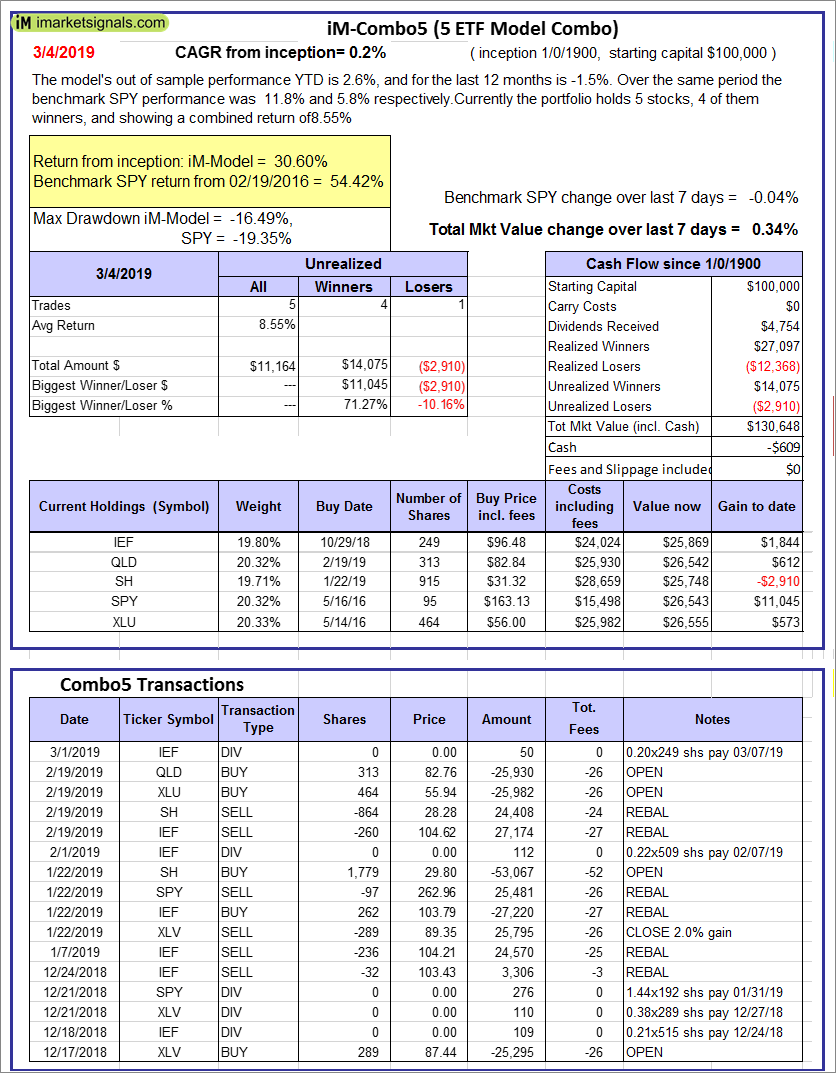 |
iM-Combo5: The model’s out of sample performance YTD is 2.6%, and for the last 12 months is -1.5%. Over the same period the benchmark SPY performance was 11.8% and 5.8% respectively. Over the previous week the market value of iM-Combo5 gained 0.34% at a time when SPY gained -0.04%. A starting capital of $100,000 at inception on 2/22/2016 would have grown to $130,648 which includes -$609 cash and excludes $0 spent on fees and slippage. |
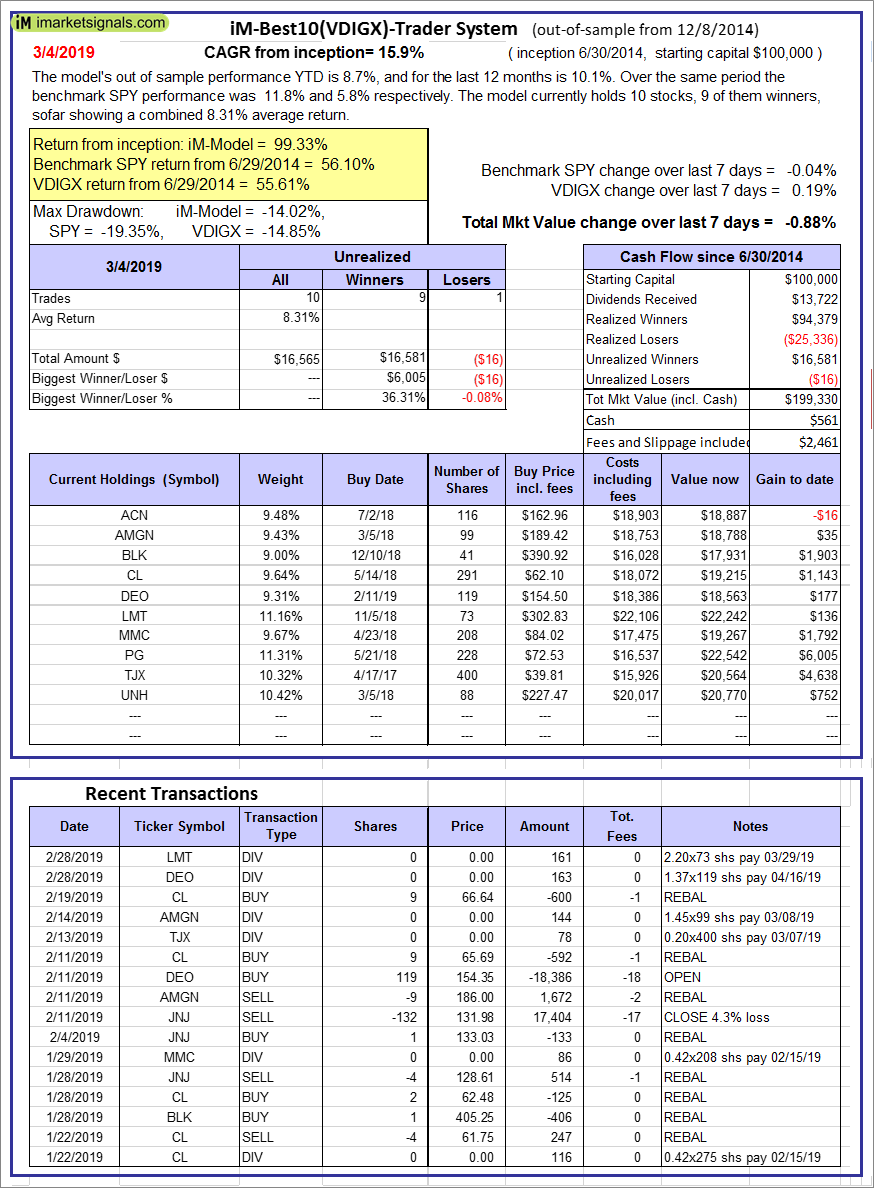  |
iM-Best10(VDIGX)-Trader: The model’s out of sample performance YTD is 8.7%, and for the last 12 months is 10.1%. Over the same period the benchmark SPY performance was 11.8% and 5.8% respectively. Since inception, on 7/1/2014, the model gained 99.33% while the benchmark SPY gained 56.10% and VDIGX gained 55.61% over the same period. Over the previous week the market value of iM-Best10(VDIGX) gained -0.88% at a time when SPY gained -0.04%. A starting capital of $100,000 at inception on 7/1/2014 would have grown to $199,330 which includes $561 cash and excludes $2,461 spent on fees and slippage. |
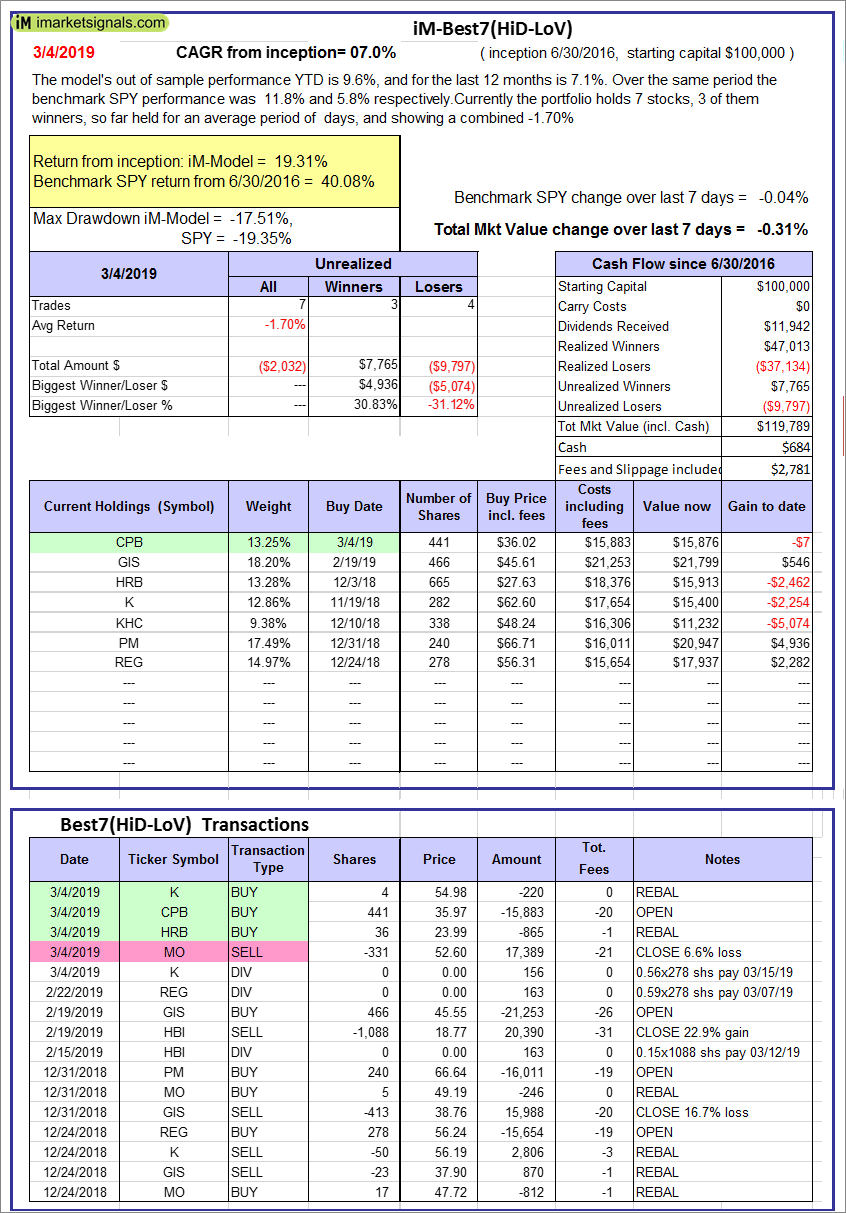 |
iM-Best7(HiD-LoV): The model’s out of sample performance YTD is 9.6%, and for the last 12 months is 7.1%. Over the same period the benchmark SPY performance was 11.8% and 5.8% respectively. Over the previous week the market value of iM-BESTOGA-3 gained -0.31% at a time when SPY gained -0.04%. A starting capital of $100,000 at inception on 6/30/2016 would have grown to $119,789 which includes $684 cash and excludes $2,781 spent on fees and slippage. |
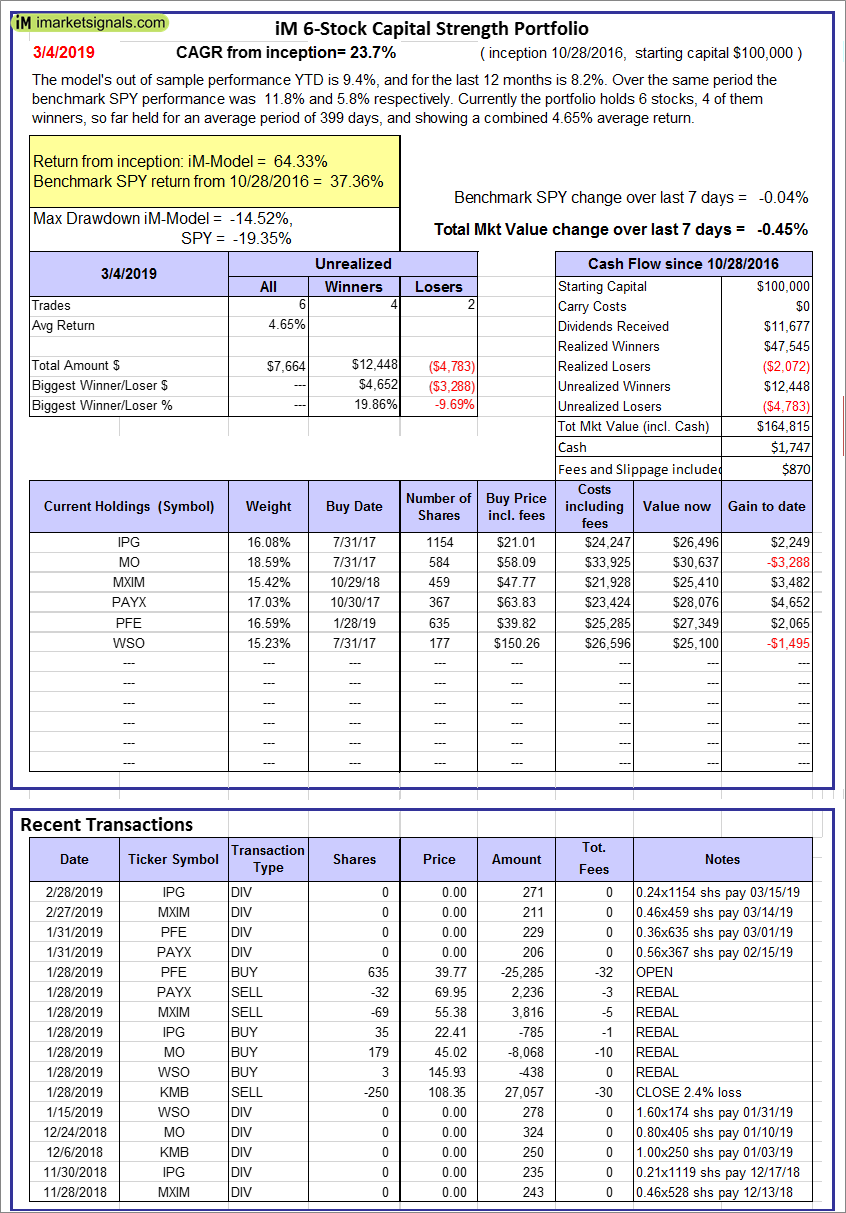 |
iM 6-Stock Capital Strength Portfolio: The model’s out of sample performance YTD is 9.4%, and for the last 12 months is 8.2%. Over the same period the benchmark SPY performance was 11.8% and 5.8% respectively. Over the previous week the market value of the iM 6-Stock Capital Strength Portfolio gained -0.45% at a time when SPY gained -0.04%. A starting capital of $100,000 at inception on 10/28/2016 would have grown to $164,815 which includes $1,747 cash and excludes $870 spent on fees and slippage. |
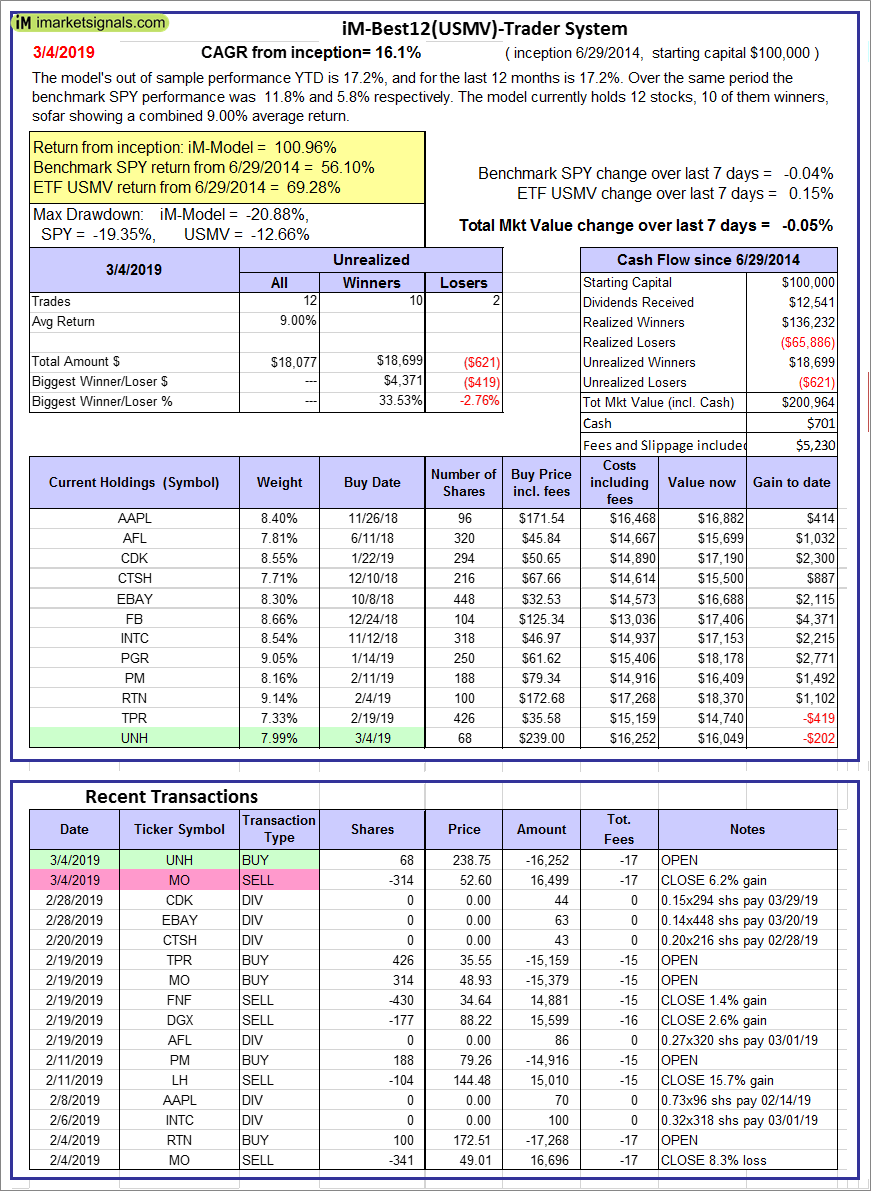 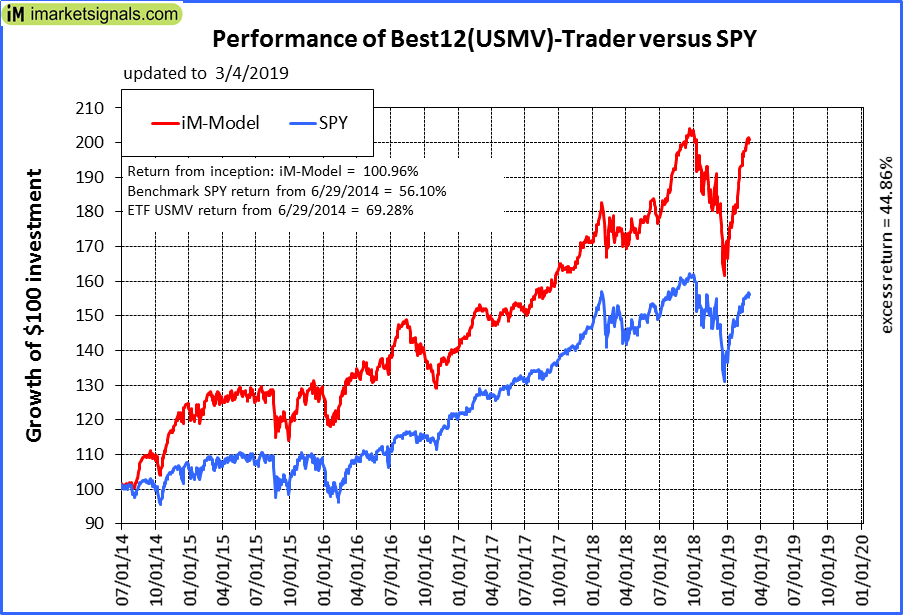 |
iM-Best12(USMV)-Trader: The model’s out of sample performance YTD is 17.2%, and for the last 12 months is 17.2%. Over the same period the benchmark SPY performance was 11.8% and 5.8% respectively. Since inception, on 6/30/2014, the model gained 100.96% while the benchmark SPY gained 56.10% and the ETF USMV gained 69.28% over the same period. Over the previous week the market value of iM-Best12(USMV)-Trader gained -0.05% at a time when SPY gained -0.04%. A starting capital of $100,000 at inception on 6/30/2014 would have grown to $200,964 which includes $701 cash and excludes $5,230 spent on fees and slippage. |
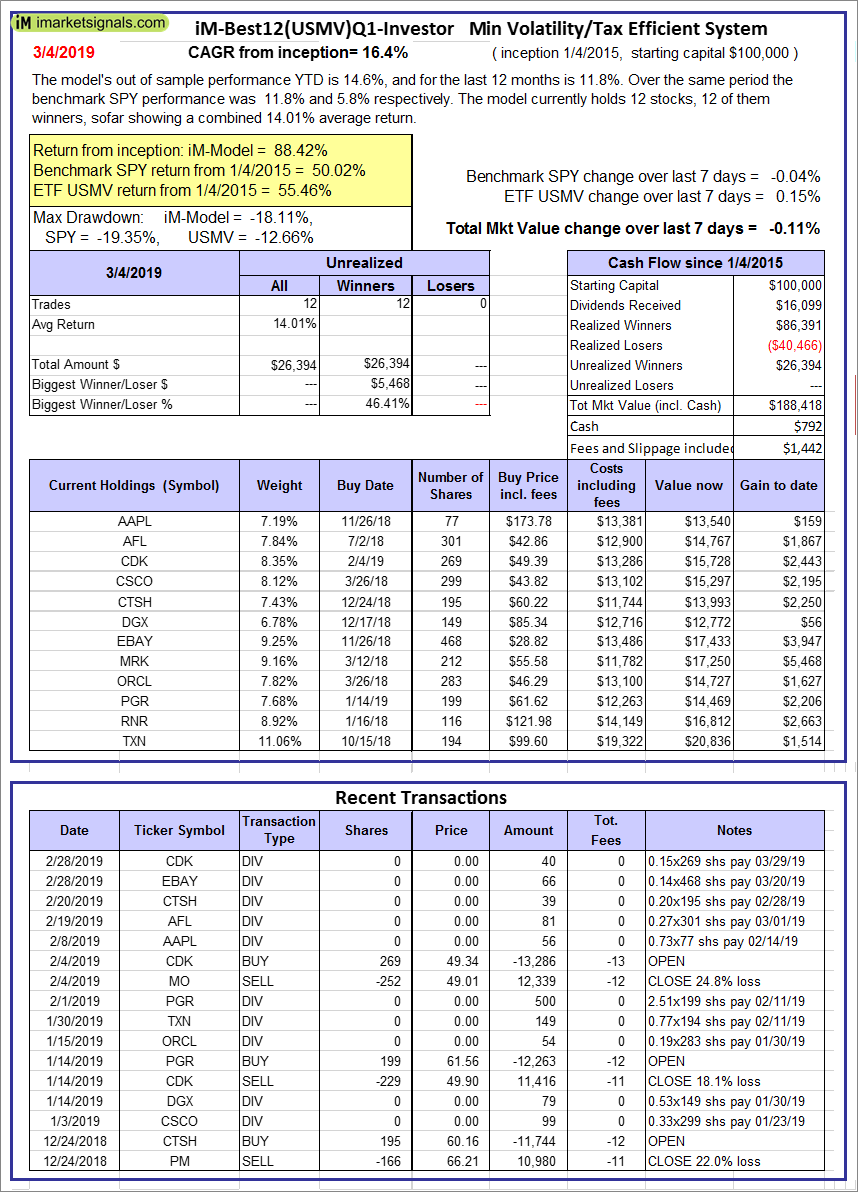  |
iM-Best12(USMV)Q1-Investor: The model’s out of sample performance YTD is 14.6%, and for the last 12 months is 11.8%. Over the same period the benchmark SPY performance was 11.8% and 5.8% respectively. Since inception, on 1/5/2015, the model gained 88.42% while the benchmark SPY gained 50.02% and the ETF USMV gained 55.46% over the same period. Over the previous week the market value of iM-Best12(USMV)Q1 gained -0.11% at a time when SPY gained -0.04%. A starting capital of $100,000 at inception on 1/5/2015 would have grown to $188,418 which includes $792 cash and excludes $1,442 spent on fees and slippage. |
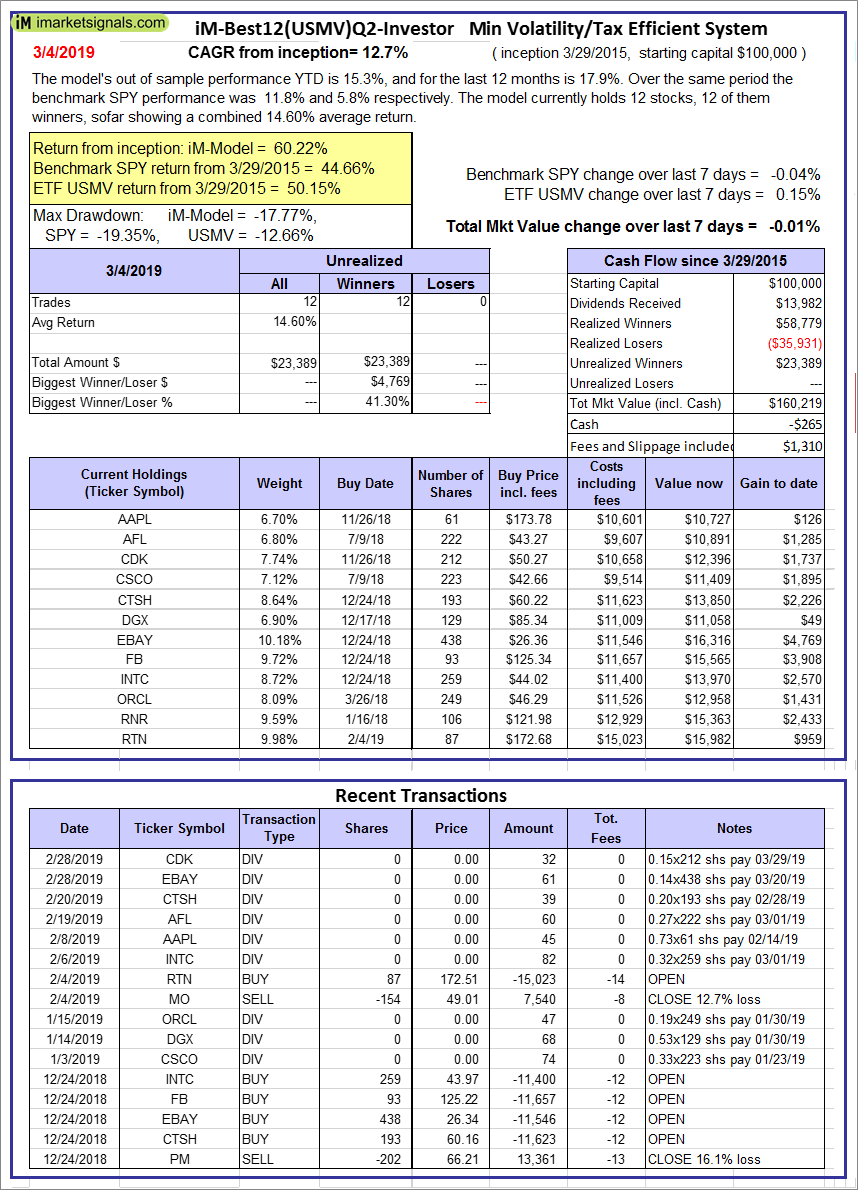 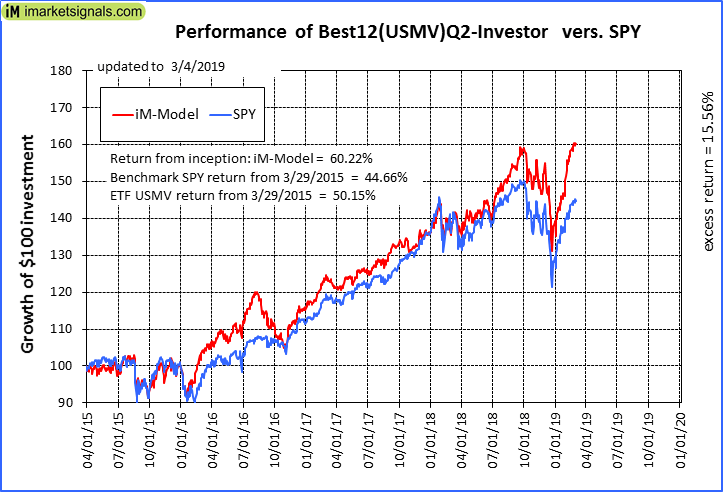 |
iM-Best12(USMV)Q2-Investor: The model’s out of sample performance YTD is 15.3%, and for the last 12 months is 17.9%. Over the same period the benchmark SPY performance was 11.8% and 5.8% respectively. Since inception, on 3/30/2015, the model gained 60.22% while the benchmark SPY gained 44.66% and the ETF USMV gained 50.15% over the same period. Over the previous week the market value of iM-Best12(USMV)Q2 gained -0.01% at a time when SPY gained -0.04%. A starting capital of $100,000 at inception on 3/30/2015 would have grown to $160,219 which includes -$265 cash and excludes $1,310 spent on fees and slippage. |
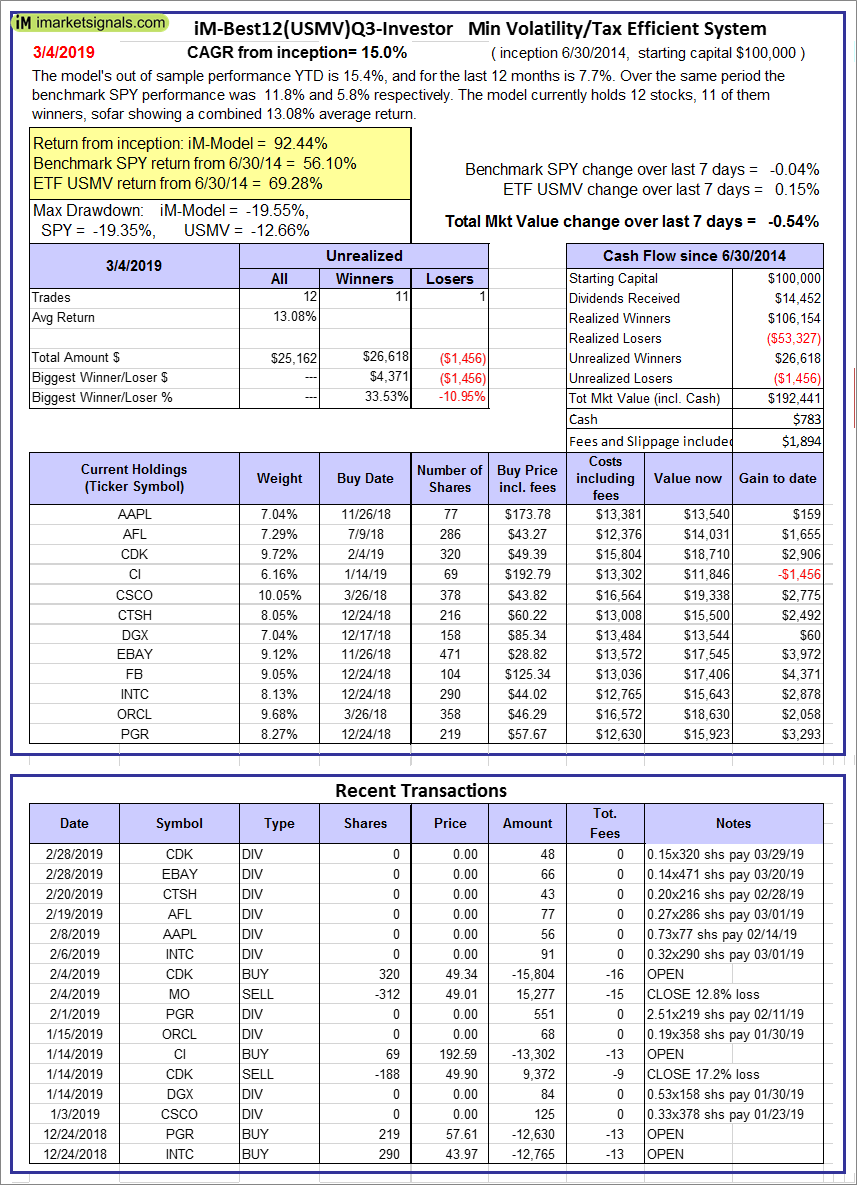 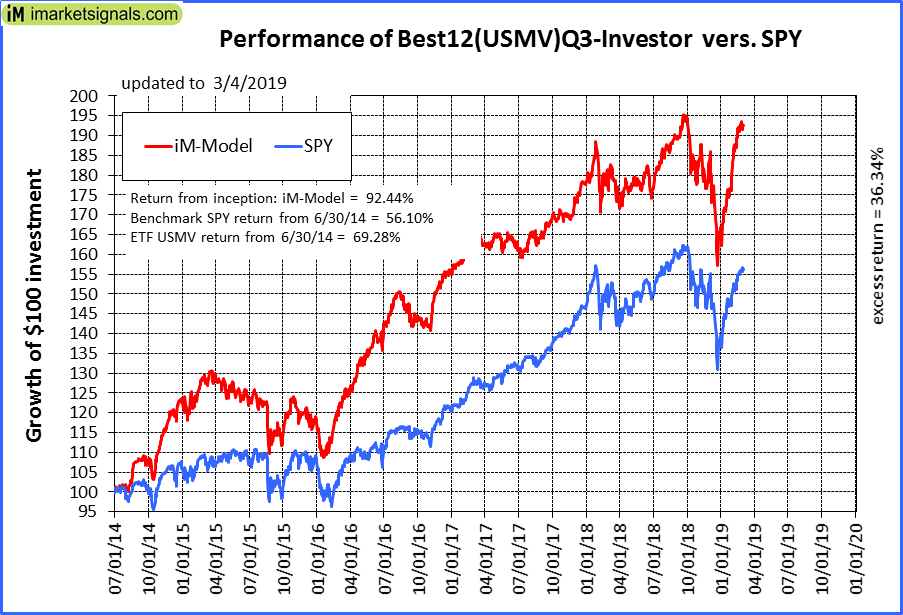 |
iM-Best12(USMV)Q3-Investor: The model’s out of sample performance YTD is 15.4%, and for the last 12 months is 7.7%. Over the same period the benchmark SPY performance was 11.8% and 5.8% respectively. Since inception, on 7/1/2014, the model gained 92.44% while the benchmark SPY gained 56.10% and the ETF USMV gained 69.28% over the same period. Over the previous week the market value of iM-Best12(USMV)Q3 gained -0.54% at a time when SPY gained -0.04%. A starting capital of $100,000 at inception on 7/1/2014 would have grown to $192,441 which includes $783 cash and excludes $1,894 spent on fees and slippage. |
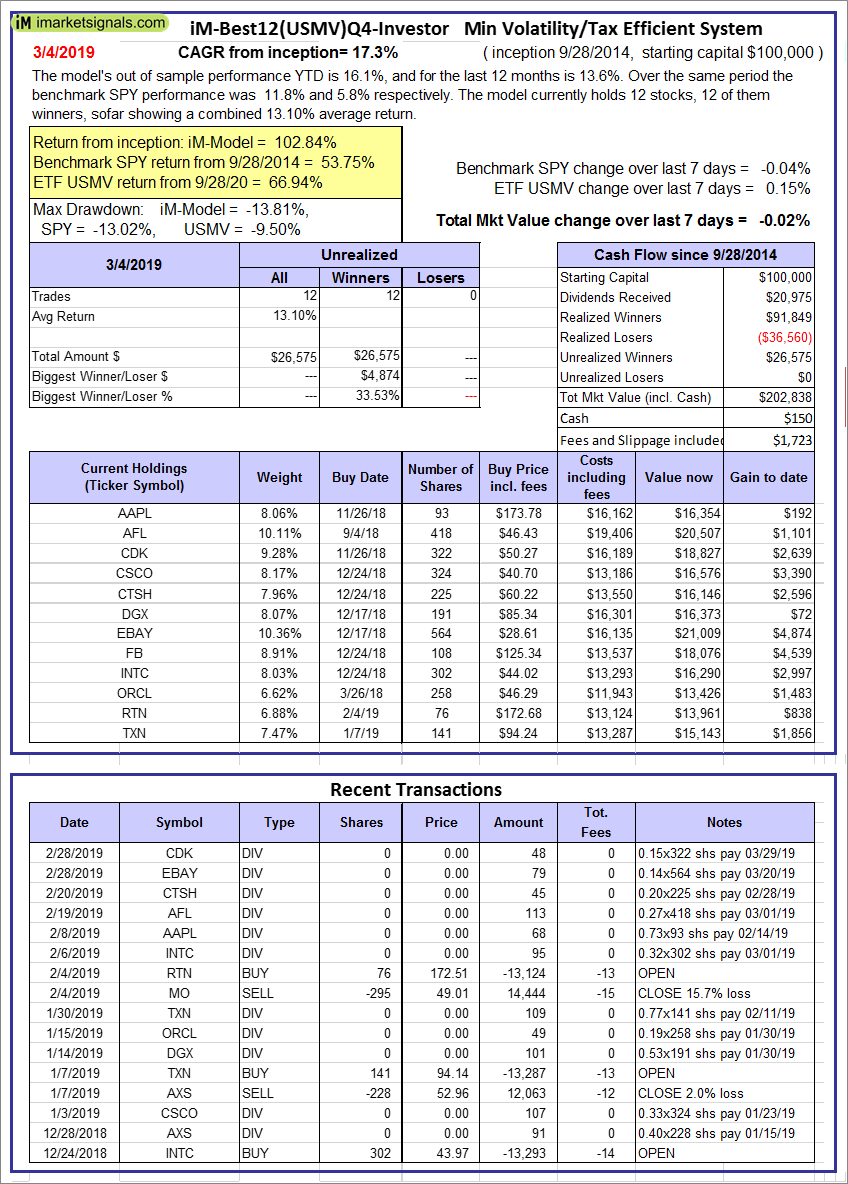 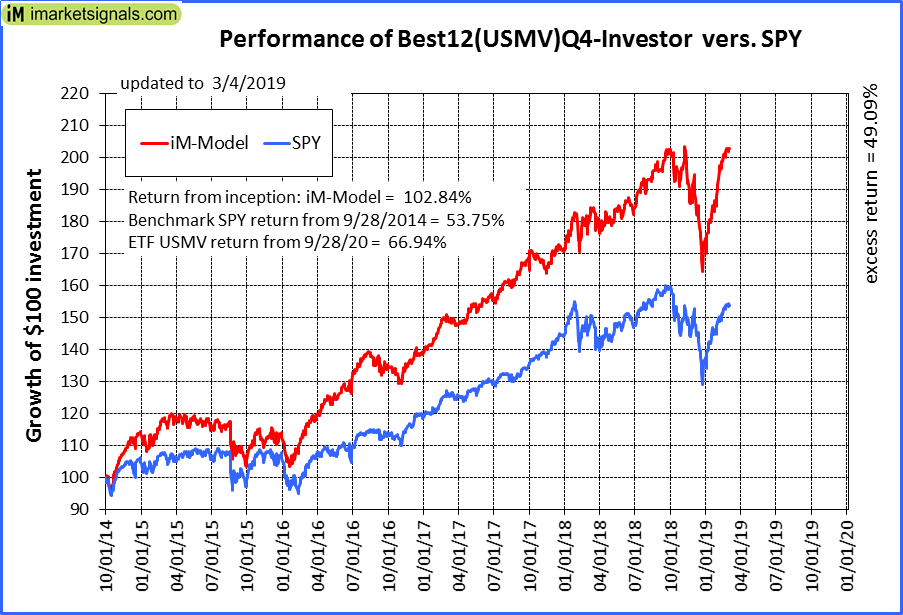 |
iM-Best12(USMV)Q4-Investor: Since inception, on 9/29/2014, the model gained 102.84% while the benchmark SPY gained 53.75% and the ETF USMV gained 66.94% over the same period. Over the previous week the market value of iM-Best12(USMV)Q4 gained -0.02% at a time when SPY gained -0.04%. A starting capital of $100,000 at inception on 9/29/2014 would have grown to $202,838 which includes $150 cash and excludes $1,723 spent on fees and slippage. |
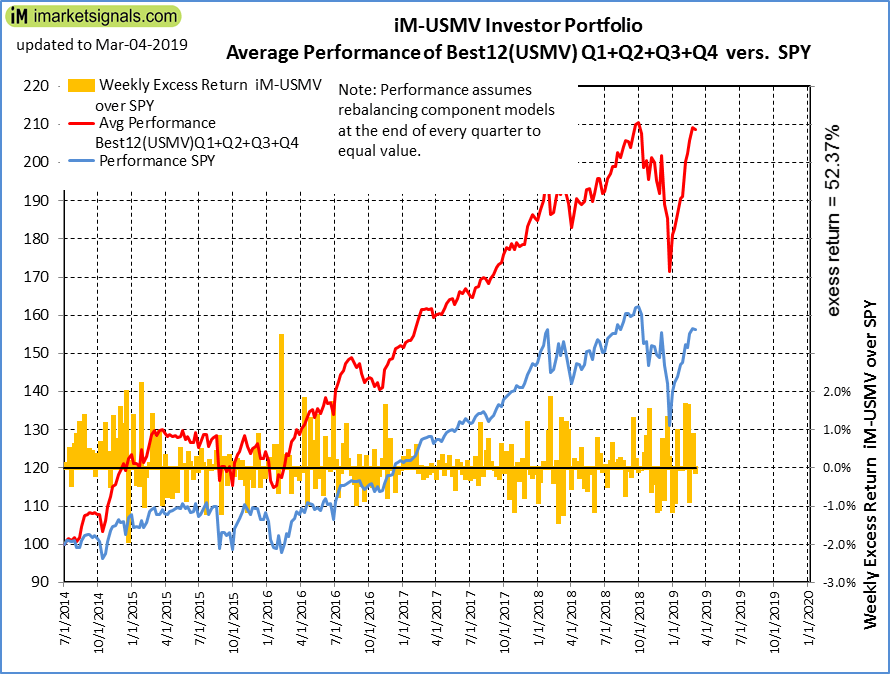 |
Average Performance of iM-Best12(USMV)Q1+Q2+Q3+Q4-Investor resulted in an excess return of 50.47% over SPY. (see iM-USMV Investor Portfolio) |
 |
iM-Best(Short): The model’s out of sample performance YTD is -13.0%, and for the last 12 months is -18.3%. Over the same period the benchmark SPY performance was 11.8% and 5.8% respectively. Over the previous week the market value of iM-Best(Short) gained -4.37% at a time when SPY gained -0.04%. Over the period 1/2/2009 to 3/4/2019 the starting capital of $100,000 would have grown to $77,406 which includes $107,358 cash and excludes $25,448 spent on fees and slippage. |
 |
iM-Best2 MC-Score ETF System: The model’s out of sample performance YTD is 4.1%, and for the last 12 months is 1.8%. Over the same period the benchmark SPY performance was 11.8% and 5.8% respectively. Over the previous week the market value of the iM-Best2 MC-Score ETF System gained -1.60% at a time when SPY gained -0.04%. A starting capital of $100,000 at inception on 6/30/2016 would have grown to $110,392 which includes $540 cash and excludes $447 spent on fees and slippage. |
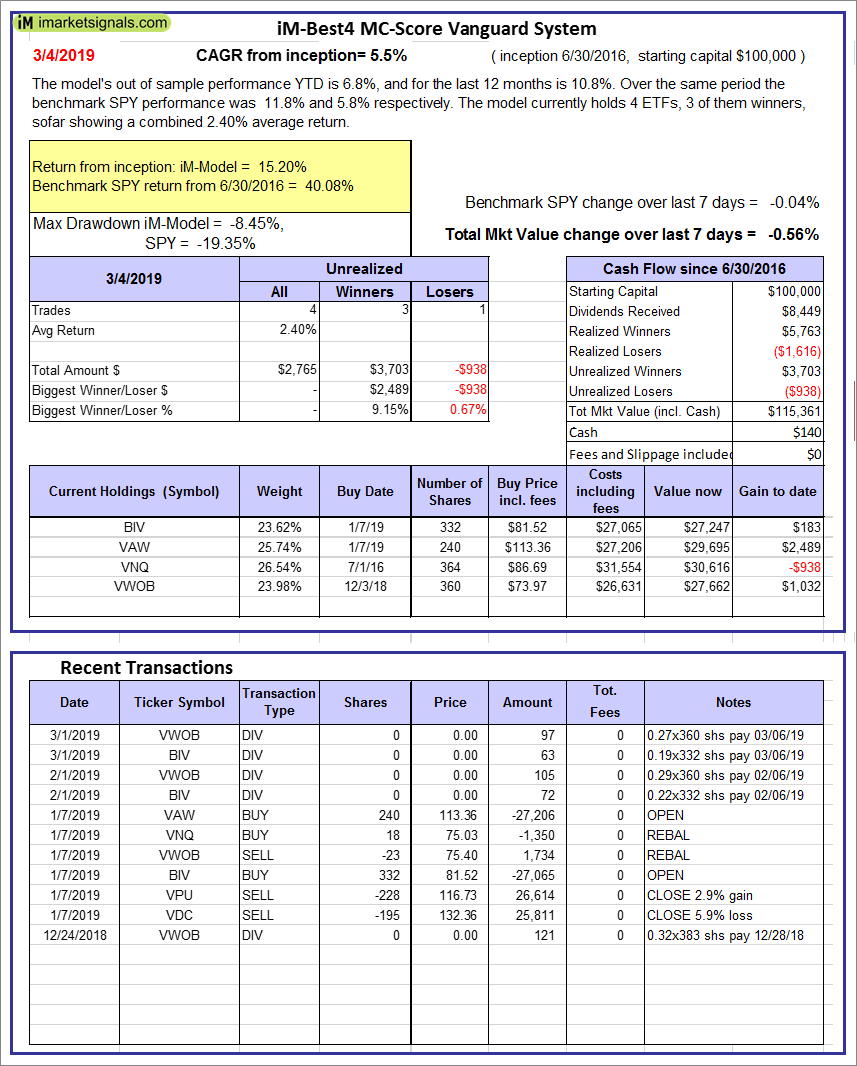 |
iM-Best4 MC-Score Vanguard System: The model’s out of sample performance YTD is 6.8%, and for the last 12 months is 10.8%. Over the same period the benchmark SPY performance was 11.8% and 5.8% respectively. Over the previous week the market value of the iM-Best4 MC-Score Vanguard System gained -0.56% at a time when SPY gained -0.04%. A starting capital of $100,000 at inception on 6/30/2016 would have grown to $115,361 which includes $140 cash and excludes $00 spent on fees and slippage. |
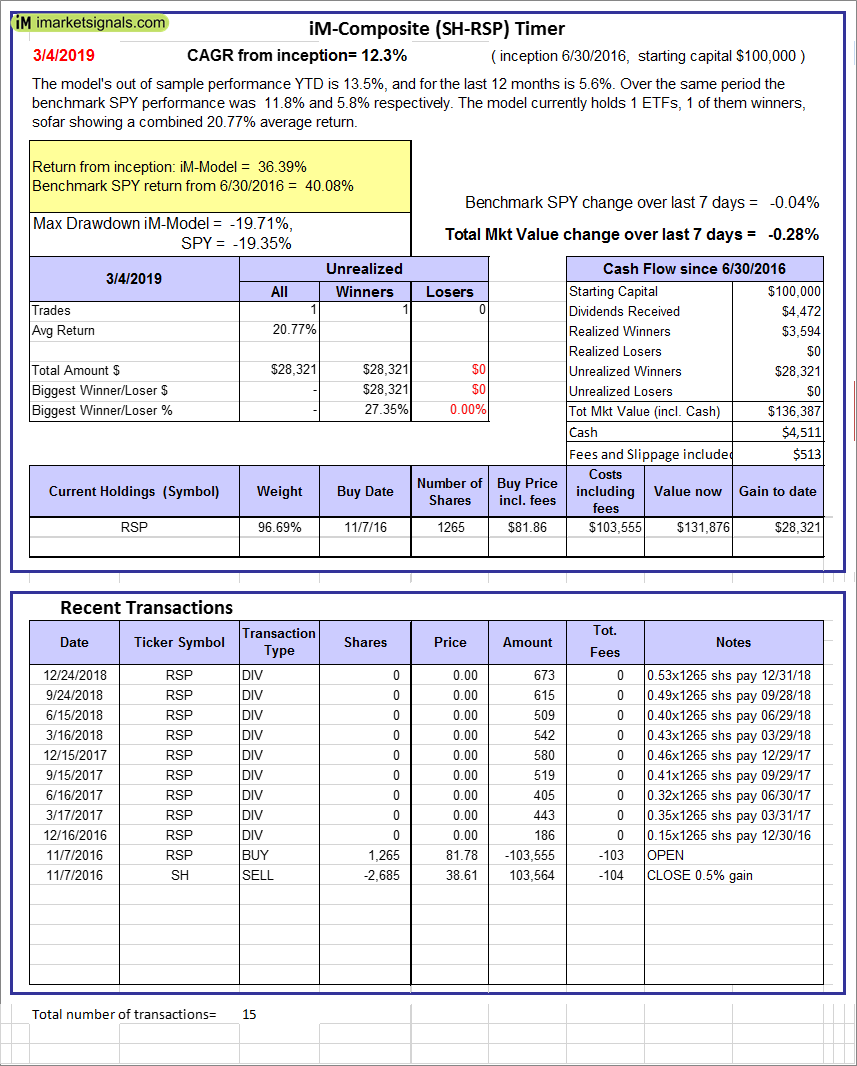 |
iM-Composite (SH-RSP) Timer: The model’s out of sample performance YTD is 13.5%, and for the last 12 months is 5.6%. Over the same period the benchmark SPY performance was 11.8% and 5.8% respectively. Over the previous week the market value of the iM-Composite (SH-RSP) Timer gained -0.28% at a time when SPY gained -0.04%. A starting capital of $100,000 at inception on 6/30/2016 would have grown to $136,387 which includes $4,511 cash and excludes $513 spent on fees and slippage. |
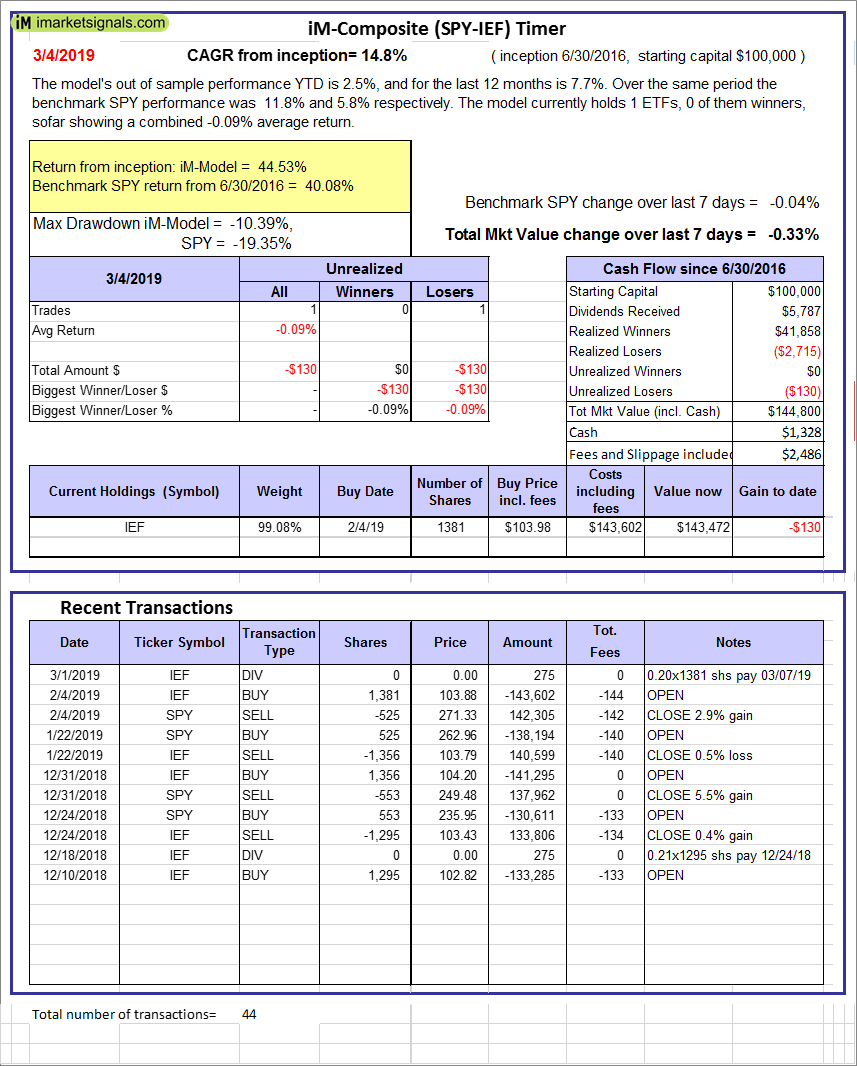 |
iM-Composite (SPY-IEF) Timer: The model’s out of sample performance YTD is 2.5%, and for the last 12 months is 7.7%. Over the same period the benchmark SPY performance was 11.8% and 5.8% respectively. Over the previous week the market value of the iM-Composite (SPY-IEF) Timer gained -0.33% at a time when SPY gained -0.04%. A starting capital of $100,000 at inception on 6/30/2016 would have grown to $144,800 which includes $1,328 cash and excludes $2,486 spent on fees and slippage. |
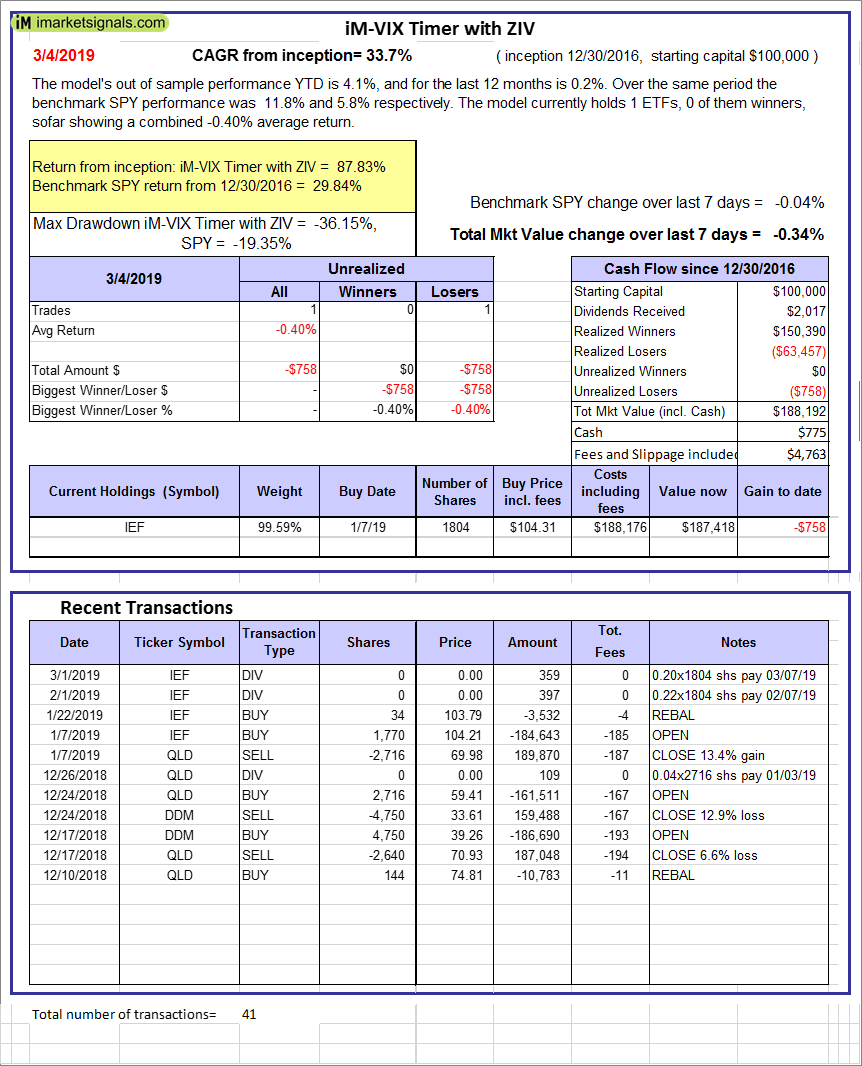 |
iM-VIX Timer with ZIV: The model’s out of sample performance YTD is 4.1%, and for the last 12 months is 0.2%. Over the same period the benchmark SPY performance was 11.8% and 5.8% respectively. Over the previous week the market value of the iM-VIX Timer with ZIV gained -0.34% at a time when SPY gained -0.04%. A starting capital of $100,000 at inception on 6/30/2016 would have grown to $188,192 which includes $775 cash and excludes $4,763 spent on fees and slippage. |
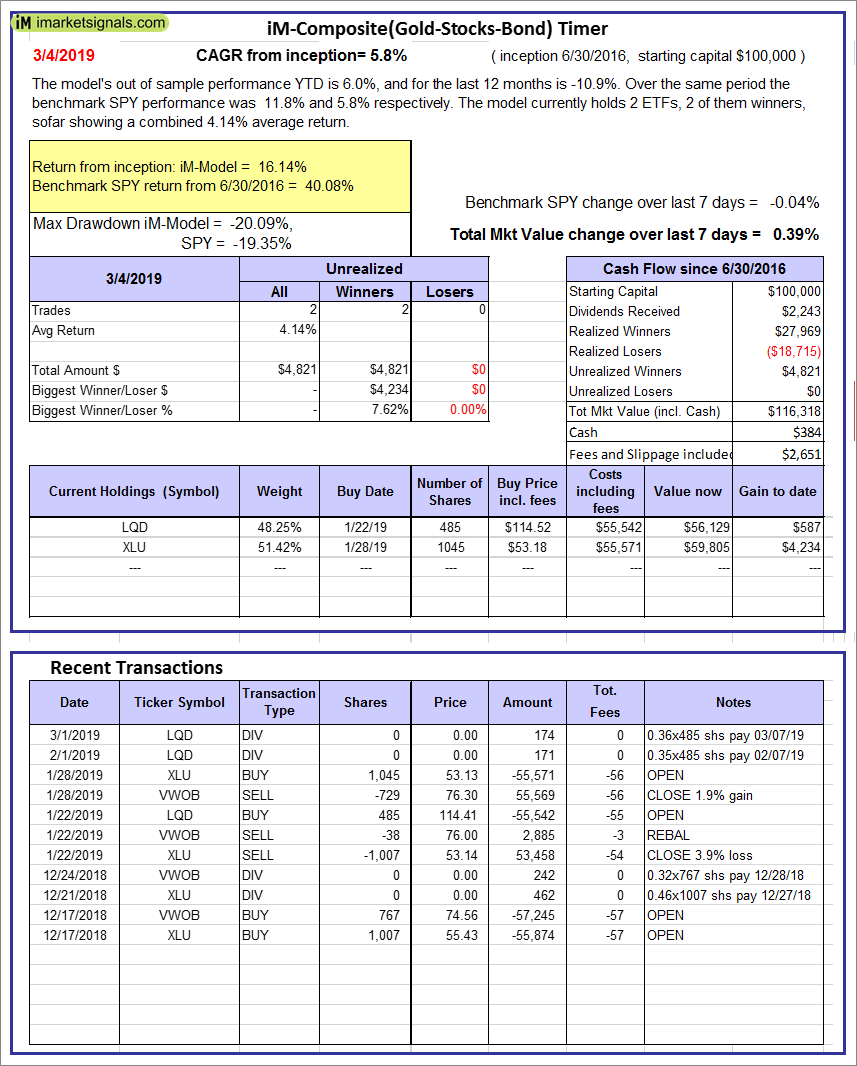 |
iM-Composite(Gold-Stocks-Bond) Timer: The model’s out of sample performance YTD is 6.0%, and for the last 12 months is -10.9%. Over the same period the benchmark SPY performance was 11.8% and 5.8% respectively. Over the previous week the market value of the iM-Composite(Gold-Stocks-Bond) Timer gained 0.39% at a time when SPY gained -0.04%. A starting capital of $100,000 at inception on 6/30/2016 would have grown to $116,318 which includes $384 cash and excludes $2,651 spent on fees and slippage. |
 |
iM-Low Turnover Composite Timer Combo: The model’s out of sample performance YTD is 4.9%, and for the last 12 months is -5.2%. Over the same period the benchmark SPY performance was 11.8% and 5.8% respectively. Over the previous week the market value of the iM-Low Turnover Composite Timer Combo gained -0.22% at a time when SPY gained -0.04%. A starting capital of $100,000 at inception on 3/24/27 would have grown to $101,026 which includes $1,141 cash and excludes $472 spent on fees and slippage. |
 |
iM-Min Drawdown Combo: The model’s out of sample performance YTD is 7.1%, and for the last 12 months is 1.9%. Over the same period the benchmark SPY performance was 11.8% and 5.8% respectively. Over the previous week the market value of the iM-Min Drawdown Combo gained -0.28% at a time when SPY gained -0.04%. A starting capital of $100,000 at inception on 4/5/2017 would have grown to $109,253 which includes $2,727 cash and excludes $814 spent on fees and slippage. |
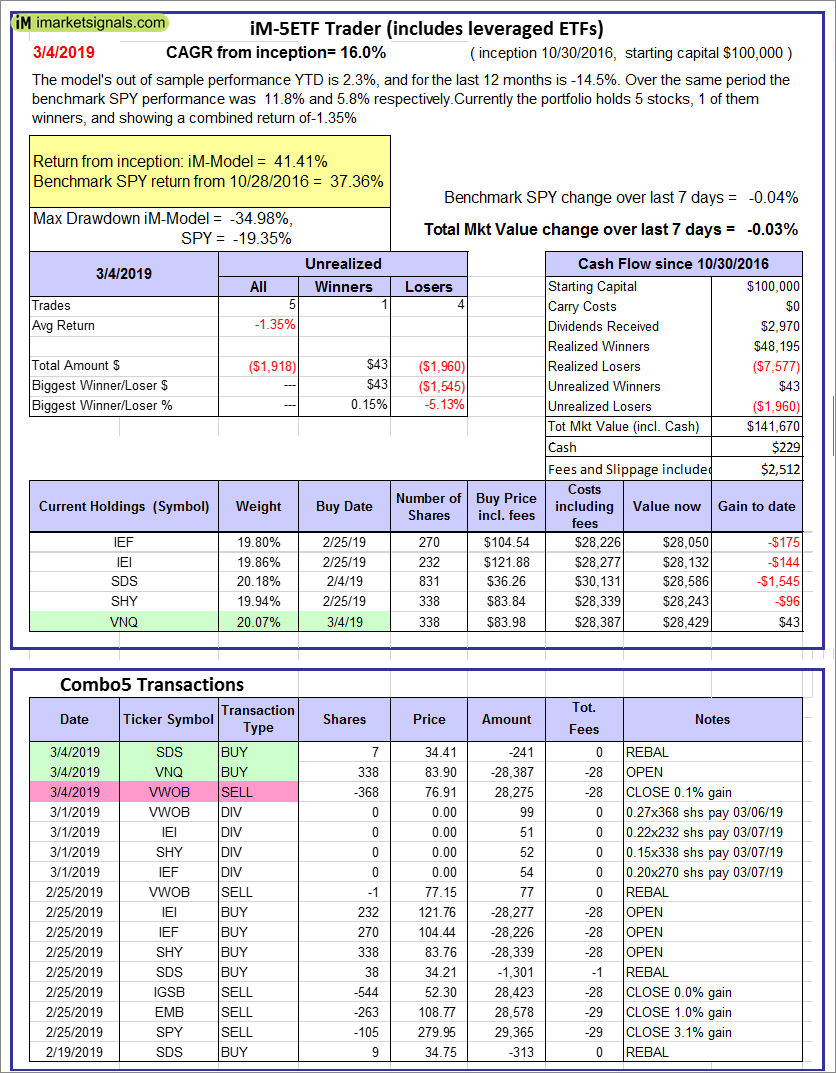 |
iM-5ETF Trader (includes leveraged ETFs): The model’s out of sample performance YTD is 2.3%, and for the last 12 months is -14.5%. Over the same period the benchmark SPY performance was 11.8% and 5.8% respectively. Over the previous week the market value of the iM-5ETF Trader (includes leveraged ETFs) gained -0.03% at a time when SPY gained -0.04%. A starting capital of $100,000 at inception on 10/30/2016 would have grown to $141,670 which includes $229 cash and excludes $2,512 spent on fees and slippage. |
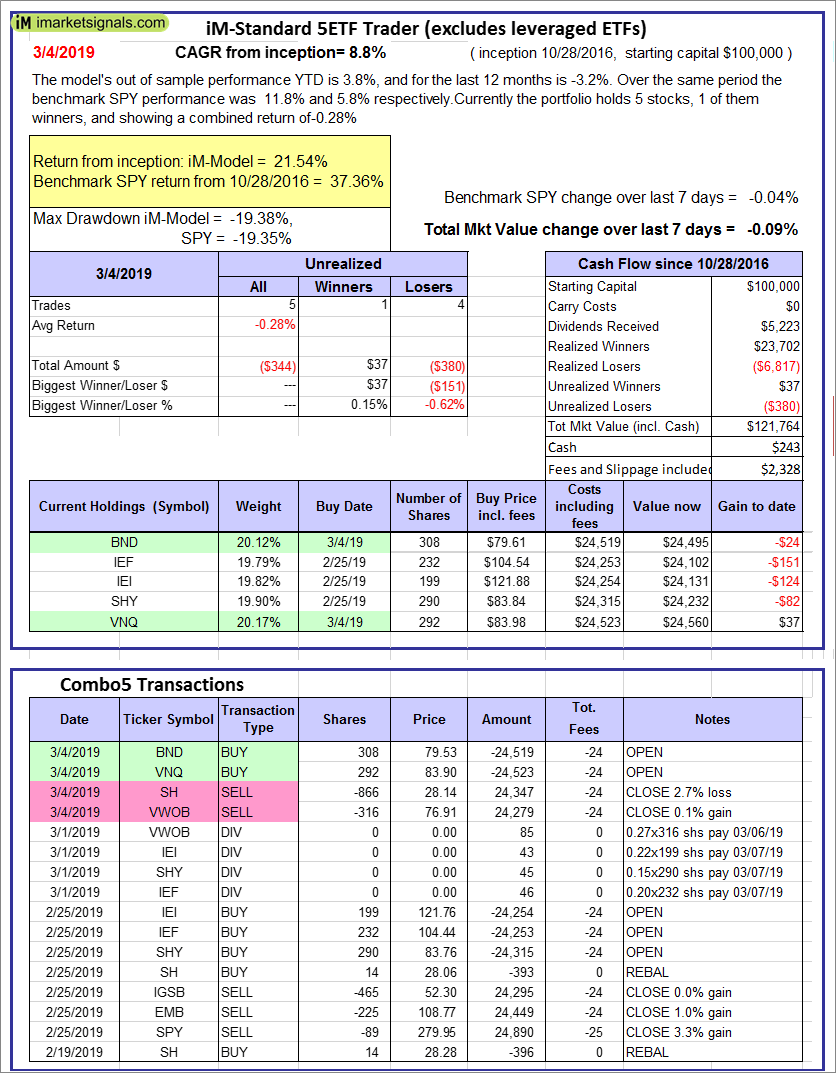 |
iM-Standard 5ETF Trader (excludes leveraged ETFs): The model’s out of sample performance YTD is 3.8%, and for the last 12 months is -3.2%. Over the same period the benchmark SPY performance was 11.8% and 5.8% respectively. Over the previous week the market value of the iM-Standard 5ETF Trader (excludes leveraged ETFs) gained -0.09% at a time when SPY gained -0.04%. A starting capital of $100,000 at inception on 10/30/2016 would have grown to $121,764 which includes $243 cash and excludes $2,328 spent on fees and slippage. |
iM-Best Reports – 3/4/2019
Posted in pmp SPY-SH
Leave a Reply
You must be logged in to post a comment.