
  |
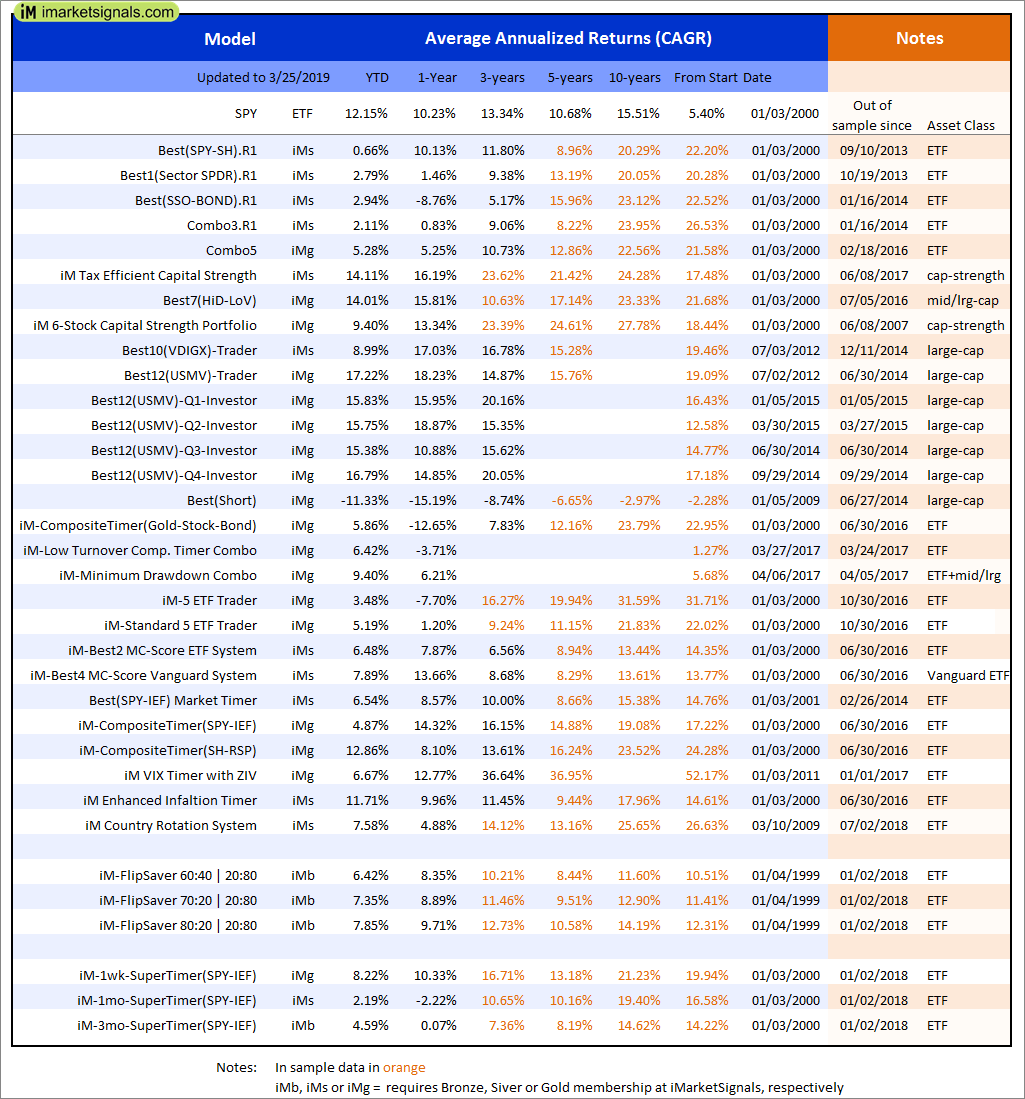
Out of sample performance summary of our models for the past 1, 2, 4 and 13 week periods. The active active return indicates how the models over- or underperformed the benchmark ETF SPY. Also the YTD, and the 1-, 3-, 5- and 10-year annualized returns are shown in the second table |
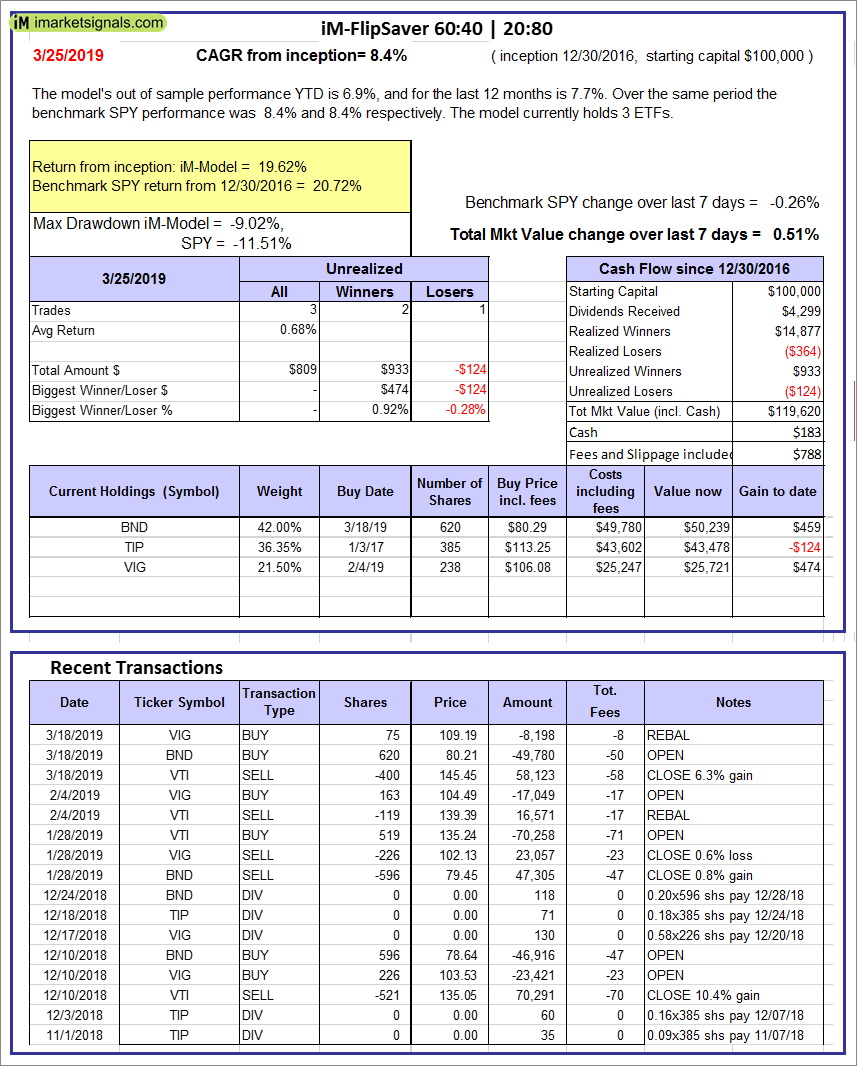 |
iM-FlipSaver 60:40 | 20:80 – 2017: The model’s out of sample performance YTD is 6.9%, and for the last 12 months is 7.7%. Over the same period the benchmark SPY performance was 8.4% and 8.4% respectively. Over the previous week the market value of iM-FlipSaver 80:20 | 20:80 gained 0.51% at a time when SPY gained -0.26%. A starting capital of $100,000 at inception on 7/16/2015 would have grown to $119,620 which includes $183 cash and excludes $788 spent on fees and slippage. |
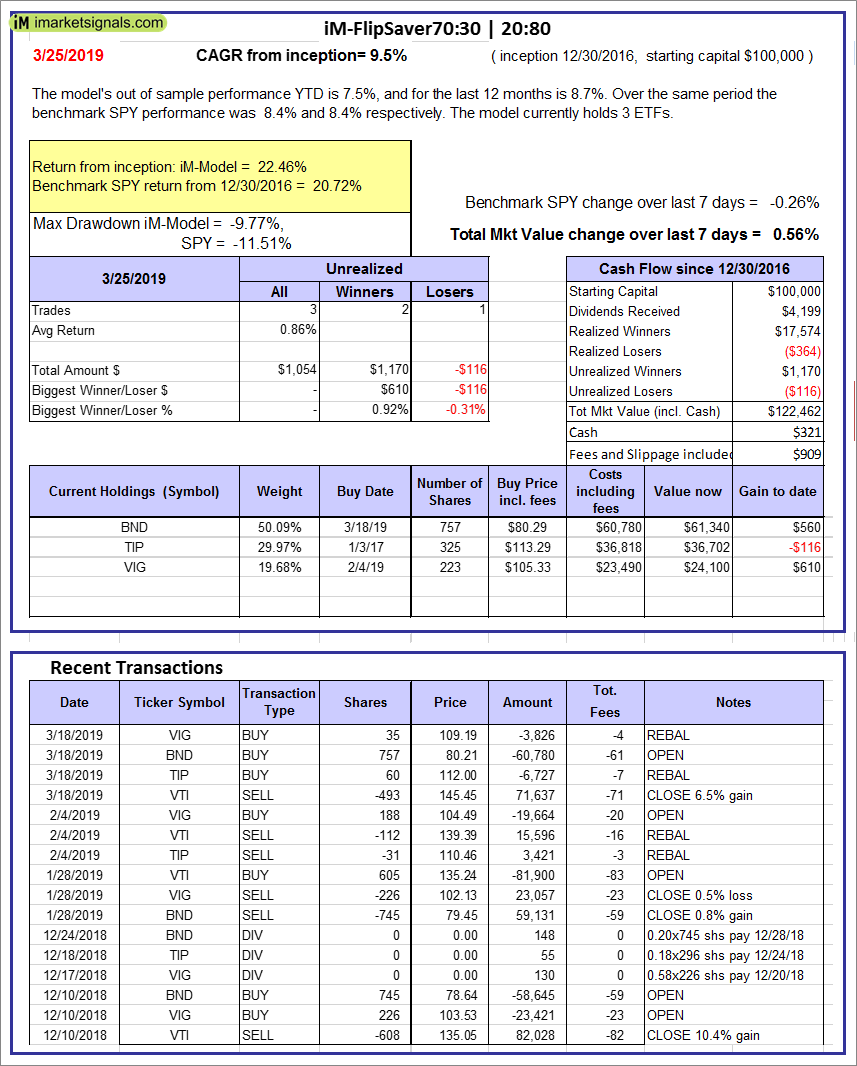 |
iM-FlipSaver 70:30 | 20:80 – 2017: The model’s out of sample performance YTD is 7.5%, and for the last 12 months is 8.7%. Over the same period the benchmark SPY performance was 8.4% and 8.4% respectively. Over the previous week the market value of iM-FlipSaver 70:30 | 20:80 gained 0.56% at a time when SPY gained -0.26%. A starting capital of $100,000 at inception on 7/15/2015 would have grown to $122,462 which includes $321 cash and excludes $909 spent on fees and slippage. |
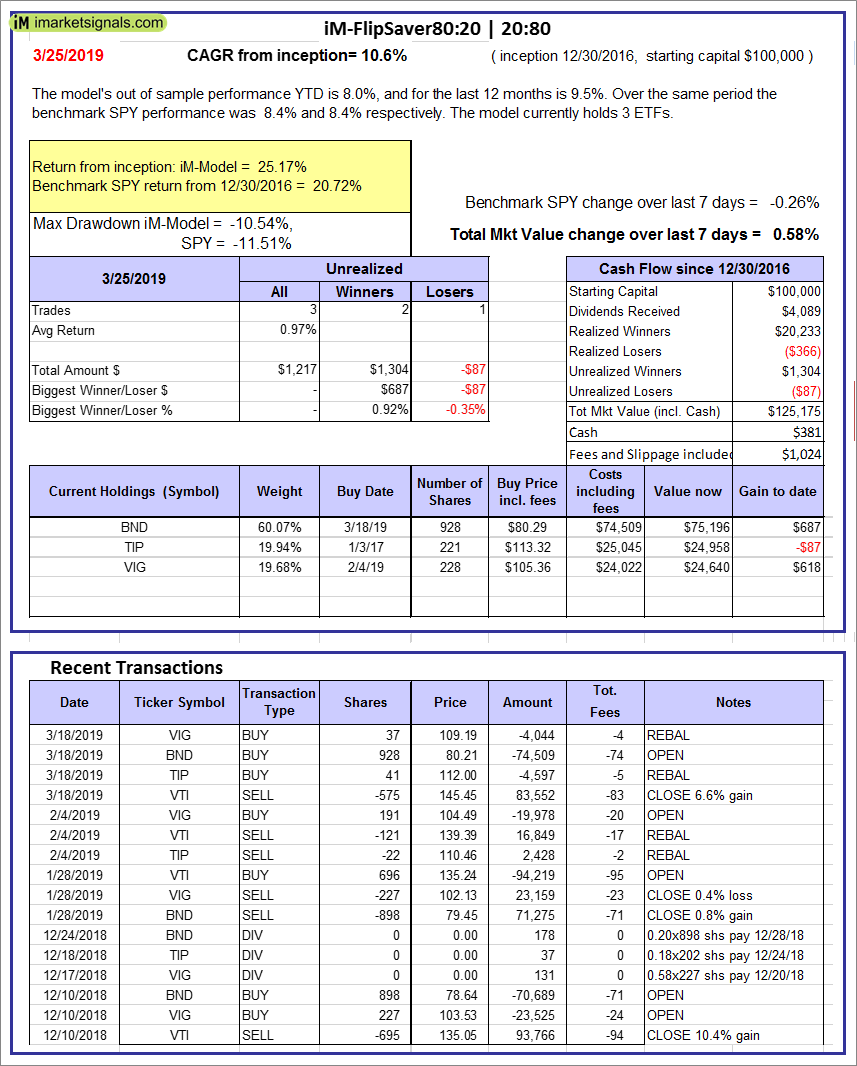 |
iM-FlipSaver 80:20 | 20:80 – 2017: The model’s out of sample performance YTD is 8.0%, and for the last 12 months is 9.5%. Over the same period the benchmark SPY performance was 8.4% and 8.4% respectively. Over the previous week the market value of iM-FlipSaver 80:20 | 20:80 gained 0.58% at a time when SPY gained -0.26%. A starting capital of $100,000 at inception on 1/2/2017 would have grown to $125,175 which includes $381 cash and excludes $1,024 spent on fees and slippage. |
 |
iM-Best(SPY-SH).R1: The model’s out of sample performance YTD is 0.5%, and for the last 12 months is 10.2%. Over the same period the benchmark SPY performance was 12.1% and 10.2% respectively. Over the previous week the market value of Best(SPY-SH) gained -1.19% at a time when SPY gained -1.17%. A starting capital of $100,000 at inception on 1/2/2009 would have grown to $604,607 which includes -$11,234 cash and excludes $22,629 spent on fees and slippage. |
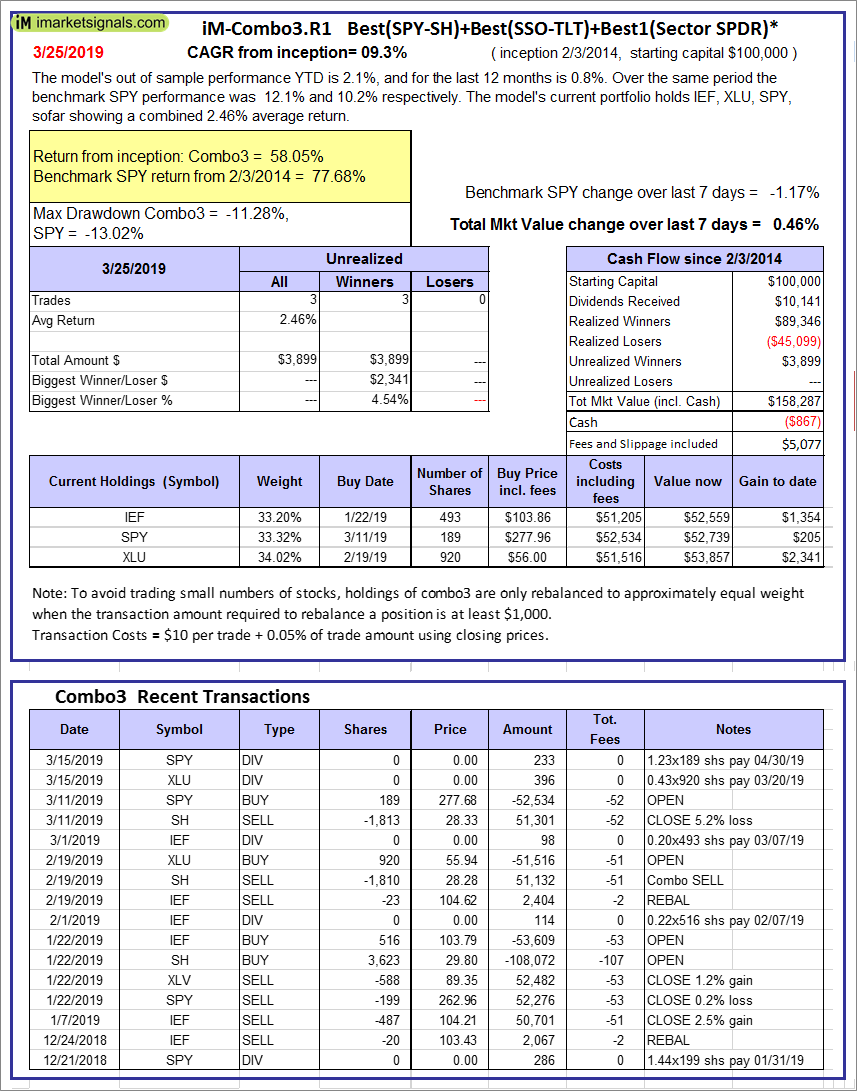 |
iM-Combo3.R1: The model’s out of sample performance YTD is 2.1%, and for the last 12 months is 0.8%. Over the same period the benchmark SPY performance was 12.1% and 10.2% respectively. Over the previous week the market value of iM-Combo3.R1 gained 0.46% at a time when SPY gained -1.17%. A starting capital of $100,000 at inception on 2/3/2014 would have grown to $158,287 which includes -$867 cash and excludes $5,077 spent on fees and slippage. |
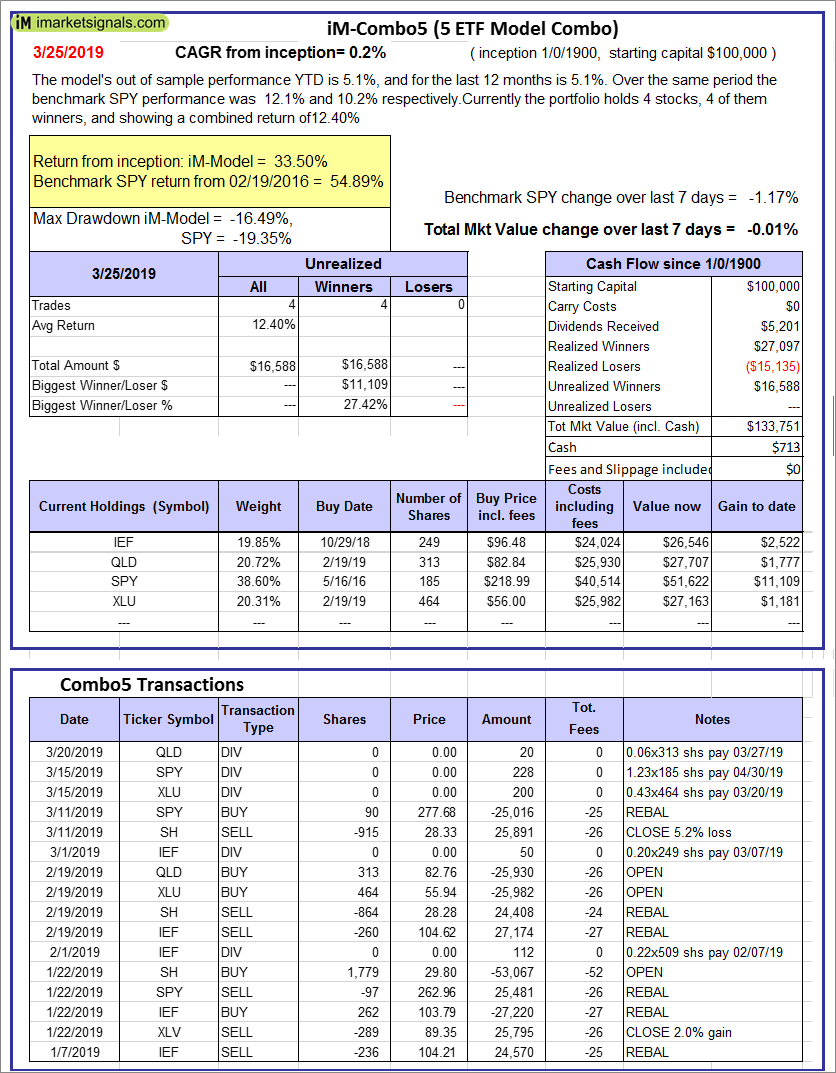 |
iM-Combo5: The model’s out of sample performance YTD is 5.1%, and for the last 12 months is 5.1%. Over the same period the benchmark SPY performance was 12.1% and 10.2% respectively. Over the previous week the market value of iM-Combo5 gained -0.01% at a time when SPY gained -1.17%. A starting capital of $100,000 at inception on 2/22/2016 would have grown to $133,751 which includes $713 cash and excludes $0 spent on fees and slippage. |
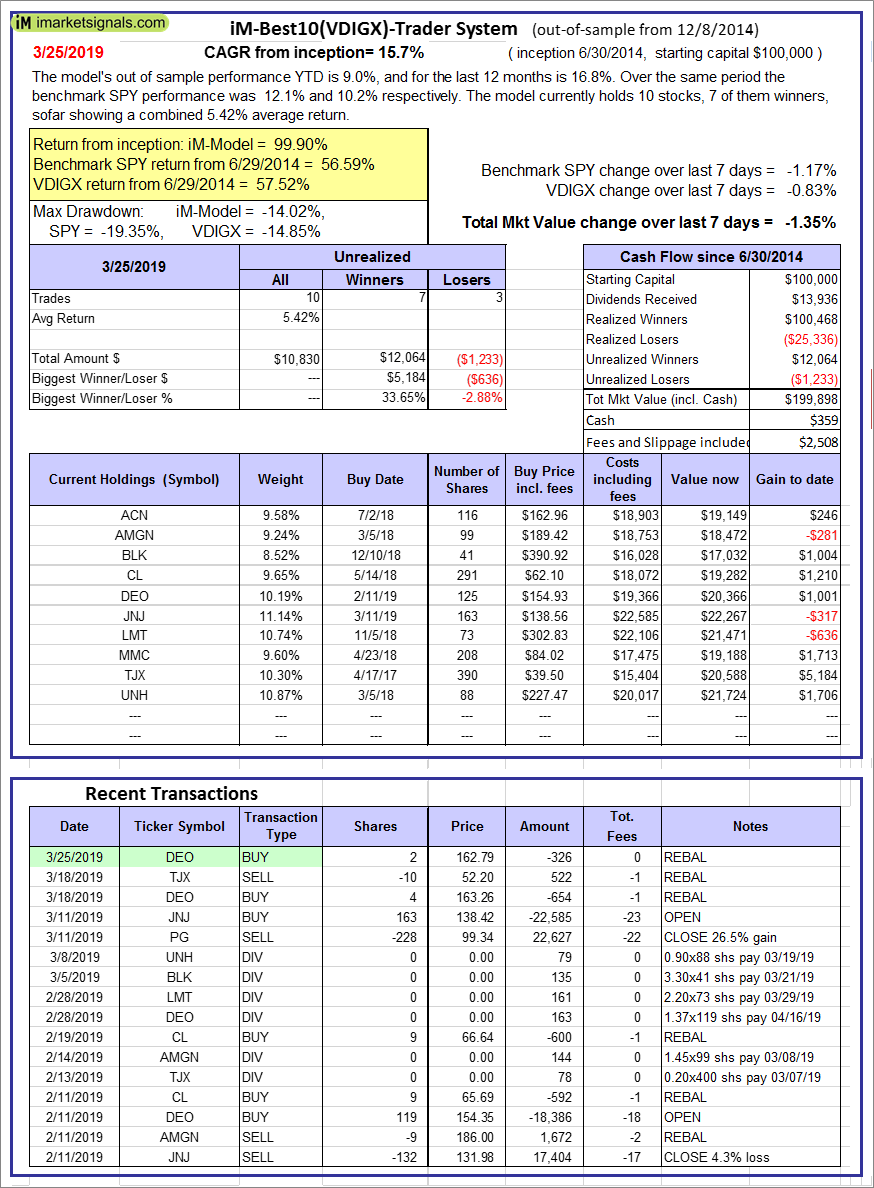  |
iM-Best10(VDIGX)-Trader: The model’s out of sample performance YTD is 9.0%, and for the last 12 months is 16.8%. Over the same period the benchmark SPY performance was 12.1% and 10.2% respectively. Since inception, on 7/1/2014, the model gained 99.90% while the benchmark SPY gained 56.59% and VDIGX gained 57.52% over the same period. Over the previous week the market value of iM-Best10(VDIGX) gained -1.35% at a time when SPY gained -1.17%. A starting capital of $100,000 at inception on 7/1/2014 would have grown to $199,898 which includes $359 cash and excludes $2,508 spent on fees and slippage. |
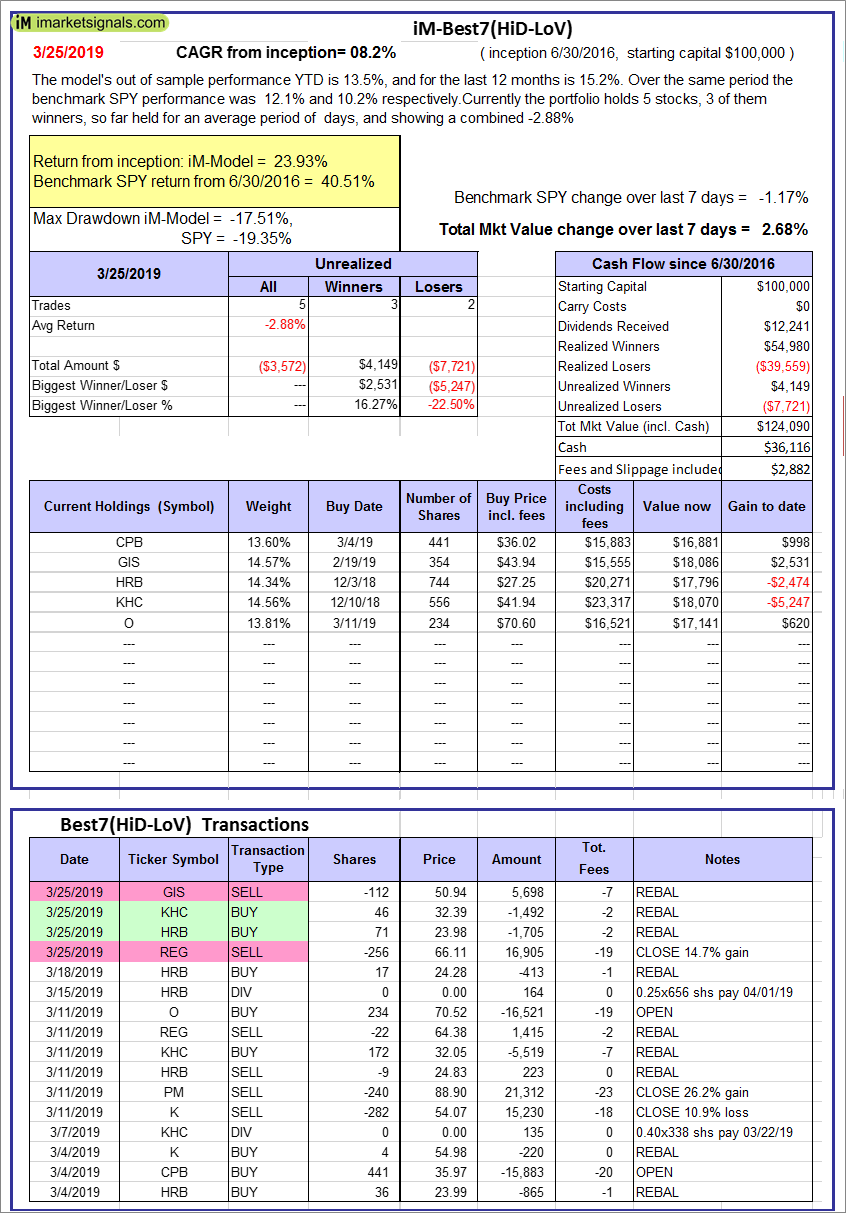 |
iM-Best7(HiD-LoV): The model’s out of sample performance YTD is 13.5%, and for the last 12 months is 15.2%. Over the same period the benchmark SPY performance was 12.1% and 10.2% respectively. Over the previous week the market value of iM-BESTOGA-3 gained 2.68% at a time when SPY gained -1.17%. A starting capital of $100,000 at inception on 6/30/2016 would have grown to $124,090 which includes $36,116 cash and excludes $2,882 spent on fees and slippage. |
 |
iM 6-Stock Capital Strength Portfolio: The model’s out of sample performance YTD is 9.0%, and for the last 12 months is 13.0%. Over the same period the benchmark SPY performance was 12.1% and 10.2% respectively. Over the previous week the market value of the iM 6-Stock Capital Strength Portfolio gained -1.49% at a time when SPY gained -1.17%. A starting capital of $100,000 at inception on 10/28/2016 would have grown to $164,173 which includes $2,214 cash and excludes $870 spent on fees and slippage. |
 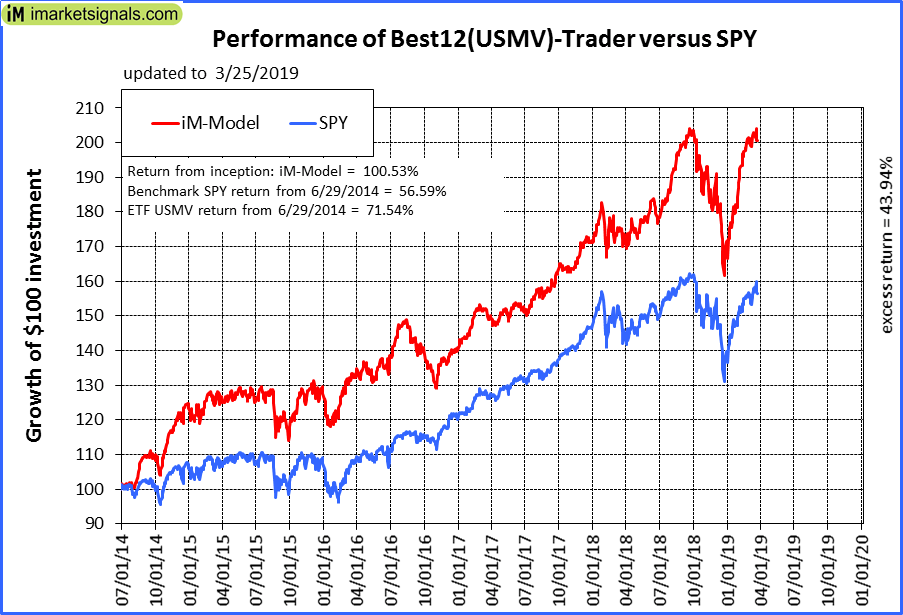 |
iM-Best12(USMV)-Trader: The model’s out of sample performance YTD is 16.9%, and for the last 12 months is 18.0%. Over the same period the benchmark SPY performance was 12.1% and 10.2% respectively. Since inception, on 6/30/2014, the model gained 100.53% while the benchmark SPY gained 56.59% and the ETF USMV gained 71.54% over the same period. Over the previous week the market value of iM-Best12(USMV)-Trader gained -1.03% at a time when SPY gained -1.17%. A starting capital of $100,000 at inception on 6/30/2014 would have grown to $200,535 which includes $1,120 cash and excludes $5,230 spent on fees and slippage. |
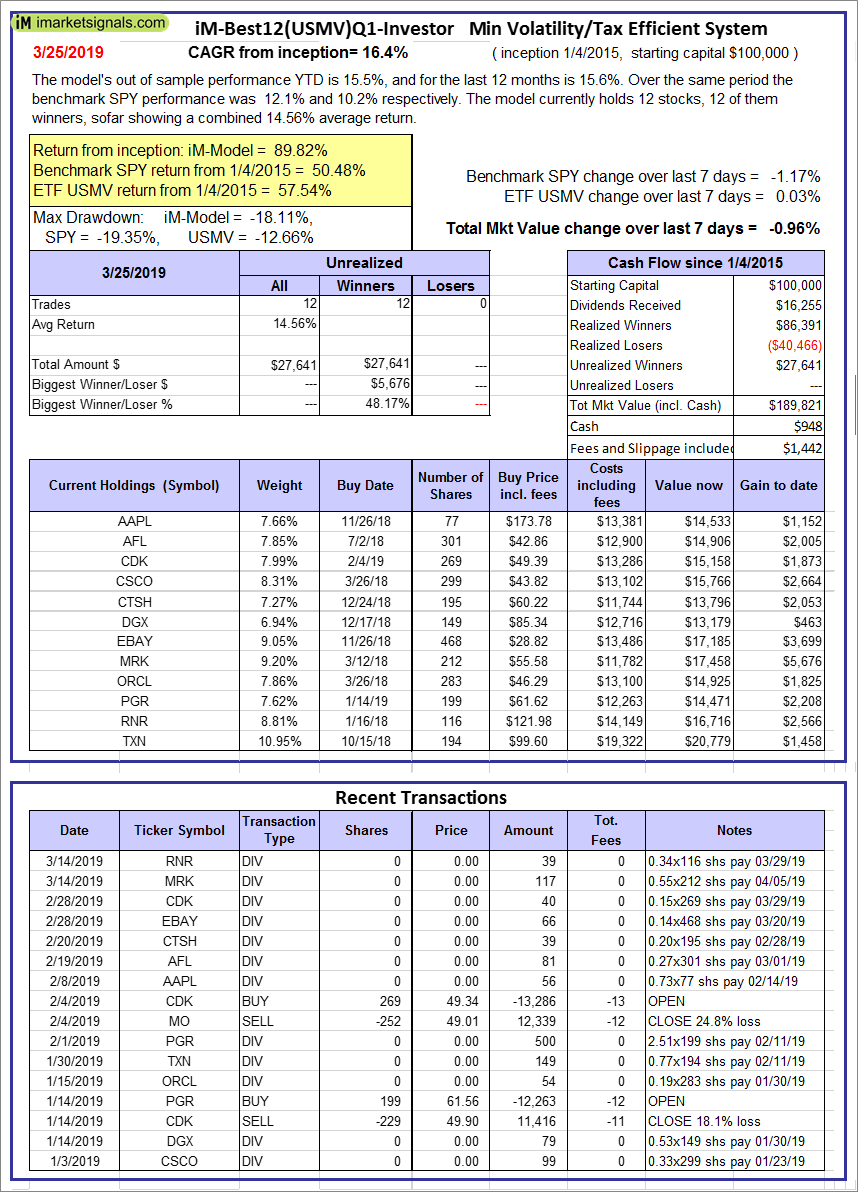 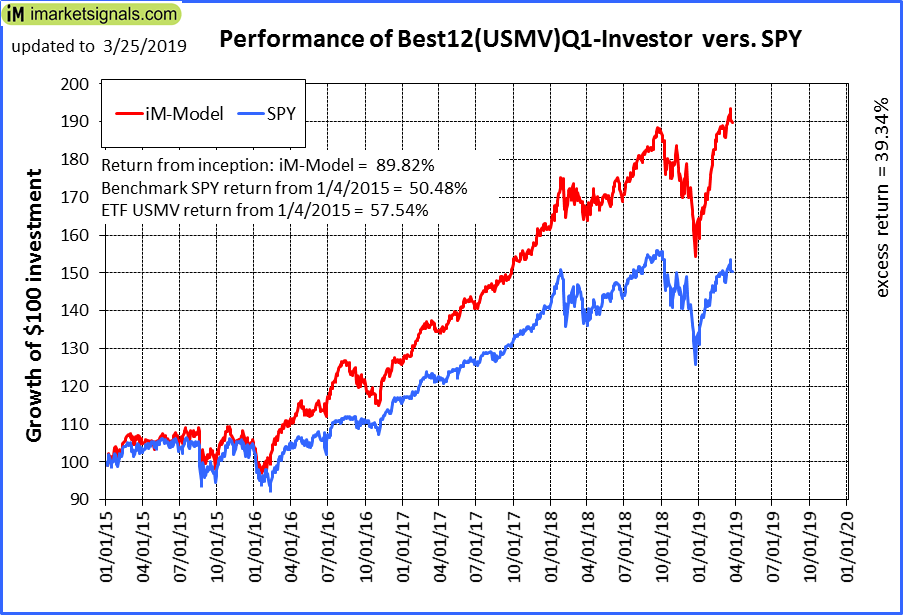 |
iM-Best12(USMV)Q1-Investor: The model’s out of sample performance YTD is 15.5%, and for the last 12 months is 15.6%. Over the same period the benchmark SPY performance was 12.1% and 10.2% respectively. Since inception, on 1/5/2015, the model gained 89.82% while the benchmark SPY gained 50.48% and the ETF USMV gained 57.54% over the same period. Over the previous week the market value of iM-Best12(USMV)Q1 gained -0.96% at a time when SPY gained -1.17%. A starting capital of $100,000 at inception on 1/5/2015 would have grown to $189,821 which includes $948 cash and excludes $1,442 spent on fees and slippage. |
 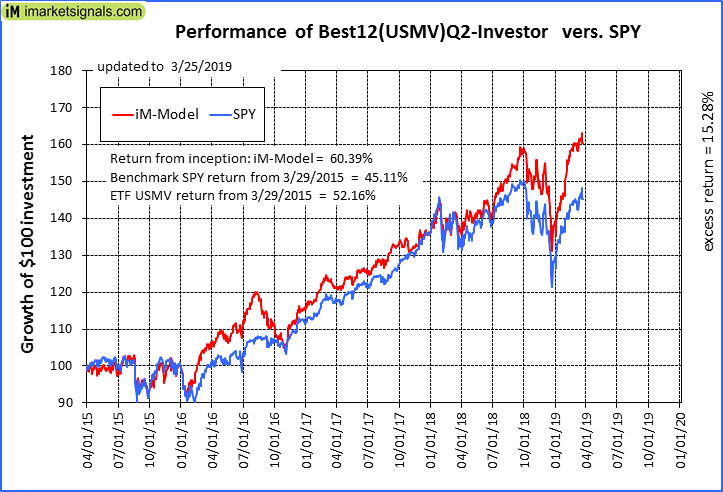 |
iM-Best12(USMV)Q2-Investor: The model’s out of sample performance YTD is 15.5%, and for the last 12 months is 18.7%. Over the same period the benchmark SPY performance was 12.1% and 10.2% respectively. Since inception, on 3/30/2015, the model gained 60.39% while the benchmark SPY gained 45.11% and the ETF USMV gained 52.16% over the same period. Over the previous week the market value of iM-Best12(USMV)Q2 gained -0.59% at a time when SPY gained -1.17%. A starting capital of $100,000 at inception on 3/30/2015 would have grown to $160,387 which includes -$229 cash and excludes $1,310 spent on fees and slippage. |
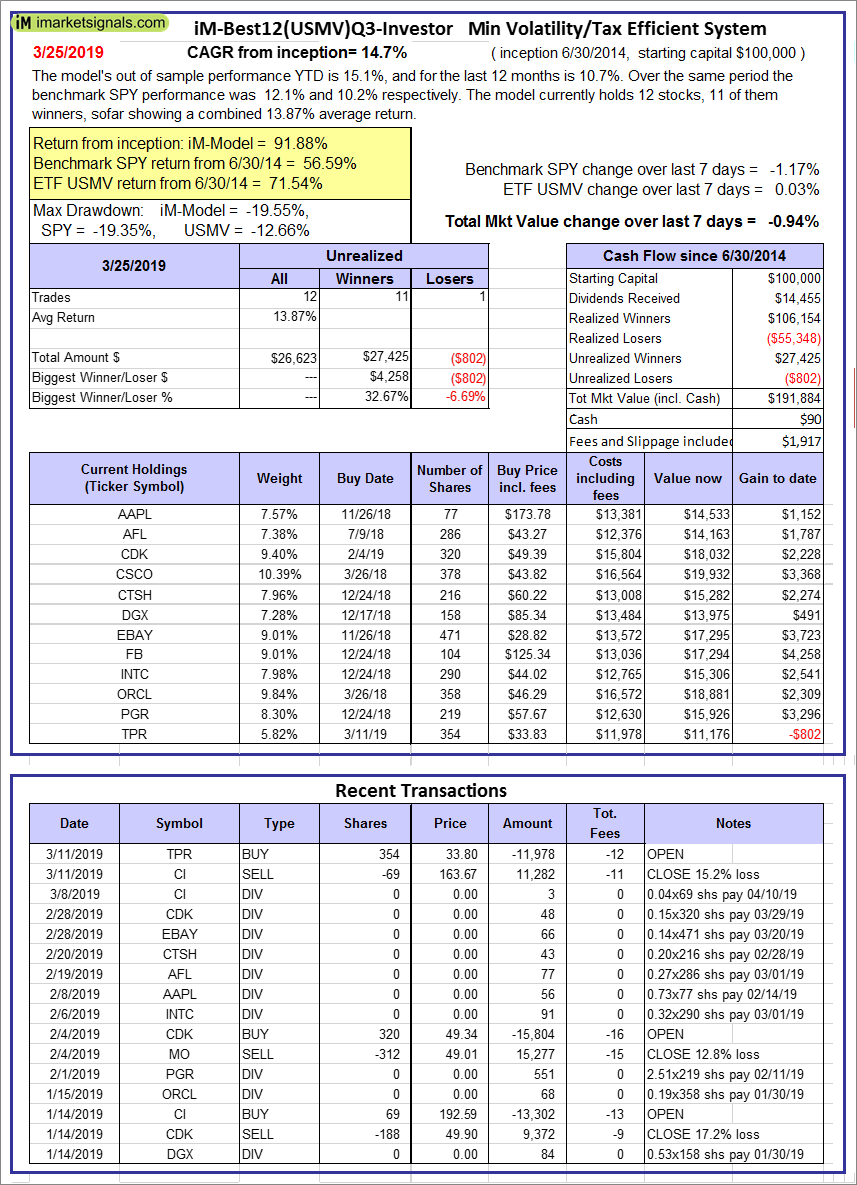 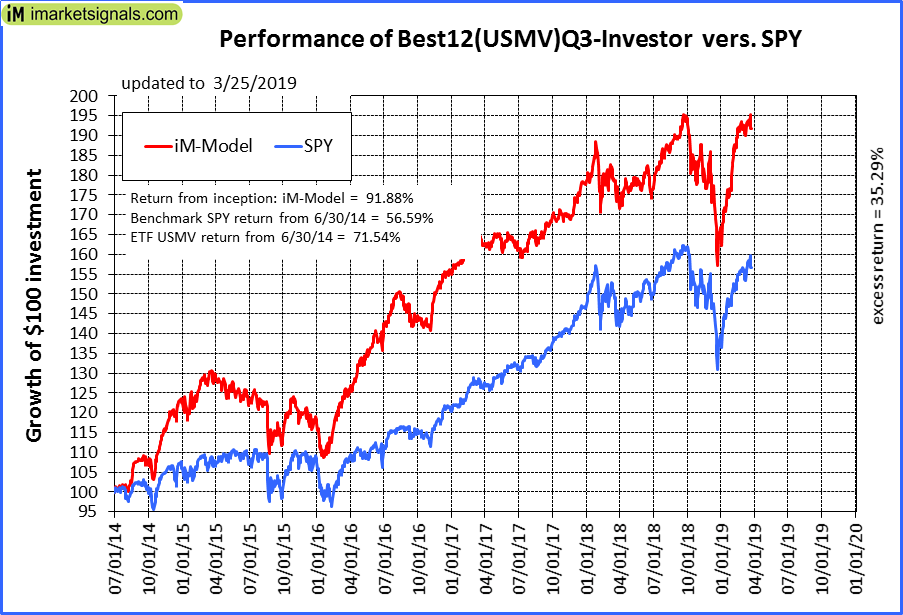 |
iM-Best12(USMV)Q3-Investor: The model’s out of sample performance YTD is 15.1%, and for the last 12 months is 10.7%. Over the same period the benchmark SPY performance was 12.1% and 10.2% respectively. Since inception, on 7/1/2014, the model gained 91.88% while the benchmark SPY gained 56.59% and the ETF USMV gained 71.54% over the same period. Over the previous week the market value of iM-Best12(USMV)Q3 gained -0.94% at a time when SPY gained -1.17%. A starting capital of $100,000 at inception on 7/1/2014 would have grown to $191,884 which includes $90 cash and excludes $1,917 spent on fees and slippage. |
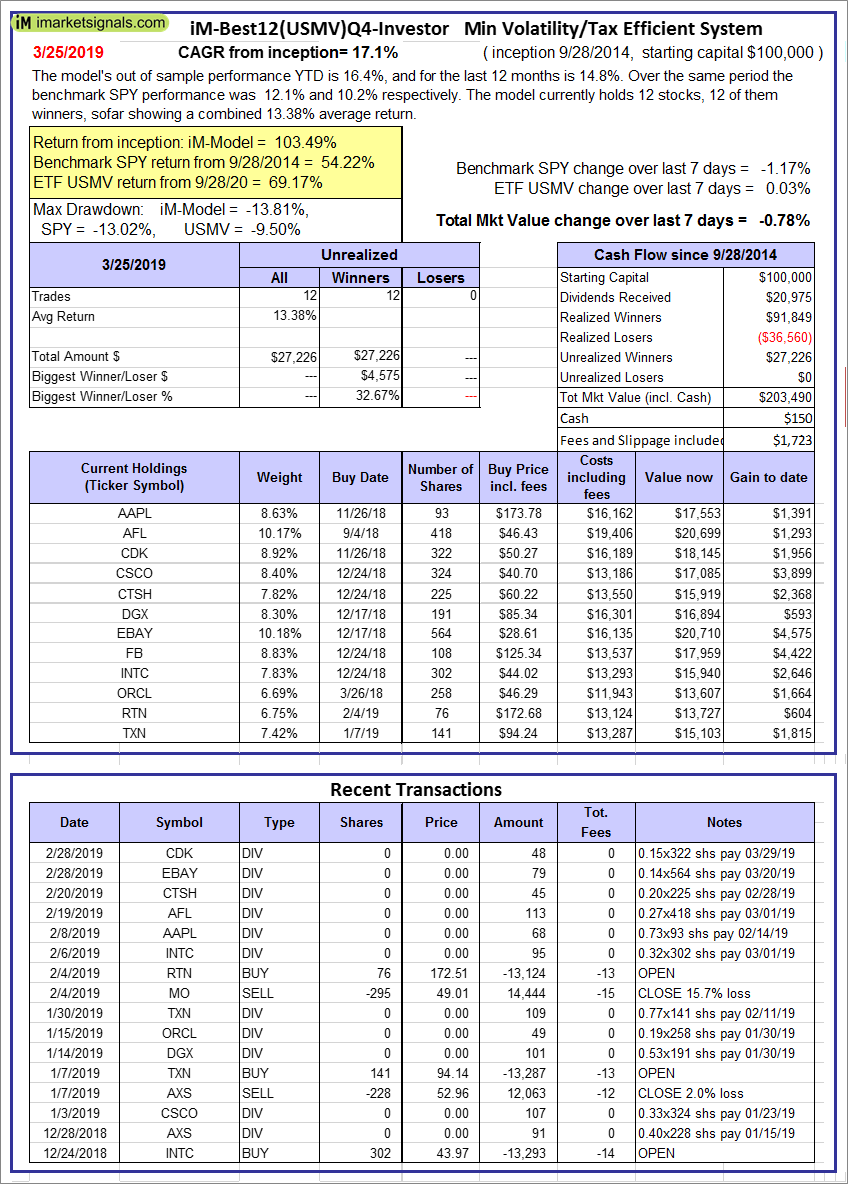 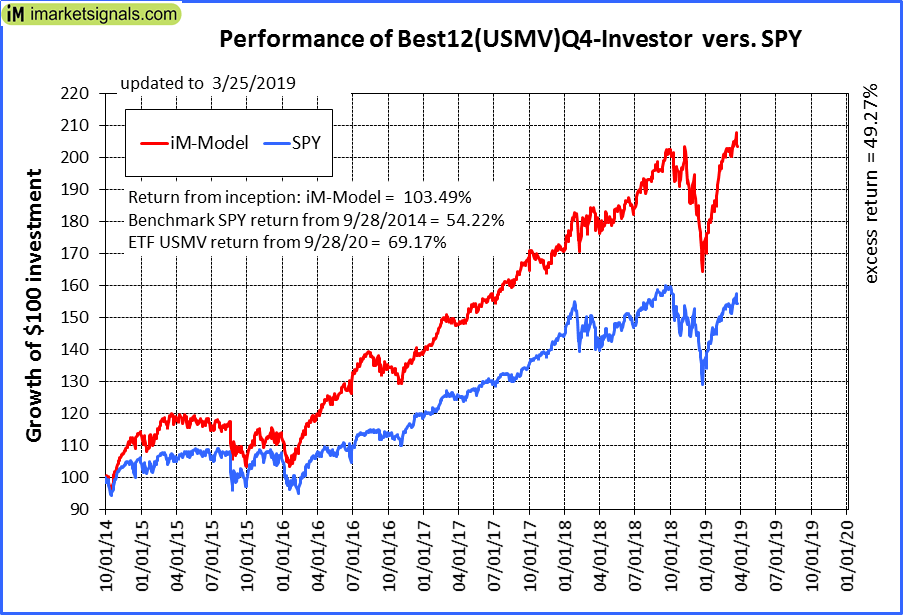 |
iM-Best12(USMV)Q4-Investor: Since inception, on 9/29/2014, the model gained 103.49% while the benchmark SPY gained 54.22% and the ETF USMV gained 69.17% over the same period. Over the previous week the market value of iM-Best12(USMV)Q4 gained -0.78% at a time when SPY gained -1.17%. A starting capital of $100,000 at inception on 9/29/2014 would have grown to $203,490 which includes $150 cash and excludes $1,723 spent on fees and slippage. |
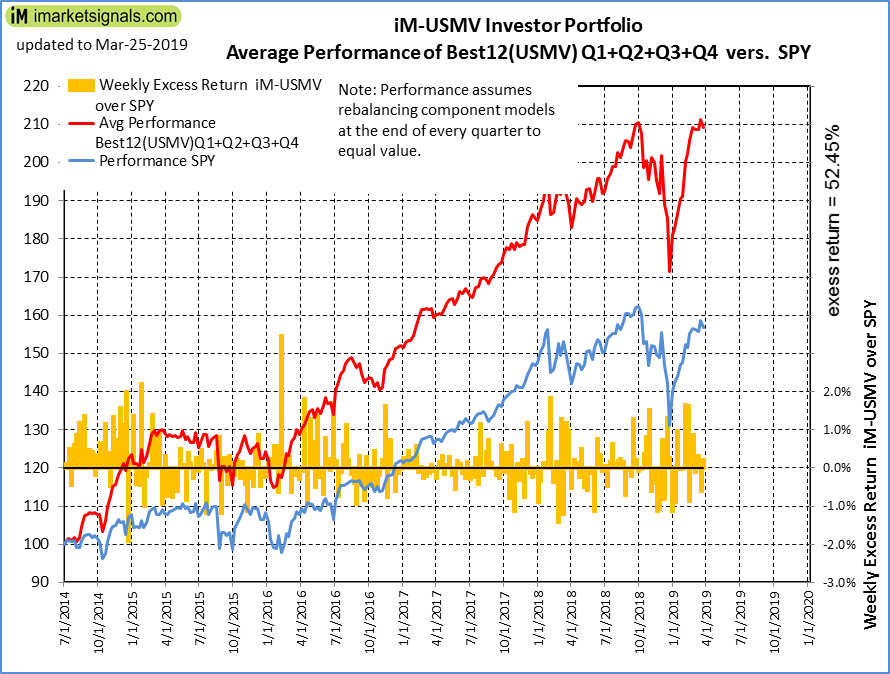 |
Average Performance of iM-Best12(USMV)Q1+Q2+Q3+Q4-Investor resulted in an excess return of 52.60% over SPY. (see iM-USMV Investor Portfolio) |
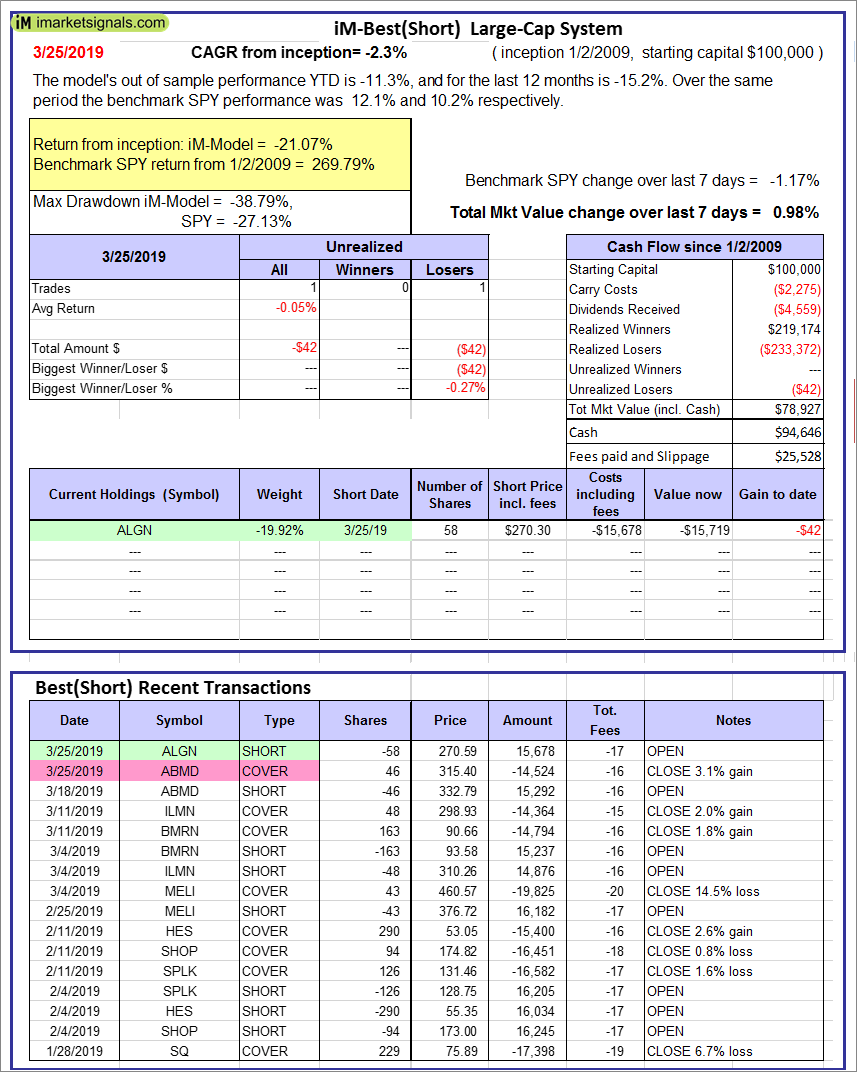 |
iM-Best(Short): The model’s out of sample performance YTD is -11.3%, and for the last 12 months is -15.2%. Over the same period the benchmark SPY performance was 12.1% and 10.2% respectively. Over the previous week the market value of iM-Best(Short) gained 0.98% at a time when SPY gained -1.17%. Over the period 1/2/2009 to 3/25/2019 the starting capital of $100,000 would have grown to $78,927 which includes $94,646 cash and excludes $25,528 spent on fees and slippage. |
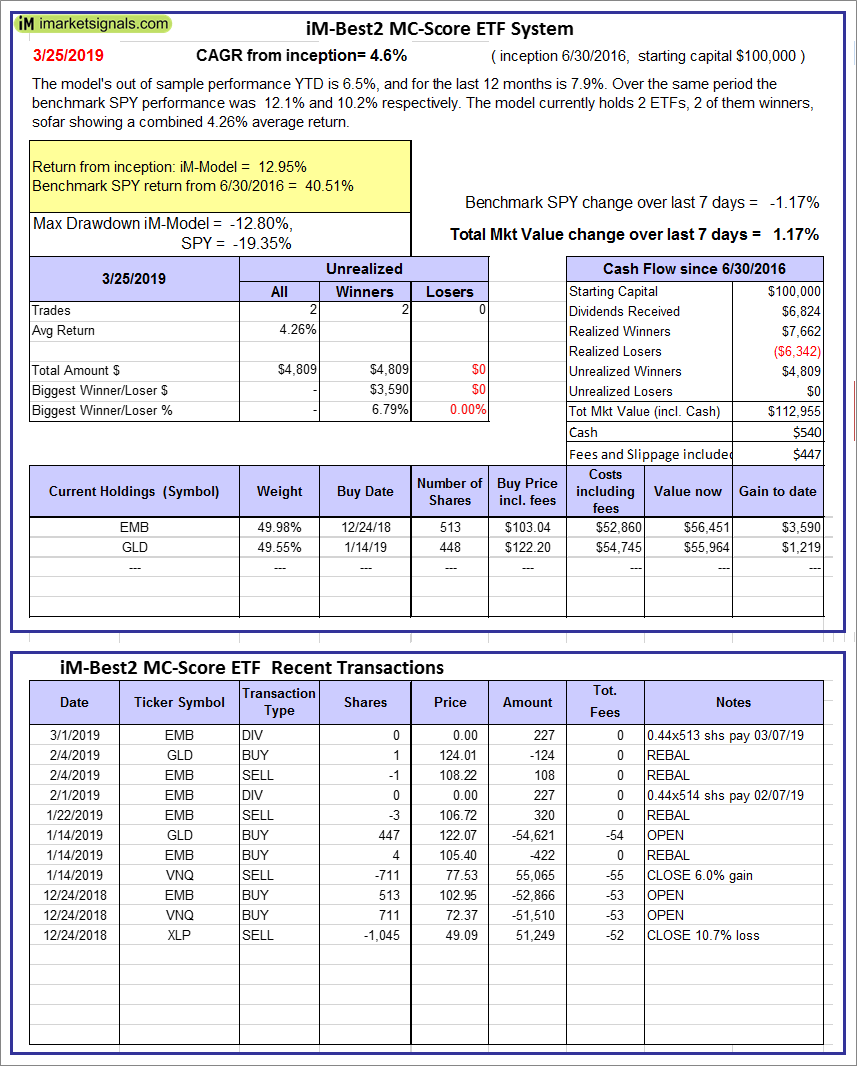 |
iM-Best2 MC-Score ETF System: The model’s out of sample performance YTD is 6.5%, and for the last 12 months is 7.9%. Over the same period the benchmark SPY performance was 12.1% and 10.2% respectively. Over the previous week the market value of the iM-Best2 MC-Score ETF System gained 1.17% at a time when SPY gained -1.17%. A starting capital of $100,000 at inception on 6/30/2016 would have grown to $112,955 which includes $540 cash and excludes $447 spent on fees and slippage. |
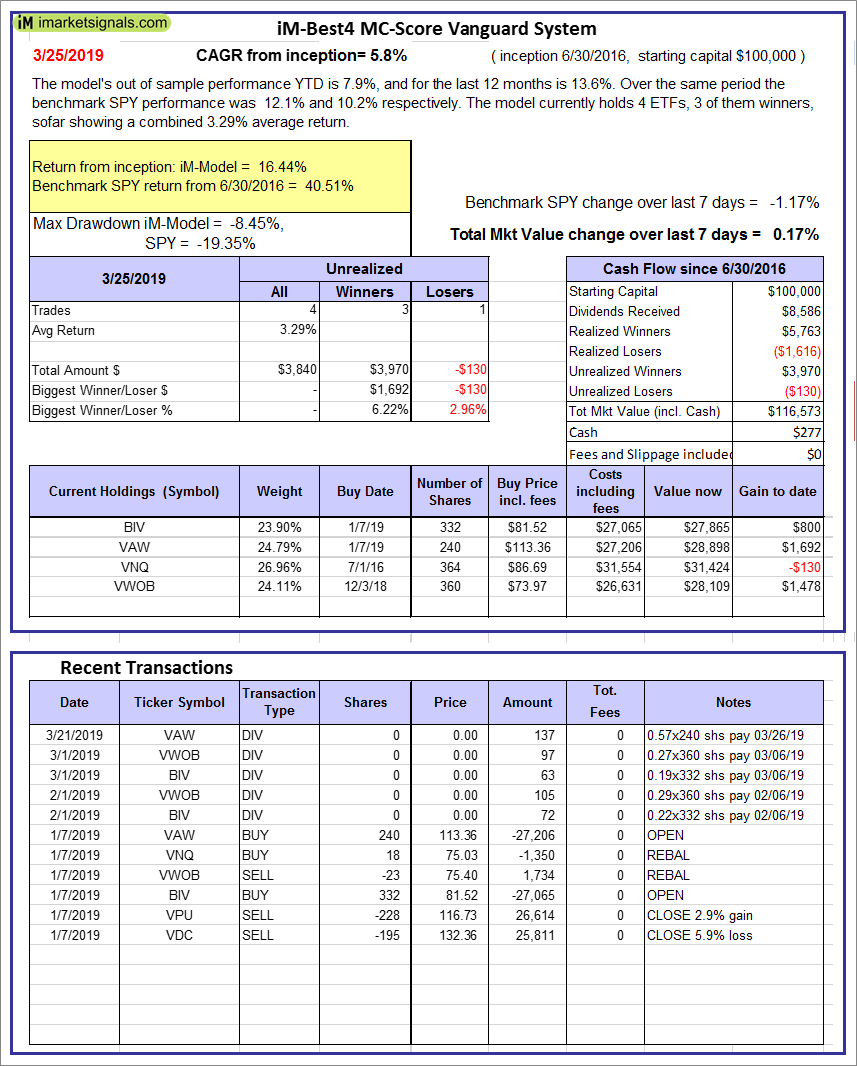 |
iM-Best4 MC-Score Vanguard System: The model’s out of sample performance YTD is 7.9%, and for the last 12 months is 13.6%. Over the same period the benchmark SPY performance was 12.1% and 10.2% respectively. Over the previous week the market value of the iM-Best4 MC-Score Vanguard System gained 0.17% at a time when SPY gained -1.17%. A starting capital of $100,000 at inception on 6/30/2016 would have grown to $116,573 which includes $277 cash and excludes $00 spent on fees and slippage. |
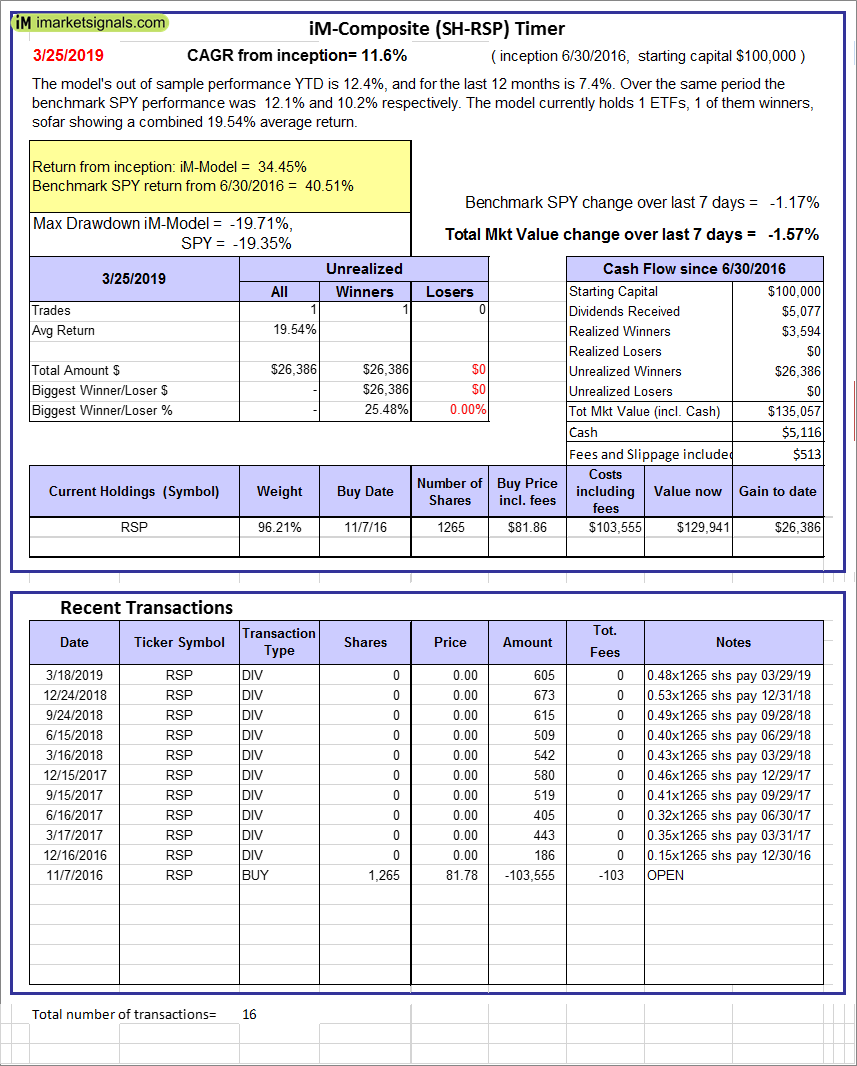 |
iM-Composite (SH-RSP) Timer: The model’s out of sample performance YTD is 12.4%, and for the last 12 months is 7.4%. Over the same period the benchmark SPY performance was 12.1% and 10.2% respectively. Over the previous week the market value of the iM-Composite (SH-RSP) Timer gained -1.57% at a time when SPY gained -1.17%. A starting capital of $100,000 at inception on 6/30/2016 would have grown to $135,057 which includes $5,116 cash and excludes $513 spent on fees and slippage. |
 |
iM-Composite (SPY-IEF) Timer: The model’s out of sample performance YTD is 4.9%, and for the last 12 months is 14.4%. Over the same period the benchmark SPY performance was 12.1% and 10.2% respectively. Over the previous week the market value of the iM-Composite (SPY-IEF) Timer gained 1.26% at a time when SPY gained -1.17%. A starting capital of $100,000 at inception on 6/30/2016 would have grown to $148,111 which includes $499 cash and excludes $2,780 spent on fees and slippage. |
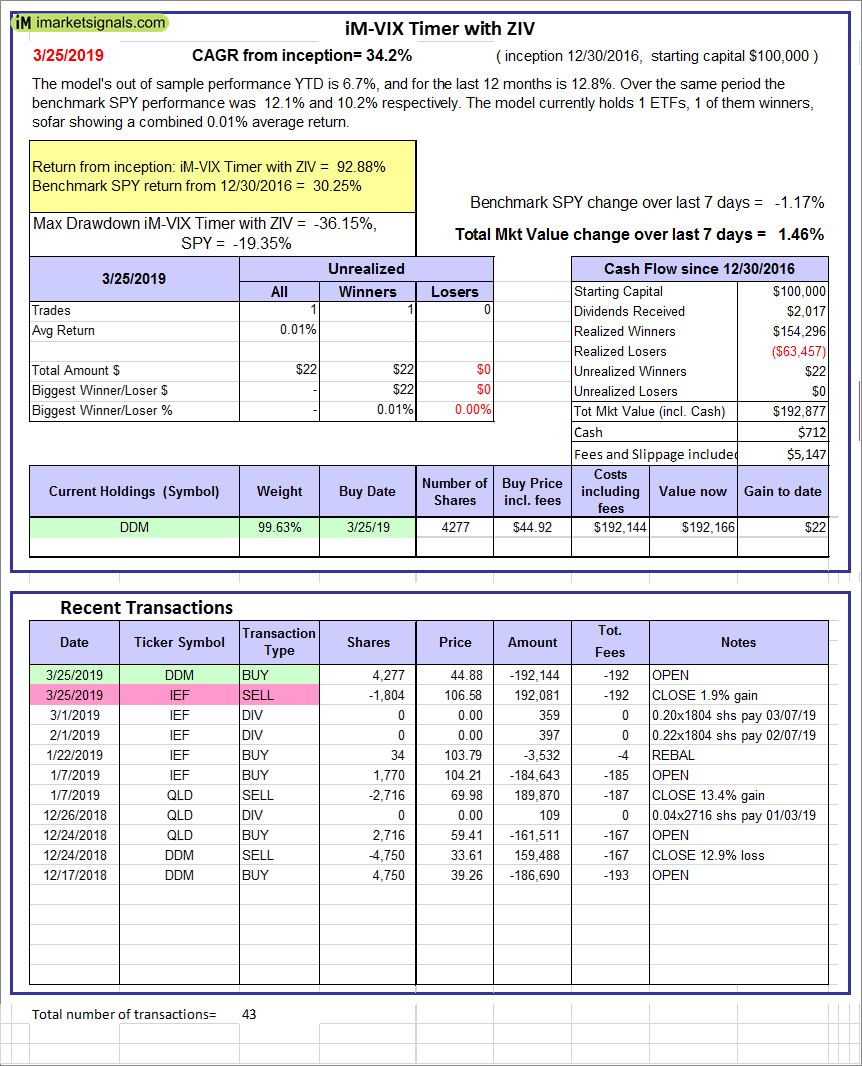 |
iM-VIX Timer with ZIV: The model’s out of sample performance YTD is 6.7%, and for the last 12 months is 12.8%. Over the same period the benchmark SPY performance was 12.1% and 10.2% respectively. Over the previous week the market value of the iM-VIX Timer with ZIV gained 1.46% at a time when SPY gained -1.17%. A starting capital of $100,000 at inception on 6/30/2016 would have grown to $192,877 which includes $712 cash and excludes $5,147 spent on fees and slippage. |
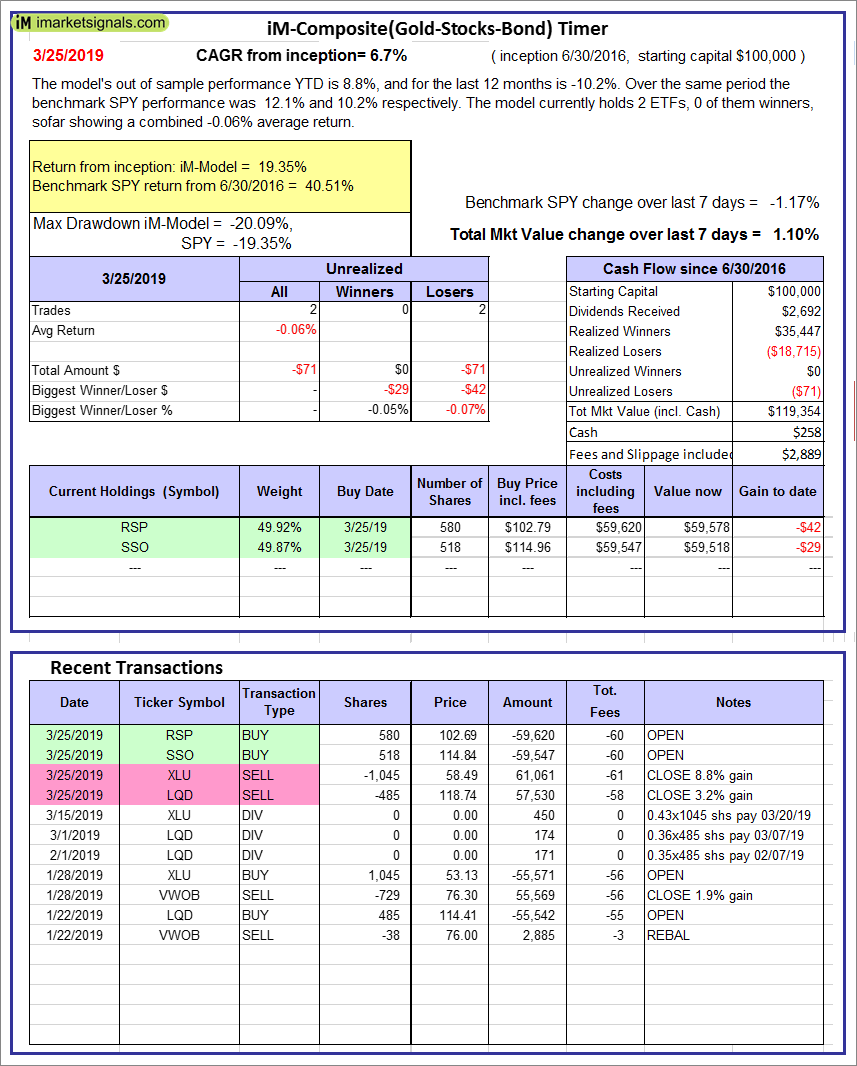 |
iM-Composite(Gold-Stocks-Bond) Timer: The model’s out of sample performance YTD is 8.8%, and for the last 12 months is -10.2%. Over the same period the benchmark SPY performance was 12.1% and 10.2% respectively. Over the previous week the market value of the iM-Composite(Gold-Stocks-Bond) Timer gained 1.10% at a time when SPY gained -1.17%. A starting capital of $100,000 at inception on 6/30/2016 would have grown to $119,354 which includes $258 cash and excludes $2,889 spent on fees and slippage. |
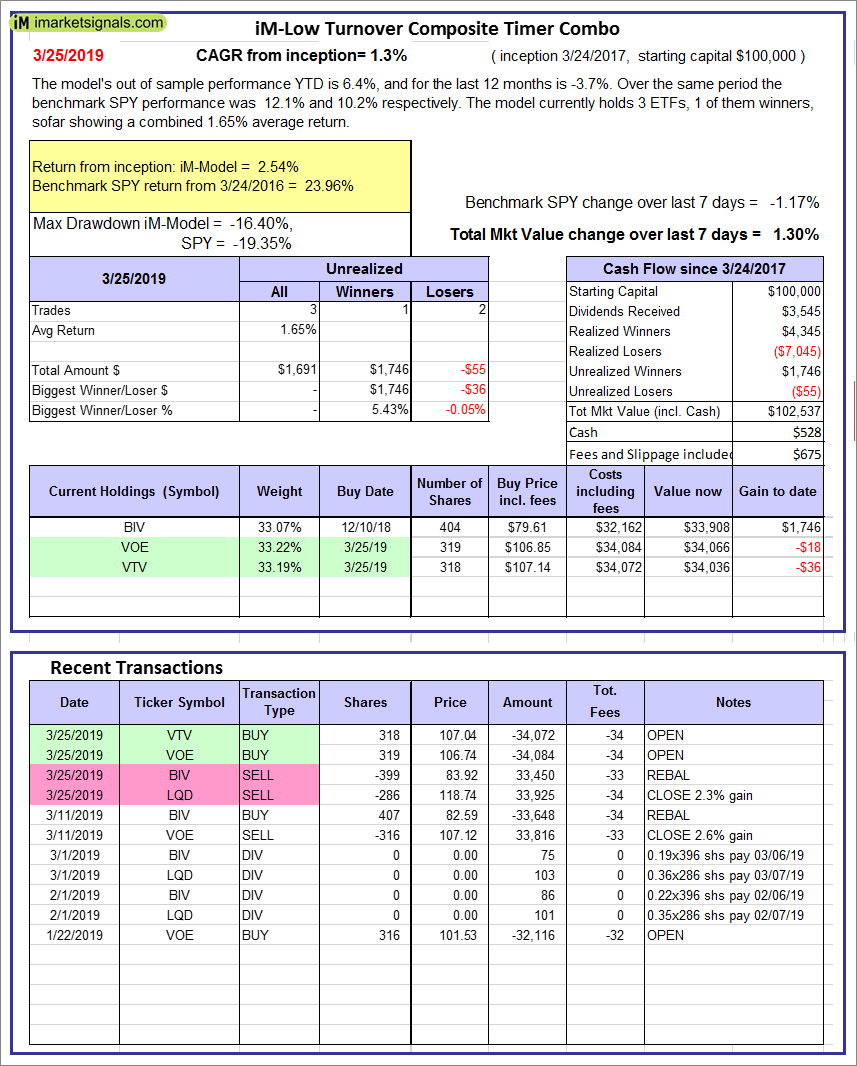 |
iM-Low Turnover Composite Timer Combo: The model’s out of sample performance YTD is 6.4%, and for the last 12 months is -3.7%. Over the same period the benchmark SPY performance was 12.1% and 10.2% respectively. Over the previous week the market value of the iM-Low Turnover Composite Timer Combo gained 1.30% at a time when SPY gained -1.17%. A starting capital of $100,000 at inception on 3/24/27 would have grown to $102,537 which includes $528 cash and excludes $675 spent on fees and slippage. |
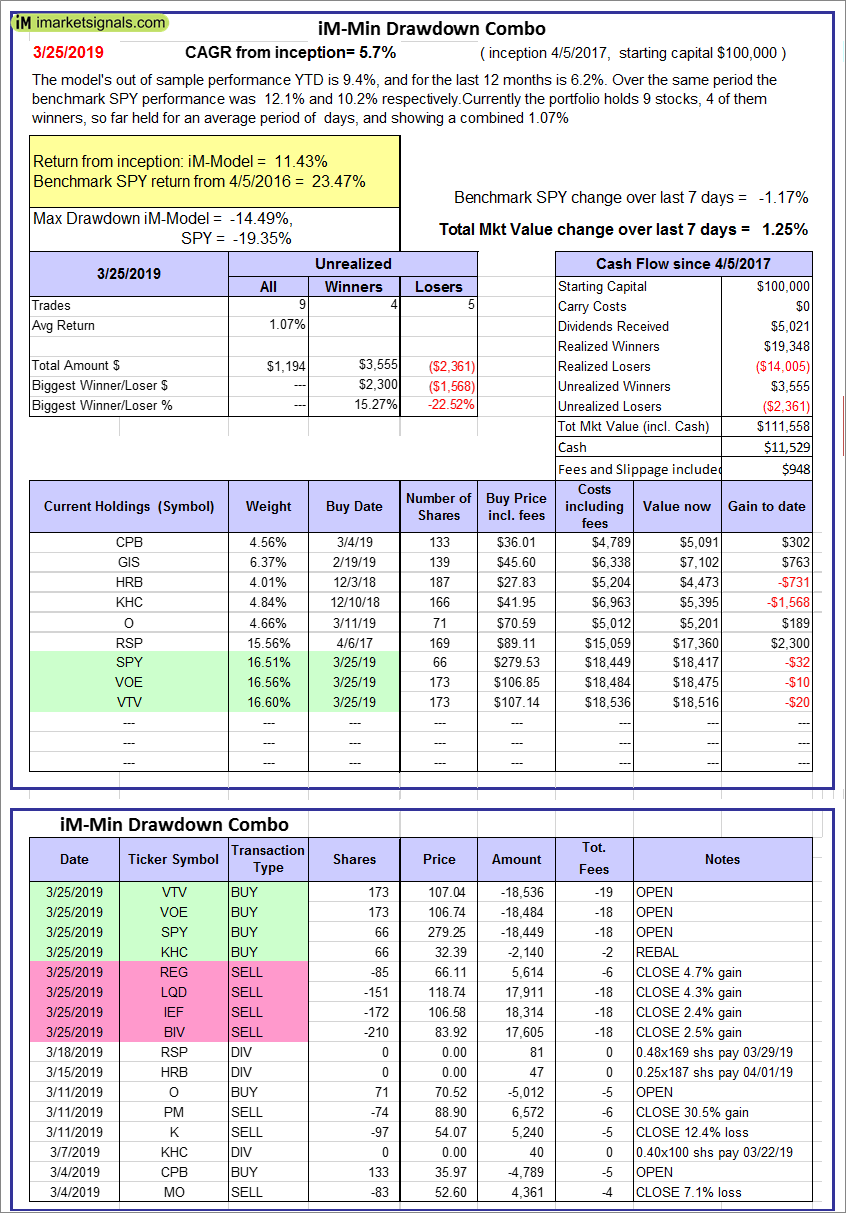 |
iM-Min Drawdown Combo: The model’s out of sample performance YTD is 9.4%, and for the last 12 months is 6.2%. Over the same period the benchmark SPY performance was 12.1% and 10.2% respectively. Over the previous week the market value of the iM-Min Drawdown Combo gained 1.25% at a time when SPY gained -1.17%. A starting capital of $100,000 at inception on 4/5/2017 would have grown to $111,558 which includes $11,529 cash and excludes $948 spent on fees and slippage. |
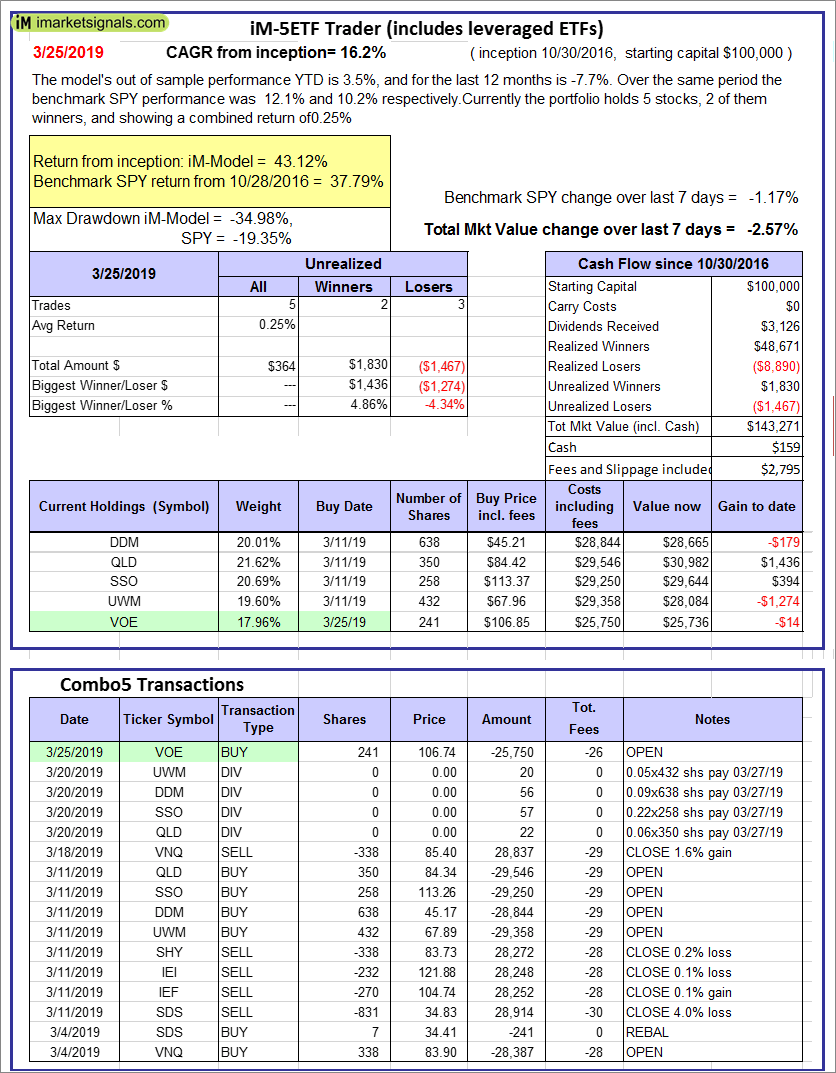 |
iM-5ETF Trader (includes leveraged ETFs): The model’s out of sample performance YTD is 3.5%, and for the last 12 months is -7.7%. Over the same period the benchmark SPY performance was 12.1% and 10.2% respectively. Over the previous week the market value of the iM-5ETF Trader (includes leveraged ETFs) gained -2.57% at a time when SPY gained -1.17%. A starting capital of $100,000 at inception on 10/30/2016 would have grown to $143,271 which includes $159 cash and excludes $2,795 spent on fees and slippage. |
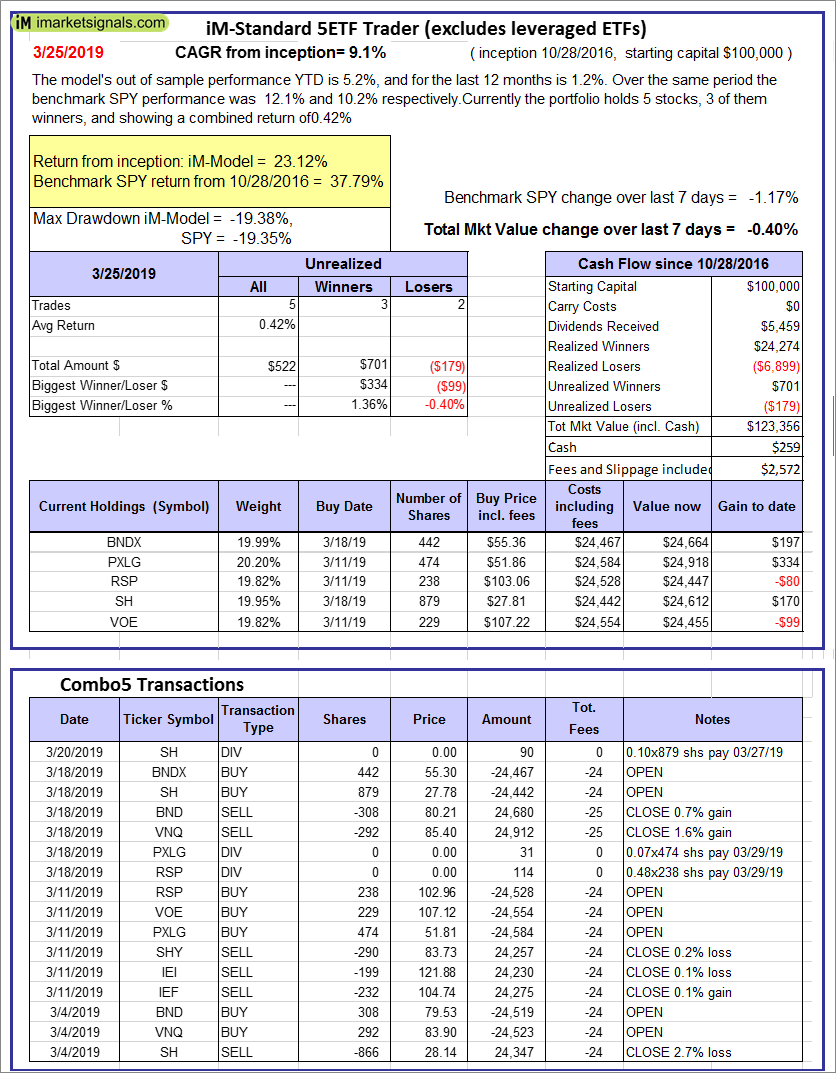 |
iM-Standard 5ETF Trader (excludes leveraged ETFs): The model’s out of sample performance YTD is 5.2%, and for the last 12 months is 1.2%. Over the same period the benchmark SPY performance was 12.1% and 10.2% respectively. Over the previous week the market value of the iM-Standard 5ETF Trader (excludes leveraged ETFs) gained -0.40% at a time when SPY gained -1.17%. A starting capital of $100,000 at inception on 10/30/2016 would have grown to $123,356 which includes $259 cash and excludes $2,572 spent on fees and slippage. |
iM-Best Reports – 3/25/2019
Posted in pmp SPY-SH
Leave a Reply
You must be logged in to post a comment.