  |
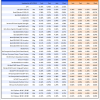
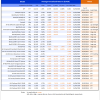
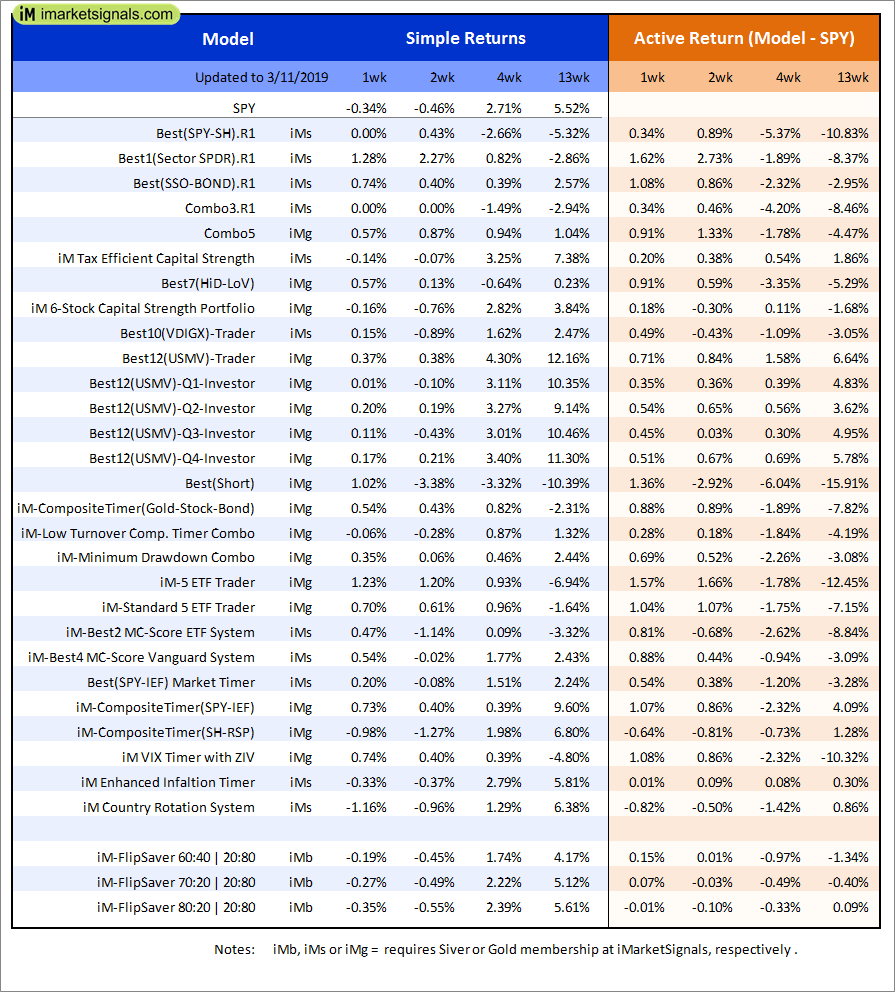
Out of sample performance summary of our models for the past 1, 2, 4 and 13 week periods. The active active return indicates how the models over- or underperformed the benchmark ETF SPY. Also the YTD, and the 1-, 3-, 5- and 10-year annualized returns are shown in the second table |
|
|
iM-FlipSaver 60:40 | 20:80 – 2017: The model’s out of sample performance YTD is 6.3%, and for the last 12 months is 3.4%. Over the same period the benchmark SPY performance was 8.7% and 4.8% respectively. Over the previous week the market value of iM-FlipSaver 80:20 | 20:80 gained 1.09% at a time when SPY gained 1.19%. A starting capital of $100,000 at inception on 7/16/2015 would have grown to $119,019 which includes $183 cash and excludes $788 spent on fees and slippage. |
|
|
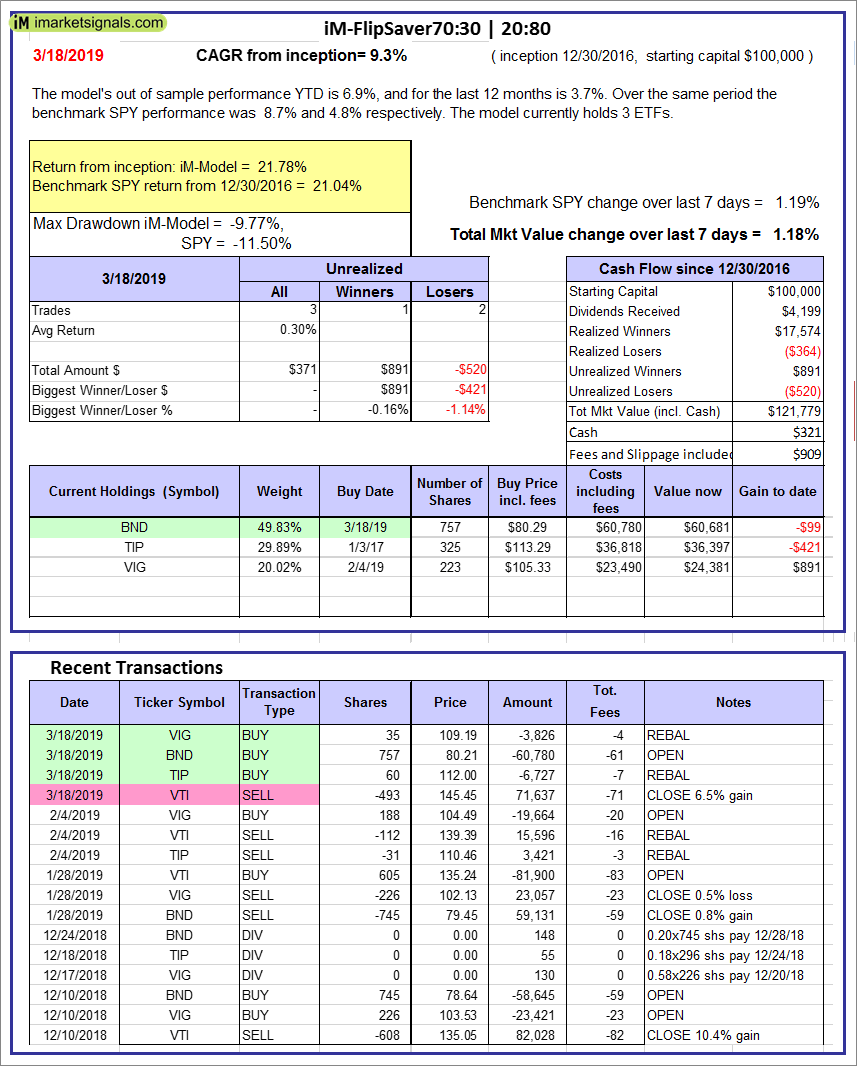
iM-FlipSaver 70:30 | 20:80 – 2017: The model’s out of sample performance YTD is 6.9%, and for the last 12 months is 3.7%. Over the same period the benchmark SPY performance was 8.7% and 4.8% respectively. Over the previous week the market value of iM-FlipSaver 70:30 | 20:80 gained 1.18% at a time when SPY gained 1.19%. A starting capital of $100,000 at inception on 7/15/2015 would have grown to $121,779 which includes $321 cash and excludes $909 spent on fees and slippage. |
|
|
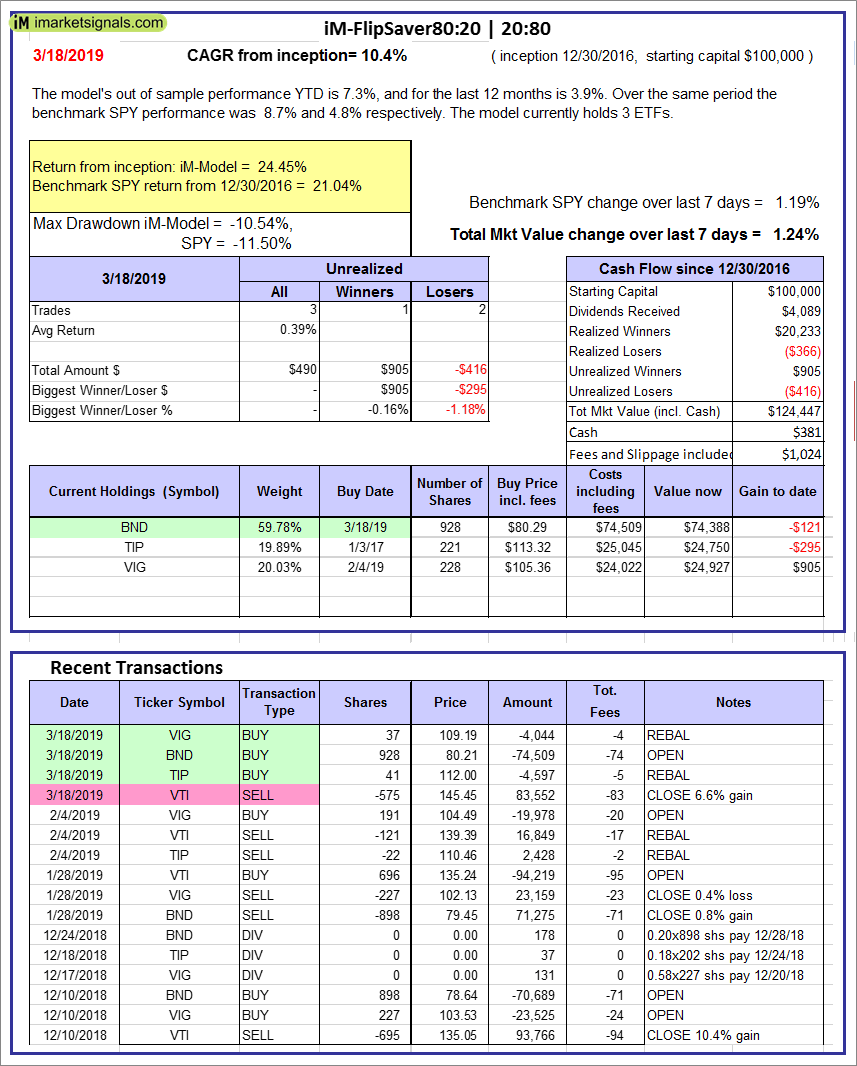
iM-FlipSaver 80:20 | 20:80 – 2017: The model’s out of sample performance YTD is 7.3%, and for the last 12 months is 3.9%. Over the same period the benchmark SPY performance was 8.7% and 4.8% respectively. Over the previous week the market value of iM-FlipSaver 80:20 | 20:80 gained 1.24% at a time when SPY gained 1.19%. A starting capital of $100,000 at inception on 1/2/2017 would have grown to $124,447 which includes $381 cash and excludes $1,024 spent on fees and slippage. |
|
|
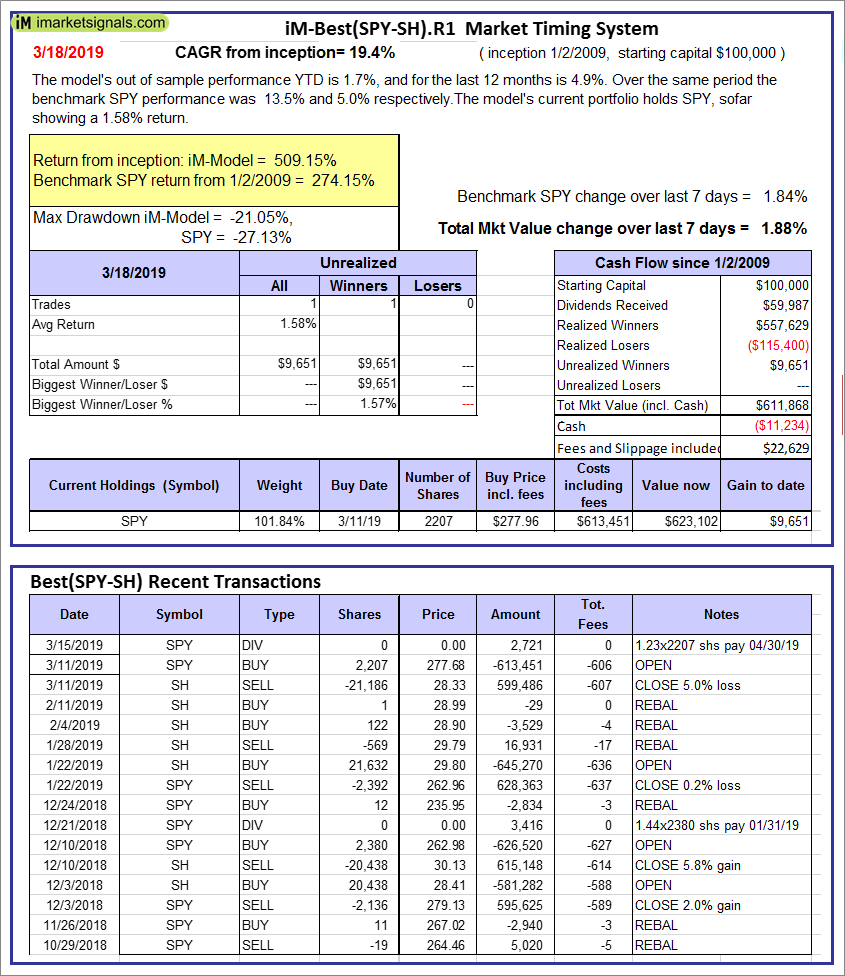
iM-Best(SPY-SH).R1: The model’s out of sample performance YTD is 1.7%, and for the last 12 months is 4.9%. Over the same period the benchmark SPY performance was 13.5% and 5.0% respectively. Over the previous week the market value of Best(SPY-SH) gained 1.88% at a time when SPY gained 1.84%. A starting capital of $100,000 at inception on 1/2/2009 would have grown to $611,868 which includes -$11,234 cash and excludes $22,629 spent on fees and slippage. |
|
|
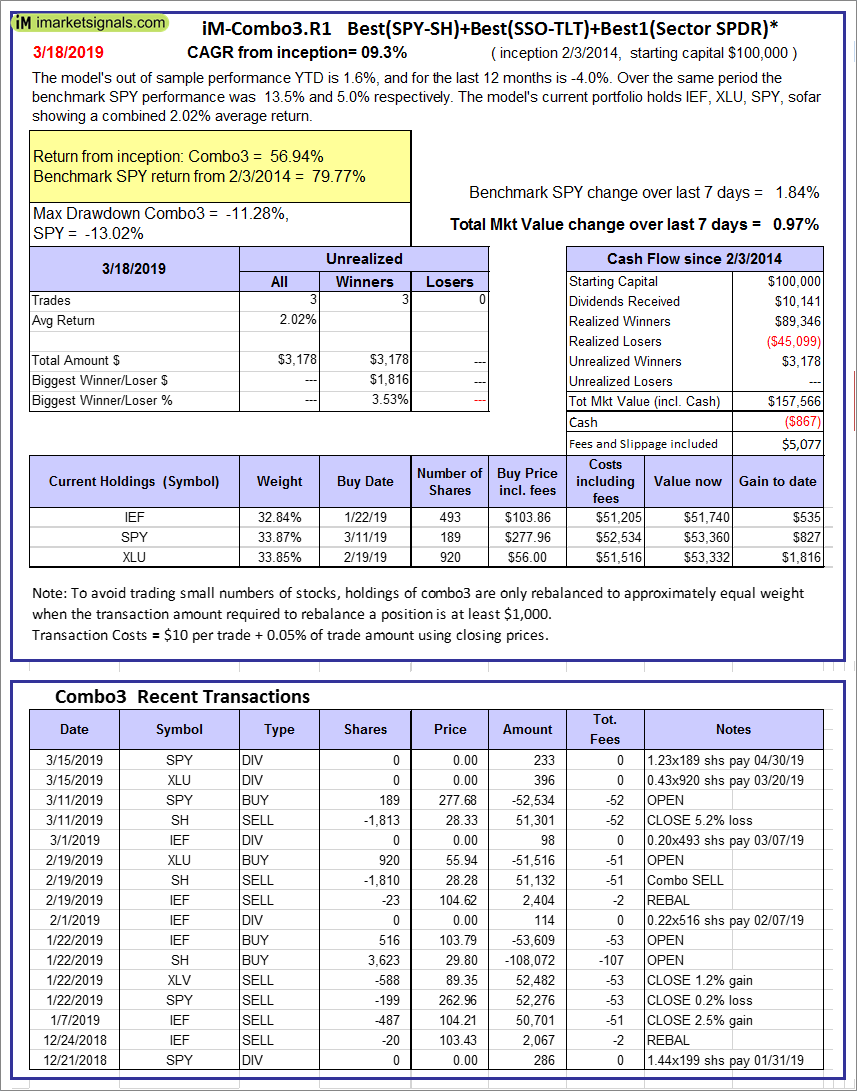
iM-Combo3.R1: The model’s out of sample performance YTD is 1.6%, and for the last 12 months is -4.0%. Over the same period the benchmark SPY performance was 13.5% and 5.0% respectively. Over the previous week the market value of iM-Combo3.R1 gained 0.97% at a time when SPY gained 1.84%. A starting capital of $100,000 at inception on 2/3/2014 would have grown to $157,566 which includes -$867 cash and excludes $5,077 spent on fees and slippage. |
|
|
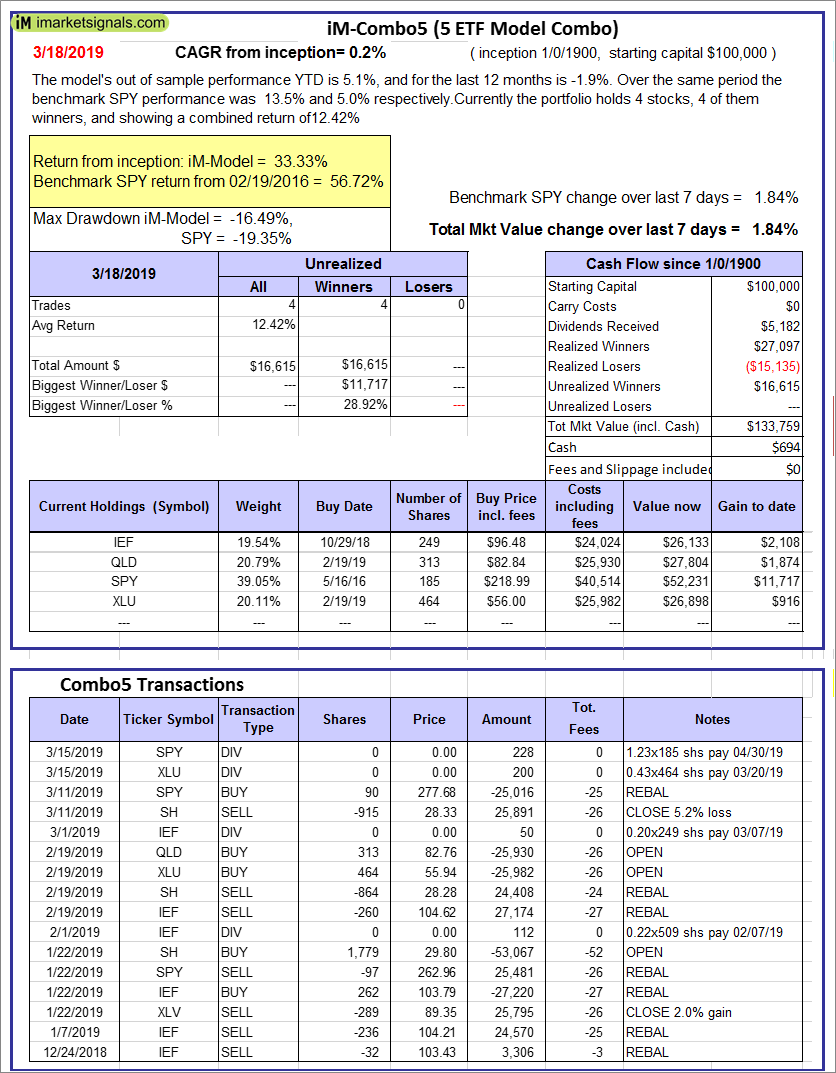
iM-Combo5: The model’s out of sample performance YTD is 5.1%, and for the last 12 months is -1.9%. Over the same period the benchmark SPY performance was 13.5% and 5.0% respectively. Over the previous week the market value of iM-Combo5 gained 1.84% at a time when SPY gained 1.84%. A starting capital of $100,000 at inception on 2/22/2016 would have grown to $133,759 which includes $694 cash and excludes $0 spent on fees and slippage. |
|
|
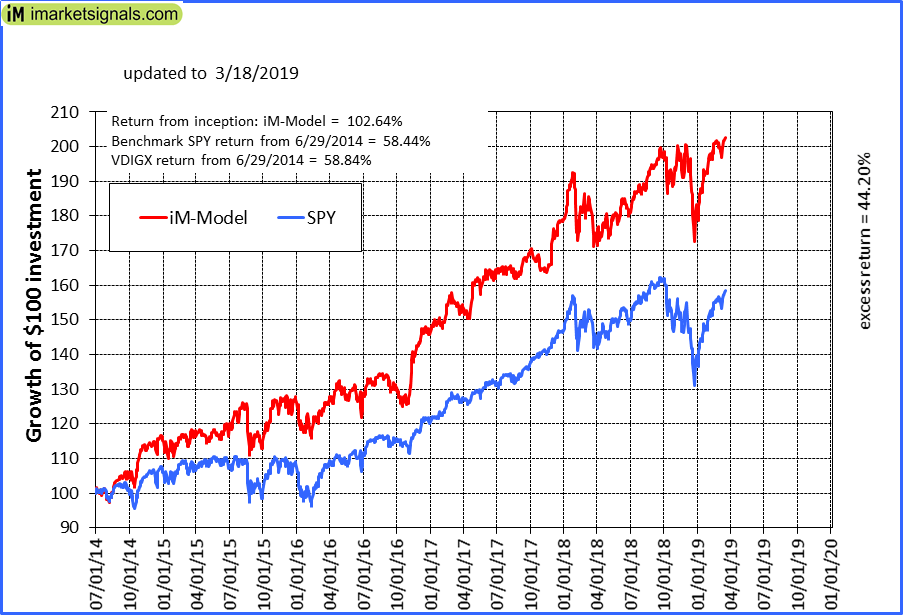
iM-Best10(VDIGX)-Trader: The model’s out of sample performance YTD is 10.5%, and for the last 12 months is 11.3%. Over the same period the benchmark SPY performance was 13.5% and 5.0% respectively. Since inception, on 7/1/2014, the model gained 102.64% while the benchmark SPY gained 58.44% and VDIGX gained 58.84% over the same period. Over the previous week the market value of iM-Best10(VDIGX) gained 1.51% at a time when SPY gained 1.84%. A starting capital of $100,000 at inception on 7/1/2014 would have grown to $202,643 which includes $685 cash and excludes $2,508 spent on fees and slippage. |
|
|
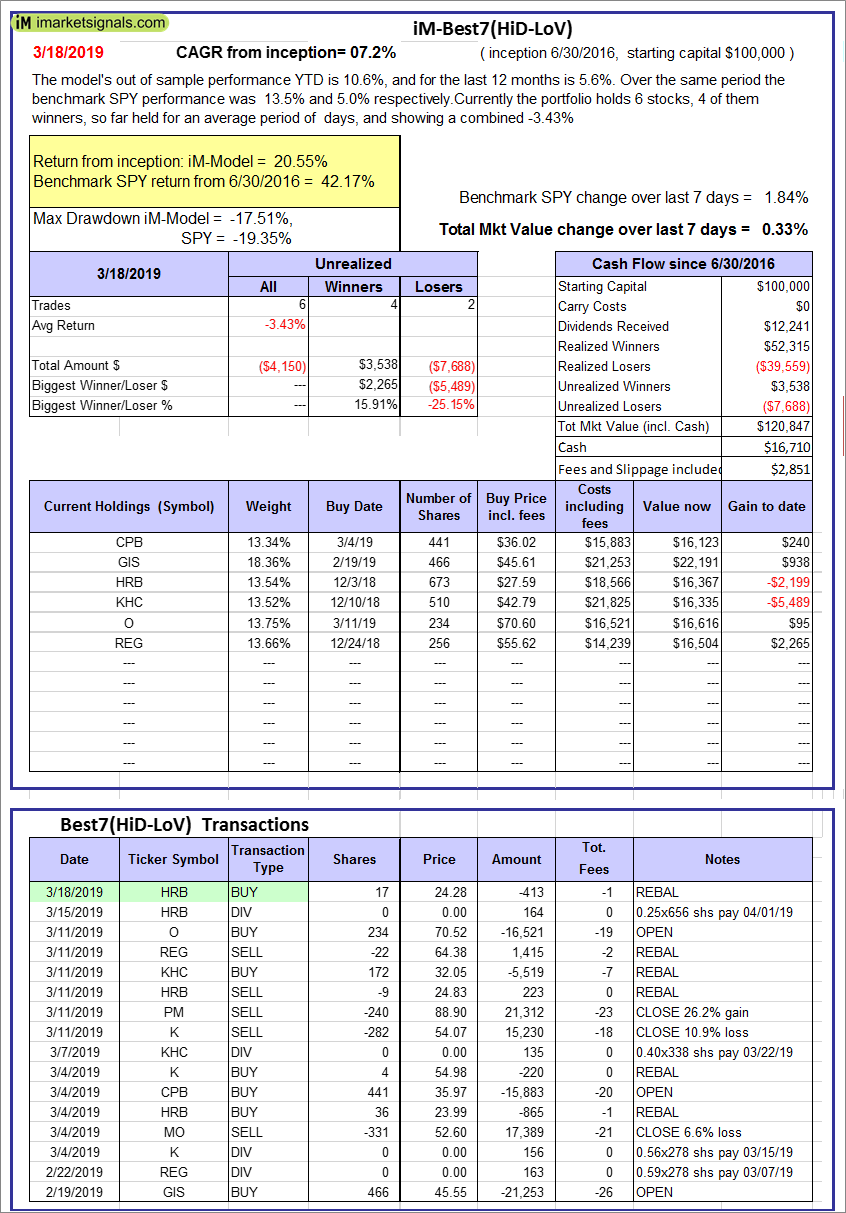
iM-Best7(HiD-LoV): The model’s out of sample performance YTD is 10.6%, and for the last 12 months is 5.6%. Over the same period the benchmark SPY performance was 13.5% and 5.0% respectively. Over the previous week the market value of iM-BESTOGA-3 gained 0.33% at a time when SPY gained 1.84%. A starting capital of $100,000 at inception on 6/30/2016 would have grown to $120,847 which includes $16,710 cash and excludes $2,851 spent on fees and slippage. |
|
|
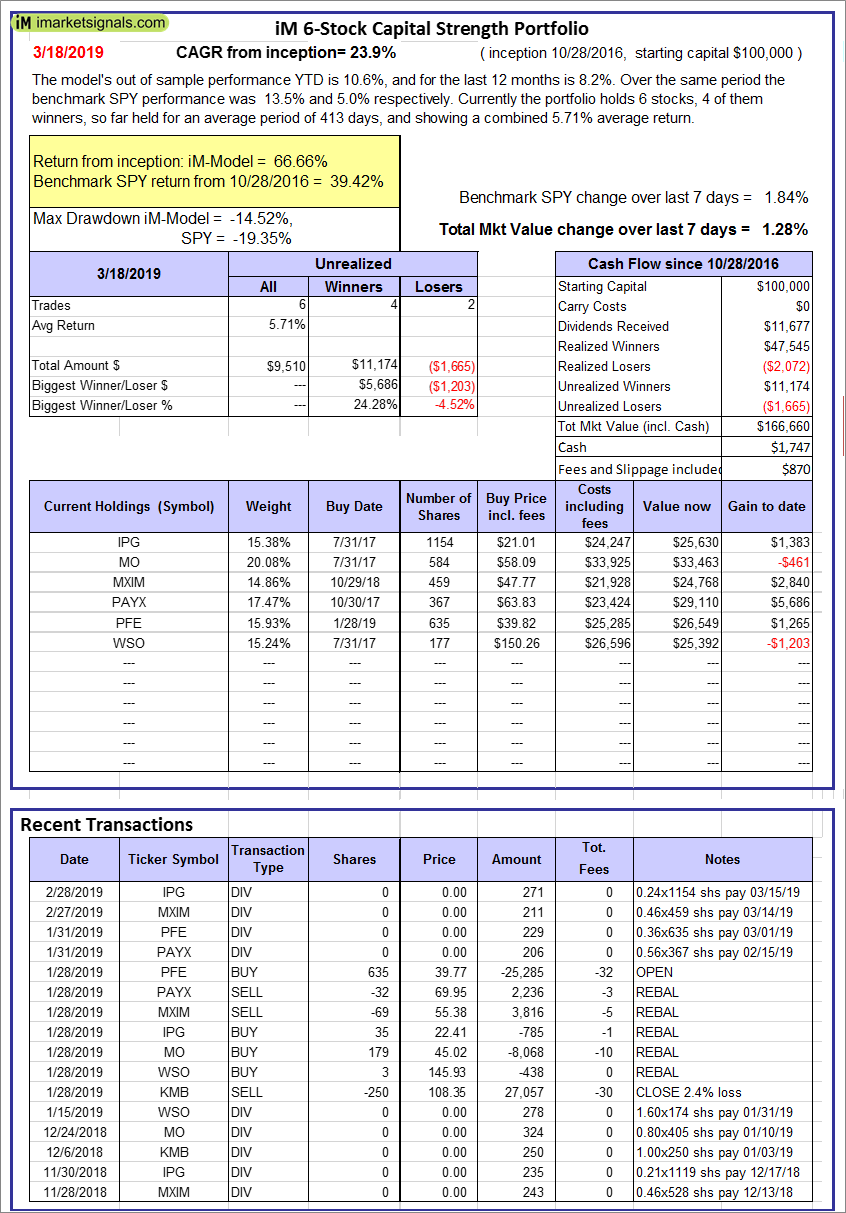
iM 6-Stock Capital Strength Portfolio: The model’s out of sample performance YTD is 10.6%, and for the last 12 months is 8.2%. Over the same period the benchmark SPY performance was 13.5% and 5.0% respectively. Over the previous week the market value of the iM 6-Stock Capital Strength Portfolio gained 1.28% at a time when SPY gained 1.84%. A starting capital of $100,000 at inception on 10/28/2016 would have grown to $166,660 which includes $1,747 cash and excludes $870 spent on fees and slippage. |
|
|
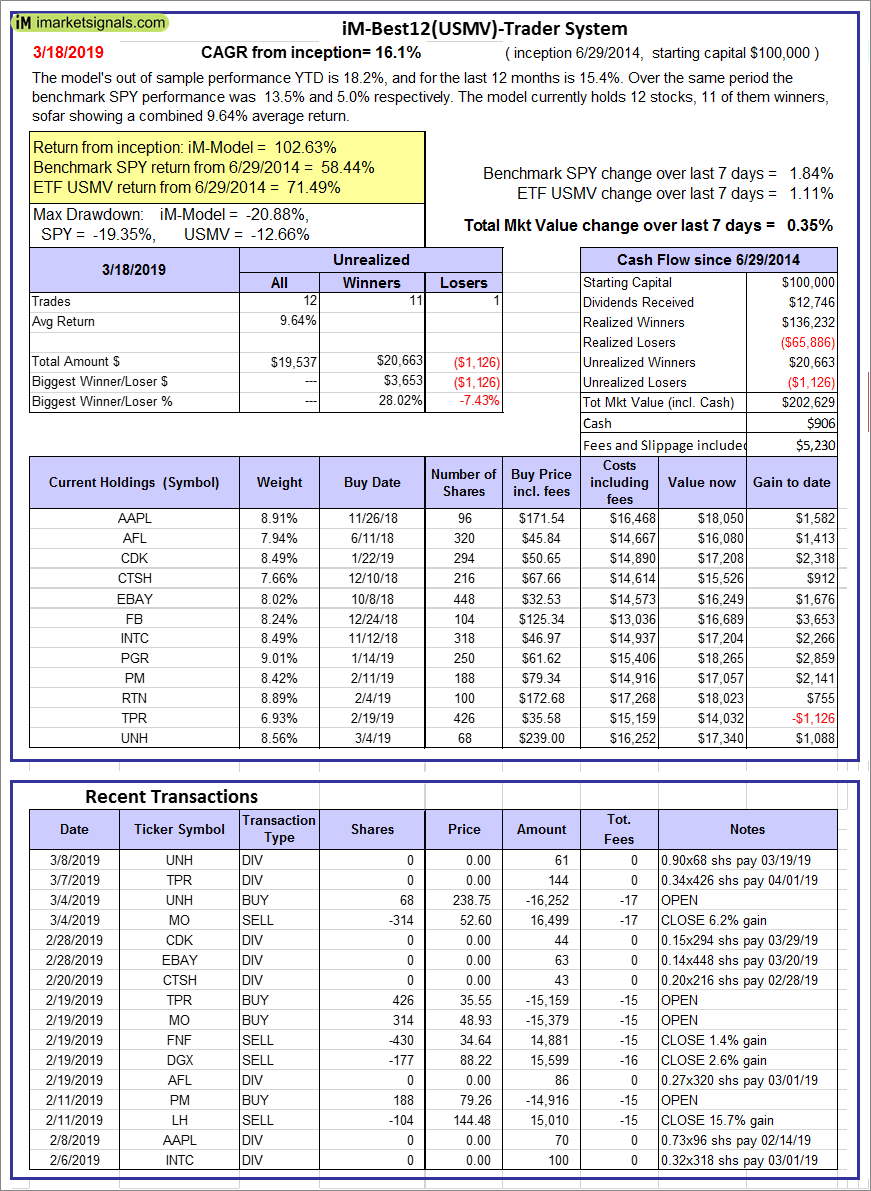
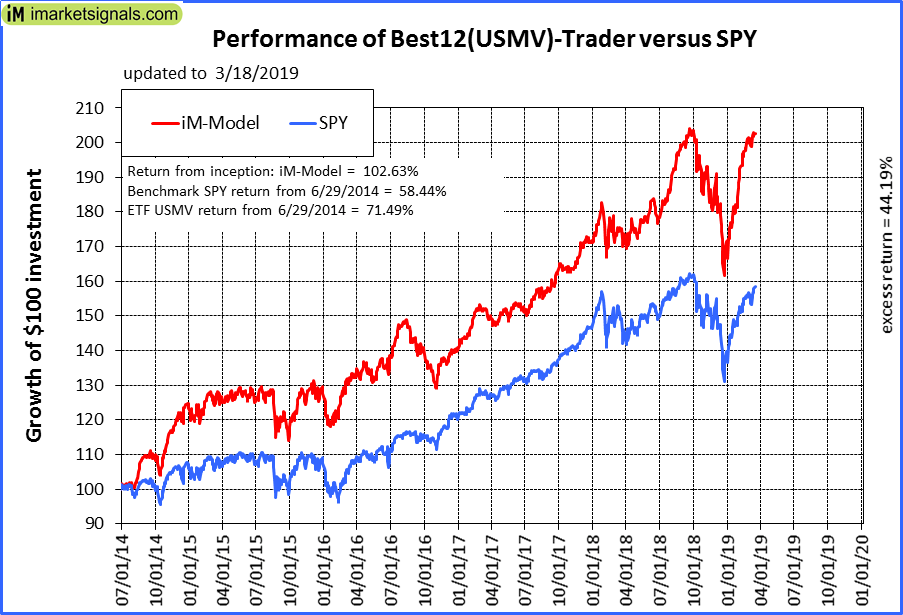
iM-Best12(USMV)-Trader: The model’s out of sample performance YTD is 18.2%, and for the last 12 months is 15.4%. Over the same period the benchmark SPY performance was 13.5% and 5.0% respectively. Since inception, on 6/30/2014, the model gained 102.63% while the benchmark SPY gained 58.44% and the ETF USMV gained 71.49% over the same period. Over the previous week the market value of iM-Best12(USMV)-Trader gained 0.35% at a time when SPY gained 1.84%. A starting capital of $100,000 at inception on 6/30/2014 would have grown to $202,629 which includes $906 cash and excludes $5,230 spent on fees and slippage. |
|
|
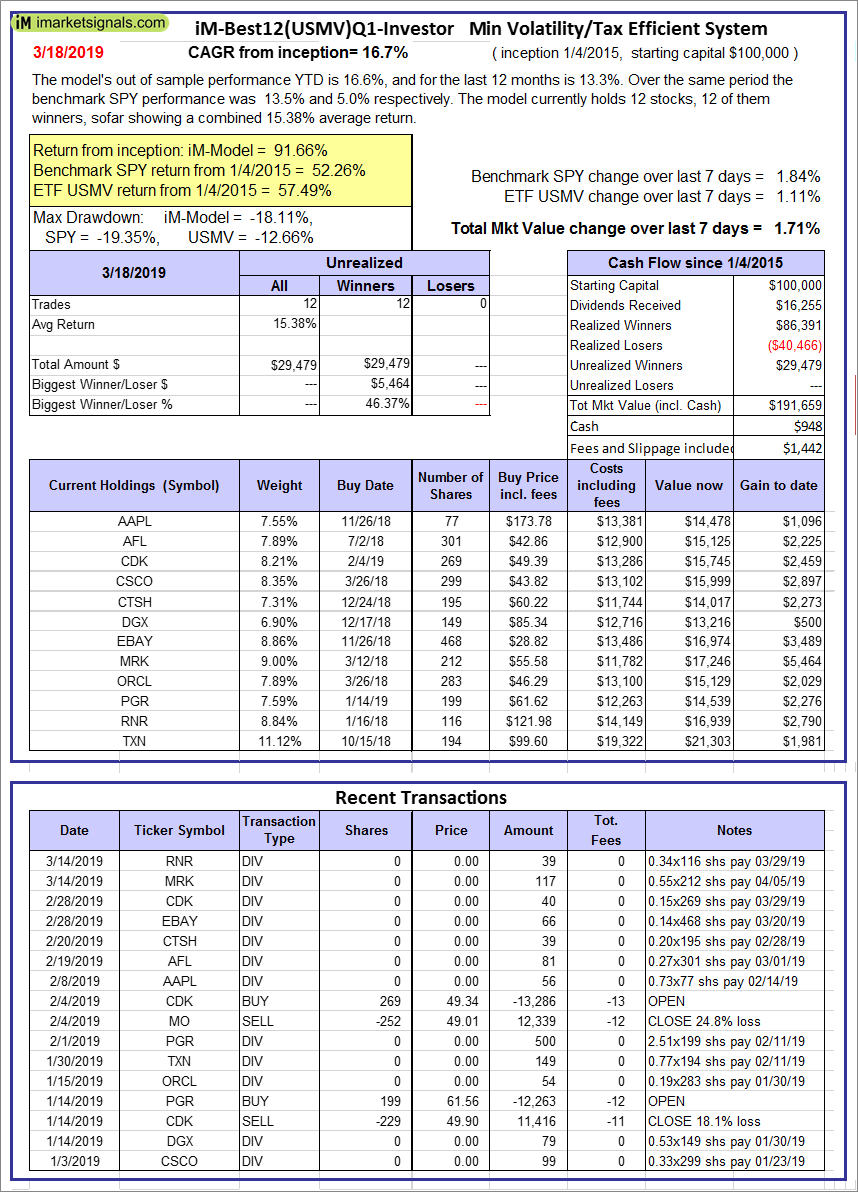
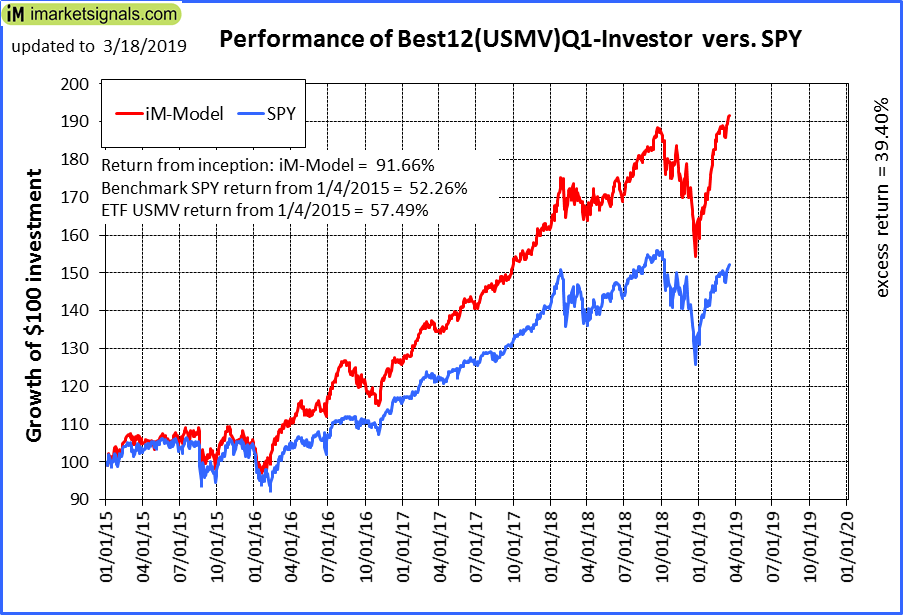
iM-Best12(USMV)Q1-Investor: The model’s out of sample performance YTD is 16.6%, and for the last 12 months is 13.3%. Over the same period the benchmark SPY performance was 13.5% and 5.0% respectively. Since inception, on 1/5/2015, the model gained 91.66% while the benchmark SPY gained 52.26% and the ETF USMV gained 57.49% over the same period. Over the previous week the market value of iM-Best12(USMV)Q1 gained 1.71% at a time when SPY gained 1.84%. A starting capital of $100,000 at inception on 1/5/2015 would have grown to $191,659 which includes $948 cash and excludes $1,442 spent on fees and slippage. |
|
|
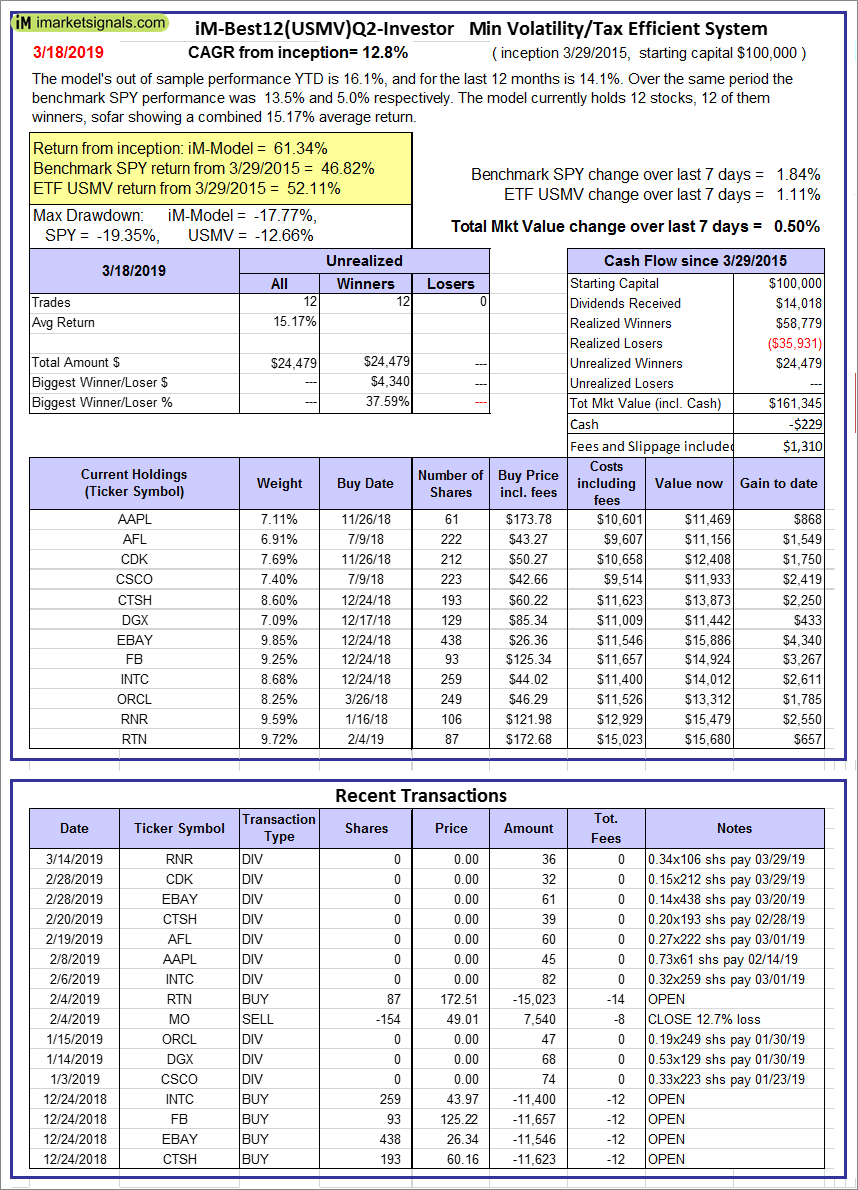
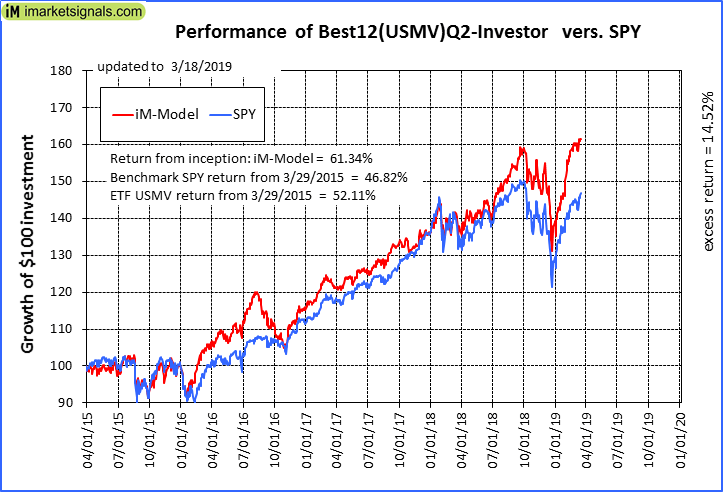
iM-Best12(USMV)Q2-Investor: The model’s out of sample performance YTD is 16.1%, and for the last 12 months is 14.1%. Over the same period the benchmark SPY performance was 13.5% and 5.0% respectively. Since inception, on 3/30/2015, the model gained 61.34% while the benchmark SPY gained 46.82% and the ETF USMV gained 52.11% over the same period. Over the previous week the market value of iM-Best12(USMV)Q2 gained 0.50% at a time when SPY gained 1.84%. A starting capital of $100,000 at inception on 3/30/2015 would have grown to $161,345 which includes -$229 cash and excludes $1,310 spent on fees and slippage. |
|
|
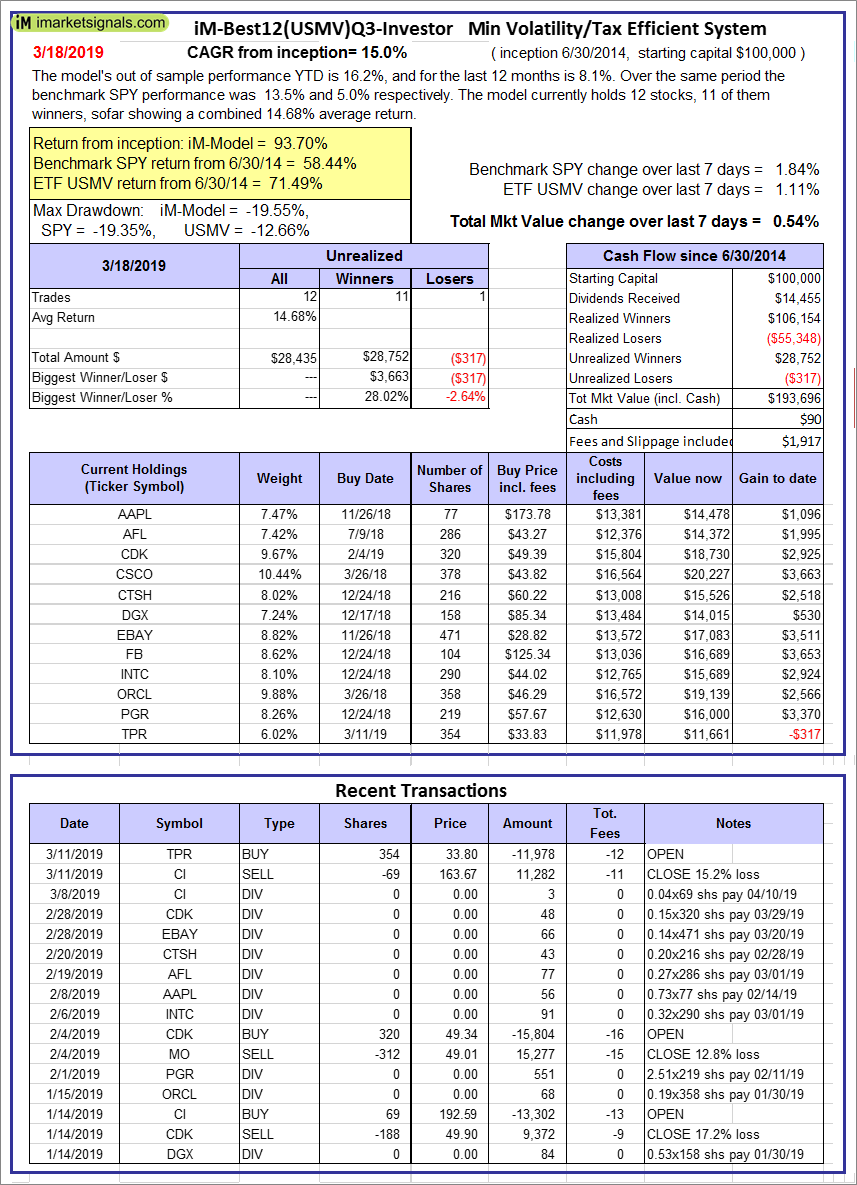
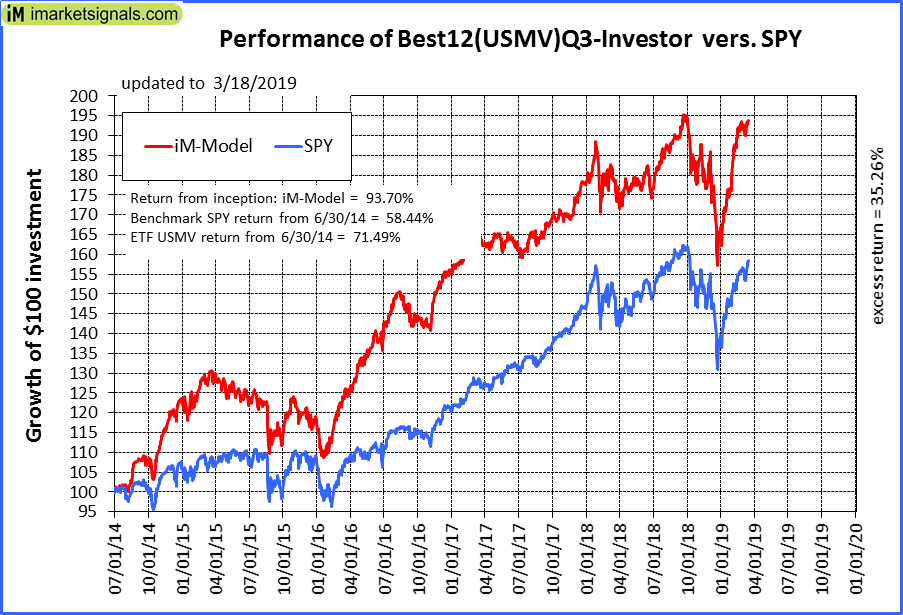
iM-Best12(USMV)Q3-Investor: The model’s out of sample performance YTD is 16.2%, and for the last 12 months is 8.1%. Over the same period the benchmark SPY performance was 13.5% and 5.0% respectively. Since inception, on 7/1/2014, the model gained 93.70% while the benchmark SPY gained 58.44% and the ETF USMV gained 71.49% over the same period. Over the previous week the market value of iM-Best12(USMV)Q3 gained 0.54% at a time when SPY gained 1.84%. A starting capital of $100,000 at inception on 7/1/2014 would have grown to $193,696 which includes $90 cash and excludes $1,917 spent on fees and slippage. |
|
|
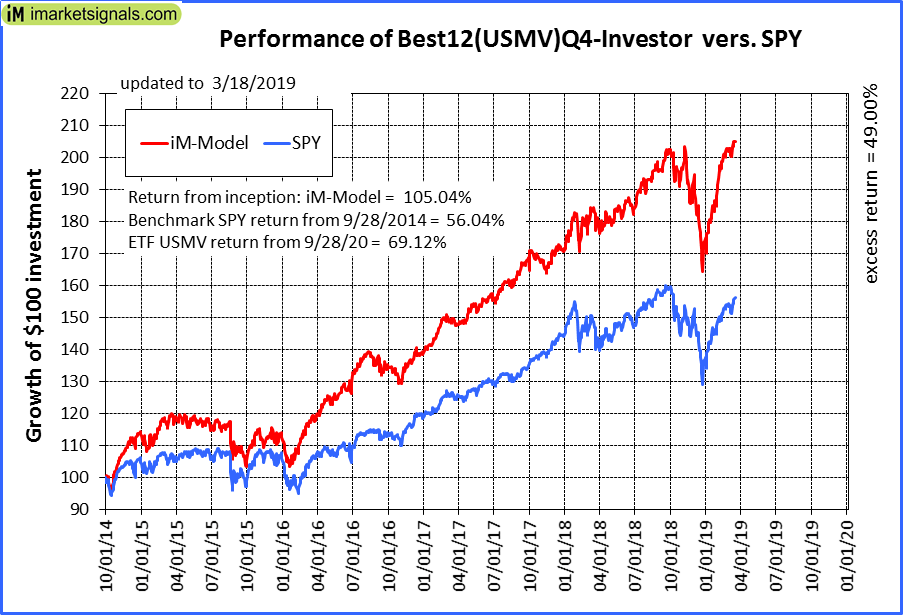
iM-Best12(USMV)Q4-Investor: Since inception, on 9/29/2014, the model gained 105.04% while the benchmark SPY gained 56.04% and the ETF USMV gained 69.12% over the same period. Over the previous week the market value of iM-Best12(USMV)Q4 gained 0.85% at a time when SPY gained 1.84%. A starting capital of $100,000 at inception on 9/29/2014 would have grown to $205,037 which includes $150 cash and excludes $1,723 spent on fees and slippage. |
|
|
Average Performance of iM-Best12(USMV)Q1+Q2+Q3+Q4-Investor resulted in an excess return of 54.32% over SPY. (see iM-USMV Investor Portfolio) |
|
|
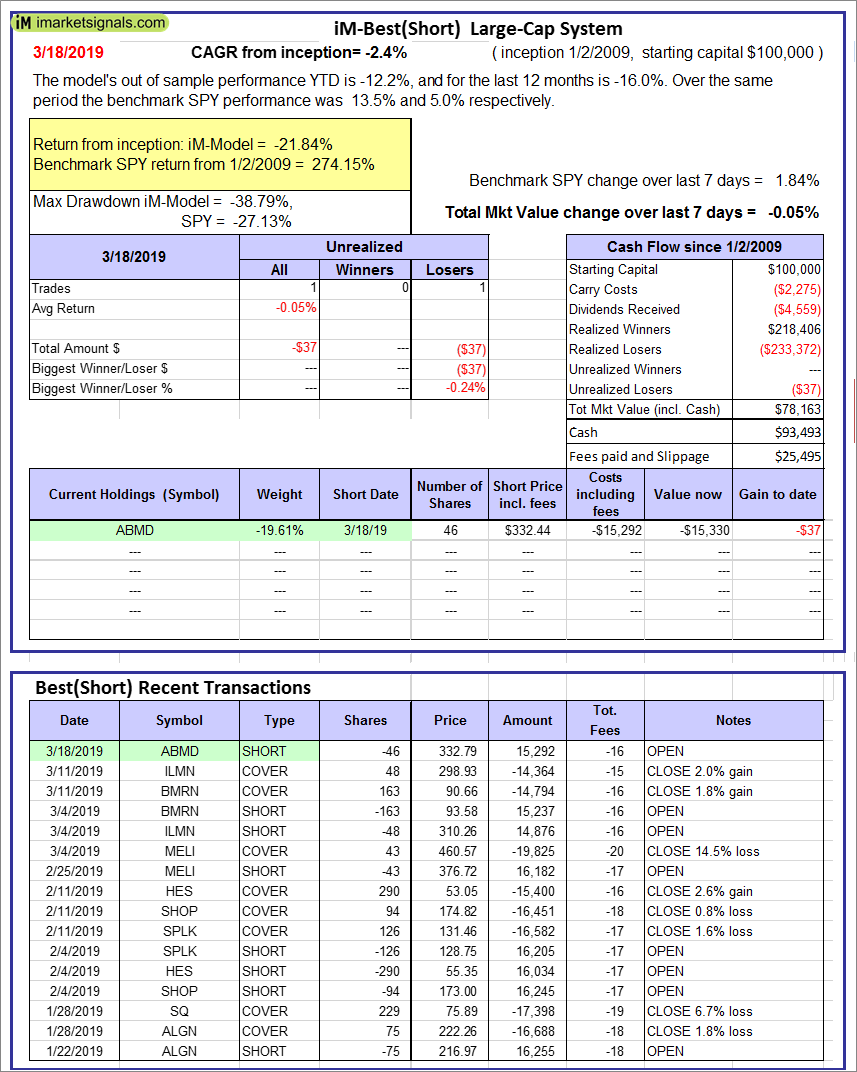
iM-Best(Short): The model’s out of sample performance YTD is -12.2%, and for the last 12 months is -16.0%. Over the same period the benchmark SPY performance was 13.5% and 5.0% respectively. Over the previous week the market value of iM-Best(Short) gained -0.05% at a time when SPY gained 1.84%. Over the period 1/2/2009 to 3/18/2019 the starting capital of $100,000 would have grown to $78,163 which includes $93,493 cash and excludes $25,495 spent on fees and slippage. |
|
|
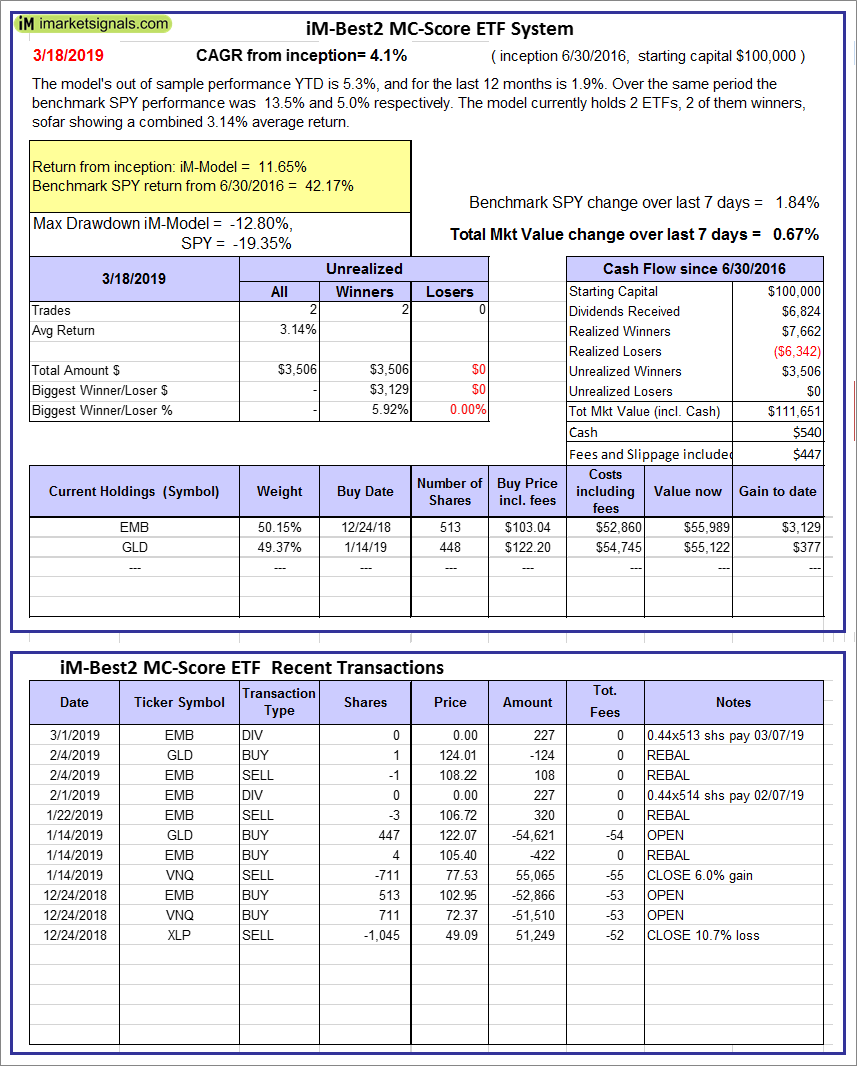
iM-Best2 MC-Score ETF System: The model’s out of sample performance YTD is 5.3%, and for the last 12 months is 1.9%. Over the same period the benchmark SPY performance was 13.5% and 5.0% respectively. Over the previous week the market value of the iM-Best2 MC-Score ETF System gained 0.67% at a time when SPY gained 1.84%. A starting capital of $100,000 at inception on 6/30/2016 would have grown to $111,651 which includes $540 cash and excludes $447 spent on fees and slippage. |
|
|
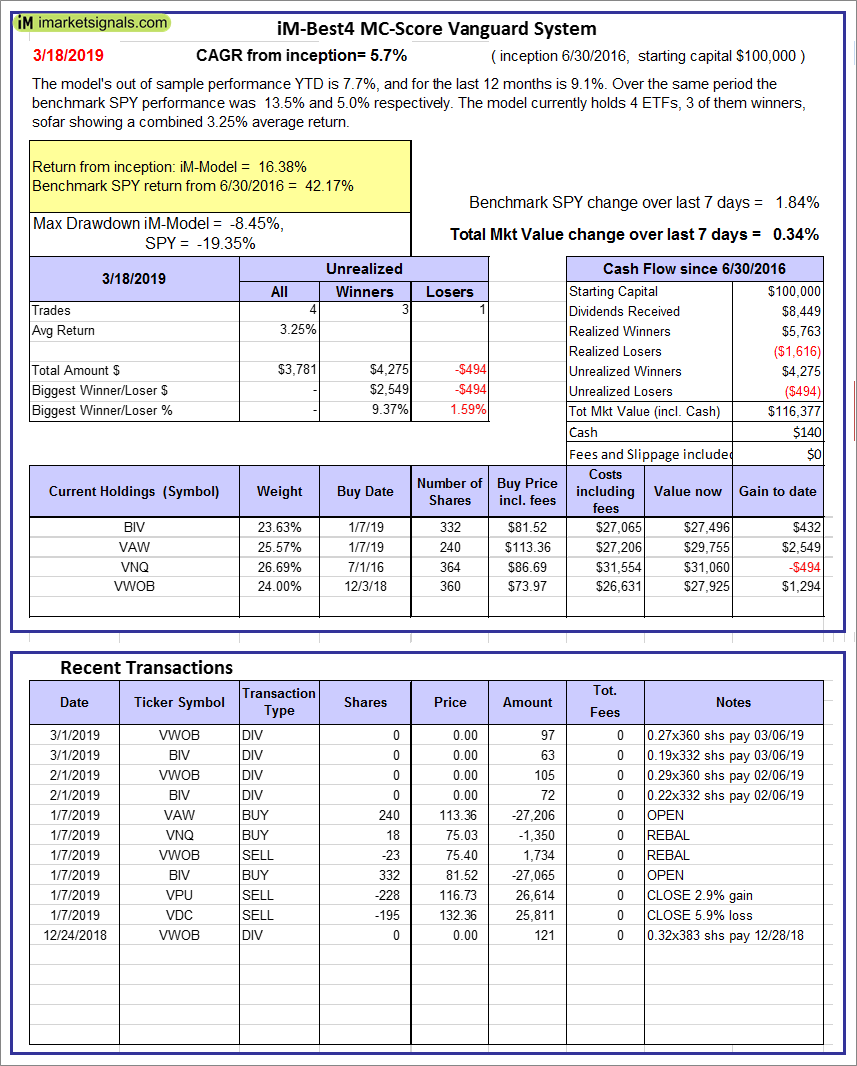
iM-Best4 MC-Score Vanguard System: The model’s out of sample performance YTD is 7.7%, and for the last 12 months is 9.1%. Over the same period the benchmark SPY performance was 13.5% and 5.0% respectively. Over the previous week the market value of the iM-Best4 MC-Score Vanguard System gained 0.34% at a time when SPY gained 1.84%. A starting capital of $100,000 at inception on 6/30/2016 would have grown to $116,377 which includes $140 cash and excludes $00 spent on fees and slippage. |
|
|
iM-Composite (SH-RSP) Timer: The model’s out of sample performance YTD is 14.2%, and for the last 12 months is 3.7%. Over the same period the benchmark SPY performance was 13.5% and 5.0% respectively. Over the previous week the market value of the iM-Composite (SH-RSP) Timer gained 1.57% at a time when SPY gained 1.84%. A starting capital of $100,000 at inception on 6/30/2016 would have grown to $137,208 which includes $5,116 cash and excludes $513 spent on fees and slippage. |
|
|
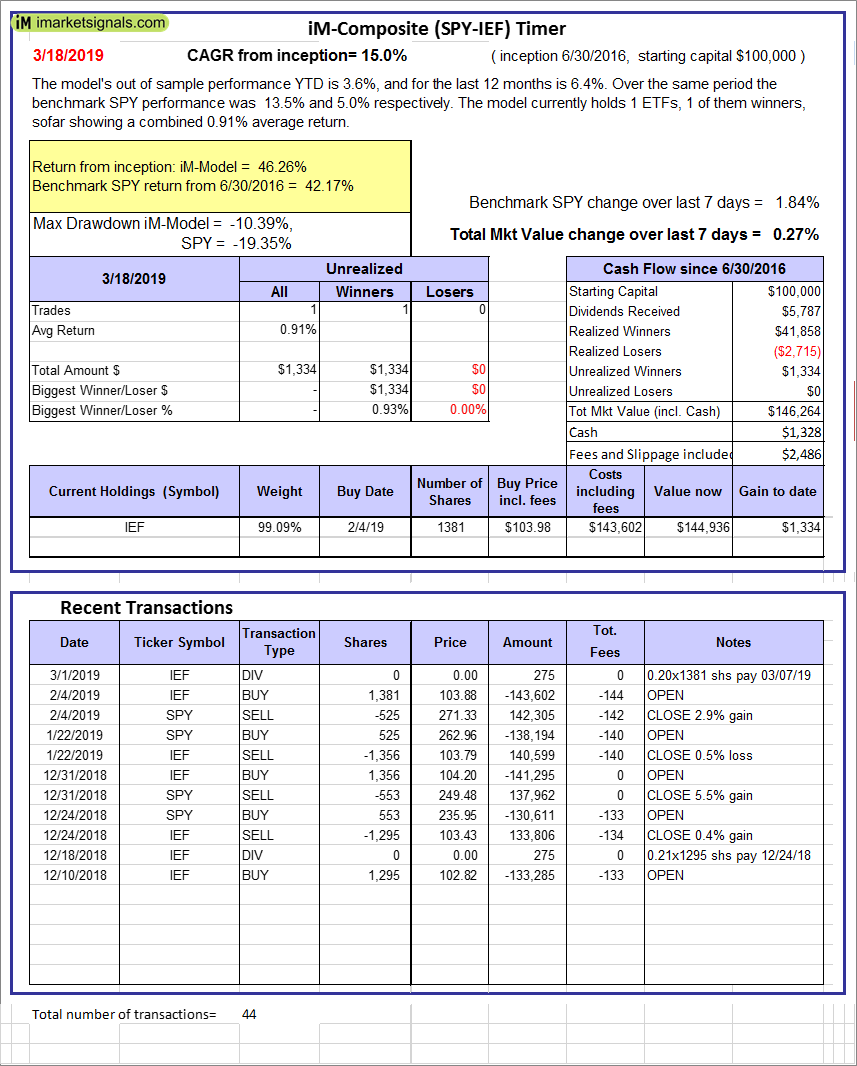
iM-Composite (SPY-IEF) Timer: The model’s out of sample performance YTD is 3.6%, and for the last 12 months is 6.4%. Over the same period the benchmark SPY performance was 13.5% and 5.0% respectively. Over the previous week the market value of the iM-Composite (SPY-IEF) Timer gained 0.27% at a time when SPY gained 1.84%. A starting capital of $100,000 at inception on 6/30/2016 would have grown to $146,264 which includes $1,328 cash and excludes $2,486 spent on fees and slippage. |
|
|
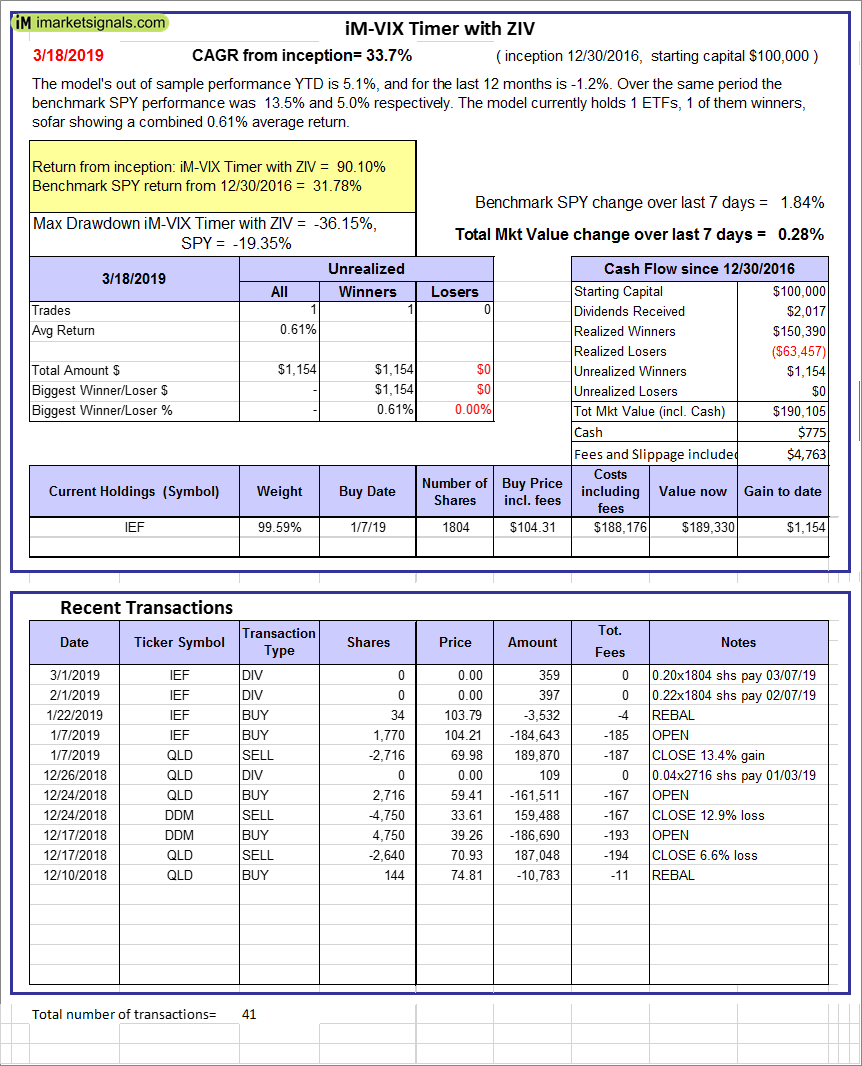
iM-VIX Timer with ZIV: The model’s out of sample performance YTD is 5.1%, and for the last 12 months is -1.2%. Over the same period the benchmark SPY performance was 13.5% and 5.0% respectively. Over the previous week the market value of the iM-VIX Timer with ZIV gained 0.28% at a time when SPY gained 1.84%. A starting capital of $100,000 at inception on 6/30/2016 would have grown to $190,105 which includes $775 cash and excludes $4,763 spent on fees and slippage. |
|
|
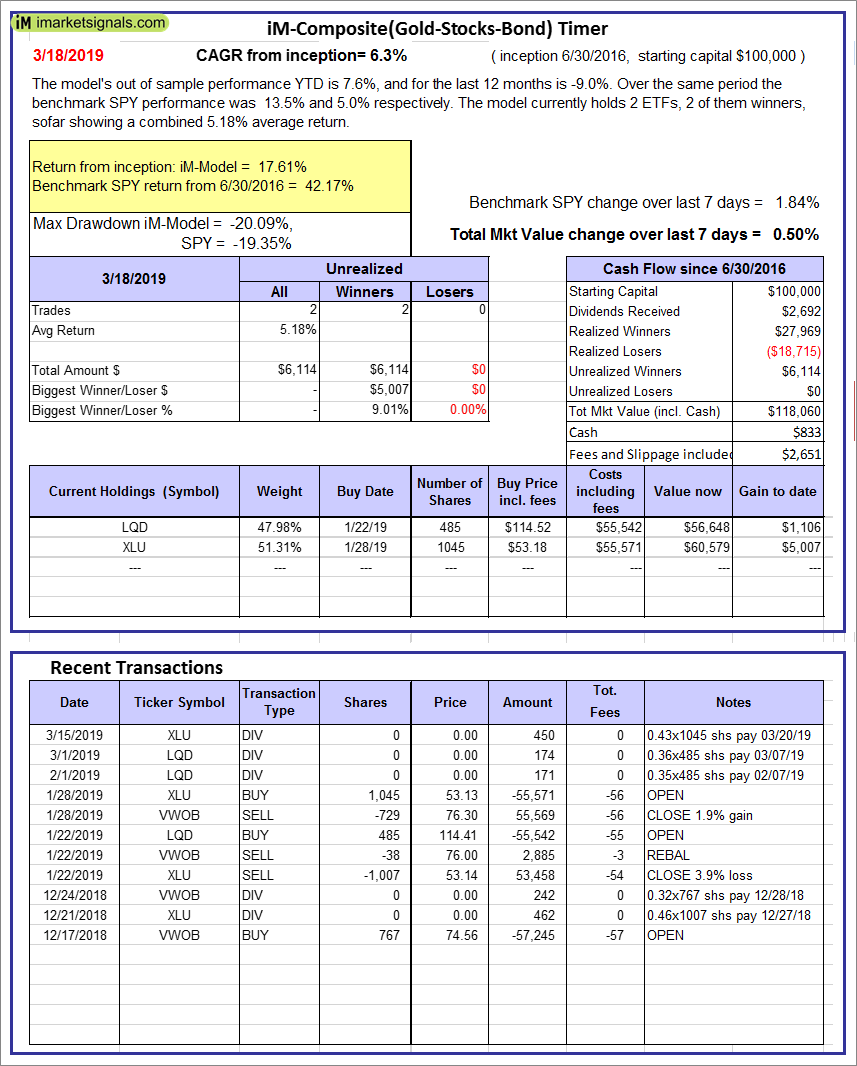
iM-Composite(Gold-Stocks-Bond) Timer: The model’s out of sample performance YTD is 7.6%, and for the last 12 months is -9.0%. Over the same period the benchmark SPY performance was 13.5% and 5.0% respectively. Over the previous week the market value of the iM-Composite(Gold-Stocks-Bond) Timer gained 0.50% at a time when SPY gained 1.84%. A starting capital of $100,000 at inception on 6/30/2016 would have grown to $118,060 which includes $833 cash and excludes $2,651 spent on fees and slippage. |
|
|
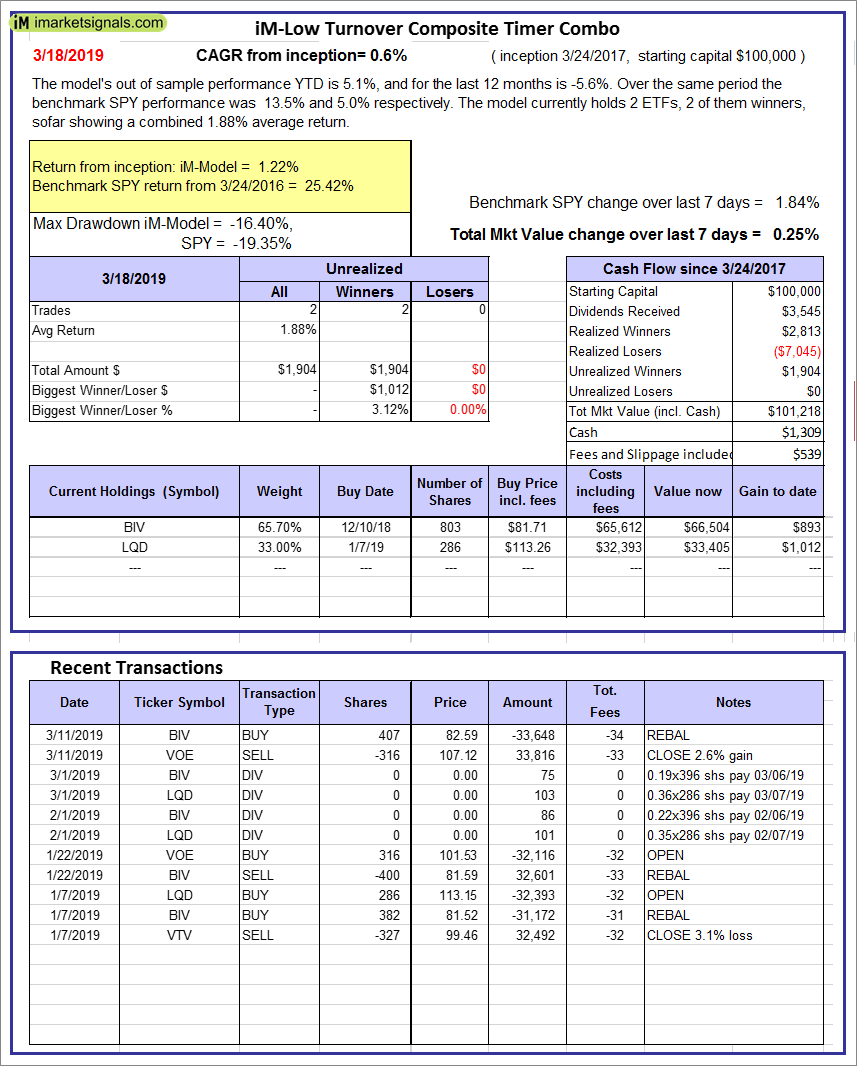
iM-Low Turnover Composite Timer Combo: The model’s out of sample performance YTD is 5.1%, and for the last 12 months is -5.6%. Over the same period the benchmark SPY performance was 13.5% and 5.0% respectively. Over the previous week the market value of the iM-Low Turnover Composite Timer Combo gained 0.25% at a time when SPY gained 1.84%. A starting capital of $100,000 at inception on 3/24/27 would have grown to $101,218 which includes $1,309 cash and excludes $539 spent on fees and slippage. |
|
|
iM-Min Drawdown Combo: The model’s out of sample performance YTD is 8.0%, and for the last 12 months is 1.3%. Over the same period the benchmark SPY performance was 13.5% and 5.0% respectively. Over the previous week the market value of the iM-Min Drawdown Combo gained 0.50% at a time when SPY gained 1.84%. A starting capital of $100,000 at inception on 4/5/2017 would have grown to $110,176 which includes $9,694 cash and excludes $831 spent on fees and slippage. |
|
|
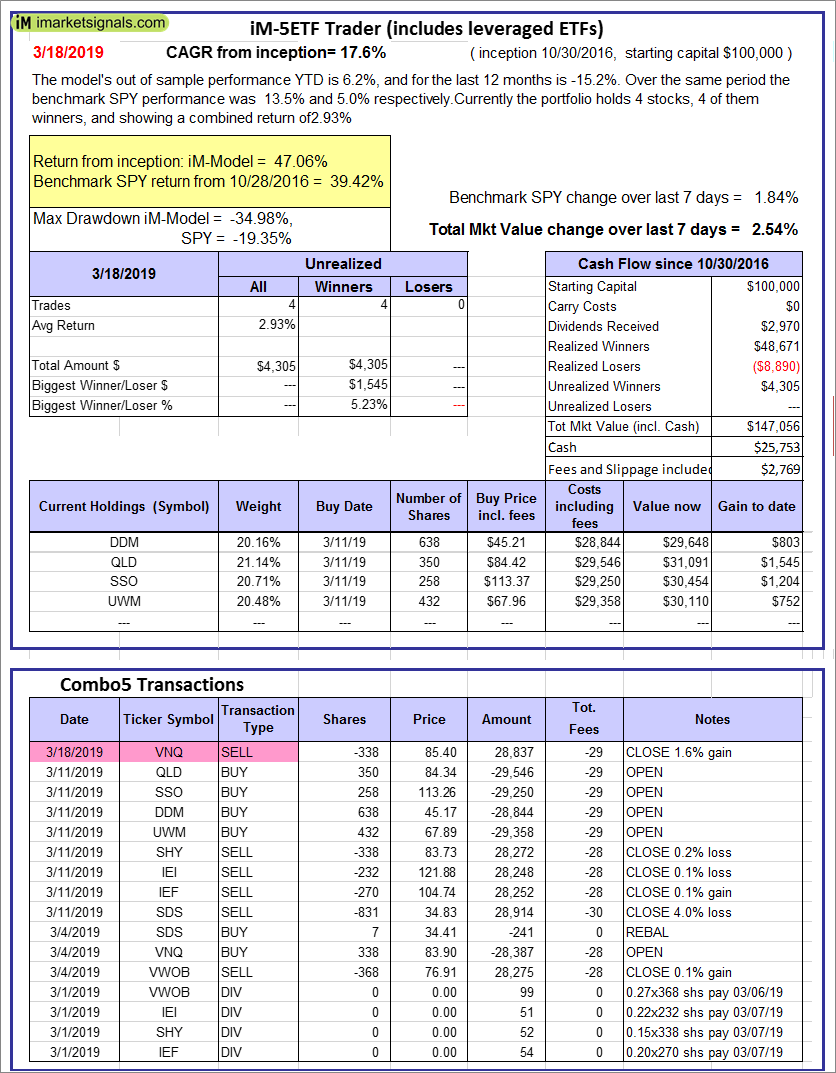
iM-5ETF Trader (includes leveraged ETFs): The model’s out of sample performance YTD is 6.2%, and for the last 12 months is -15.2%. Over the same period the benchmark SPY performance was 13.5% and 5.0% respectively. Over the previous week the market value of the iM-5ETF Trader (includes leveraged ETFs) gained 2.54% at a time when SPY gained 1.84%. A starting capital of $100,000 at inception on 10/30/2016 would have grown to $147,056 which includes $25,753 cash and excludes $2,769 spent on fees and slippage. |
|
|
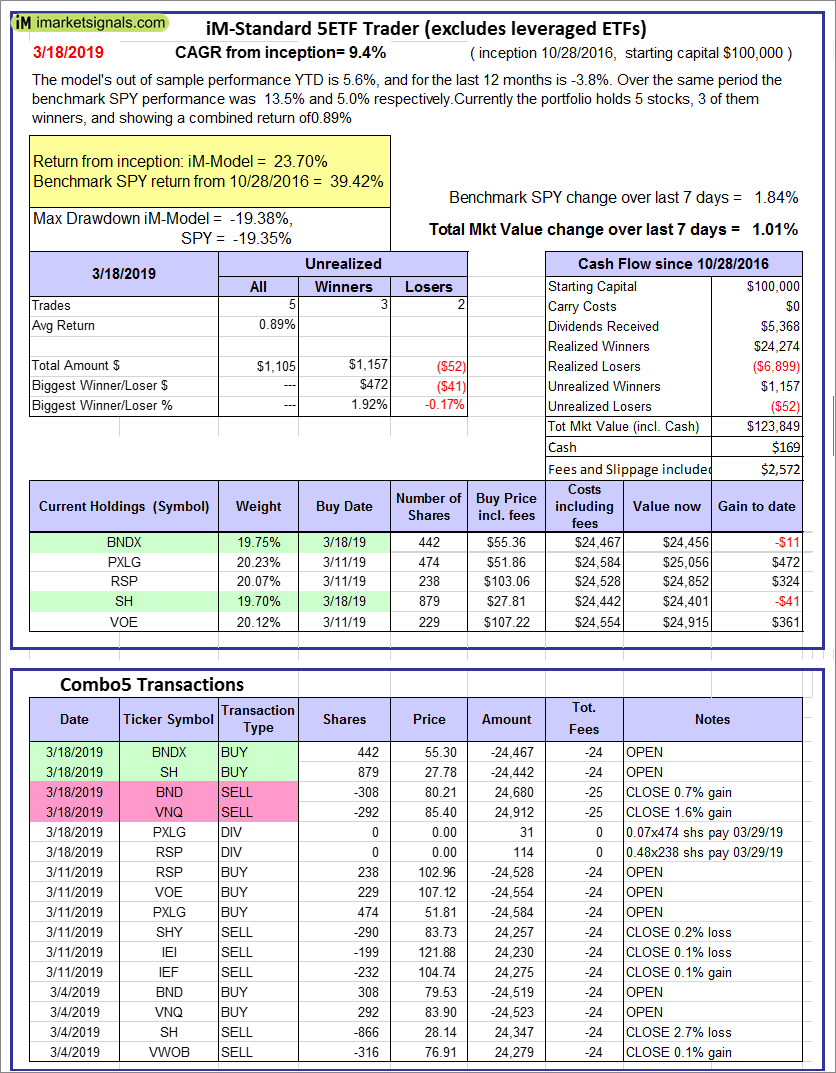
iM-Standard 5ETF Trader (excludes leveraged ETFs): The model’s out of sample performance YTD is 5.6%, and for the last 12 months is -3.8%. Over the same period the benchmark SPY performance was 13.5% and 5.0% respectively. Over the previous week the market value of the iM-Standard 5ETF Trader (excludes leveraged ETFs) gained 1.01% at a time when SPY gained 1.84%. A starting capital of $100,000 at inception on 10/30/2016 would have grown to $123,849 which includes $169 cash and excludes $2,572 spent on fees and slippage. |


Leave a Reply
You must be logged in to post a comment.