
  |
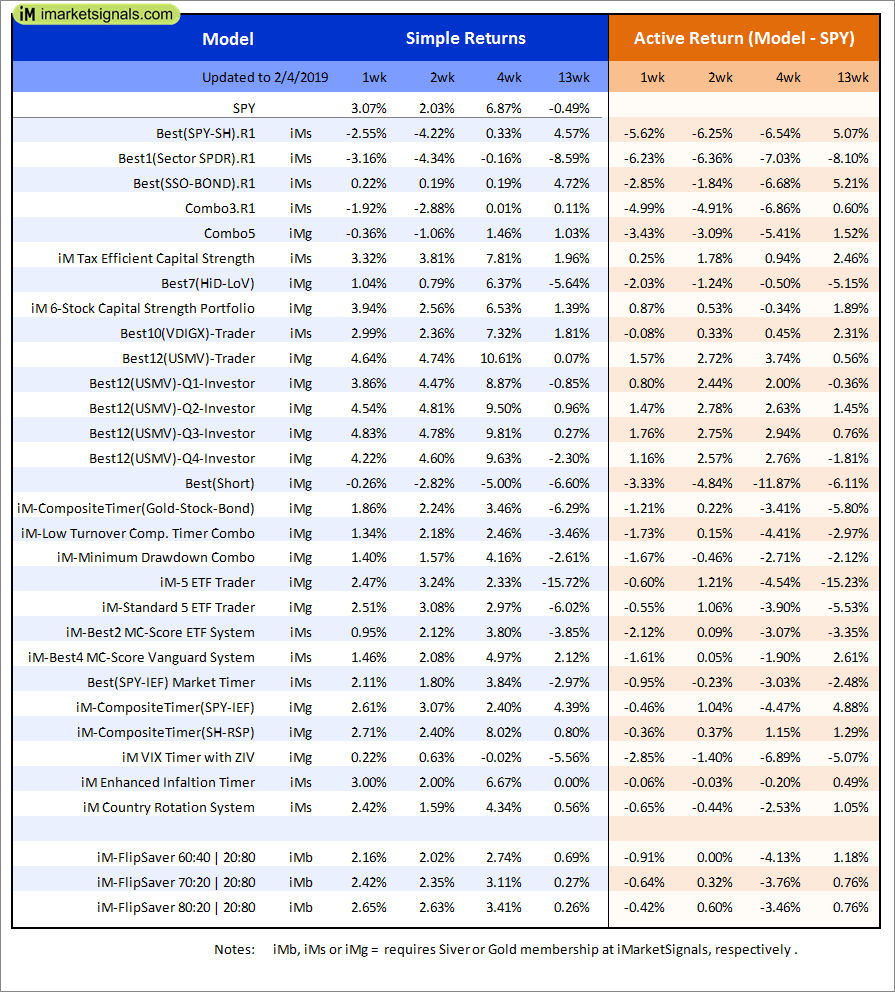
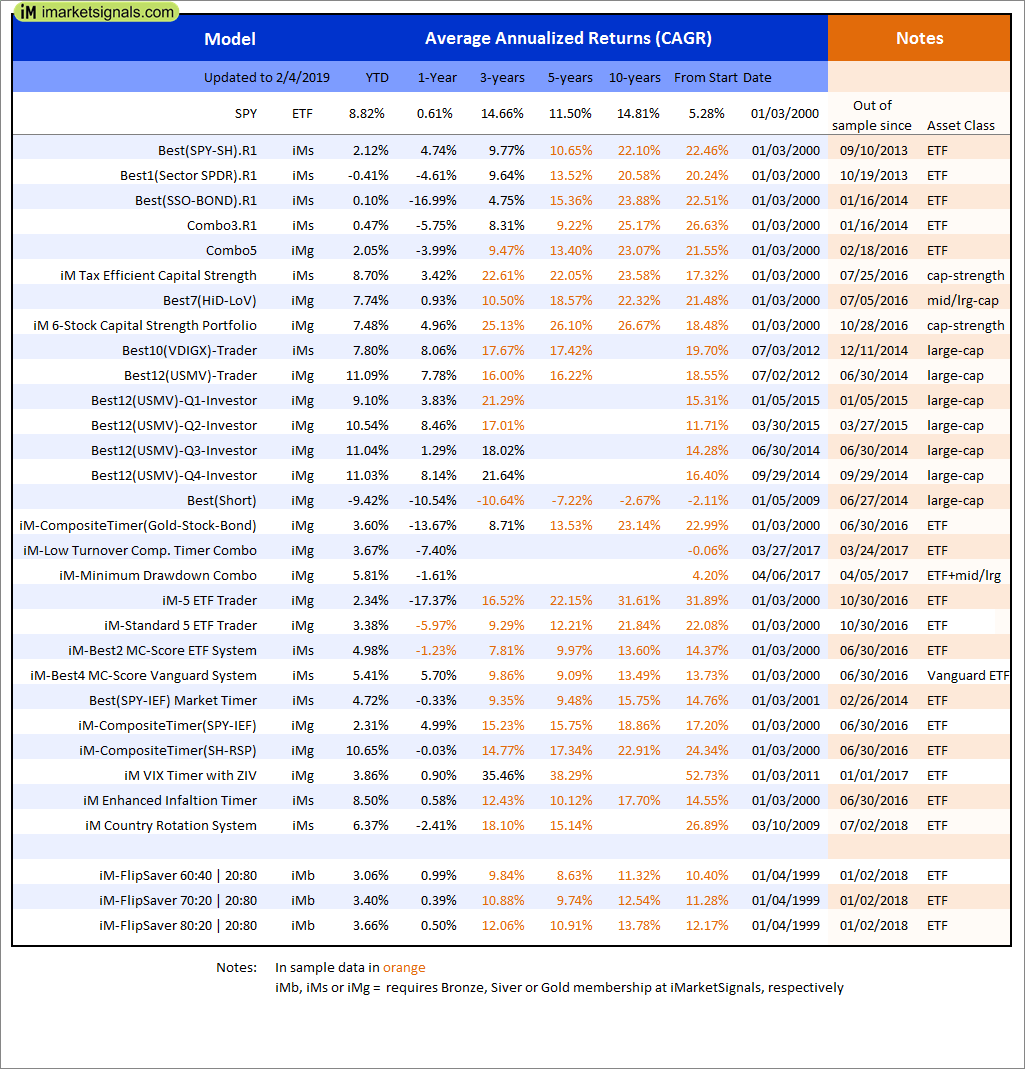
Out of sample performance summary of our models for the past 1, 2, 4 and 13 week periods. The active active return indicates how the models over- or underperformed the benchmark ETF SPY. Also the YTD, and the 1-, 3-, 5- and 10-year annualized returns are shown in the second table |
 |
iM-FlipSaver 60:40 | 20:80 – 2017: The model’s out of sample performance YTD is 3.2%, and for the last 12 months is 0.5%. Over the same period the benchmark SPY performance was 5.6% and 1.8% respectively. Over the previous week the market value of iM-FlipSaver 80:20 | 20:80 gained 2.25% at a time when SPY gained 2.02%. A starting capital of $100,000 at inception on 7/16/2015 would have grown to $115,531 which includes $37 cash and excludes $672 spent on fees and slippage. |
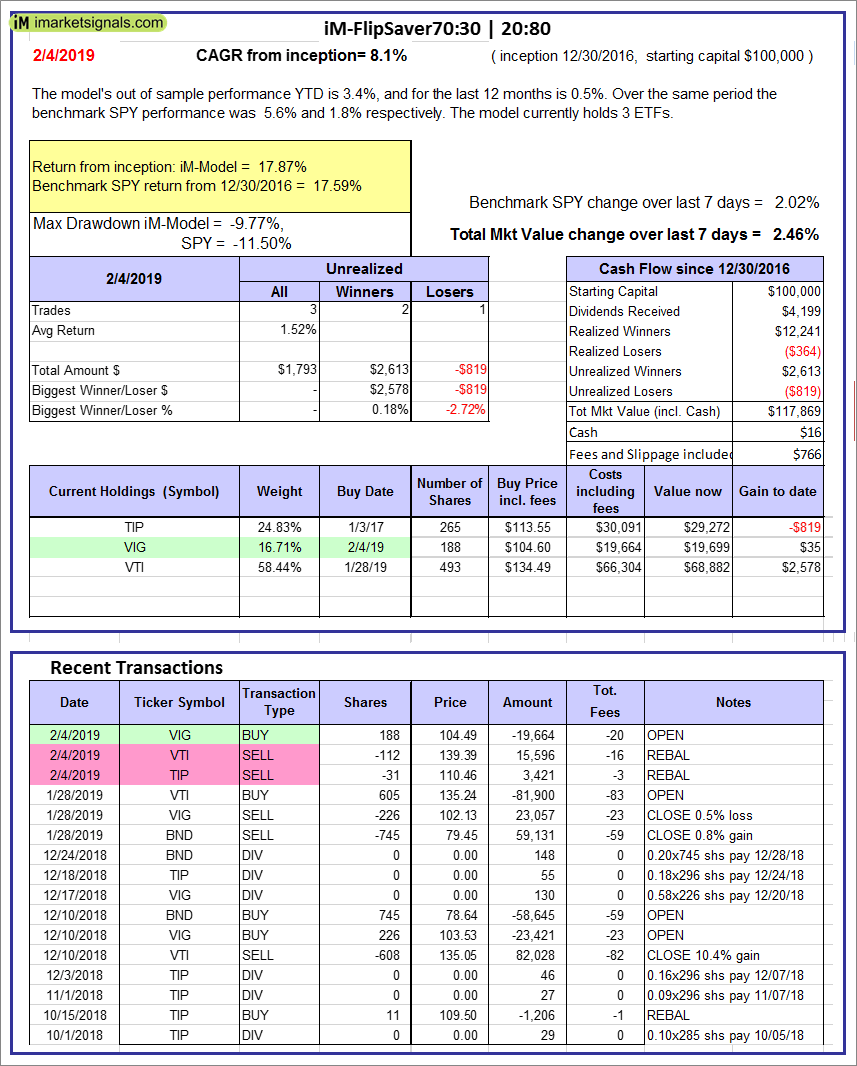 |
iM-FlipSaver 70:30 | 20:80 – 2017: The model’s out of sample performance YTD is 3.4%, and for the last 12 months is 0.5%. Over the same period the benchmark SPY performance was 5.6% and 1.8% respectively. Over the previous week the market value of iM-FlipSaver 70:30 | 20:80 gained 2.46% at a time when SPY gained 2.02%. A starting capital of $100,000 at inception on 7/15/2015 would have grown to $117,869 which includes $16 cash and excludes $766 spent on fees and slippage. |
 |
iM-FlipSaver 80:20 | 20:80 – 2017: The model’s out of sample performance YTD is 3.7%, and for the last 12 months is 0.5%. Over the same period the benchmark SPY performance was 5.6% and 1.8% respectively. Over the previous week the market value of iM-FlipSaver 80:20 | 20:80 gained 2.67% at a time when SPY gained 2.02%. A starting capital of $100,000 at inception on 1/2/2017 would have grown to $120,214 which includes -$21 cash and excludes $857 spent on fees and slippage. |
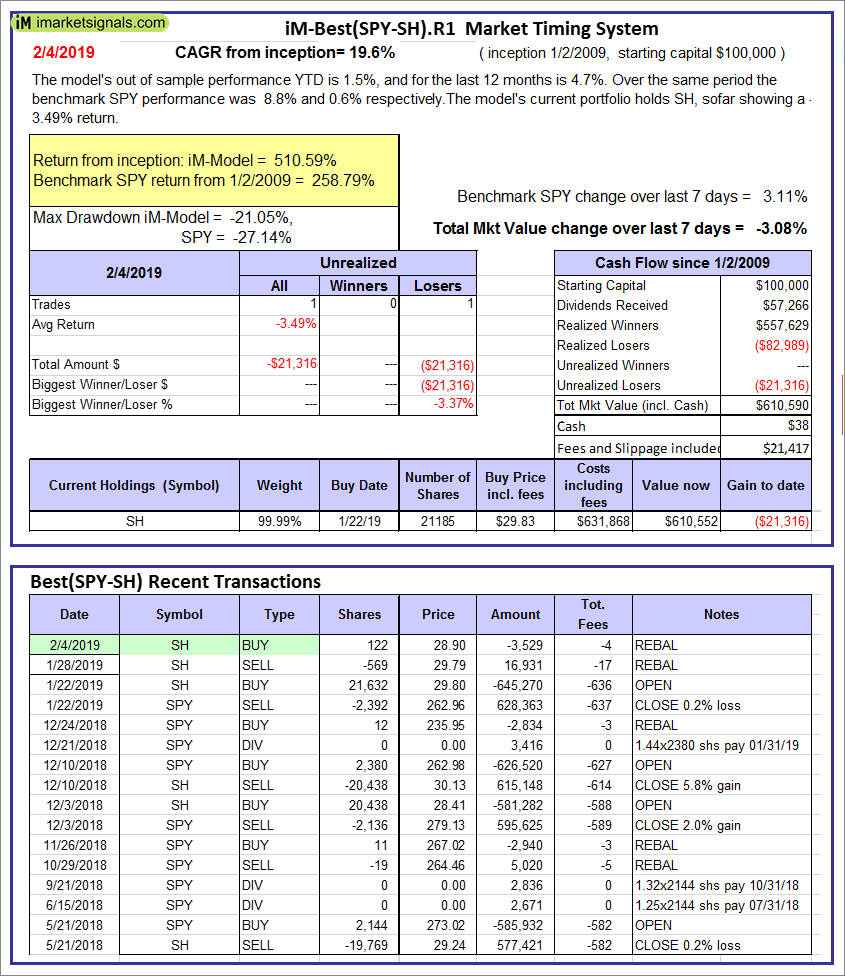 |
iM-Best(SPY-SH).R1: The model’s out of sample performance YTD is 1.5%, and for the last 12 months is 4.7%. Over the same period the benchmark SPY performance was 8.8% and 0.6% respectively. Over the previous week the market value of Best(SPY-SH) gained -3.08% at a time when SPY gained 3.11%. A starting capital of $100,000 at inception on 1/2/2009 would have grown to $610,590 which includes $38 cash and excludes $21,417 spent on fees and slippage. |
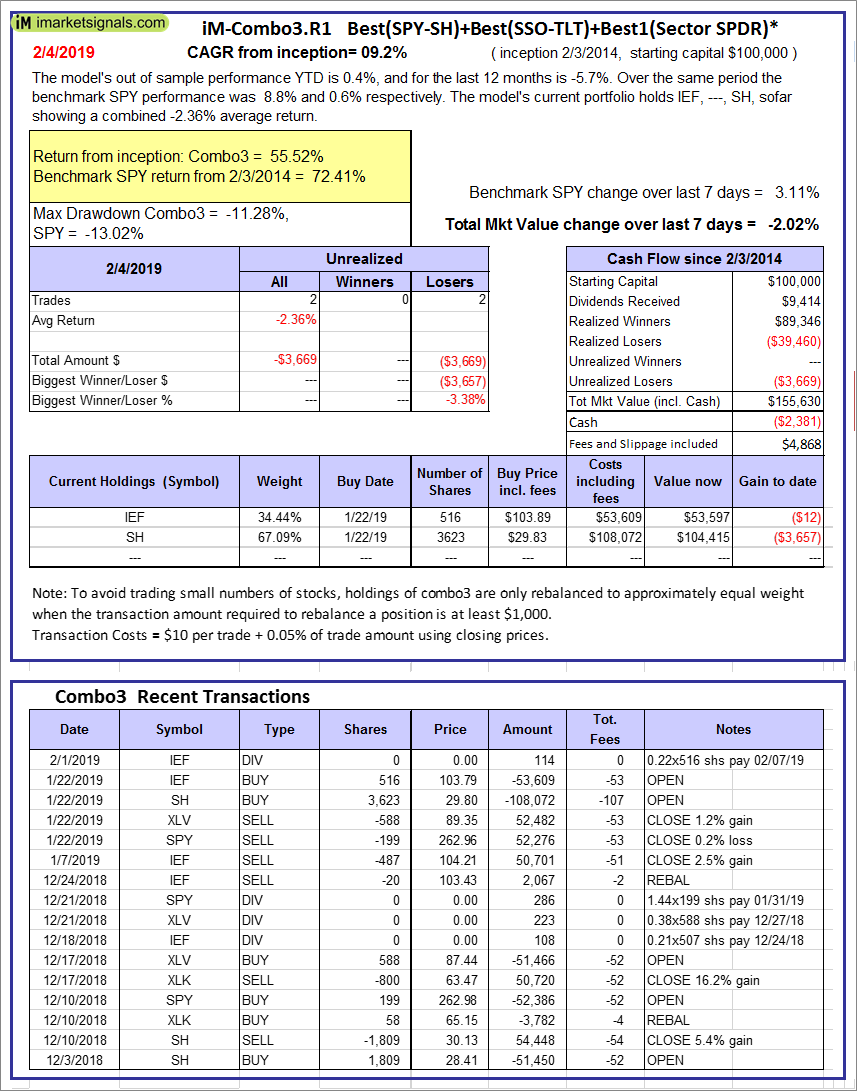 |
iM-Combo3.R1: The model’s out of sample performance YTD is 0.4%, and for the last 12 months is -5.7%. Over the same period the benchmark SPY performance was 8.8% and 0.6% respectively. Over the previous week the market value of iM-Combo3.R1 gained -2.02% at a time when SPY gained 3.11%. A starting capital of $100,000 at inception on 2/3/2014 would have grown to $155,630 which includes -$2,381 cash and excludes $4,868 spent on fees and slippage. |
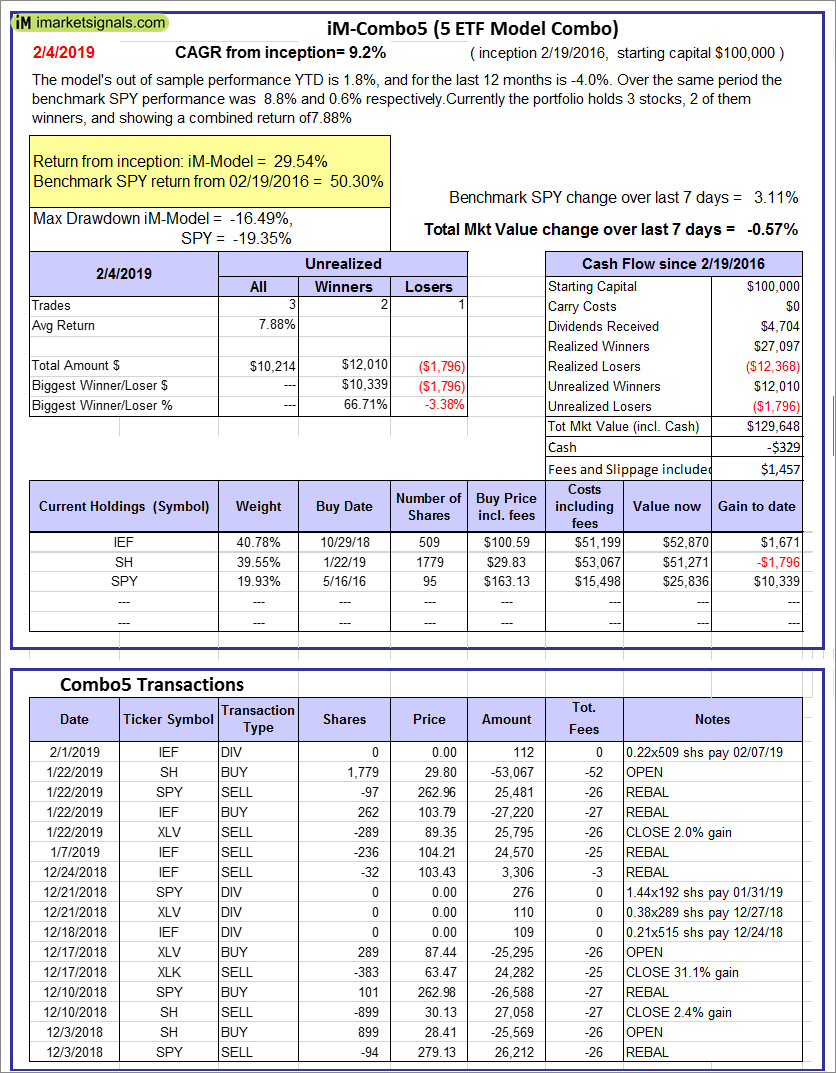 |
iM-Combo5: The model’s out of sample performance YTD is 1.8%, and for the last 12 months is -4.0%. Over the same period the benchmark SPY performance was 8.8% and 0.6% respectively. Over the previous week the market value of iM-Combo5 gained -0.57% at a time when SPY gained 3.11%. A starting capital of $100,000 at inception on 2/22/2016 would have grown to $129,648 which includes -$329 cash and excludes $1,457 spent on fees and slippage. |
 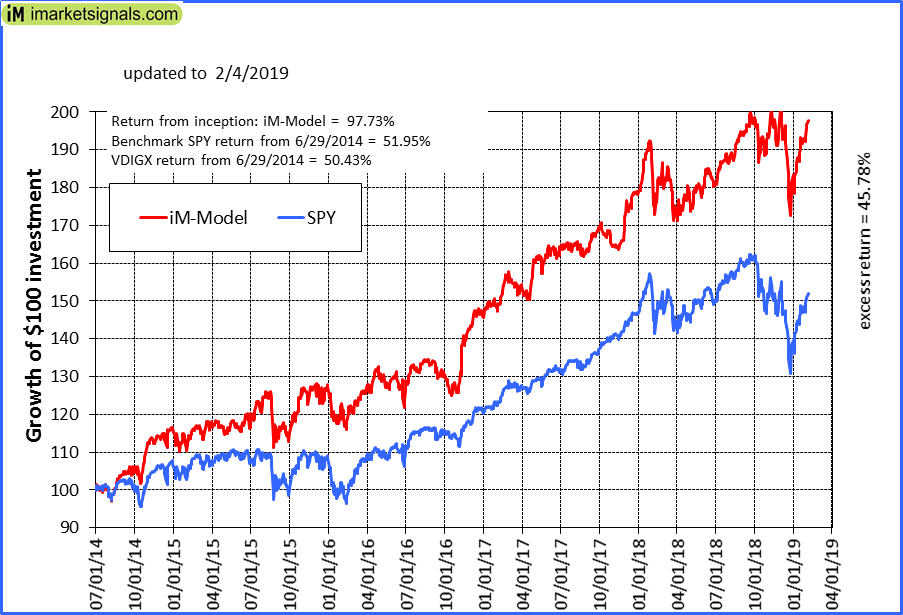 |
iM-Best10(VDIGX)-Trader: The model’s out of sample performance YTD is 7.8%, and for the last 12 months is 7.9%. Over the same period the benchmark SPY performance was 8.8% and 0.6% respectively. Since inception, on 7/1/2014, the model gained 97.73% while the benchmark SPY gained 51.95% and VDIGX gained 50.43% over the same period. Over the previous week the market value of iM-Best10(VDIGX) gained 2.84% at a time when SPY gained 3.11%. A starting capital of $100,000 at inception on 7/1/2014 would have grown to $197,727 which includes $517 cash and excludes $2,423 spent on fees and slippage. |
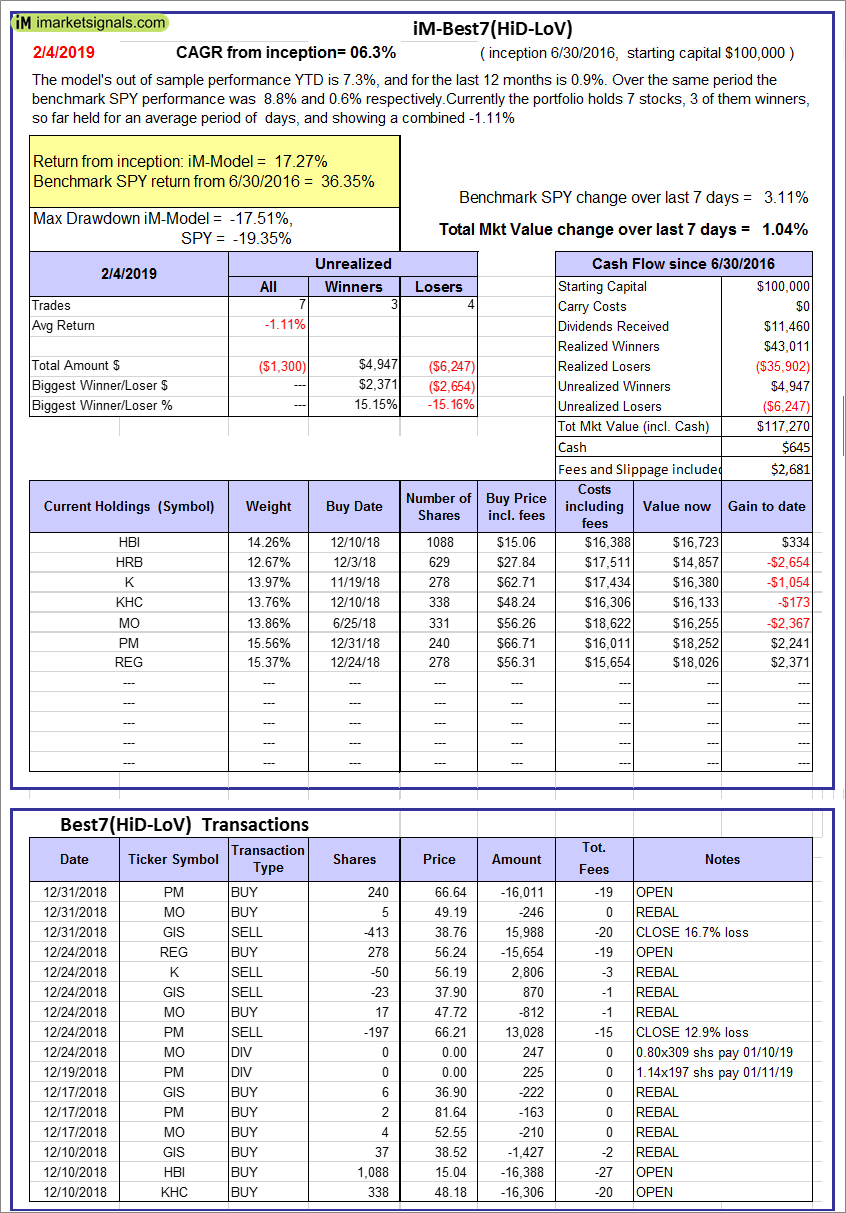 |
iM-Best7(HiD-LoV): The model’s out of sample performance YTD is 7.3%, and for the last 12 months is 0.9%. Over the same period the benchmark SPY performance was 8.8% and 0.6% respectively. Over the previous week the market value of iM-BESTOGA-3 gained 1.04% at a time when SPY gained 3.11%. A starting capital of $100,000 at inception on 6/30/2016 would have grown to $117,270 which includes $645 cash and excludes $2,681 spent on fees and slippage. |
 |
iM 6-Stock Capital Strength Portfolio: The model’s out of sample performance YTD is 7.1%, and for the last 12 months is 4.8%. Over the same period the benchmark SPY performance was 8.8% and 0.6% respectively. Over the previous week the market value of the iM 6-Stock Capital Strength Portfolio gained 3.75% at a time when SPY gained 3.11%. A starting capital of $100,000 at inception on 10/28/2016 would have grown to $161,292 which includes $1,265 cash and excludes $870 spent on fees and slippage. |
 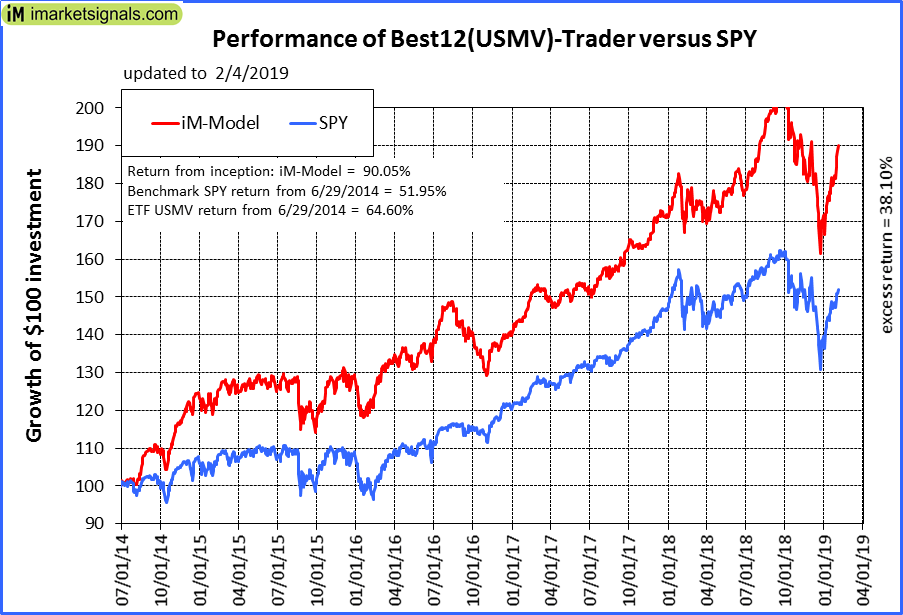 |
iM-Best12(USMV)-Trader: The model’s out of sample performance YTD is 10.8%, and for the last 12 months is 7.5%. Over the same period the benchmark SPY performance was 8.8% and 0.6% respectively. Since inception, on 6/30/2014, the model gained 90.05% while the benchmark SPY gained 51.95% and the ETF USMV gained 64.60% over the same period. Over the previous week the market value of iM-Best12(USMV)-Trader gained 4.59% at a time when SPY gained 3.11%. A starting capital of $100,000 at inception on 6/30/2014 would have grown to $190,049 which includes $10 cash and excludes $5,106 spent on fees and slippage. |
 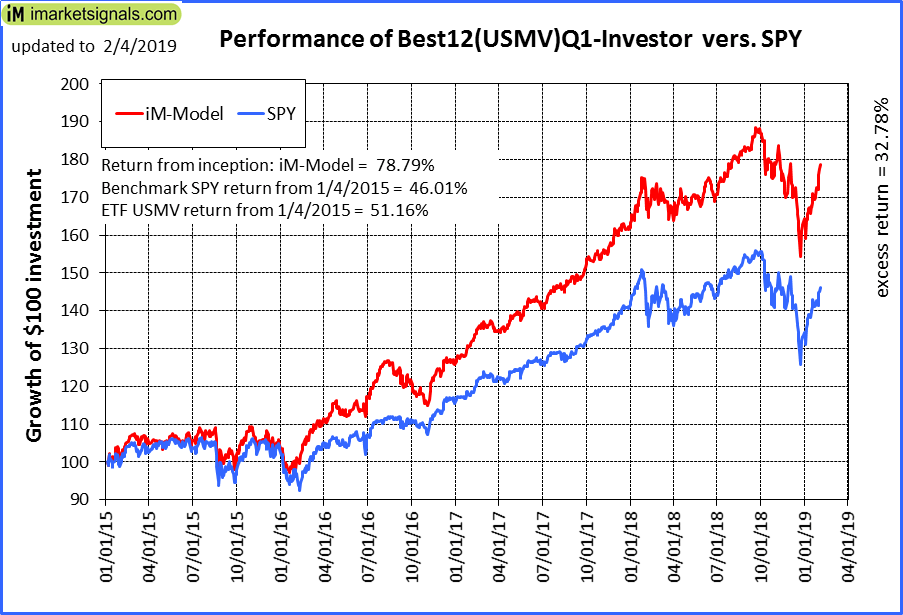 |
iM-Best12(USMV)Q1-Investor: The model’s out of sample performance YTD is 8.8%, and for the last 12 months is 3.8%. Over the same period the benchmark SPY performance was 8.8% and 0.6% respectively. Since inception, on 1/5/2015, the model gained 78.79% while the benchmark SPY gained 46.01% and the ETF USMV gained 51.16% over the same period. Over the previous week the market value of iM-Best12(USMV)Q1 gained 3.87% at a time when SPY gained 3.11%. A starting capital of $100,000 at inception on 1/5/2015 would have grown to $178,793 which includes $510 cash and excludes $1,442 spent on fees and slippage. |
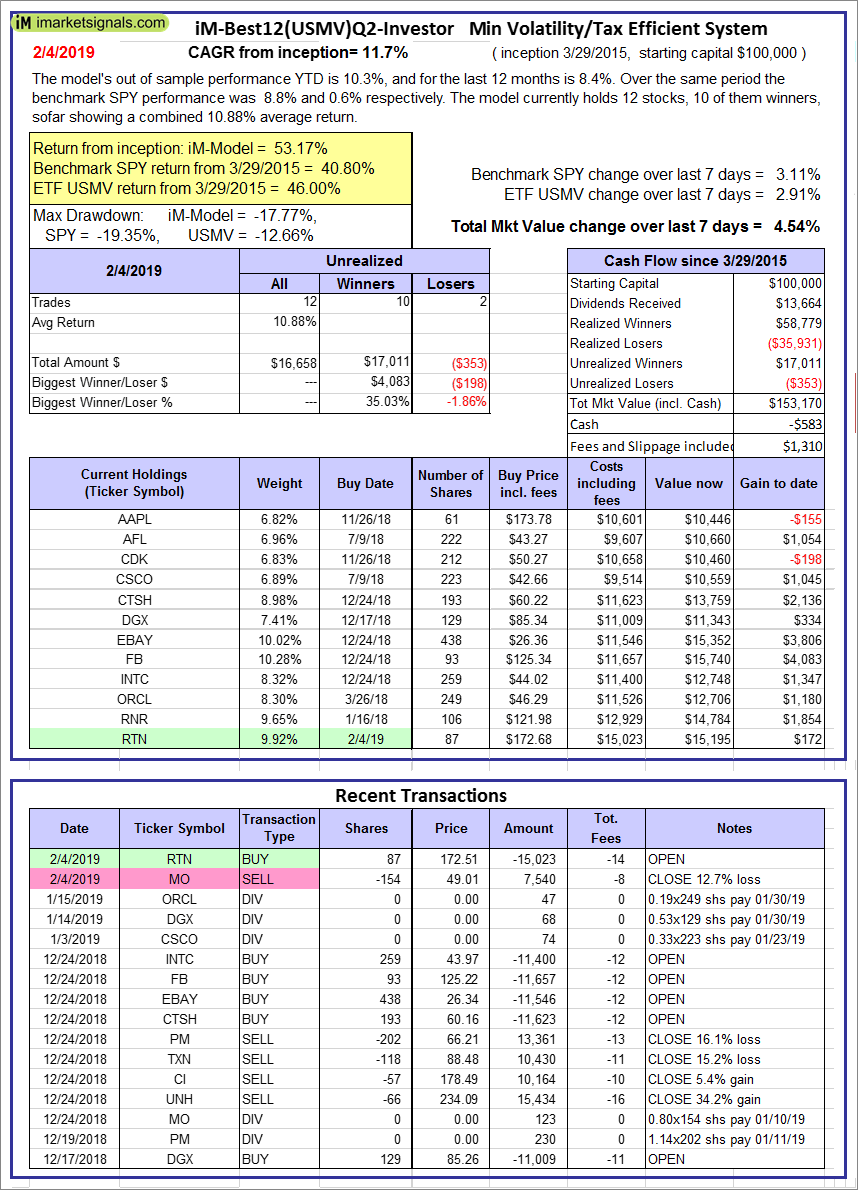 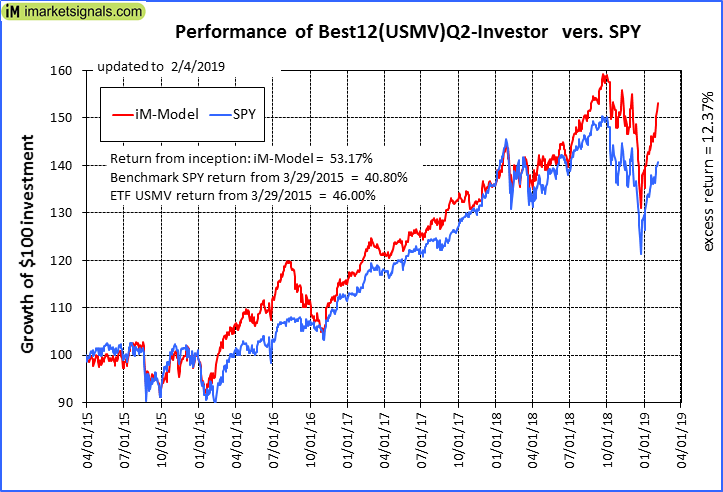 |
iM-Best12(USMV)Q2-Investor: The model’s out of sample performance YTD is 10.3%, and for the last 12 months is 8.4%. Over the same period the benchmark SPY performance was 8.8% and 0.6% respectively. Since inception, on 3/30/2015, the model gained 53.17% while the benchmark SPY gained 40.80% and the ETF USMV gained 46.00% over the same period. Over the previous week the market value of iM-Best12(USMV)Q2 gained 4.54% at a time when SPY gained 3.11%. A starting capital of $100,000 at inception on 3/30/2015 would have grown to $153,170 which includes -$583 cash and excludes $1,310 spent on fees and slippage. |
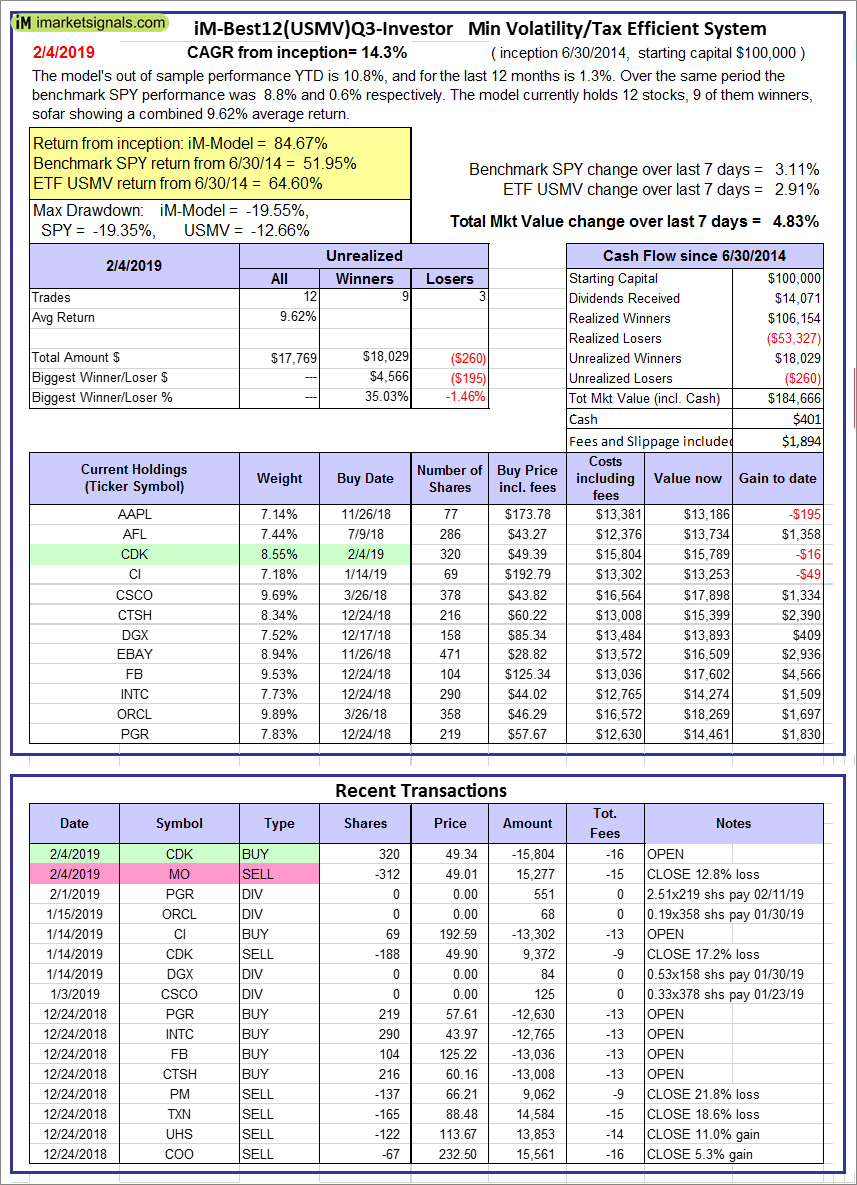 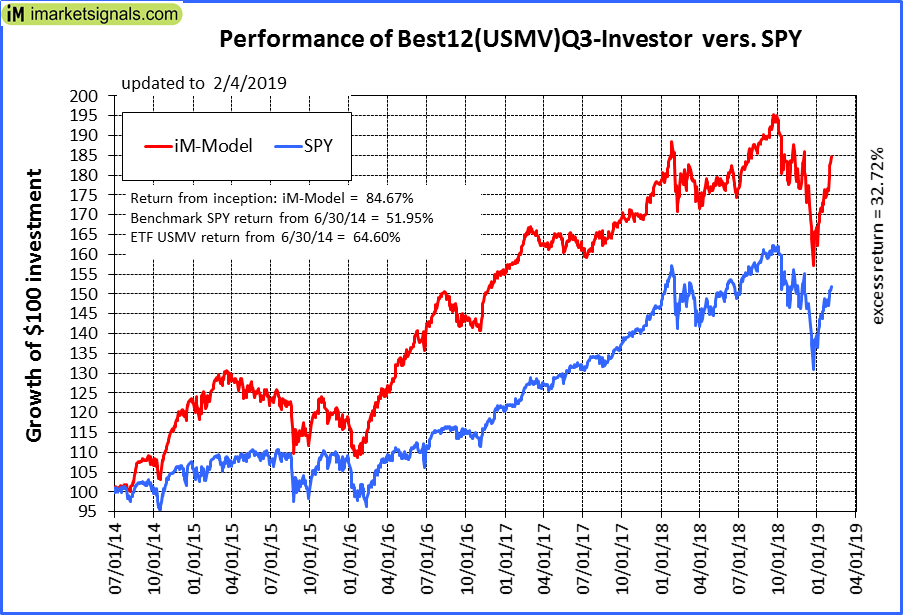 |
iM-Best12(USMV)Q3-Investor: The model’s out of sample performance YTD is 10.8%, and for the last 12 months is 1.3%. Over the same period the benchmark SPY performance was 8.8% and 0.6% respectively. Since inception, on 7/1/2014, the model gained 84.67% while the benchmark SPY gained 51.95% and the ETF USMV gained 64.60% over the same period. Over the previous week the market value of iM-Best12(USMV)Q3 gained 4.83% at a time when SPY gained 3.11%. A starting capital of $100,000 at inception on 7/1/2014 would have grown to $184,666 which includes $401 cash and excludes $1,894 spent on fees and slippage. |
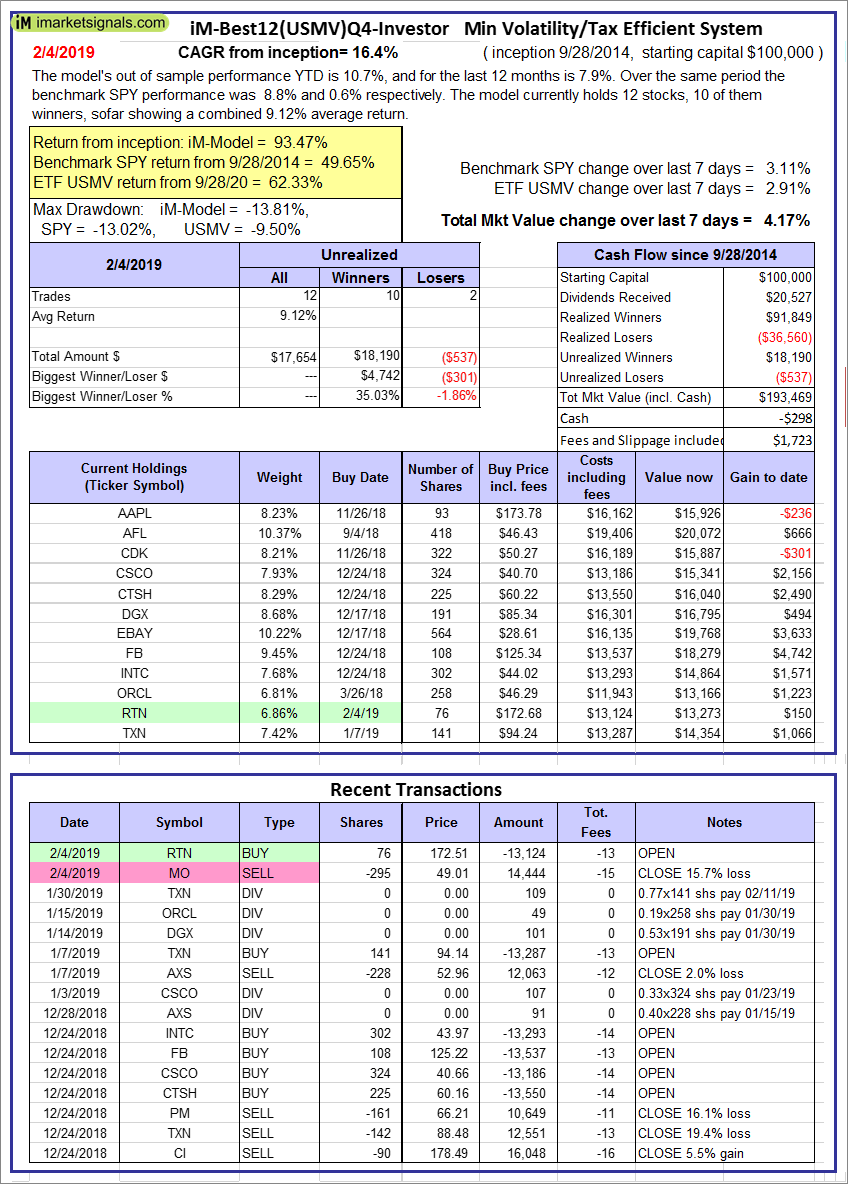 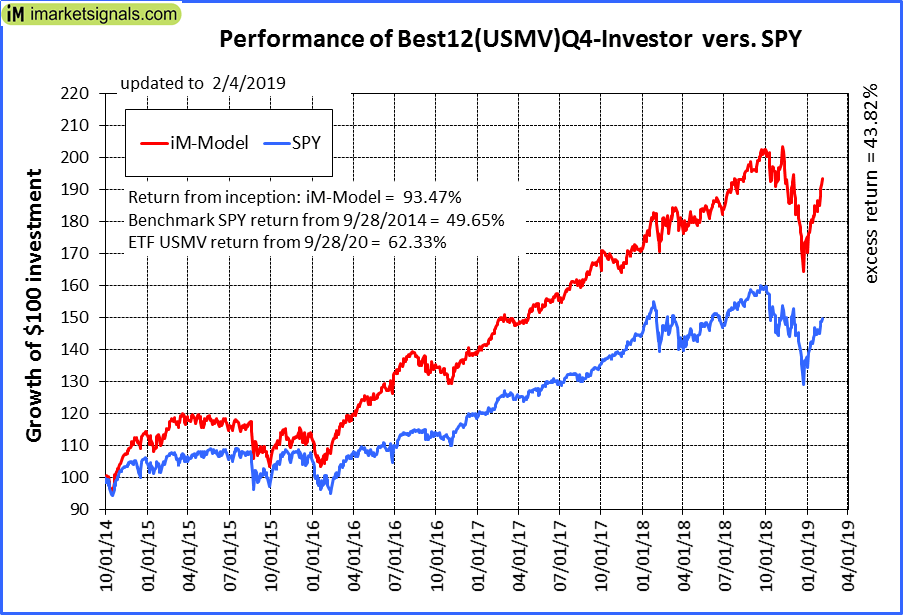 |
iM-Best12(USMV)Q4-Investor: Since inception, on 9/29/2014, the model gained 93.47% while the benchmark SPY gained 49.65% and the ETF USMV gained 62.33% over the same period. Over the previous week the market value of iM-Best12(USMV)Q4 gained 4.17% at a time when SPY gained 3.11%. A starting capital of $100,000 at inception on 9/29/2014 would have grown to $193,469 which includes -$298 cash and excludes $1,723 spent on fees and slippage. |
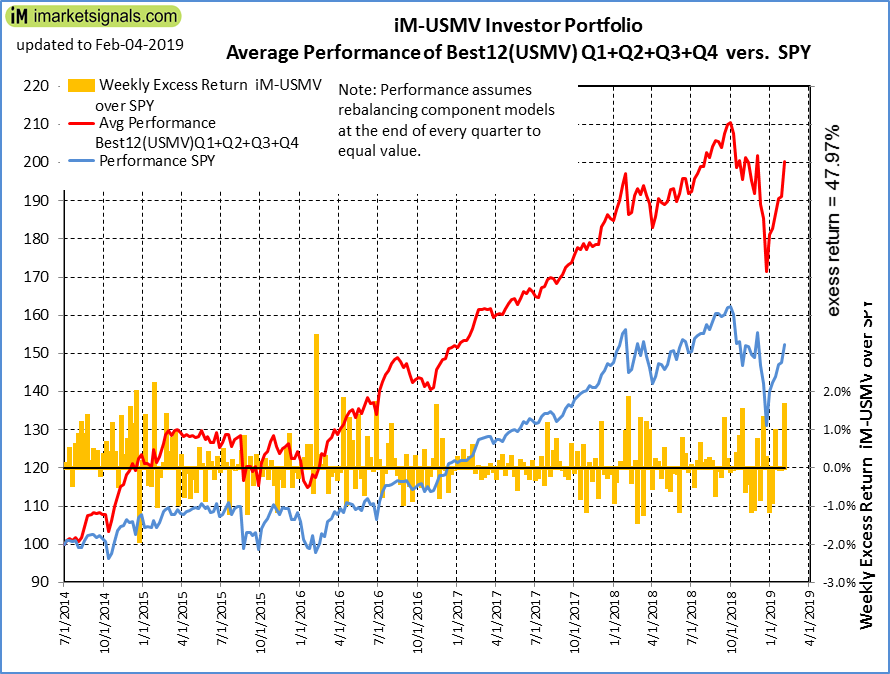 |
Average Performance of iM-Best12(USMV)Q1+Q2+Q3+Q4-Investor resulted in an excess return of 47.97% over SPY. (see iM-USMV Investor Portfolio) |
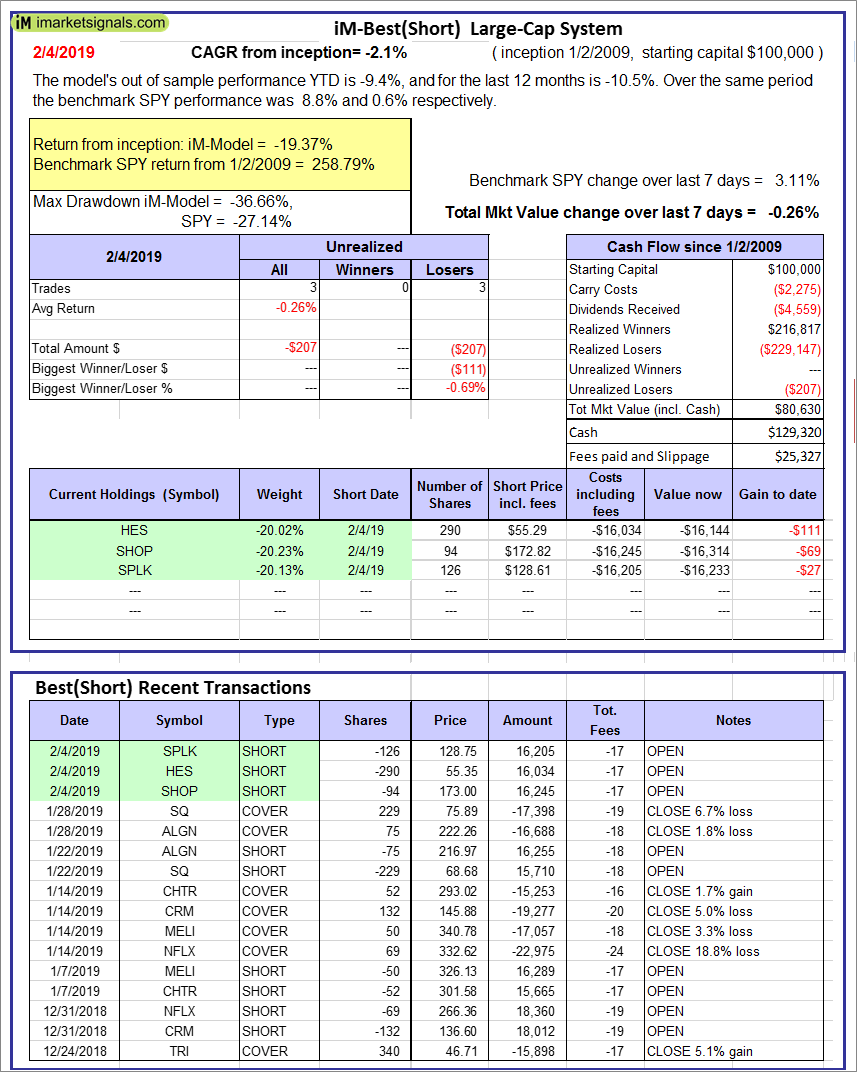 |
iM-Best(Short): The model’s out of sample performance YTD is -9.4%, and for the last 12 months is -10.5%. Over the same period the benchmark SPY performance was 8.8% and 0.6% respectively. Over the previous week the market value of iM-Best(Short) gained -0.26% at a time when SPY gained 3.11%. Over the period 1/2/2009 to 2/4/2019 the starting capital of $100,000 would have grown to $80,630 which includes $129,320 cash and excludes $25,327 spent on fees and slippage. |
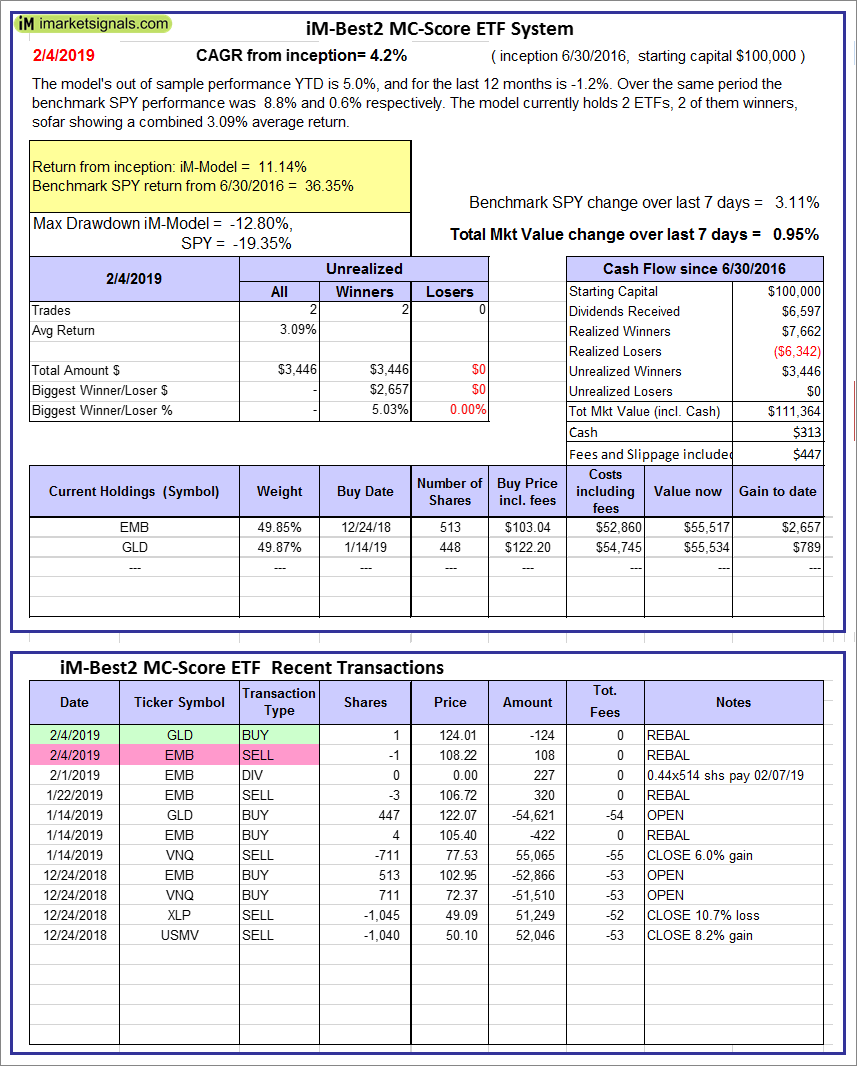 |
iM-Best2 MC-Score ETF System: The model’s out of sample performance YTD is 5.0%, and for the last 12 months is -1.2%. Over the same period the benchmark SPY performance was 8.8% and 0.6% respectively. Over the previous week the market value of the iM-Best2 MC-Score ETF System gained 0.95% at a time when SPY gained 3.11%. A starting capital of $100,000 at inception on 6/30/2016 would have grown to $111,364 which includes $313 cash and excludes $447 spent on fees and slippage. |
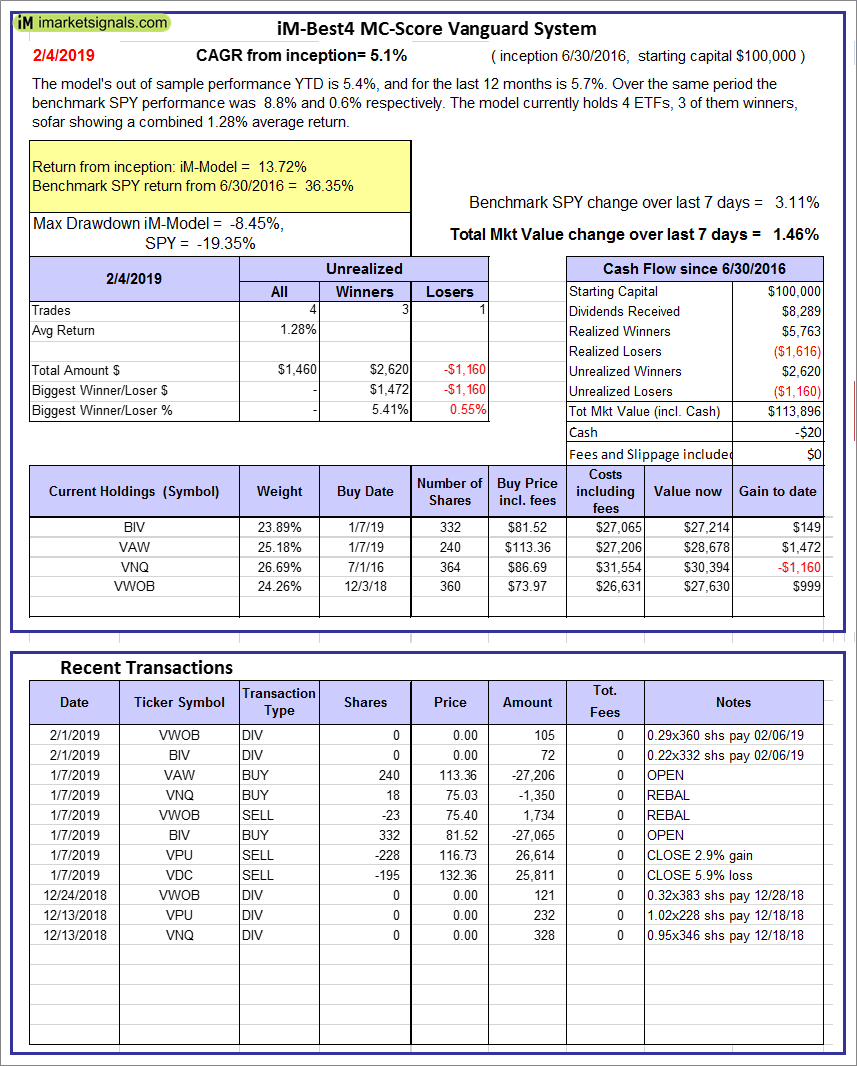 |
iM-Best4 MC-Score Vanguard System: The model’s out of sample performance YTD is 5.4%, and for the last 12 months is 5.7%. Over the same period the benchmark SPY performance was 8.8% and 0.6% respectively. Over the previous week the market value of the iM-Best4 MC-Score Vanguard System gained 1.46% at a time when SPY gained 3.11%. A starting capital of $100,000 at inception on 6/30/2016 would have grown to $113,896 which includes -$20 cash and excludes $00 spent on fees and slippage. |
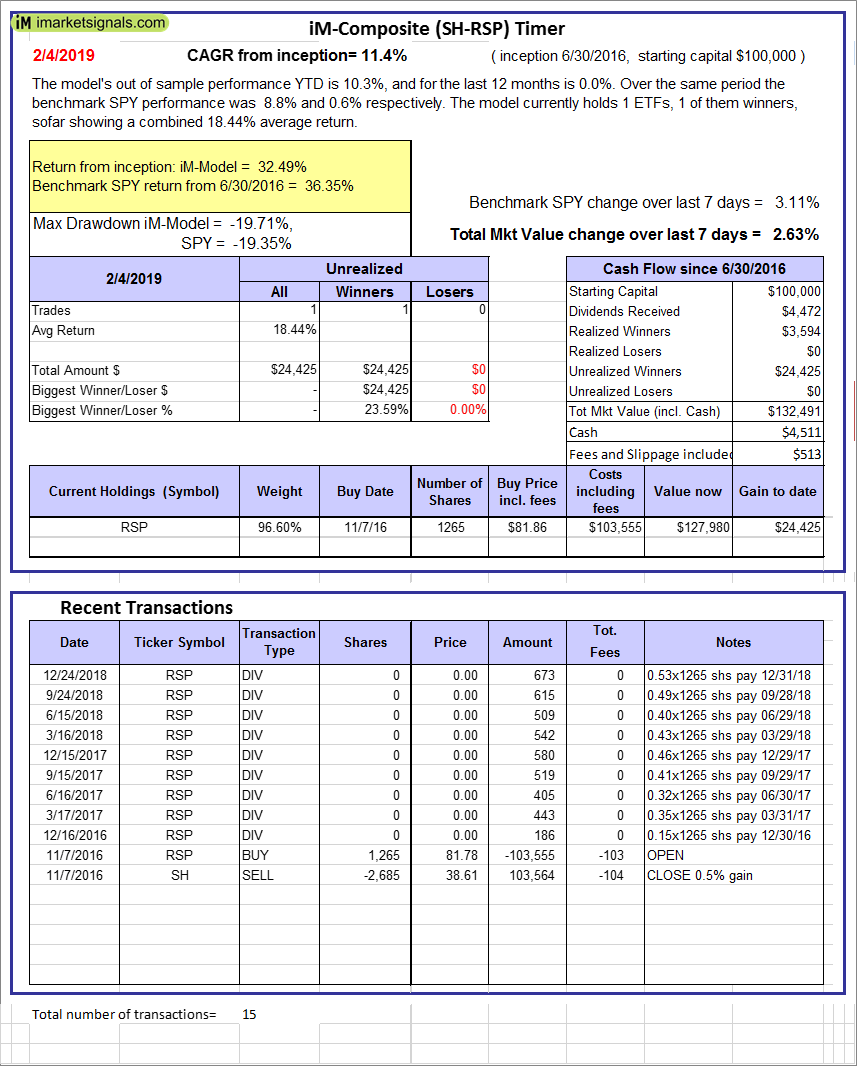 |
iM-Composite (SH-RSP) Timer: The model’s out of sample performance YTD is 10.3%, and for the last 12 months is 0.0%. Over the same period the benchmark SPY performance was 8.8% and 0.6% respectively. Over the previous week the market value of the iM-Composite (SH-RSP) Timer gained 2.63% at a time when SPY gained 3.11%. A starting capital of $100,000 at inception on 6/30/2016 would have grown to $132,491 which includes $4,511 cash and excludes $513 spent on fees and slippage. |
 |
iM-Composite (SPY-IEF) Timer: The model’s out of sample performance YTD is 2.3%, and for the last 12 months is 5.0%. Over the same period the benchmark SPY performance was 8.8% and 0.6% respectively. Over the previous week the market value of the iM-Composite (SPY-IEF) Timer gained 2.61% at a time when SPY gained 3.11%. A starting capital of $100,000 at inception on 6/30/2016 would have grown to $144,498 which includes $1,053 cash and excludes $2,486 spent on fees and slippage. |
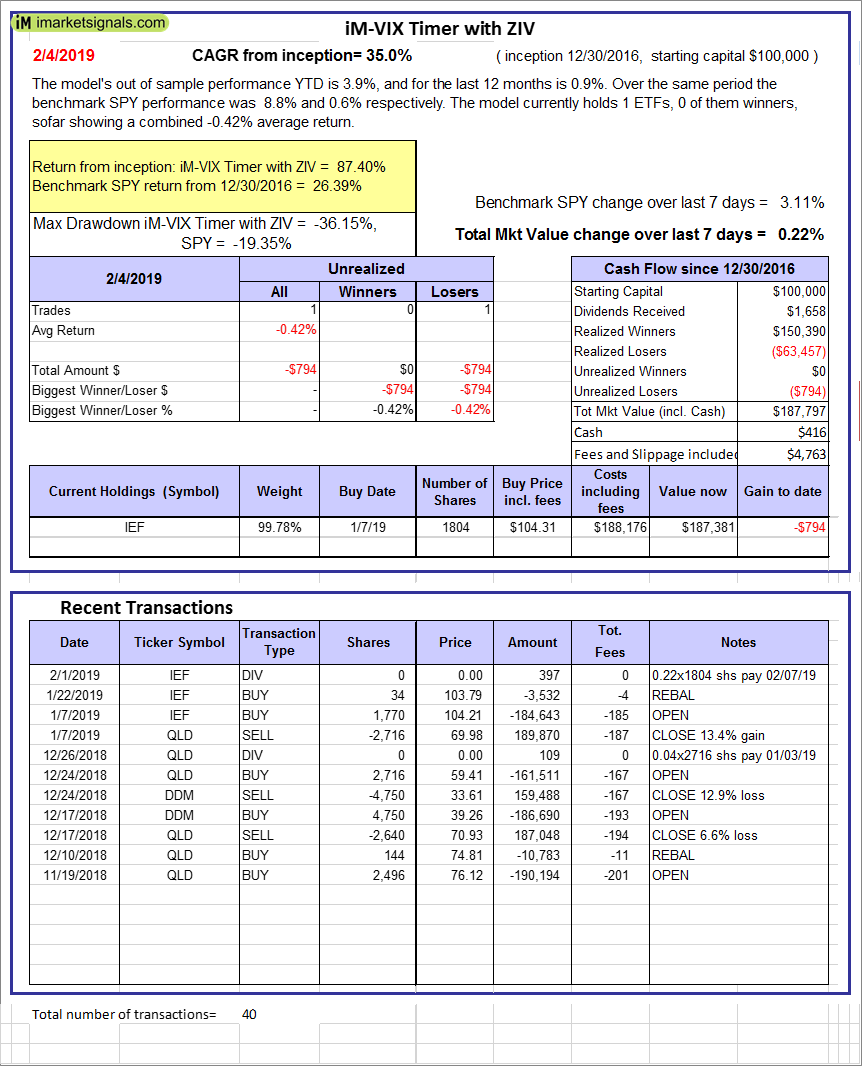 |
iM-VIX Timer with ZIV: The model’s out of sample performance YTD is 3.9%, and for the last 12 months is 0.9%. Over the same period the benchmark SPY performance was 8.8% and 0.6% respectively. Over the previous week the market value of the iM-VIX Timer with ZIV gained 0.22% at a time when SPY gained 3.11%. A starting capital of $100,000 at inception on 6/30/2016 would have grown to $187,797 which includes $416 cash and excludes $4,763 spent on fees and slippage. |
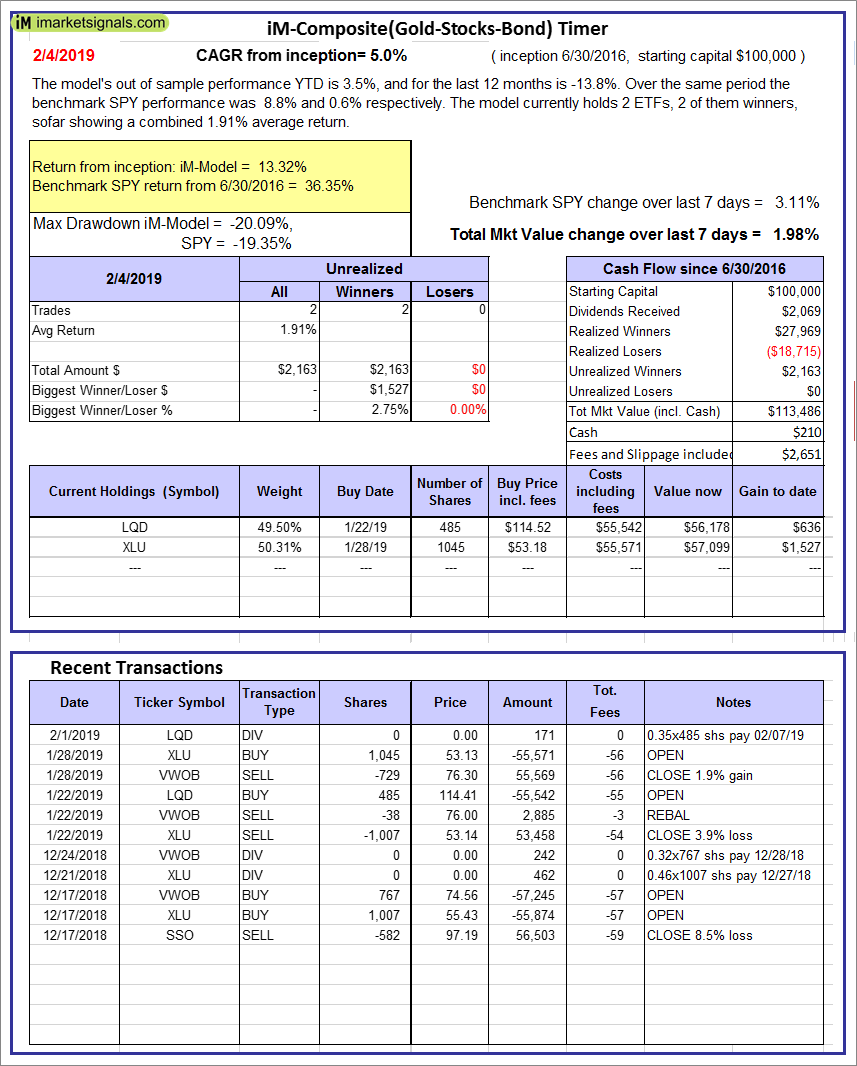 |
iM-Composite(Gold-Stocks-Bond) Timer: The model’s out of sample performance YTD is 3.5%, and for the last 12 months is -13.8%. Over the same period the benchmark SPY performance was 8.8% and 0.6% respectively. Over the previous week the market value of the iM-Composite(Gold-Stocks-Bond) Timer gained 1.98% at a time when SPY gained 3.11%. A starting capital of $100,000 at inception on 6/30/2016 would have grown to $113,486 which includes $210 cash and excludes $2,651 spent on fees and slippage. |
 |
iM-Low Turnover Composite Timer Combo: The model’s out of sample performance YTD is 3.7%, and for the last 12 months is -7.4%. Over the same period the benchmark SPY performance was 8.8% and 0.6% respectively. Over the previous week the market value of the iM-Low Turnover Composite Timer Combo gained 1.34% at a time when SPY gained 3.11%. A starting capital of $100,000 at inception on 3/24/27 would have grown to $99,880 which includes $964 cash and excludes $472 spent on fees and slippage. |
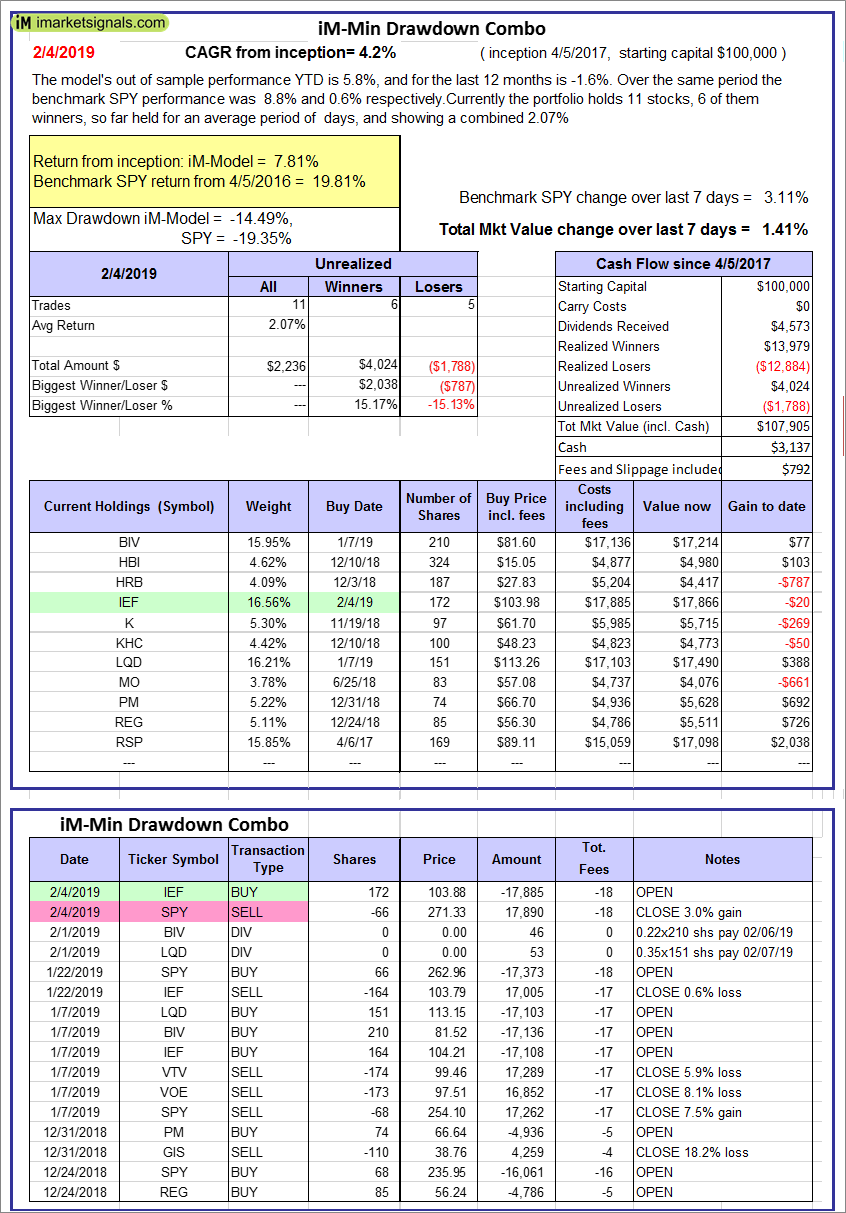 |
iM-Min Drawdown Combo: The model’s out of sample performance YTD is 5.8%, and for the last 12 months is -1.6%. Over the same period the benchmark SPY performance was 8.8% and 0.6% respectively. Over the previous week the market value of the iM-Min Drawdown Combo gained 1.41% at a time when SPY gained 3.11%. A starting capital of $100,000 at inception on 4/5/2017 would have grown to $107,905 which includes $3,137 cash and excludes $792 spent on fees and slippage. |
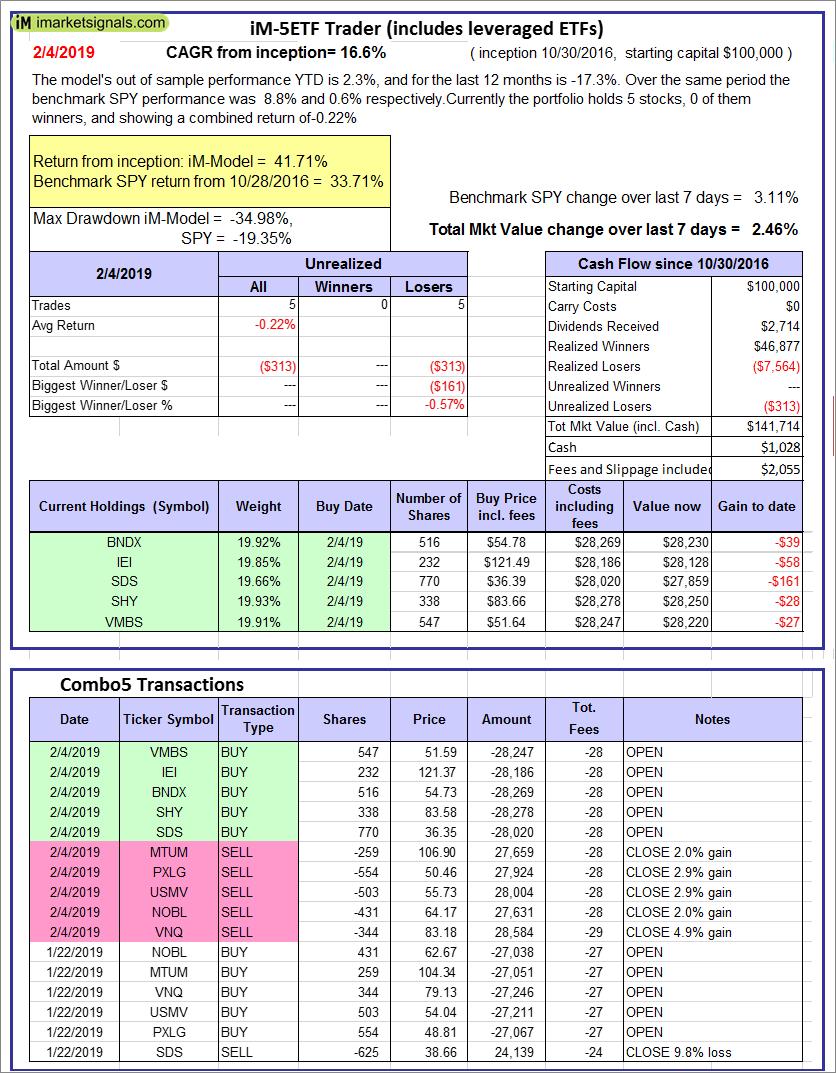 |
iM-5ETF Trader (includes leveraged ETFs): The model’s out of sample performance YTD is 2.3%, and for the last 12 months is -17.3%. Over the same period the benchmark SPY performance was 8.8% and 0.6% respectively. Over the previous week the market value of the iM-5ETF Trader (includes leveraged ETFs) gained 2.46% at a time when SPY gained 3.11%. A starting capital of $100,000 at inception on 10/30/2016 would have grown to $141,714 which includes $1,028 cash and excludes $2,055 spent on fees and slippage. |
 |
iM-Standard 5ETF Trader (excludes leveraged ETFs): The model’s out of sample performance YTD is 3.4%, and for the last 12 months is -6.0%. Over the same period the benchmark SPY performance was 8.8% and 0.6% respectively. Over the previous week the market value of the iM-Standard 5ETF Trader (excludes leveraged ETFs) gained 2.51% at a time when SPY gained 3.11%. A starting capital of $100,000 at inception on 10/30/2016 would have grown to $121,244 which includes $713 cash and excludes $1,889 spent on fees and slippage. |
iM-Best Reports – 2/7/2019
Posted in pmp SPY-SH
Leave a Reply
You must be logged in to post a comment.