
  |
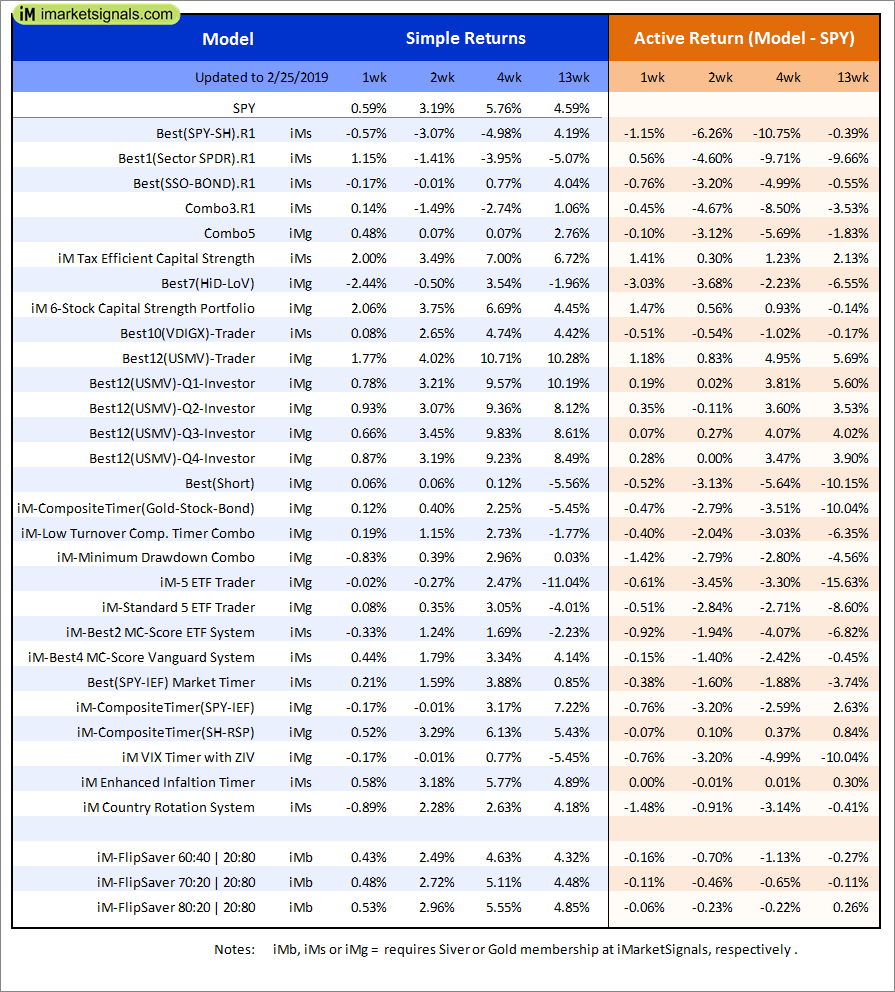
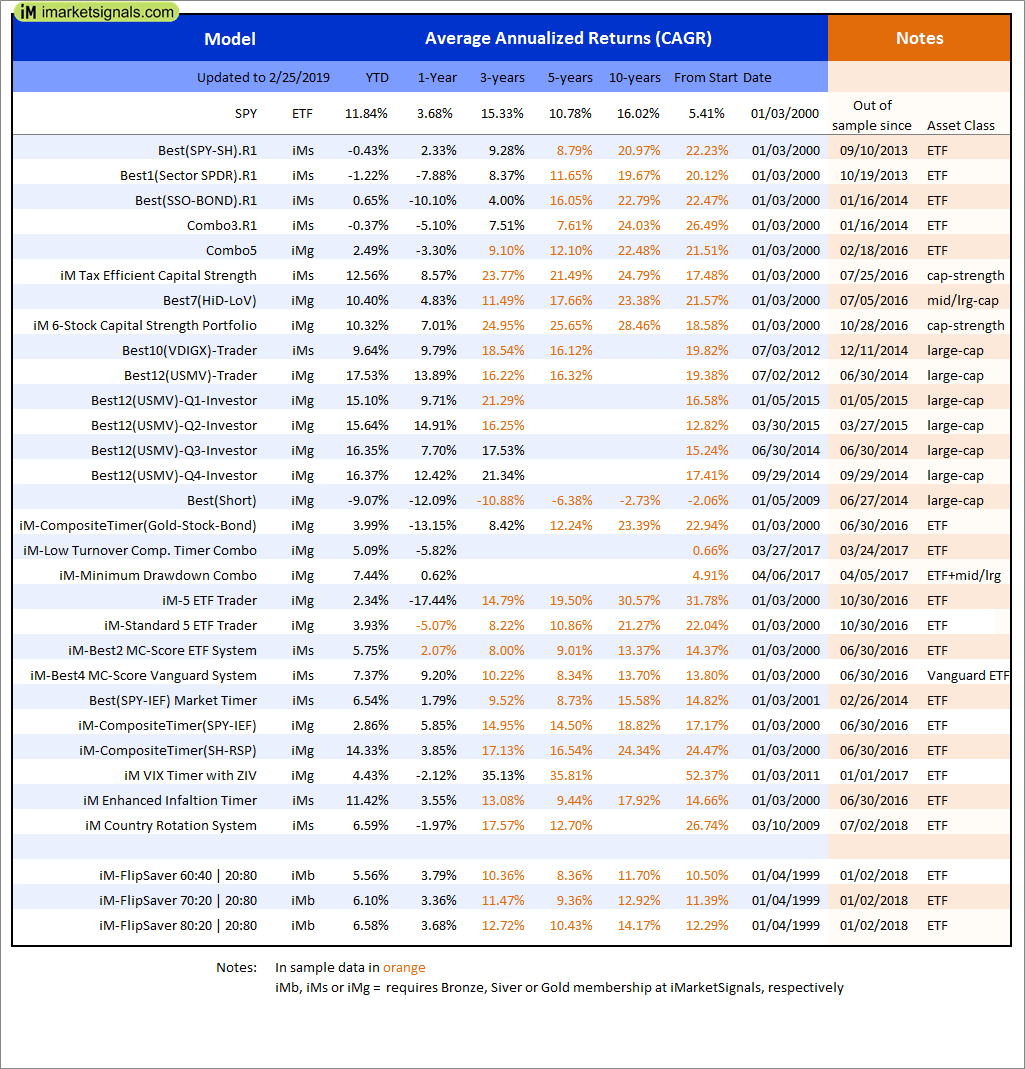
Out of sample performance summary of our models for the past 1, 2, 4 and 13 week periods. The active active return indicates how the models over- or underperformed the benchmark ETF SPY. Also the YTD, and the 1-, 3-, 5- and 10-year annualized returns are shown in the second table |
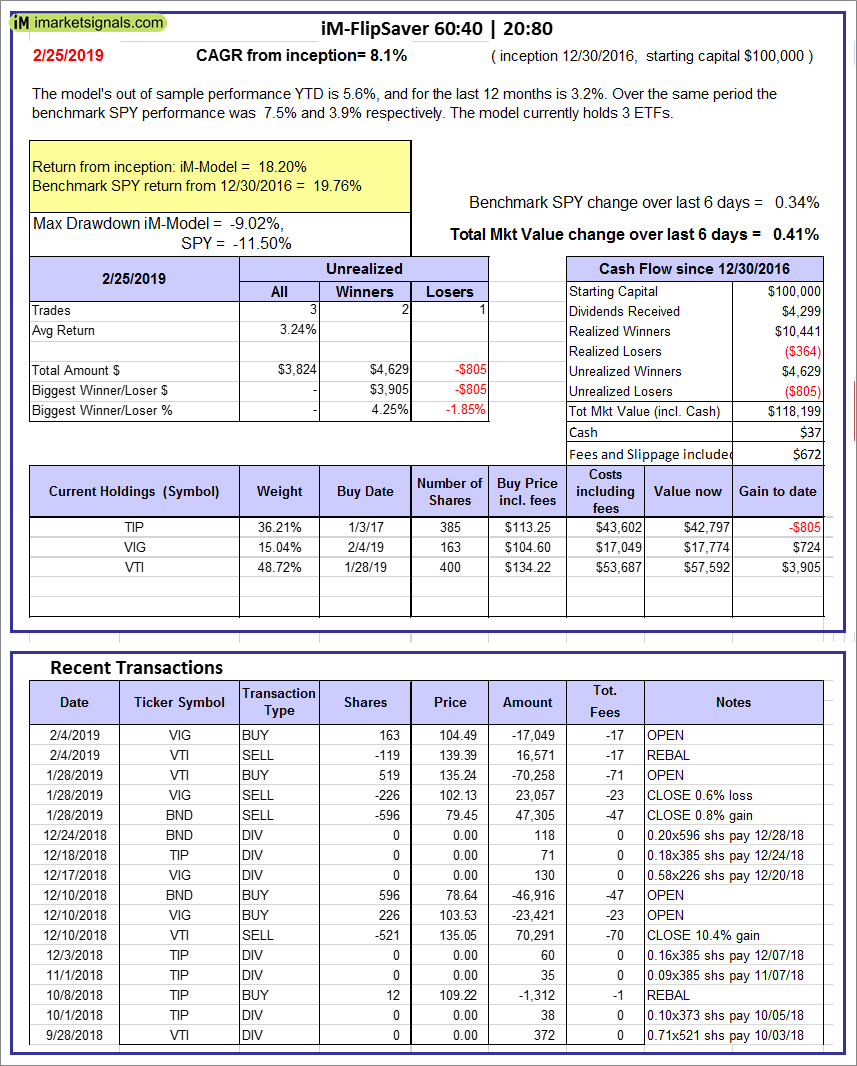 |
iM-FlipSaver 60:40 | 20:80 – 2017: The model’s out of sample performance YTD is 5.6%, and for the last 12 months is 3.2%. Over the same period the benchmark SPY performance was 7.5% and 3.9% respectively. Over the previous week the market value of iM-FlipSaver 80:20 | 20:80 gained 0.41% at a time when SPY gained 0.34%. A starting capital of $100,000 at inception on 7/16/2015 would have grown to $118,199 which includes $37 cash and excludes $672 spent on fees and slippage. |
 |
iM-FlipSaver 70:30 | 20:80 – 2017: The model’s out of sample performance YTD is 6.2%, and for the last 12 months is 3.5%. Over the same period the benchmark SPY performance was 7.5% and 3.9% respectively. Over the previous week the market value of iM-FlipSaver 70:30 | 20:80 gained 0.48% at a time when SPY gained 0.34%. A starting capital of $100,000 at inception on 7/15/2015 would have grown to $120,955 which includes $16 cash and excludes $766 spent on fees and slippage. |
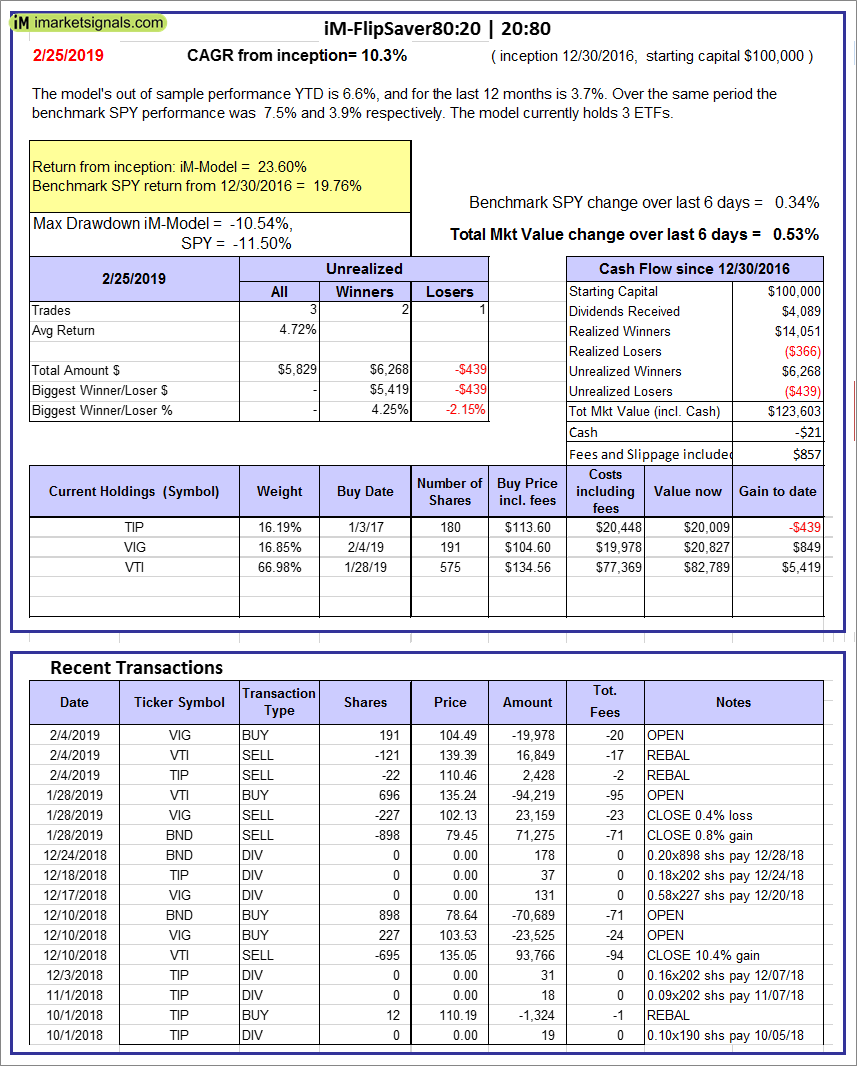 |
iM-FlipSaver 80:20 | 20:80 – 2017: The model’s out of sample performance YTD is 6.6%, and for the last 12 months is 3.7%. Over the same period the benchmark SPY performance was 7.5% and 3.9% respectively. Over the previous week the market value of iM-FlipSaver 80:20 | 20:80 gained 0.53% at a time when SPY gained 0.34%. A starting capital of $100,000 at inception on 1/2/2017 would have grown to $123,603 which includes -$21 cash and excludes $857 spent on fees and slippage. |
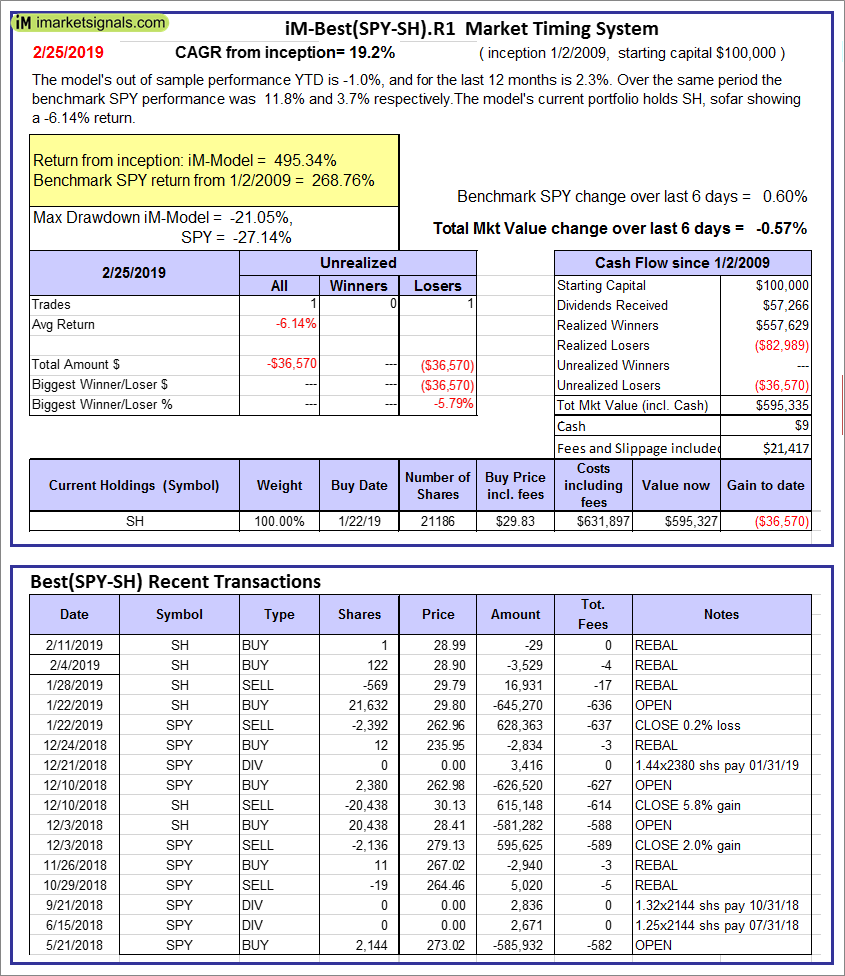 |
iM-Best(SPY-SH).R1: The model’s out of sample performance YTD is -1.0%, and for the last 12 months is 2.3%. Over the same period the benchmark SPY performance was 11.8% and 3.7% respectively. Over the previous week the market value of Best(SPY-SH) gained -0.57% at a time when SPY gained 0.60%. A starting capital of $100,000 at inception on 1/2/2009 would have grown to $595,335 which includes $9 cash and excludes $21,417 spent on fees and slippage. |
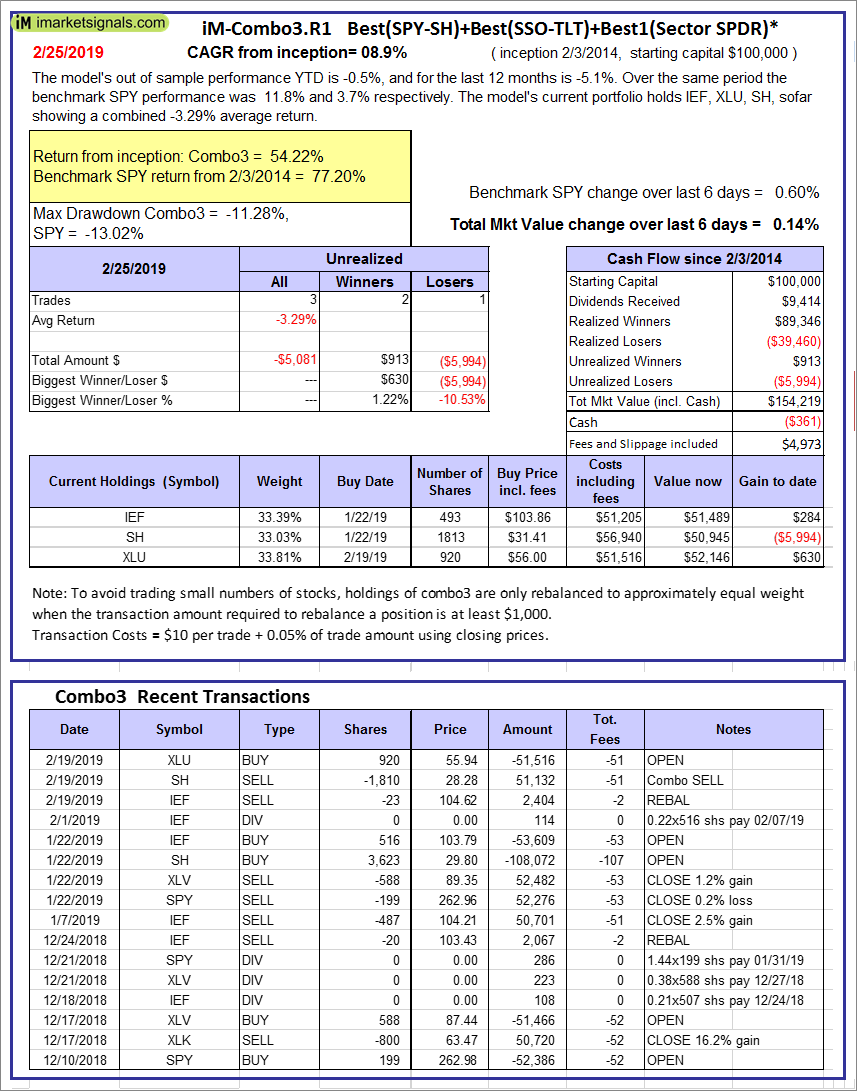 |
iM-Combo3.R1: The model’s out of sample performance YTD is -0.5%, and for the last 12 months is -5.1%. Over the same period the benchmark SPY performance was 11.8% and 3.7% respectively. Over the previous week the market value of iM-Combo3.R1 gained 0.14% at a time when SPY gained 0.60%. A starting capital of $100,000 at inception on 2/3/2014 would have grown to $154,219 which includes -$361 cash and excludes $4,973 spent on fees and slippage. |
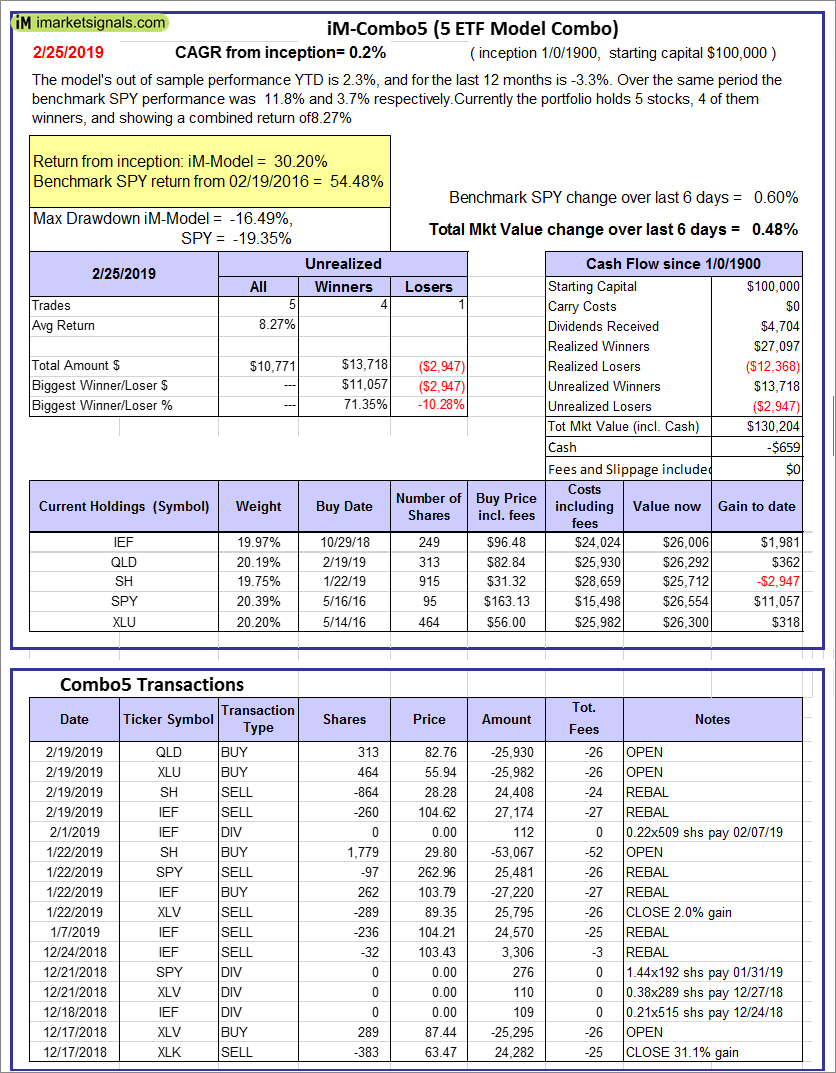 |
iM-Combo5: The model’s out of sample performance YTD is 2.3%, and for the last 12 months is -3.3%. Over the same period the benchmark SPY performance was 11.8% and 3.7% respectively. Over the previous week the market value of iM-Combo5 gained 0.48% at a time when SPY gained 0.60%. A starting capital of $100,000 at inception on 2/22/2016 would have grown to $130,204 which includes -$659 cash and excludes $0 spent on fees and slippage. |
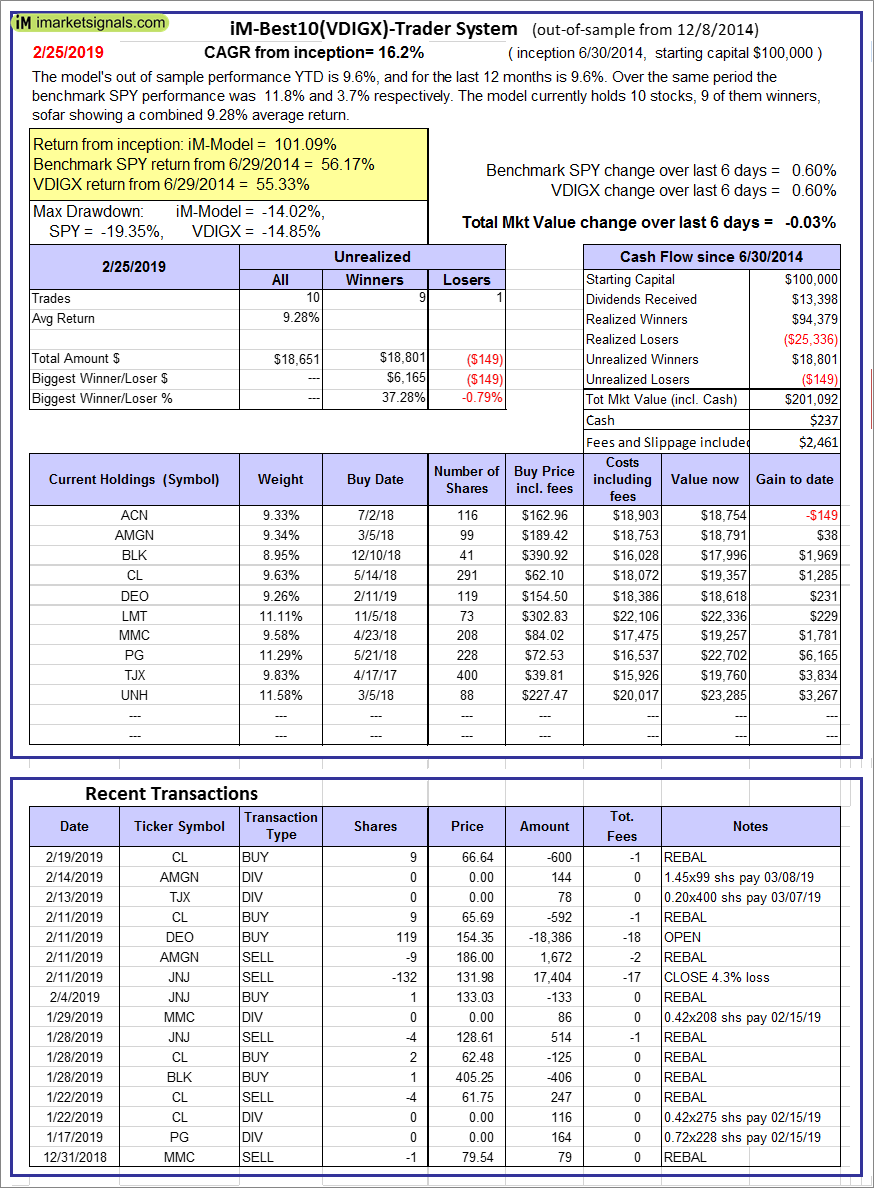 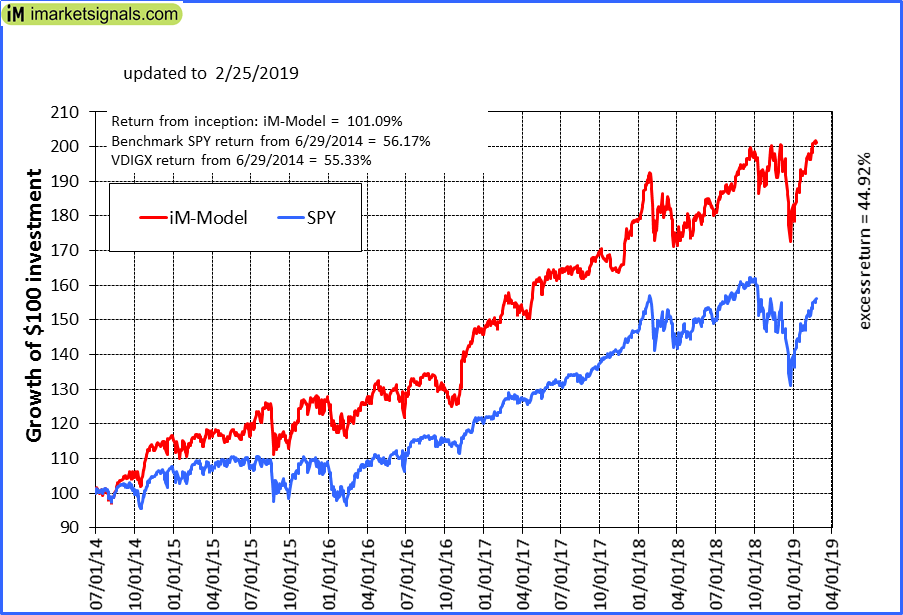 |
iM-Best10(VDIGX)-Trader: The model’s out of sample performance YTD is 9.6%, and for the last 12 months is 9.6%. Over the same period the benchmark SPY performance was 11.8% and 3.7% respectively. Since inception, on 7/1/2014, the model gained 101.09% while the benchmark SPY gained 56.17% and VDIGX gained 55.33% over the same period. Over the previous week the market value of iM-Best10(VDIGX) gained -0.03% at a time when SPY gained 0.60%. A starting capital of $100,000 at inception on 7/1/2014 would have grown to $201,092 which includes $237 cash and excludes $2,461 spent on fees and slippage. |
 |
iM-Best7(HiD-LoV): The model’s out of sample performance YTD is 9.9%, and for the last 12 months is 4.8%. Over the same period the benchmark SPY performance was 11.8% and 3.7% respectively. Over the previous week the market value of iM-BESTOGA-3 gained -2.57% at a time when SPY gained 0.60%. A starting capital of $100,000 at inception on 6/30/2016 would have grown to $120,163 which includes $108 cash and excludes $2,738 spent on fees and slippage. |
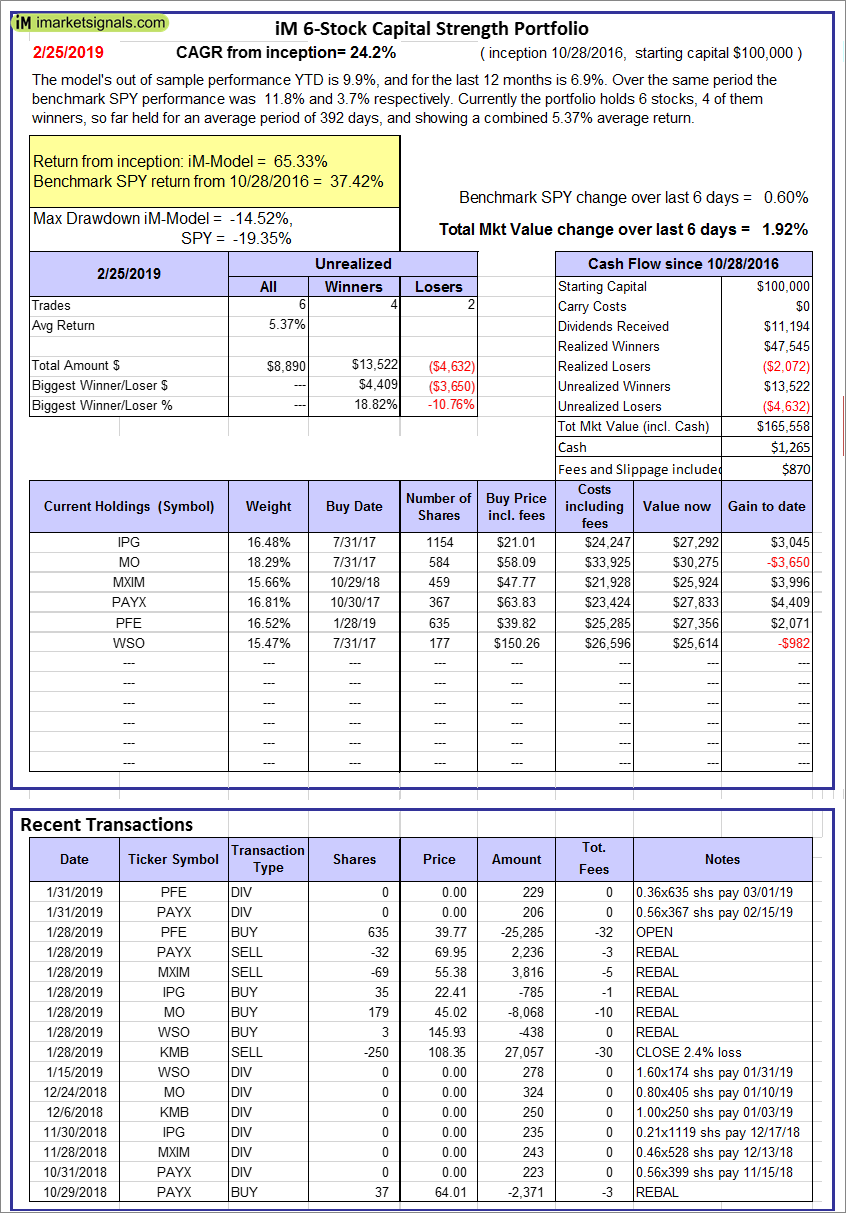 |
iM 6-Stock Capital Strength Portfolio: The model’s out of sample performance YTD is 9.9%, and for the last 12 months is 6.9%. Over the same period the benchmark SPY performance was 11.8% and 3.7% respectively. Over the previous week the market value of the iM 6-Stock Capital Strength Portfolio gained 1.92% at a time when SPY gained 0.60%. A starting capital of $100,000 at inception on 10/28/2016 would have grown to $165,558 which includes $1,265 cash and excludes $870 spent on fees and slippage. |
 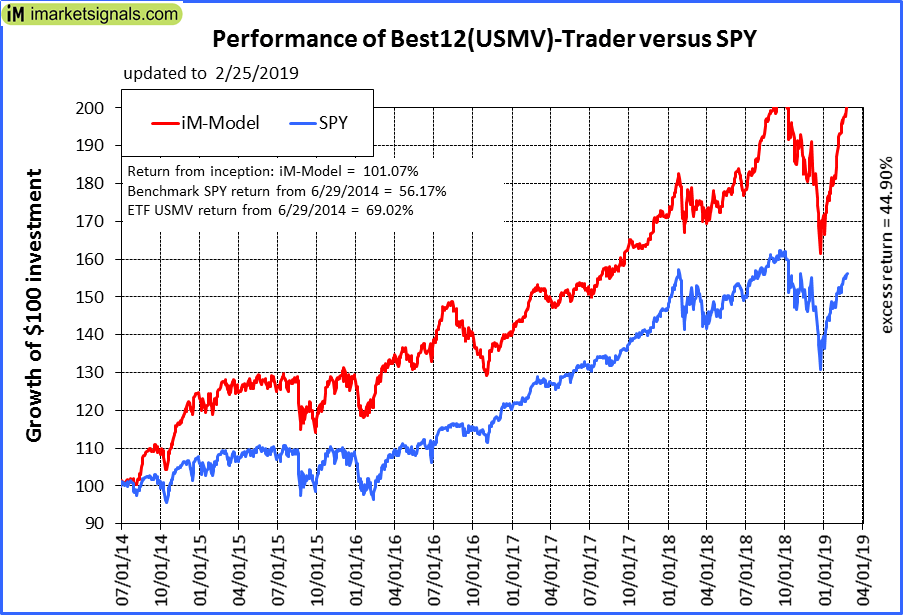 |
iM-Best12(USMV)-Trader: The model’s out of sample performance YTD is 17.3%, and for the last 12 months is 13.8%. Over the same period the benchmark SPY performance was 11.8% and 3.7% respectively. Since inception, on 6/30/2014, the model gained 101.07% while the benchmark SPY gained 56.17% and the ETF USMV gained 69.02% over the same period. Over the previous week the market value of iM-Best12(USMV)-Trader gained 1.67% at a time when SPY gained 0.60%. A starting capital of $100,000 at inception on 6/30/2014 would have grown to $201,070 which includes $346 cash and excludes $5,197 spent on fees and slippage. |
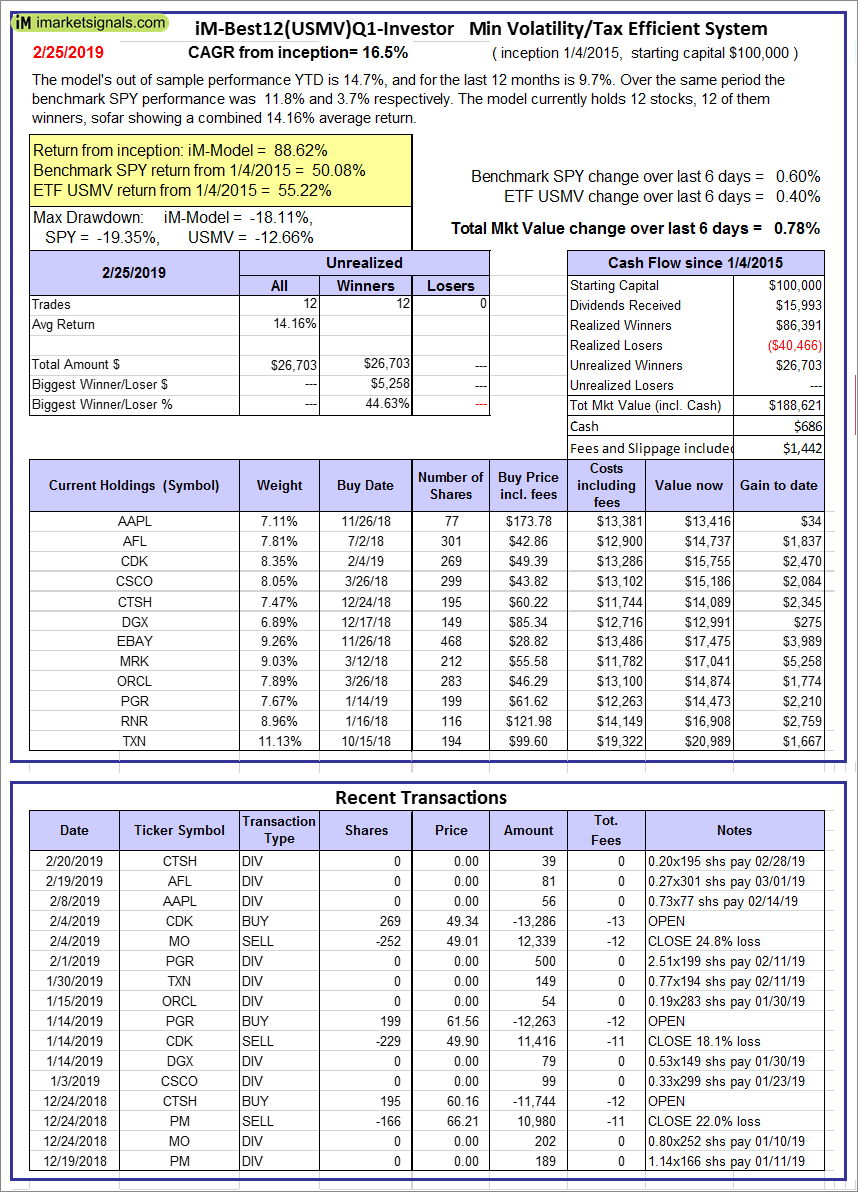 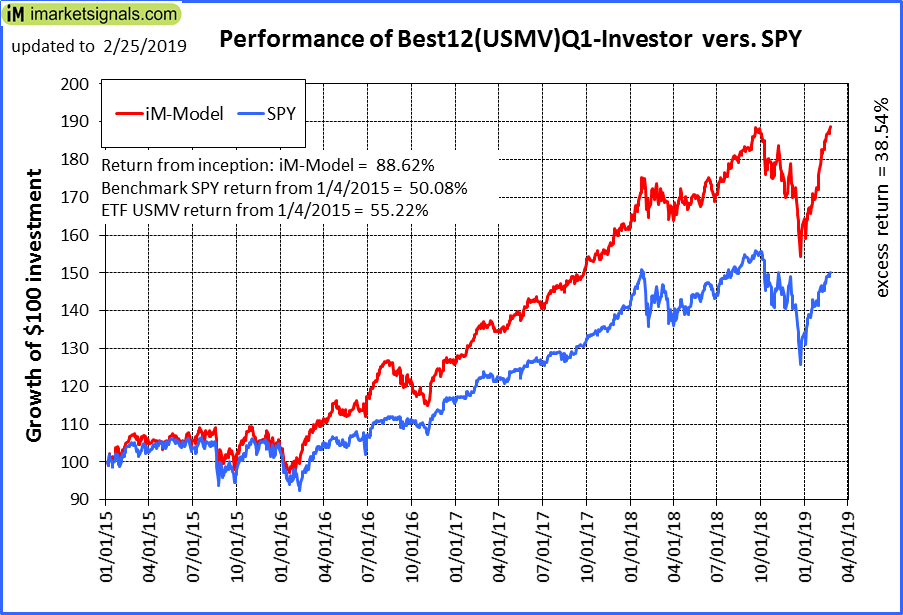 |
iM-Best12(USMV)Q1-Investor: The model’s out of sample performance YTD is 14.7%, and for the last 12 months is 9.7%. Over the same period the benchmark SPY performance was 11.8% and 3.7% respectively. Since inception, on 1/5/2015, the model gained 88.62% while the benchmark SPY gained 50.08% and the ETF USMV gained 55.22% over the same period. Over the previous week the market value of iM-Best12(USMV)Q1 gained 0.78% at a time when SPY gained 0.60%. A starting capital of $100,000 at inception on 1/5/2015 would have grown to $188,621 which includes $686 cash and excludes $1,442 spent on fees and slippage. |
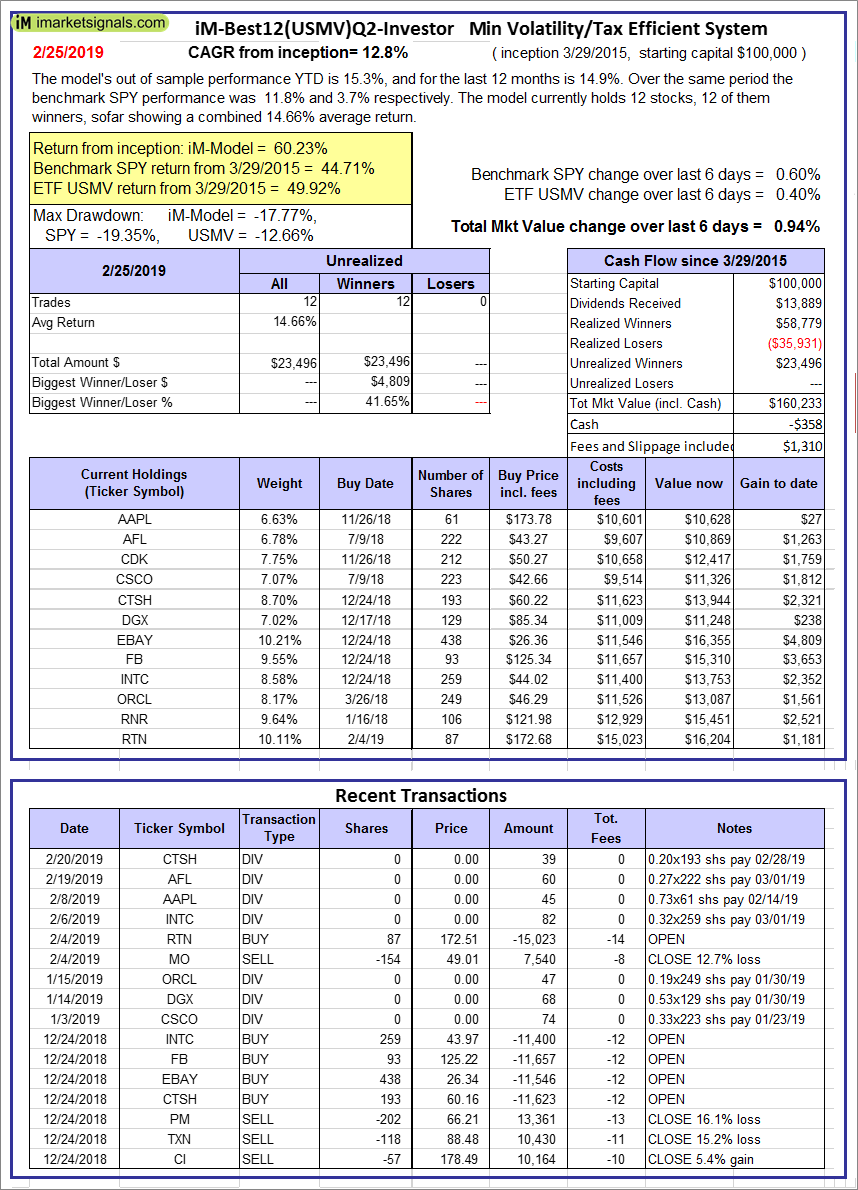 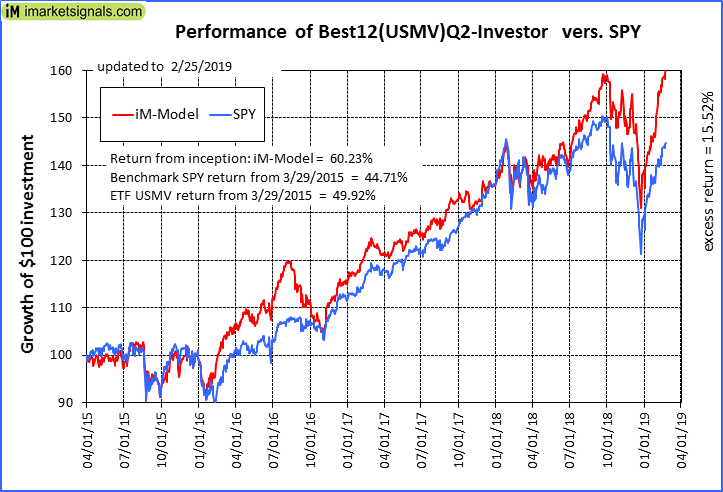 |
iM-Best12(USMV)Q2-Investor: The model’s out of sample performance YTD is 15.3%, and for the last 12 months is 14.9%. Over the same period the benchmark SPY performance was 11.8% and 3.7% respectively. Since inception, on 3/30/2015, the model gained 60.23% while the benchmark SPY gained 44.71% and the ETF USMV gained 49.92% over the same period. Over the previous week the market value of iM-Best12(USMV)Q2 gained 0.94% at a time when SPY gained 0.60%. A starting capital of $100,000 at inception on 3/30/2015 would have grown to $160,233 which includes -$358 cash and excludes $1,310 spent on fees and slippage. |
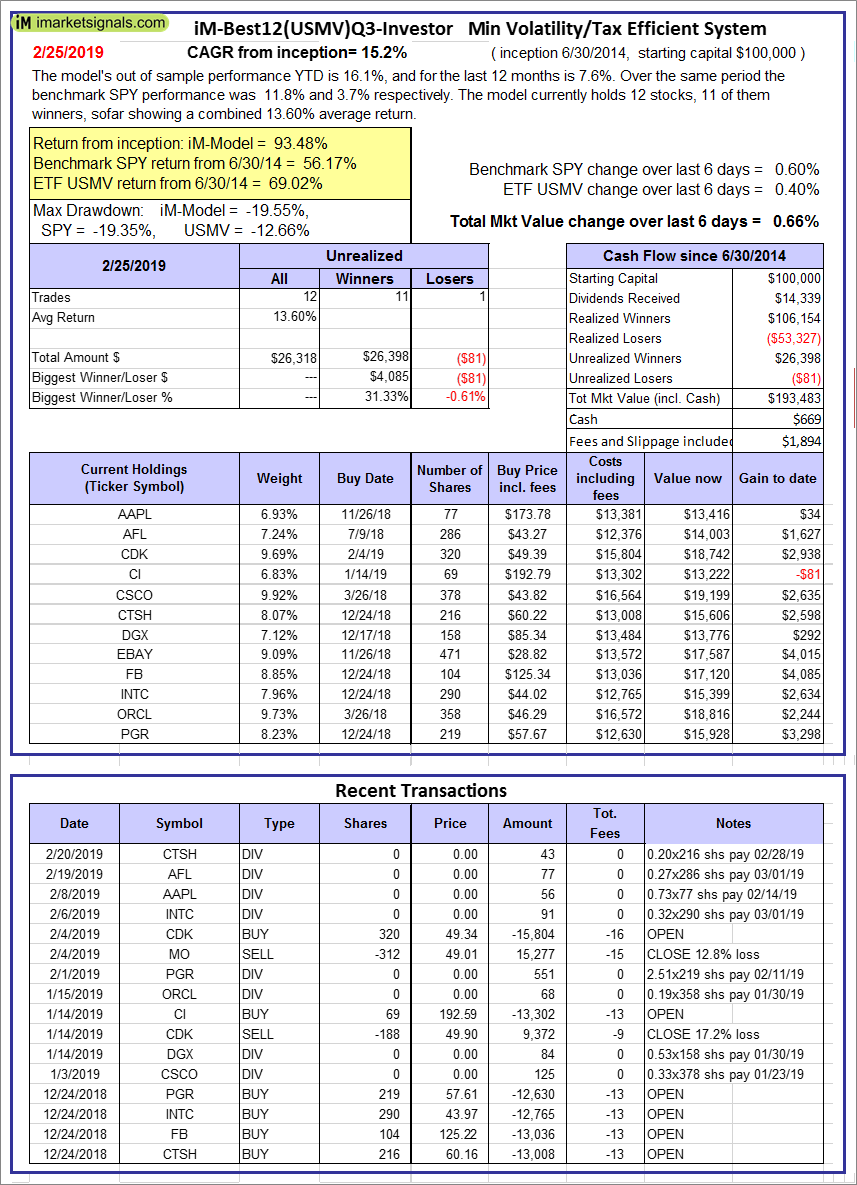 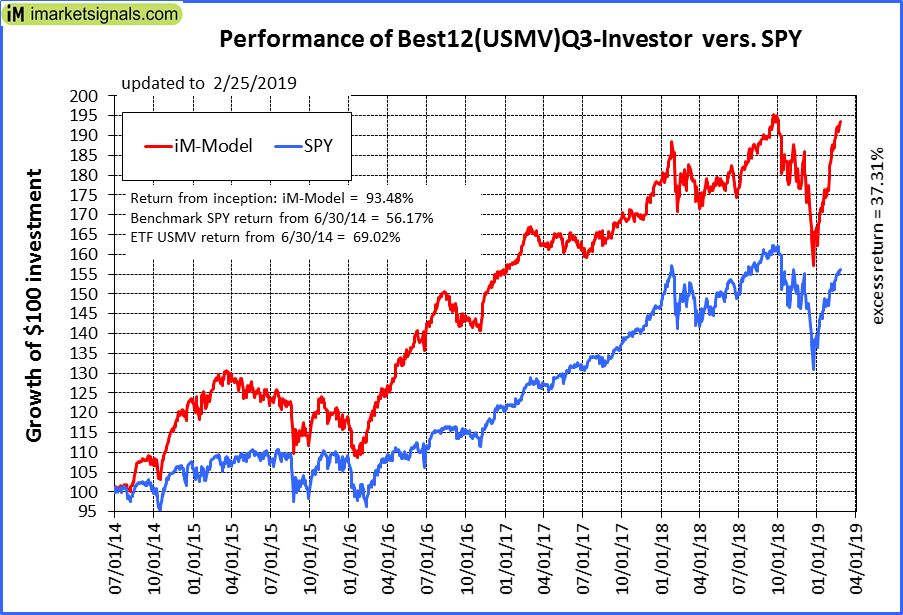 |
iM-Best12(USMV)Q3-Investor: The model’s out of sample performance YTD is 16.1%, and for the last 12 months is 7.6%. Over the same period the benchmark SPY performance was 11.8% and 3.7% respectively. Since inception, on 7/1/2014, the model gained 93.48% while the benchmark SPY gained 56.17% and the ETF USMV gained 69.02% over the same period. Over the previous week the market value of iM-Best12(USMV)Q3 gained 0.66% at a time when SPY gained 0.60%. A starting capital of $100,000 at inception on 7/1/2014 would have grown to $193,483 which includes $669 cash and excludes $1,894 spent on fees and slippage. |
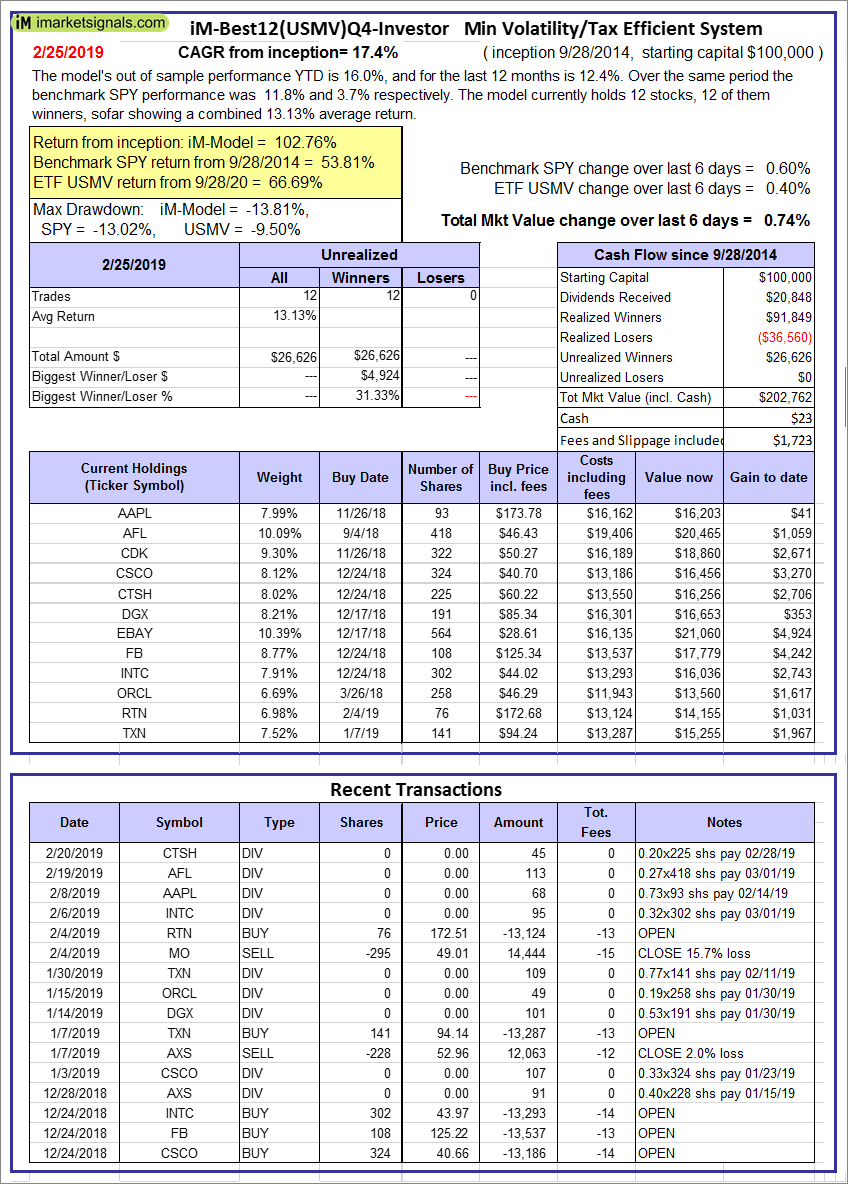 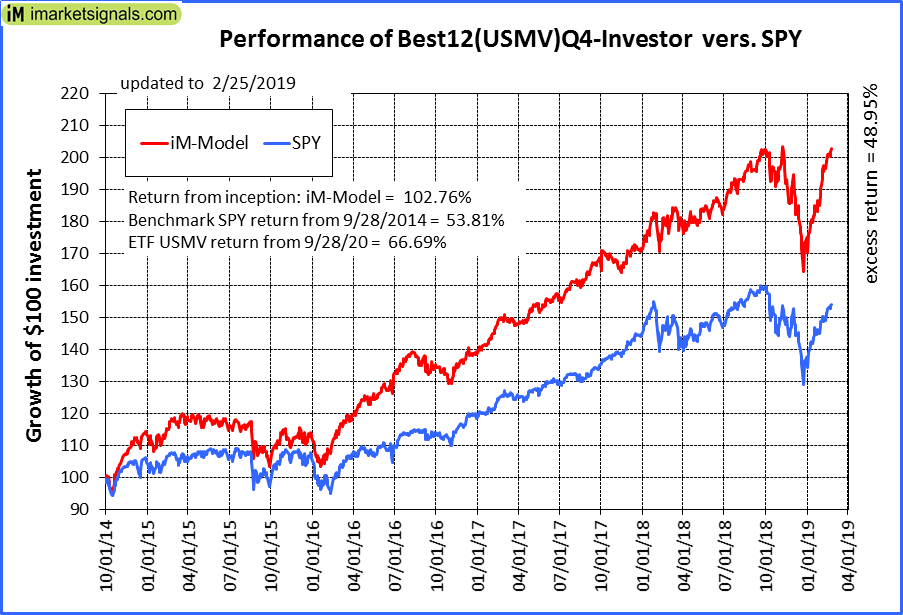 |
iM-Best12(USMV)Q4-Investor: Since inception, on 9/29/2014, the model gained 102.76% while the benchmark SPY gained 53.81% and the ETF USMV gained 66.69% over the same period. Over the previous week the market value of iM-Best12(USMV)Q4 gained 0.74% at a time when SPY gained 0.60%. A starting capital of $100,000 at inception on 9/29/2014 would have grown to $202,762 which includes $23 cash and excludes $1,723 spent on fees and slippage. |
 |
Average Performance of iM-Best12(USMV)Q1+Q2+Q3+Q4-Investor resulted in an excess return of 50.47% over SPY. (see iM-USMV Investor Portfolio) |
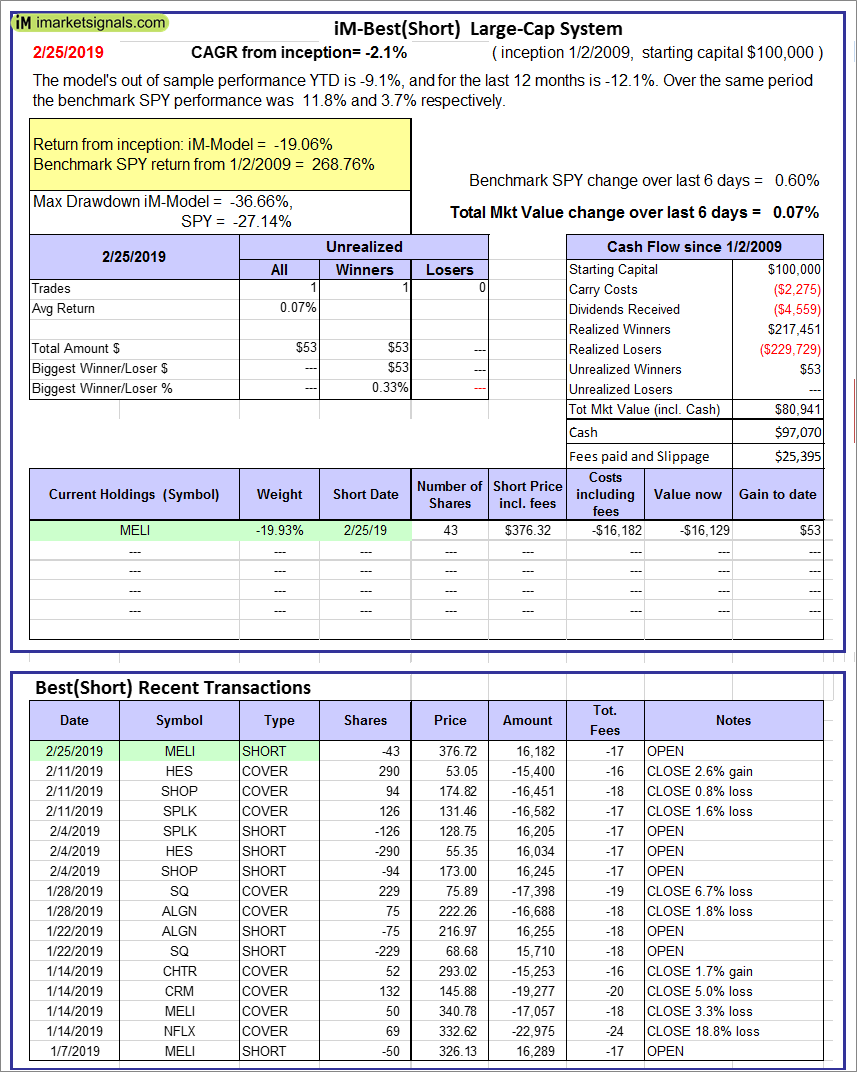 |
iM-Best(Short): The model’s out of sample performance YTD is -9.1%, and for the last 12 months is -12.1%. Over the same period the benchmark SPY performance was 11.8% and 3.7% respectively. Over the previous week the market value of iM-Best(Short) gained 0.07% at a time when SPY gained 0.60%. Over the period 1/2/2009 to 2/25/2019 the starting capital of $100,000 would have grown to $80,941 which includes $97,070 cash and excludes $25,395 spent on fees and slippage. |
 |
iM-Best2 MC-Score ETF System: The model’s out of sample performance YTD is 5.8%, and for the last 12 months is 2.1%. Over the same period the benchmark SPY performance was 11.8% and 3.7% respectively. Over the previous week the market value of the iM-Best2 MC-Score ETF System gained -0.33% at a time when SPY gained 0.60%. A starting capital of $100,000 at inception on 6/30/2016 would have grown to $112,185 which includes $313 cash and excludes $447 spent on fees and slippage. |
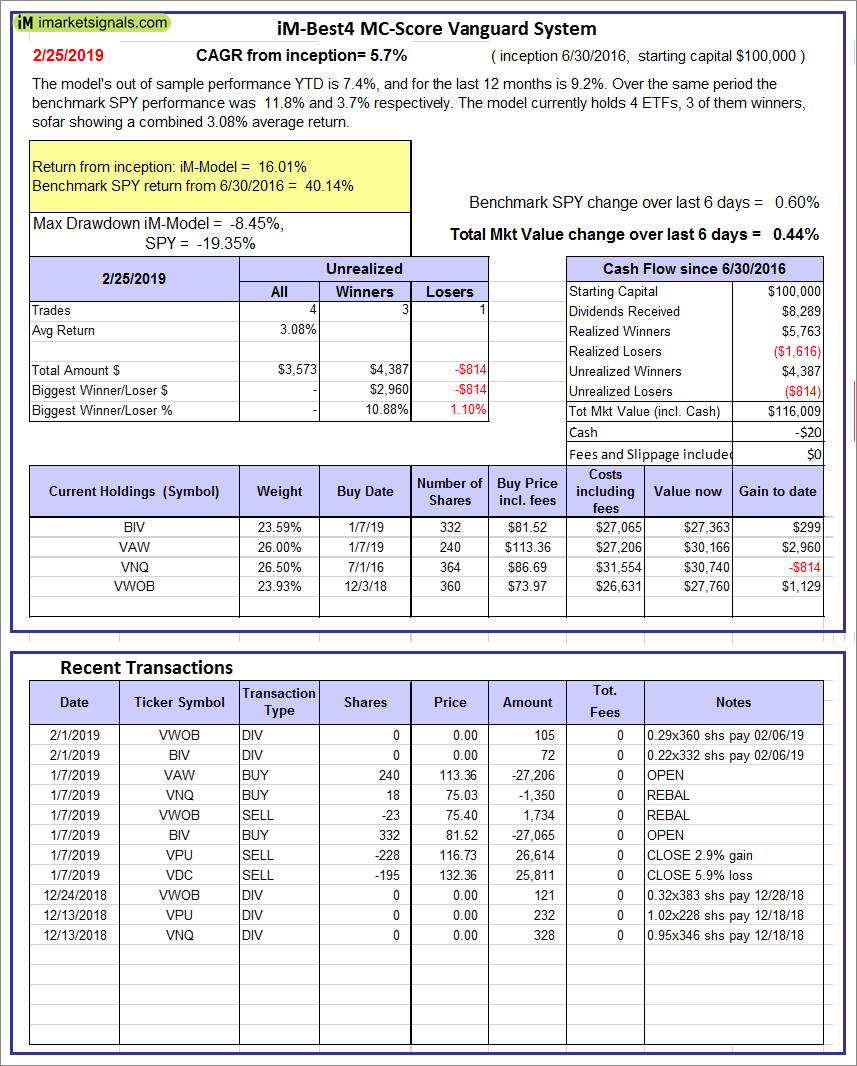 |
iM-Best4 MC-Score Vanguard System: The model’s out of sample performance YTD is 5.5%, and for the last 12 months is 9.9%. Over the same period the benchmark SPY performance was 8.3% and 5.5% respectively. Over the previous week the market value of the iM-Best4 MC-Score Vanguard System gained 0.06% at a time when SPY gained -0.49%. A starting capital of $100,000 at inception on 6/30/2016 would have grown to $113,969 which includes -$20 cash and excludes $00 spent on fees and slippage. |
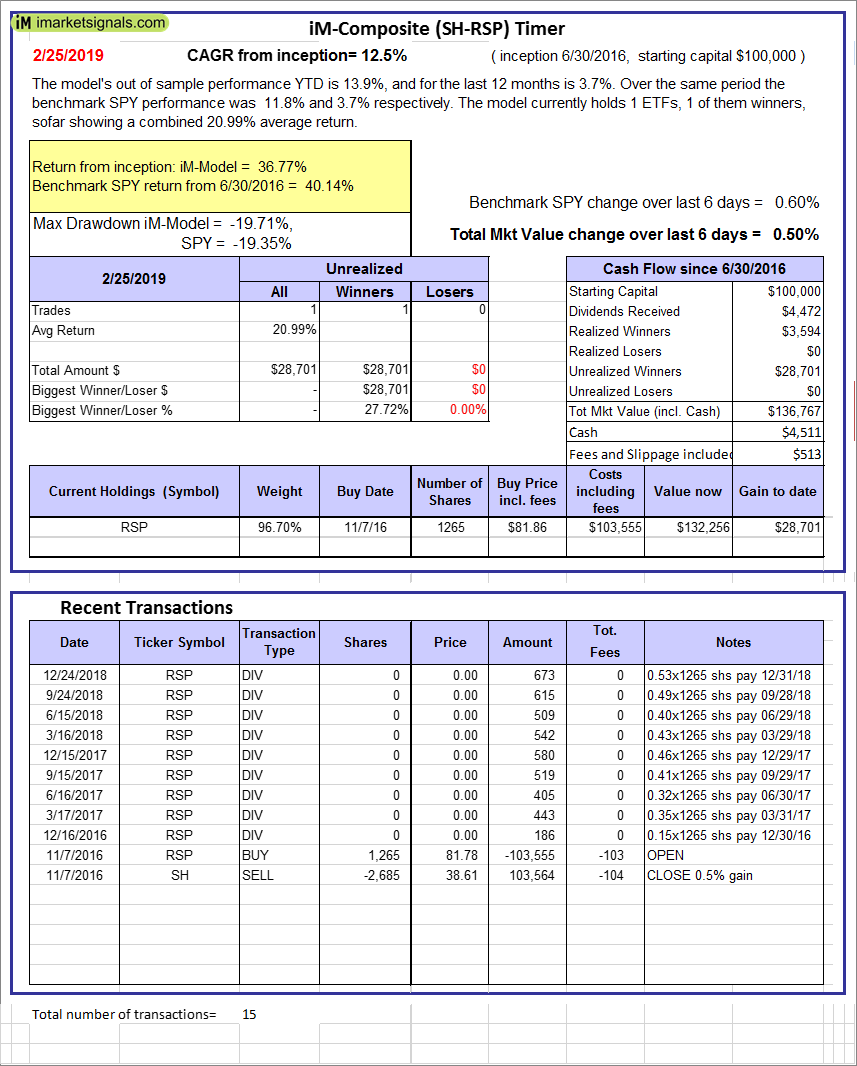 |
iM-Composite (SH-RSP) Timer: The model’s out of sample performance YTD is 13.9%, and for the last 12 months is 3.7%. Over the same period the benchmark SPY performance was 11.8% and 3.7% respectively. Over the previous week the market value of the iM-Composite (SH-RSP) Timer gained 0.50% at a time when SPY gained 0.60%. A starting capital of $100,000 at inception on 6/30/2016 would have grown to $136,767 which includes $4,511 cash and excludes $513 spent on fees and slippage. |
 |
iM-Composite (SPY-IEF) Timer: The model’s out of sample performance YTD is 2.9%, and for the last 12 months is 5.9%. Over the same period the benchmark SPY performance was 11.8% and 3.7% respectively. Over the previous week the market value of the iM-Composite (SPY-IEF) Timer gained -0.17% at a time when SPY gained 0.60%. A starting capital of $100,000 at inception on 6/30/2016 would have grown to $145,285 which includes $1,053 cash and excludes $2,486 spent on fees and slippage. |
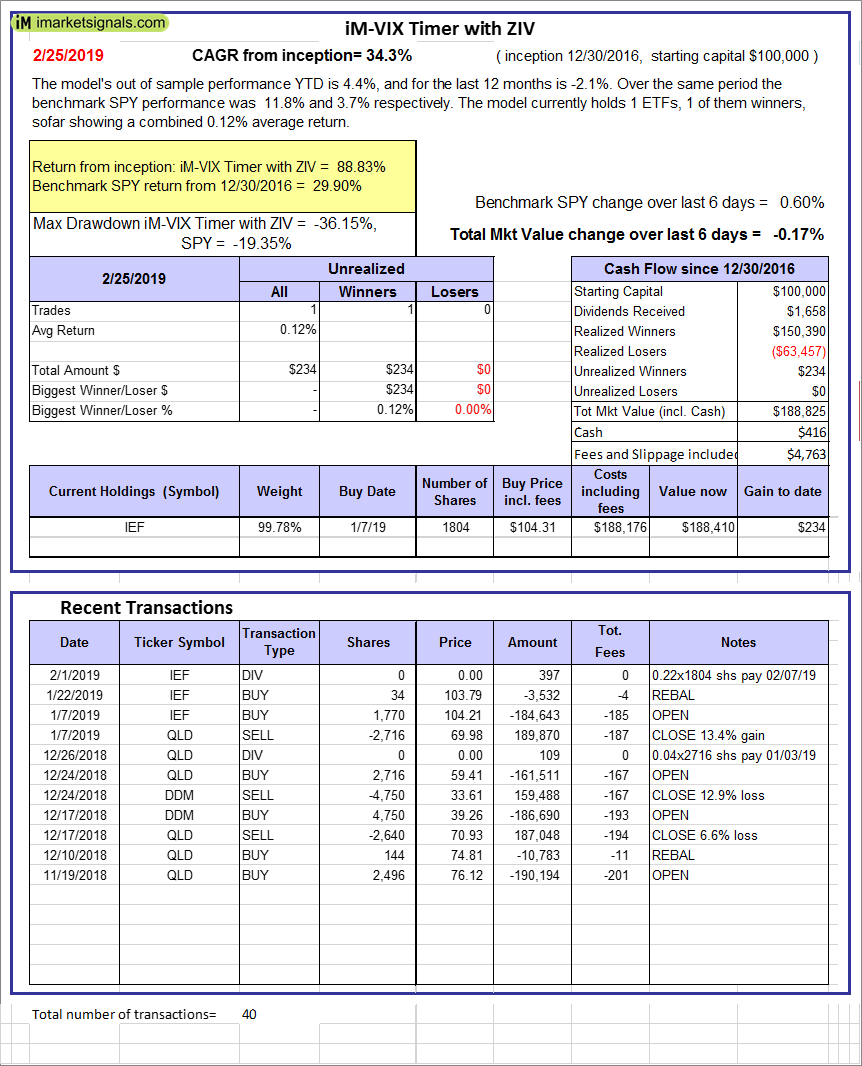 |
iM-VIX Timer with ZIV: The model’s out of sample performance YTD is 4.4%, and for the last 12 months is -2.1%. Over the same period the benchmark SPY performance was 11.8% and 3.7% respectively. Over the previous week the market value of the iM-VIX Timer with ZIV gained -0.17% at a time when SPY gained 0.60%. A starting capital of $100,000 at inception on 6/30/2016 would have grown to $188,825 which includes $416 cash and excludes $4,763 spent on fees and slippage. |
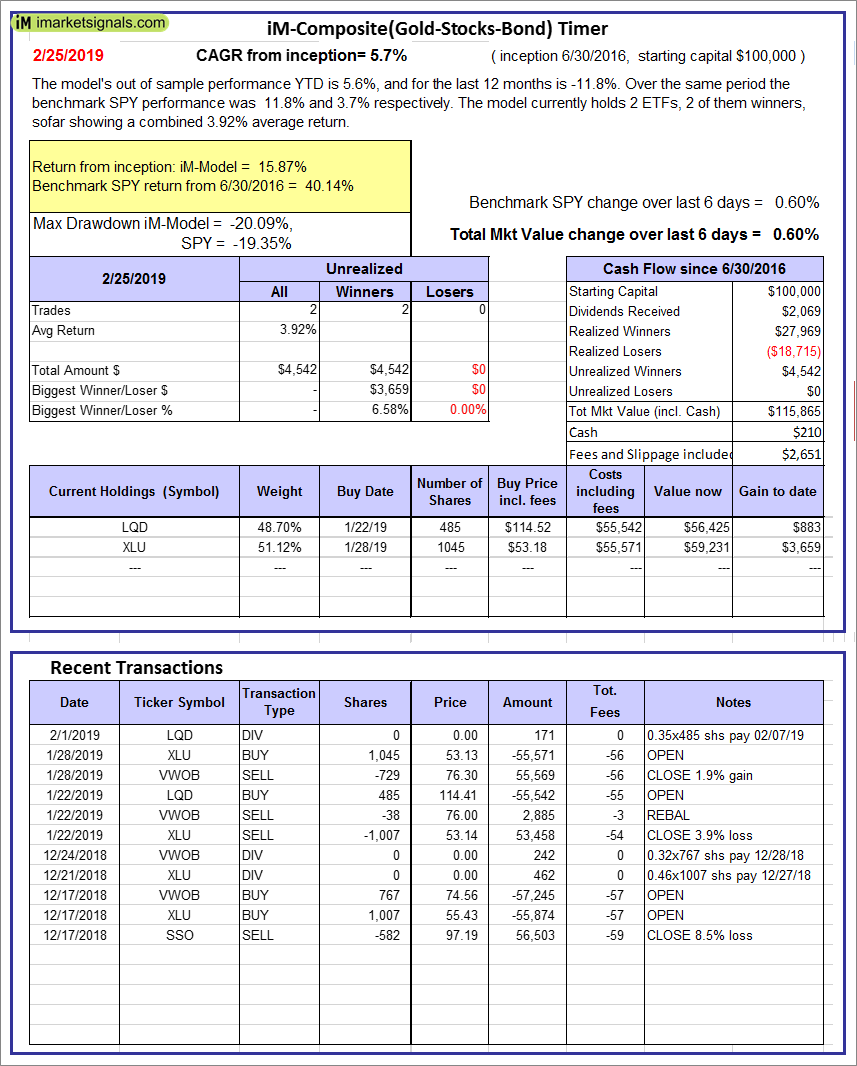 |
iM-Composite(Gold-Stocks-Bond) Timer: The model’s out of sample performance YTD is 5.6%, and for the last 12 months is -11.8%. Over the same period the benchmark SPY performance was 11.8% and 3.7% respectively. Over the previous week the market value of the iM-Composite(Gold-Stocks-Bond) Timer gained 0.60% at a time when SPY gained 0.60%. A starting capital of $100,000 at inception on 6/30/2016 would have grown to $115,865 which includes $210 cash and excludes $2,651 spent on fees and slippage. |
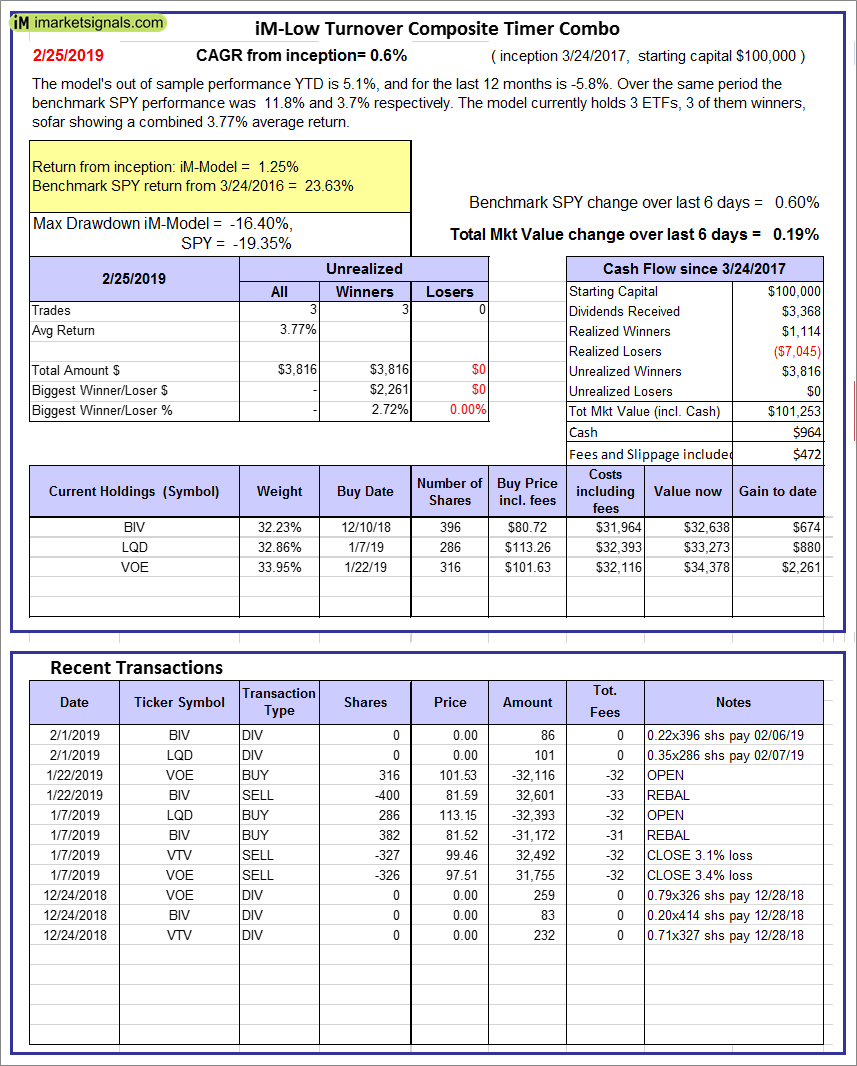 |
iM-Low Turnover Composite Timer Combo: The model’s out of sample performance YTD is 5.1%, and for the last 12 months is -5.8%. Over the same period the benchmark SPY performance was 11.8% and 3.7% respectively. Over the previous week the market value of the iM-Low Turnover Composite Timer Combo gained 0.19% at a time when SPY gained 0.60%. A starting capital of $100,000 at inception on 3/24/27 would have grown to $101,253 which includes $964 cash and excludes $472 spent on fees and slippage. |
 |
iM-Min Drawdown Combo: The model’s out of sample performance YTD is 7.4%, and for the last 12 months is 0.6%. Over the same period the benchmark SPY performance was 11.8% and 3.7% respectively. Over the previous week the market value of the iM-Min Drawdown Combo gained -0.83% at a time when SPY gained 0.60%. A starting capital of $100,000 at inception on 4/5/2017 would have grown to $109,562 which includes $2,973 cash and excludes $805 spent on fees and slippage. |
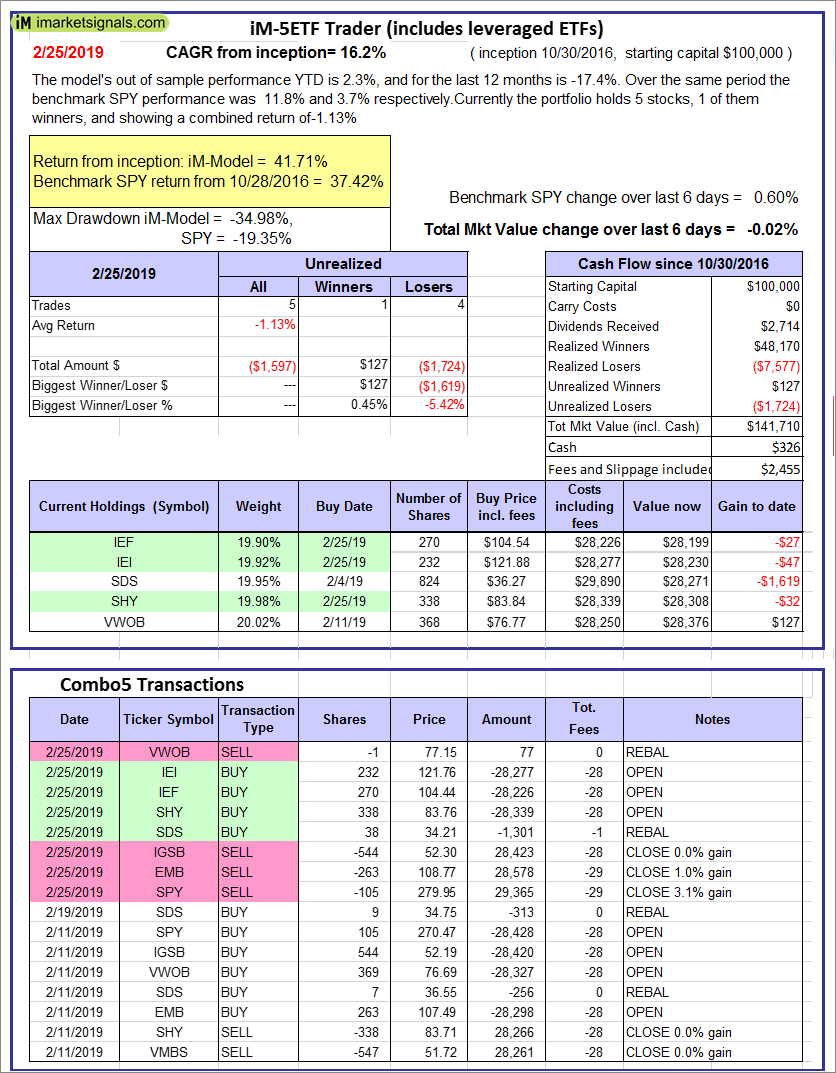 |
iM-5ETF Trader (includes leveraged ETFs): The model’s out of sample performance YTD is 2.3%, and for the last 12 months is -17.4%. Over the same period the benchmark SPY performance was 11.8% and 3.7% respectively. Over the previous week the market value of the iM-5ETF Trader (includes leveraged ETFs) gained -0.02% at a time when SPY gained 0.60%. A starting capital of $100,000 at inception on 10/30/2016 would have grown to $141,710 which includes $326 cash and excludes $2,455 spent on fees and slippage. |
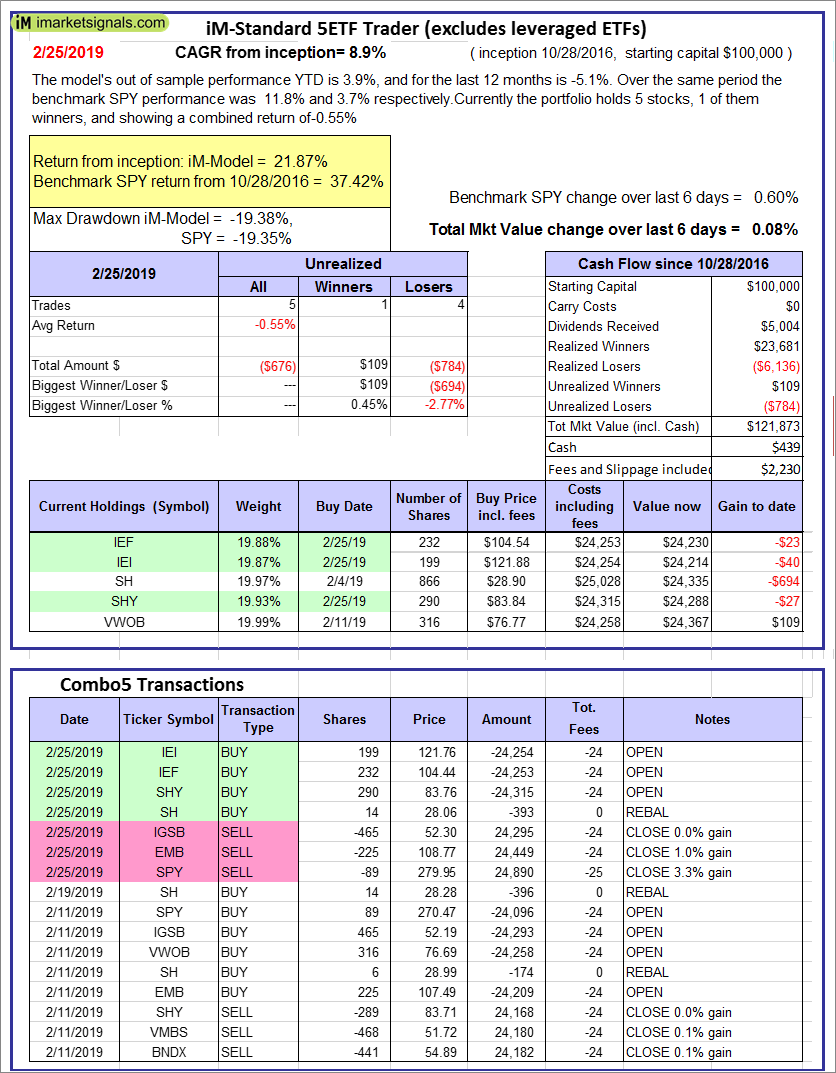 |
iM-Standard 5ETF Trader (excludes leveraged ETFs): The model’s out of sample performance YTD is 3.9%, and for the last 12 months is -5.1%. Over the same period the benchmark SPY performance was 11.8% and 3.7% respectively. Over the previous week the market value of the iM-Standard 5ETF Trader (excludes leveraged ETFs) gained 0.08% at a time when SPY gained 0.60%. A starting capital of $100,000 at inception on 10/30/2016 would have grown to $121,873 which includes $439 cash and excludes $2,230 spent on fees and slippage. |
iM-Best Reports – 2/25/2019
Posted in pmp SPY-SH
Leave a Reply
You must be logged in to post a comment.