
  |
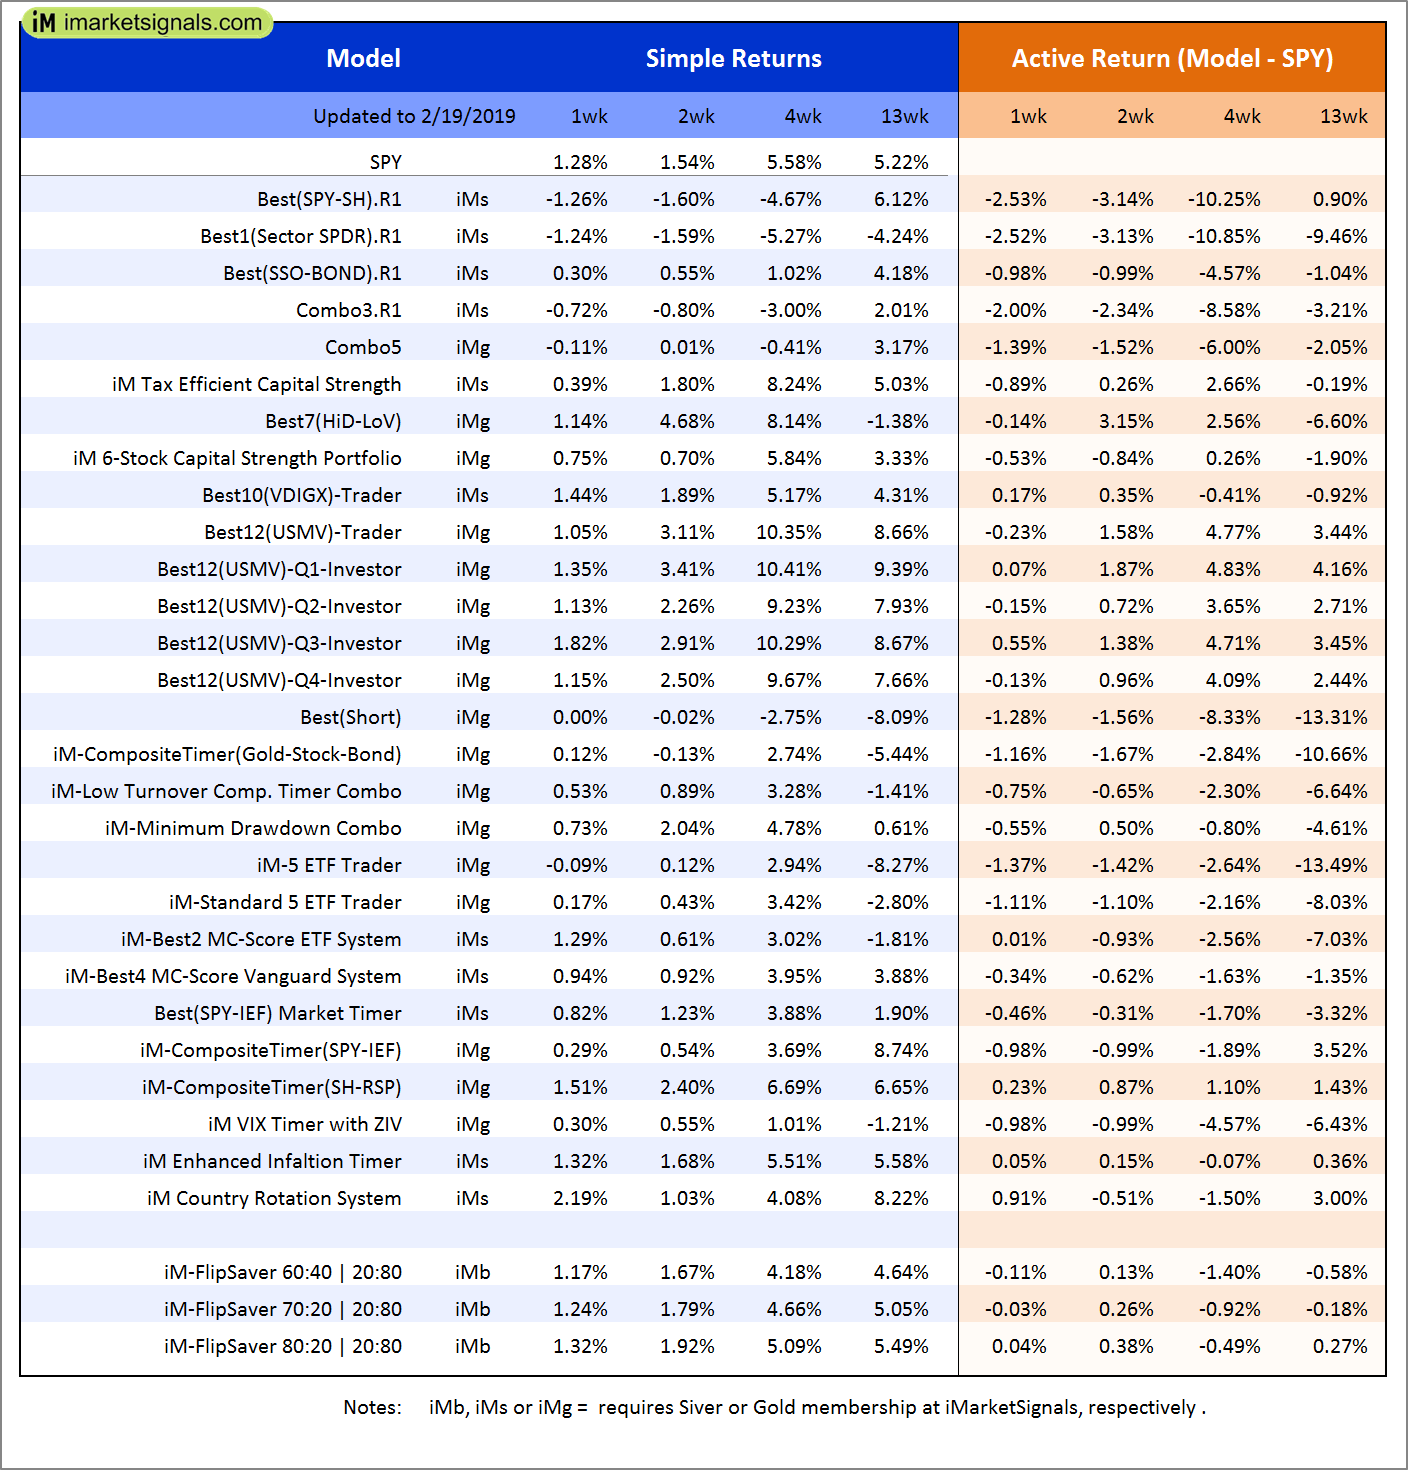
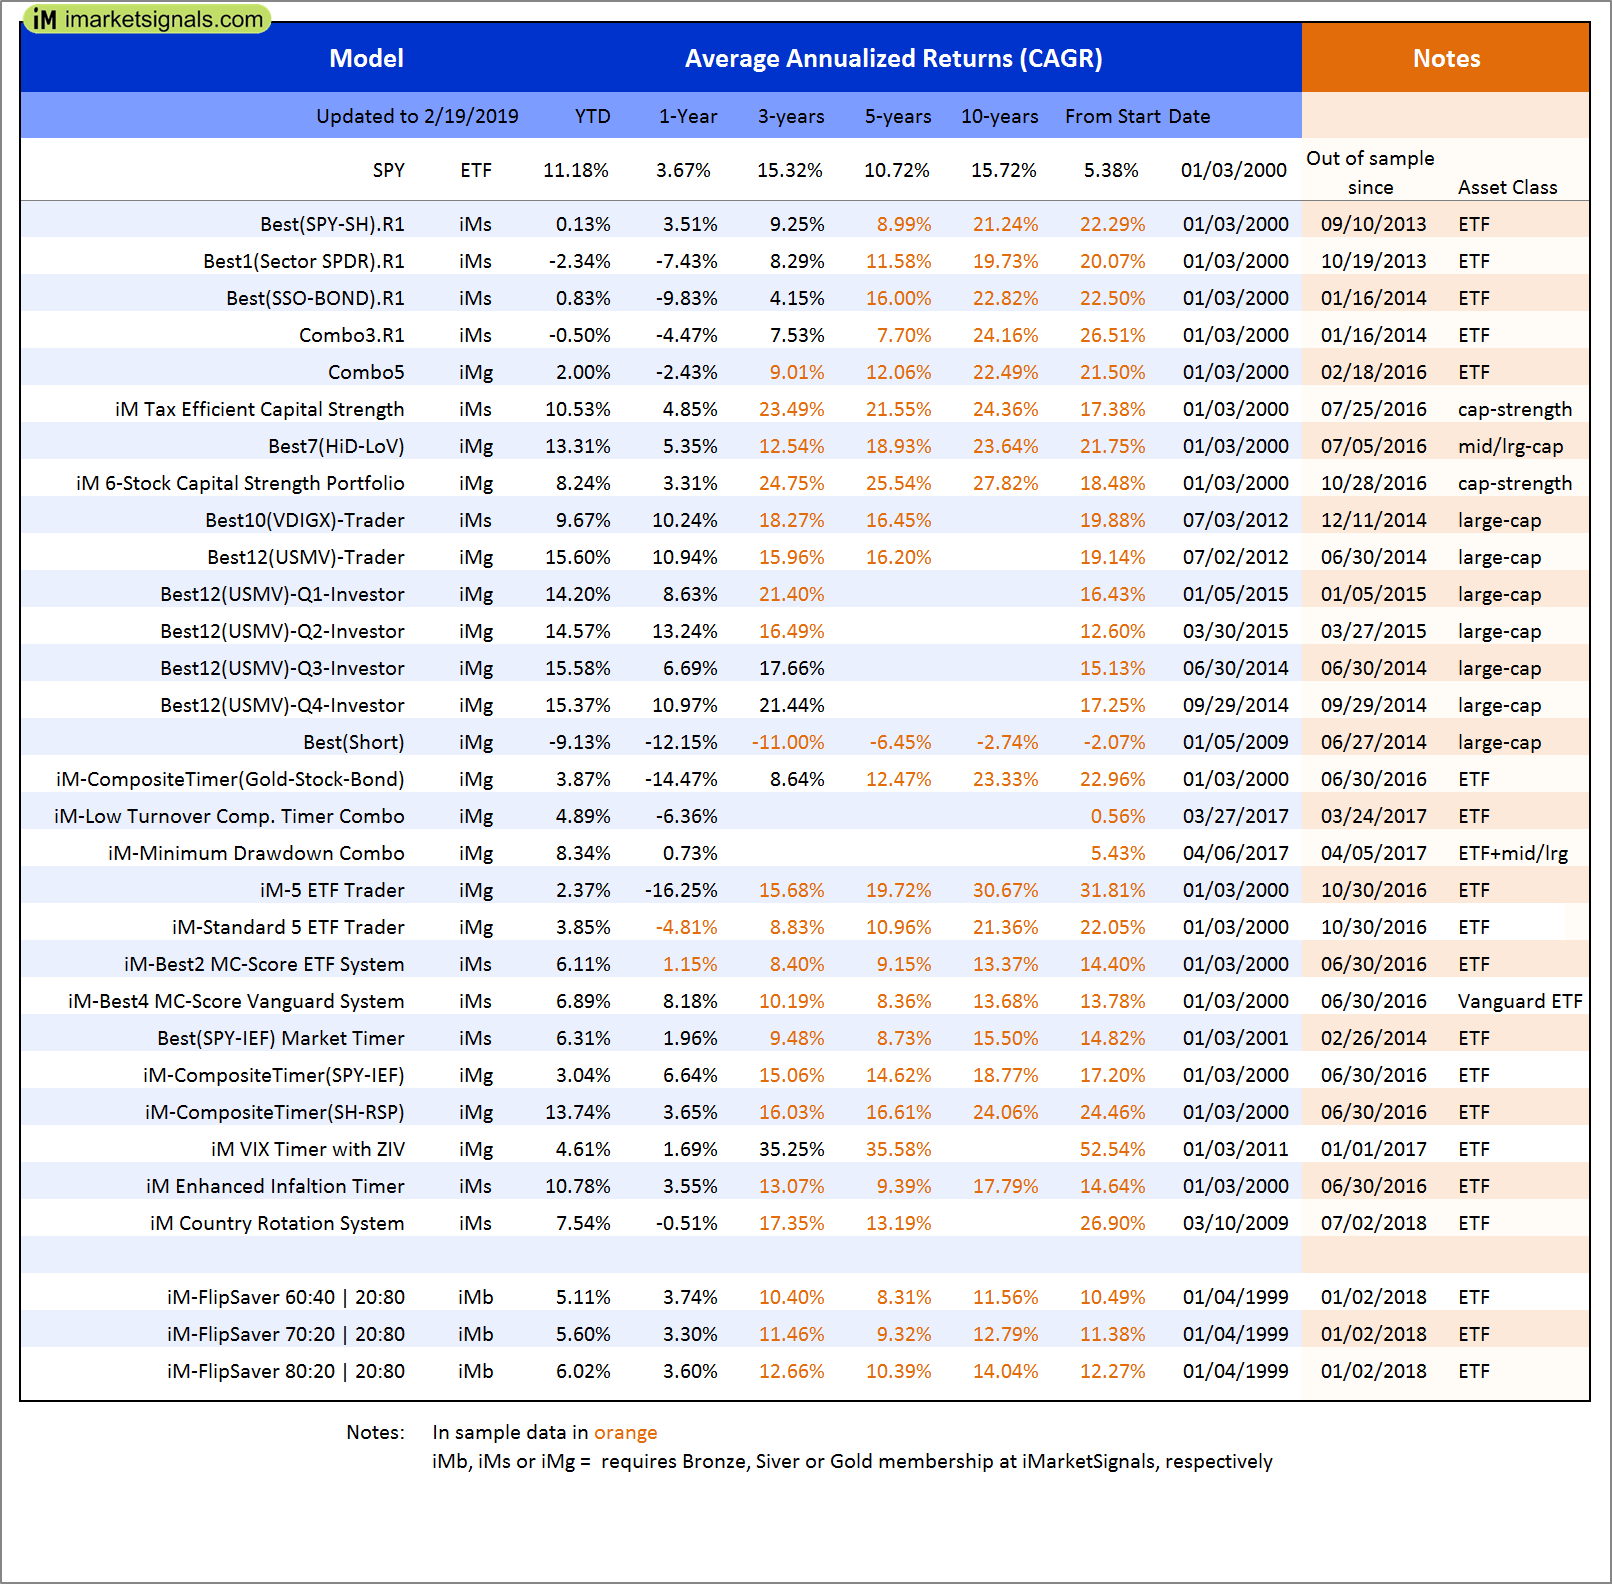
Out of sample performance summary of our models for the past 1, 2, 4 and 13 week periods. The active active return indicates how the models over- or underperformed the benchmark ETF SPY. Also the YTD, and the 1-, 3-, 5- and 10-year annualized returns are shown in the second table |
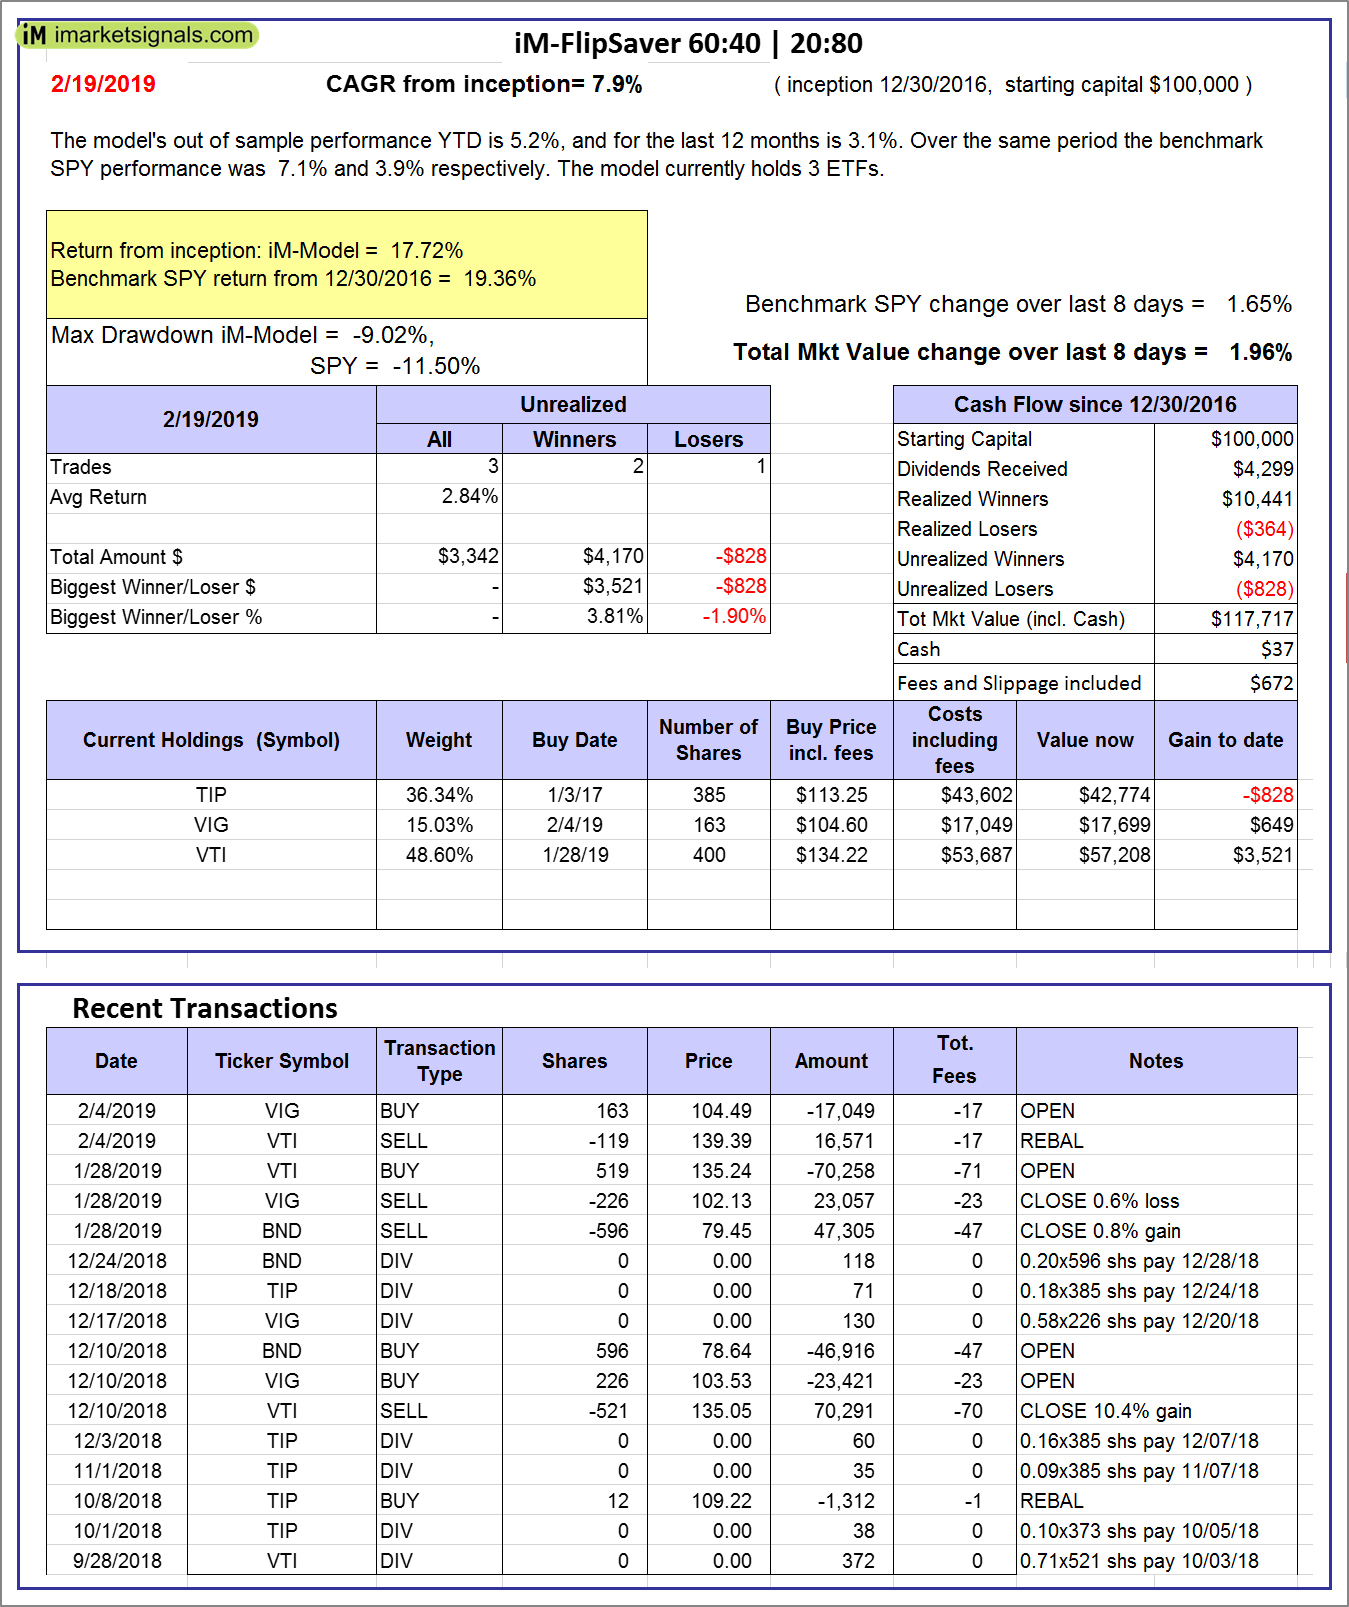 |
iM-FlipSaver 60:40 | 20:80 – 2017: The model’s out of sample performance YTD is 5.2%, and for the last 12 months is 3.1%. Over the same period the benchmark SPY performance was 7.1% and 3.9% respectively. Over the previous week the market value of iM-FlipSaver 80:20 | 20:80 gained 1.96% at a time when SPY gained 1.65%. A starting capital of $100,000 at inception on 7/16/2015 would have grown to $117,717 which includes $37 cash and excludes $672 spent on fees and slippage. |
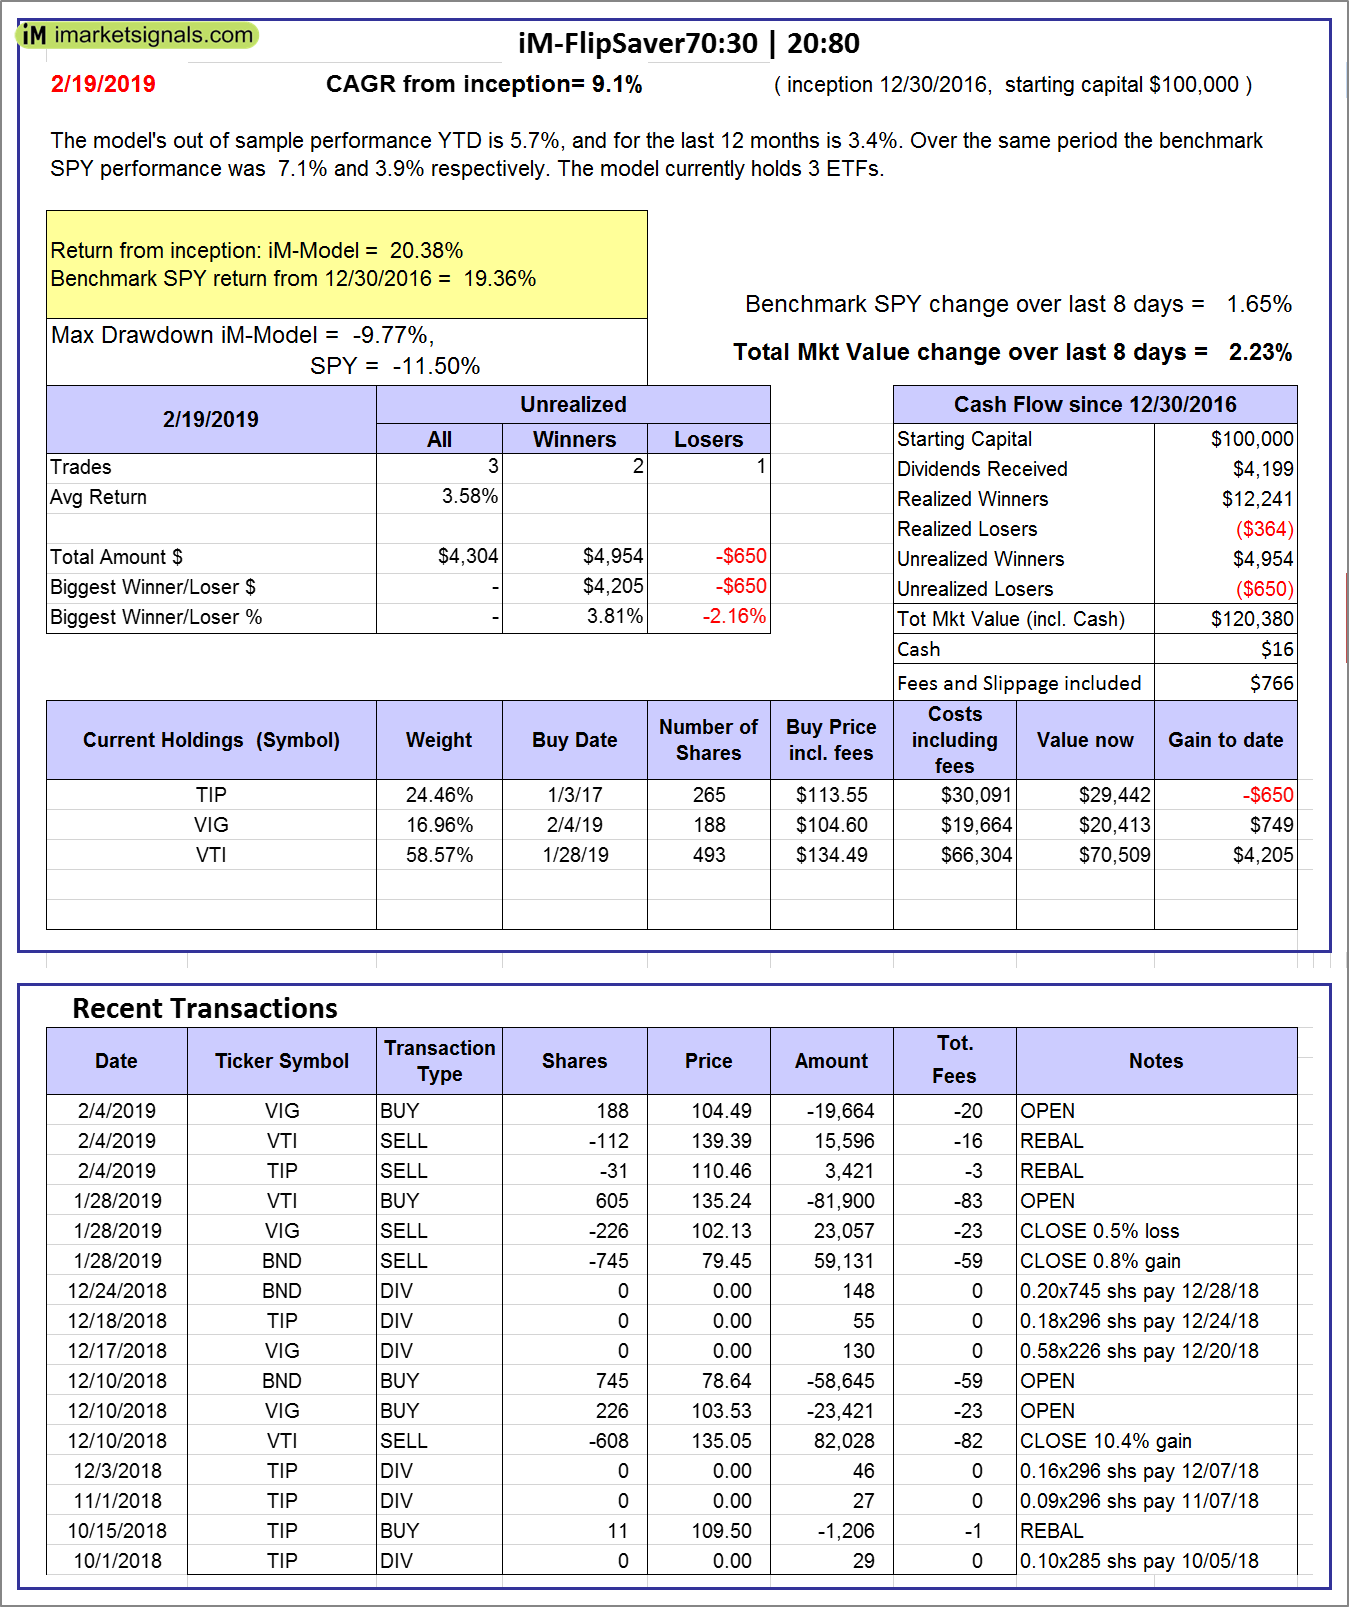 |
iM-FlipSaver 70:30 | 20:80 – 2017: The model’s out of sample performance YTD is 5.7%, and for the last 12 months is 3.4%. Over the same period the benchmark SPY performance was 7.1% and 3.9% respectively. Over the previous week the market value of iM-FlipSaver 70:30 | 20:80 gained 2.23% at a time when SPY gained 1.65%. A starting capital of $100,000 at inception on 7/15/2015 would have grown to $120,380 which includes $16 cash and excludes $766 spent on fees and slippage. |
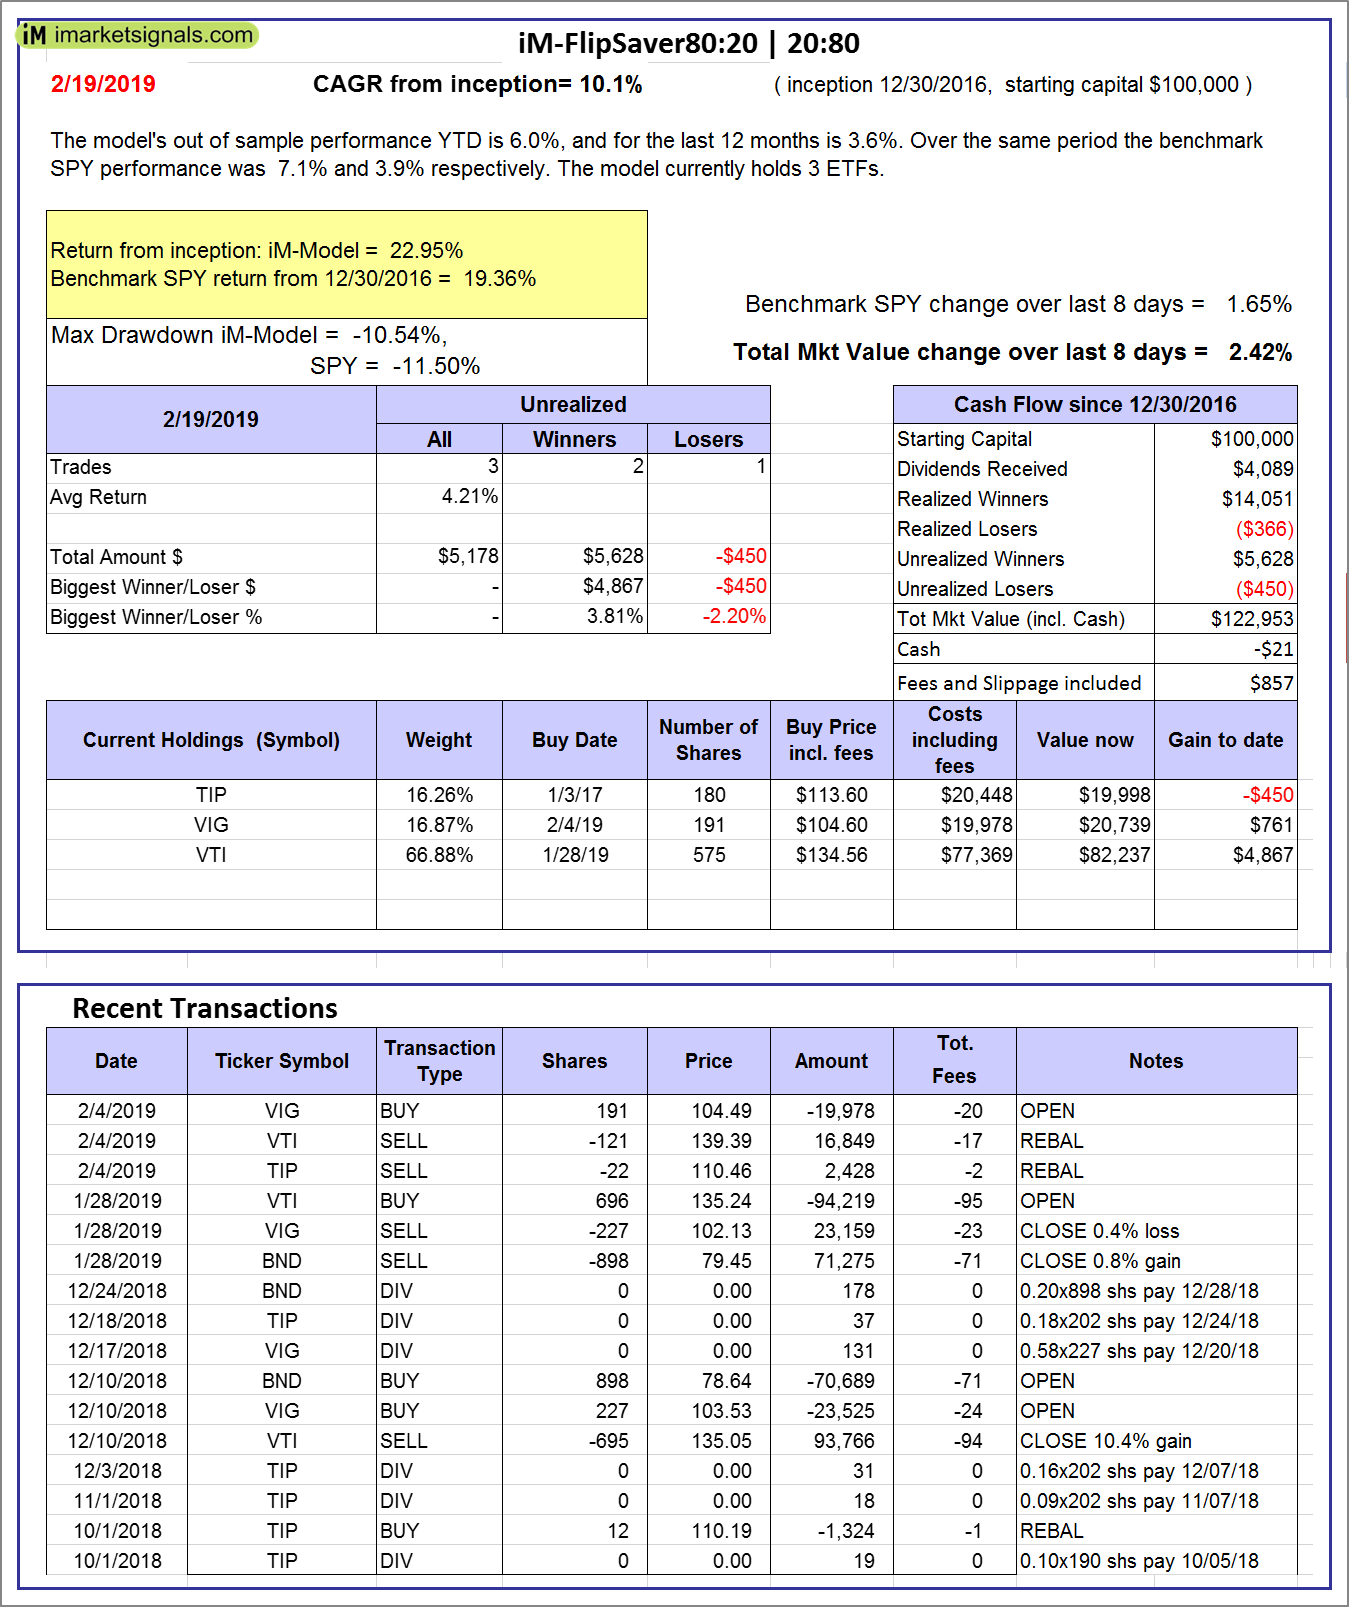 |
iM-FlipSaver 80:20 | 20:80 – 2017: The model’s out of sample performance YTD is 6.0%, and for the last 12 months is 3.6%. Over the same period the benchmark SPY performance was 7.1% and 3.9% respectively. Over the previous week the market value of iM-FlipSaver 80:20 | 20:80 gained 2.42% at a time when SPY gained 1.65%. A starting capital of $100,000 at inception on 1/2/2017 would have grown to $122,953 which includes -$21 cash and excludes $857 spent on fees and slippage. |
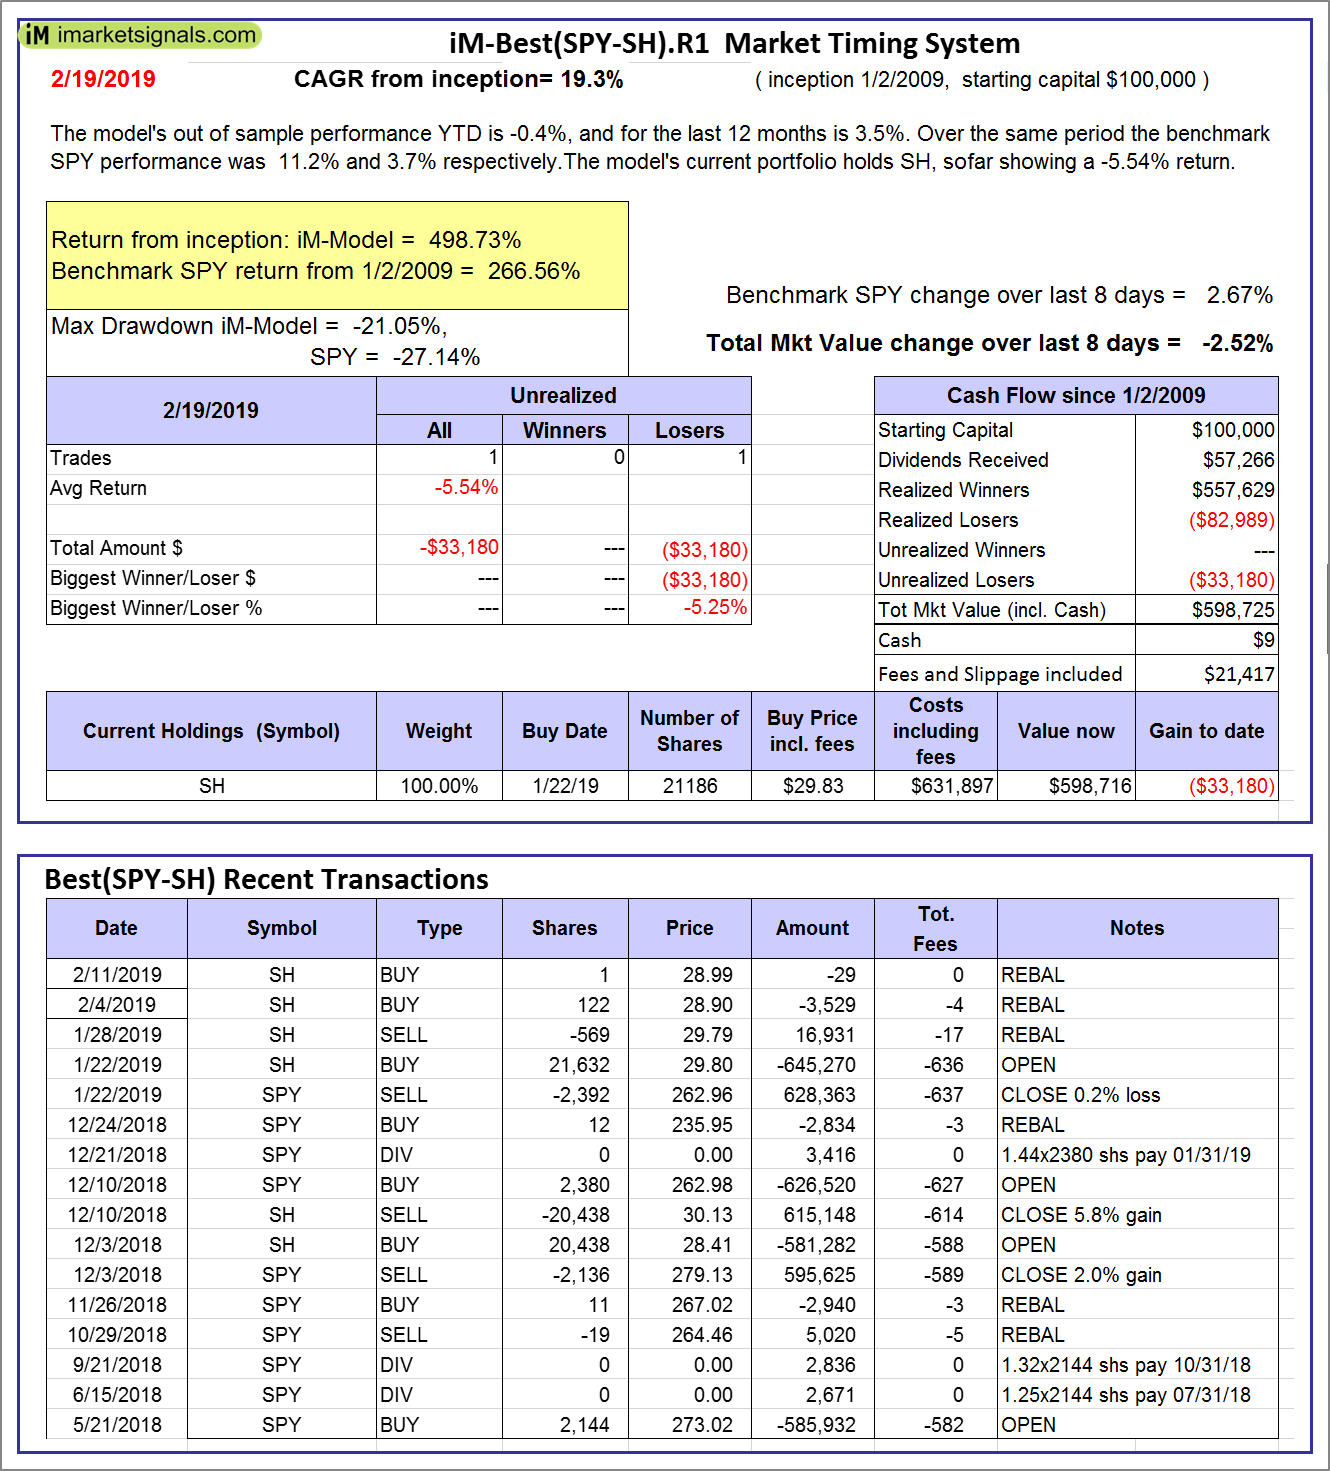 |
iM-Best(SPY-SH).R1: The model’s out of sample performance YTD is -0.4%, and for the last 12 months is 3.5%. Over the same period the benchmark SPY performance was 11.2% and 3.7% respectively. Over the previous week the market value of Best(SPY-SH) gained -2.52% at a time when SPY gained 2.67%. A starting capital of $100,000 at inception on 1/2/2009 would have grown to $598,725 which includes $9 cash and excludes $21,417 spent on fees and slippage. |
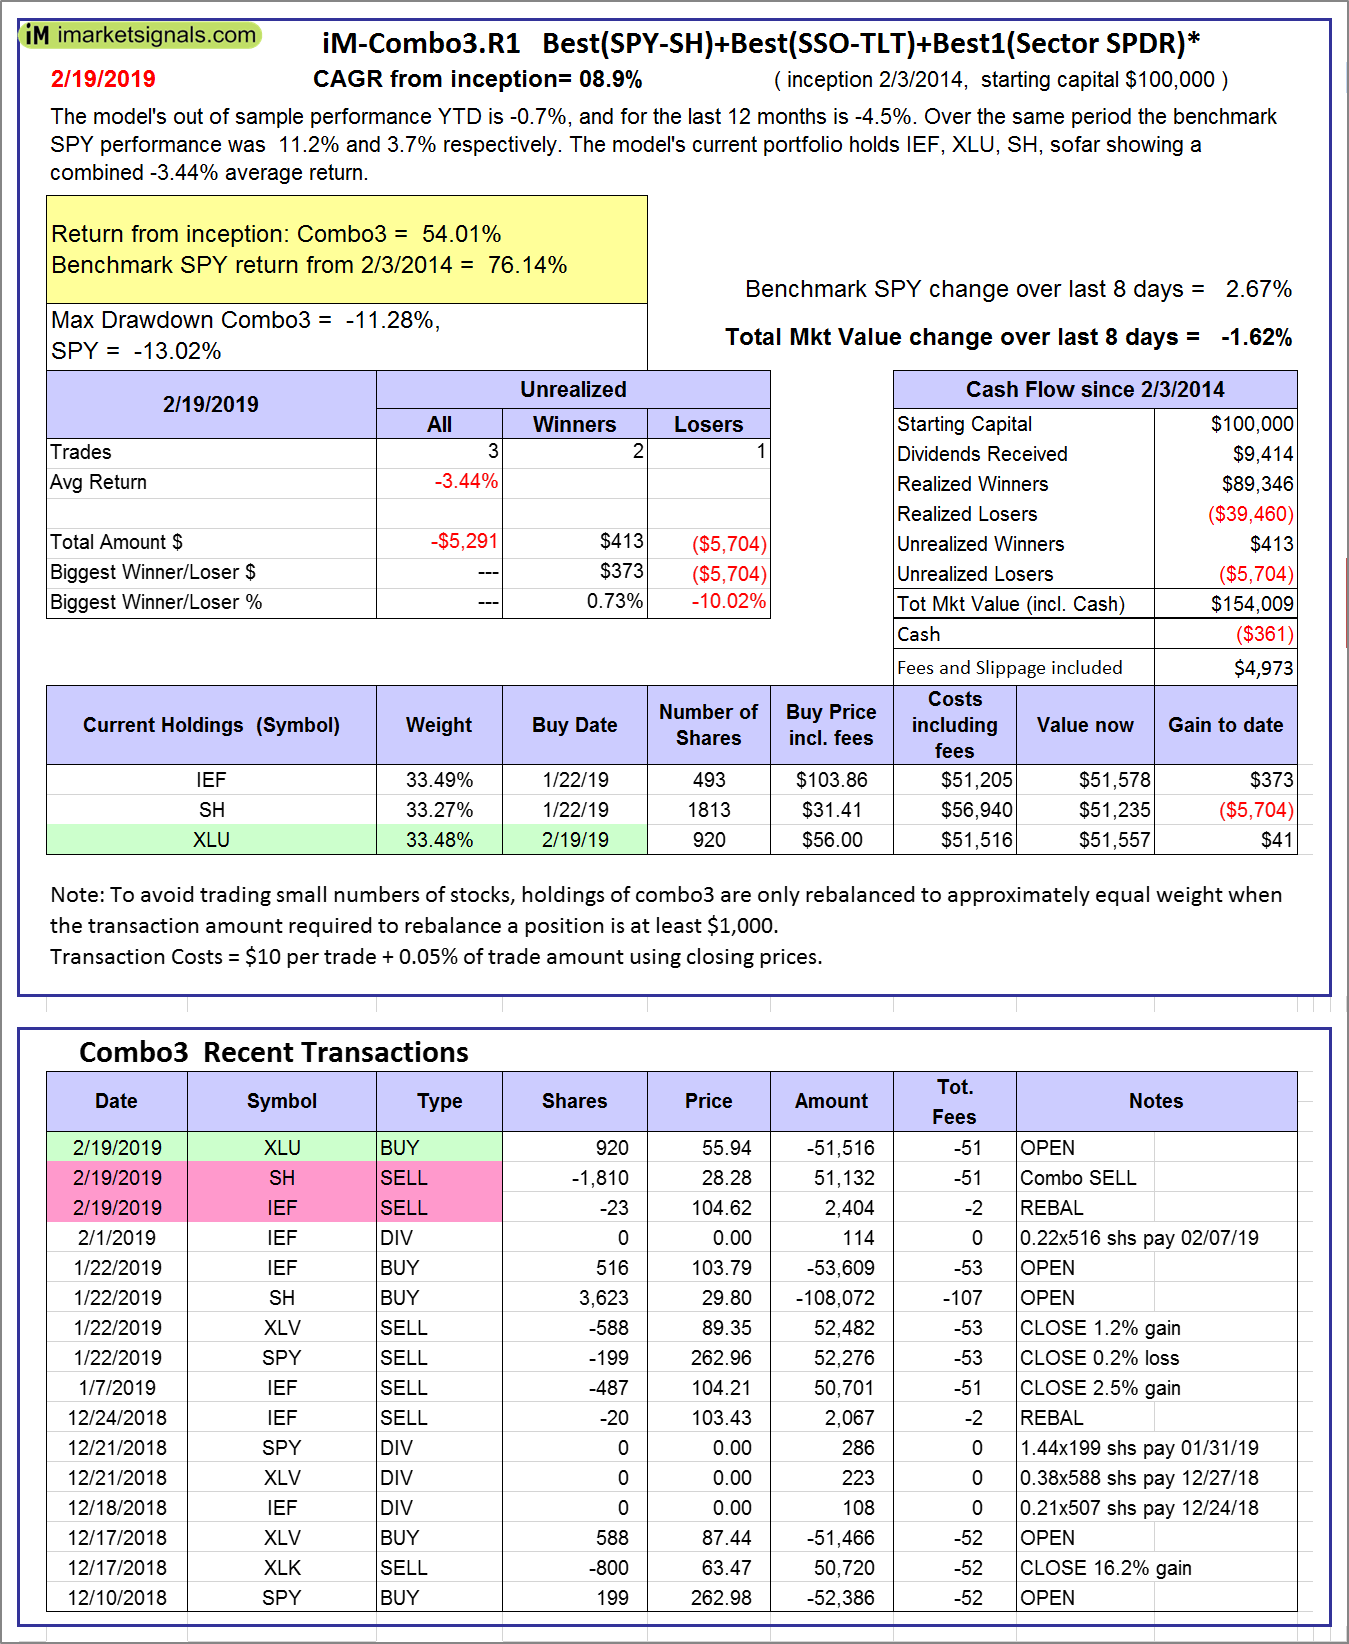 |
iM-Combo3.R1: The model’s out of sample performance YTD is -0.7%, and for the last 12 months is -4.5%. Over the same period the benchmark SPY performance was 11.2% and 3.7% respectively. Over the previous week the market value of iM-Combo3.R1 gained -1.62% at a time when SPY gained 2.67%. A starting capital of $100,000 at inception on 2/3/2014 would have grown to $154,009 which includes -$361 cash and excludes $4,973 spent on fees and slippage. |
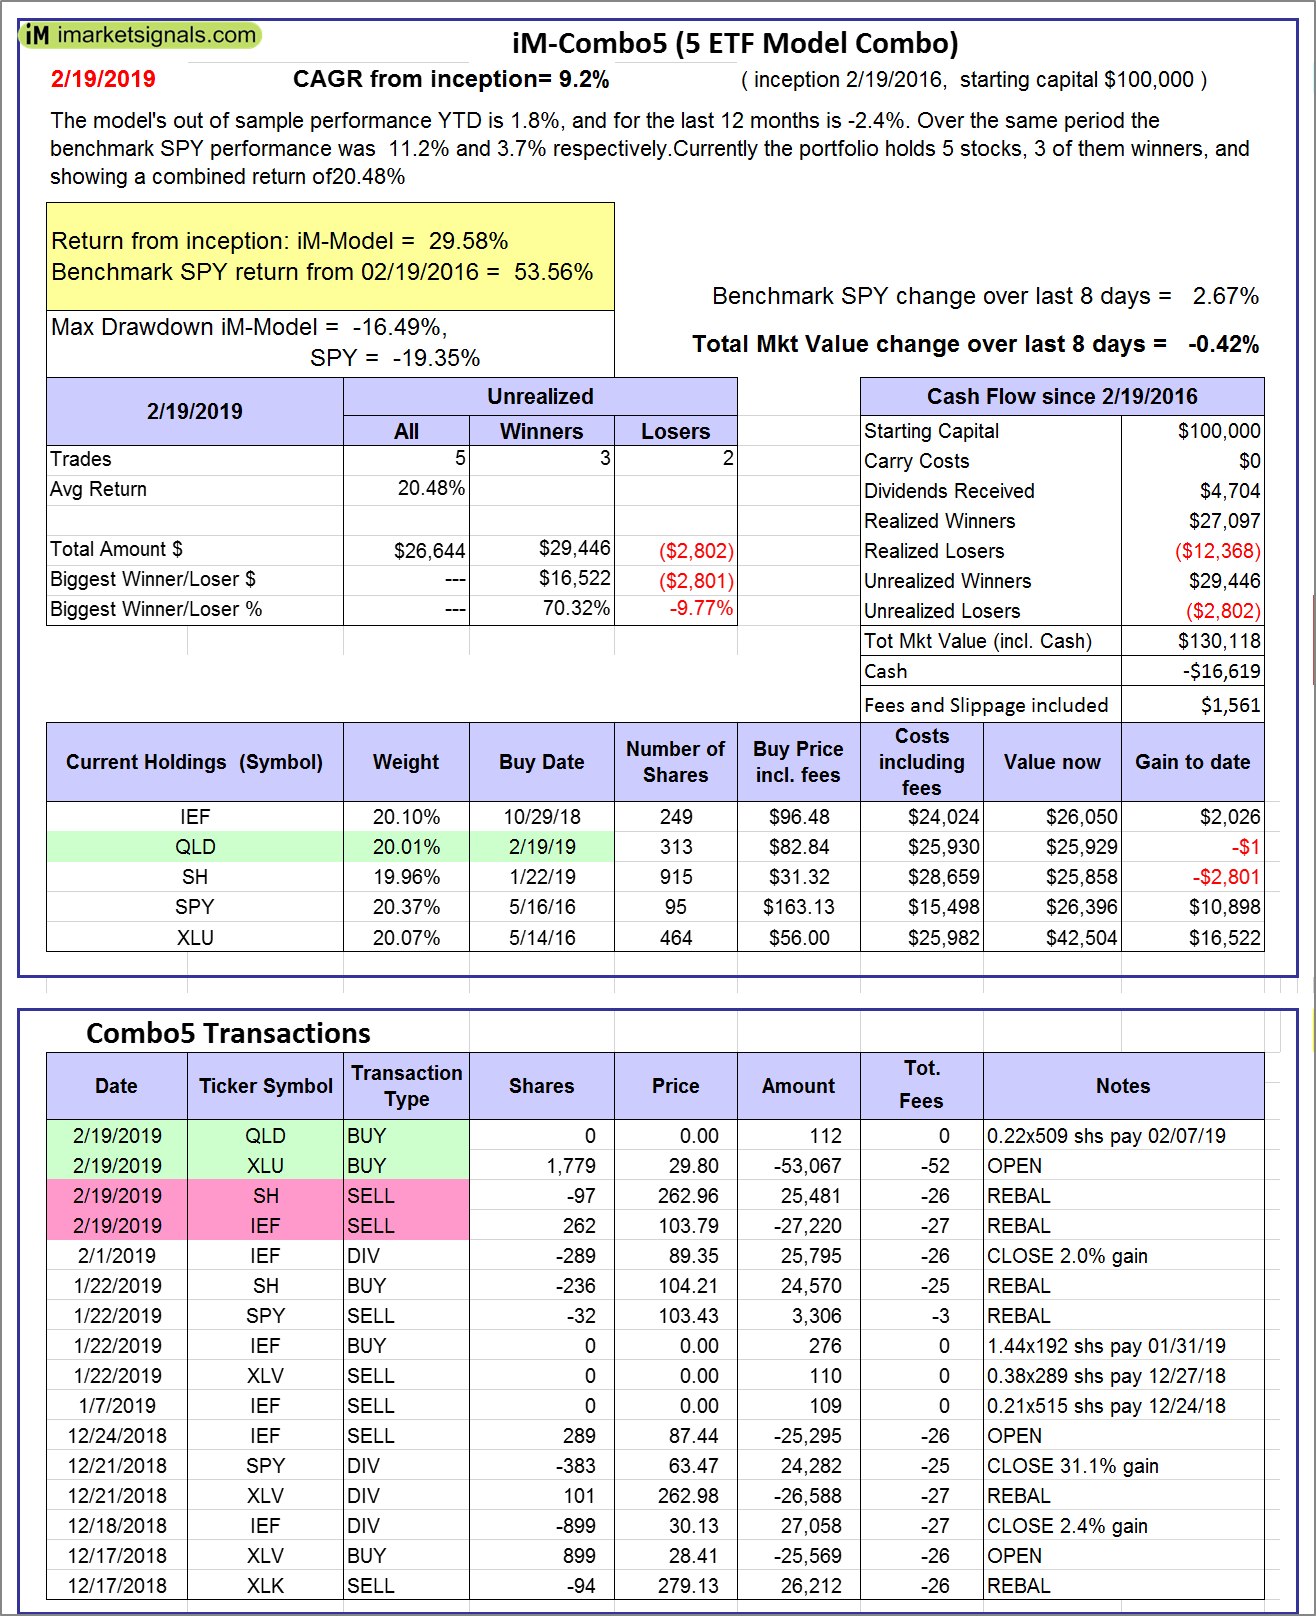 |
iM-Combo5: The model’s out of sample performance YTD is 2.2%, and for the last 12 months is 3.1%. Over the same period the benchmark SPY performance was 8.3% and 5.5% respectively. Over the previous week the market value of iM-Combo5 gained 0.36% at a time when SPY gained -0.49%. A starting capital of $100,000 at inception on 2/22/2016 would have grown to $130,118 which includes -$329 cash and excludes $1,457 spent on fees and slippage. |
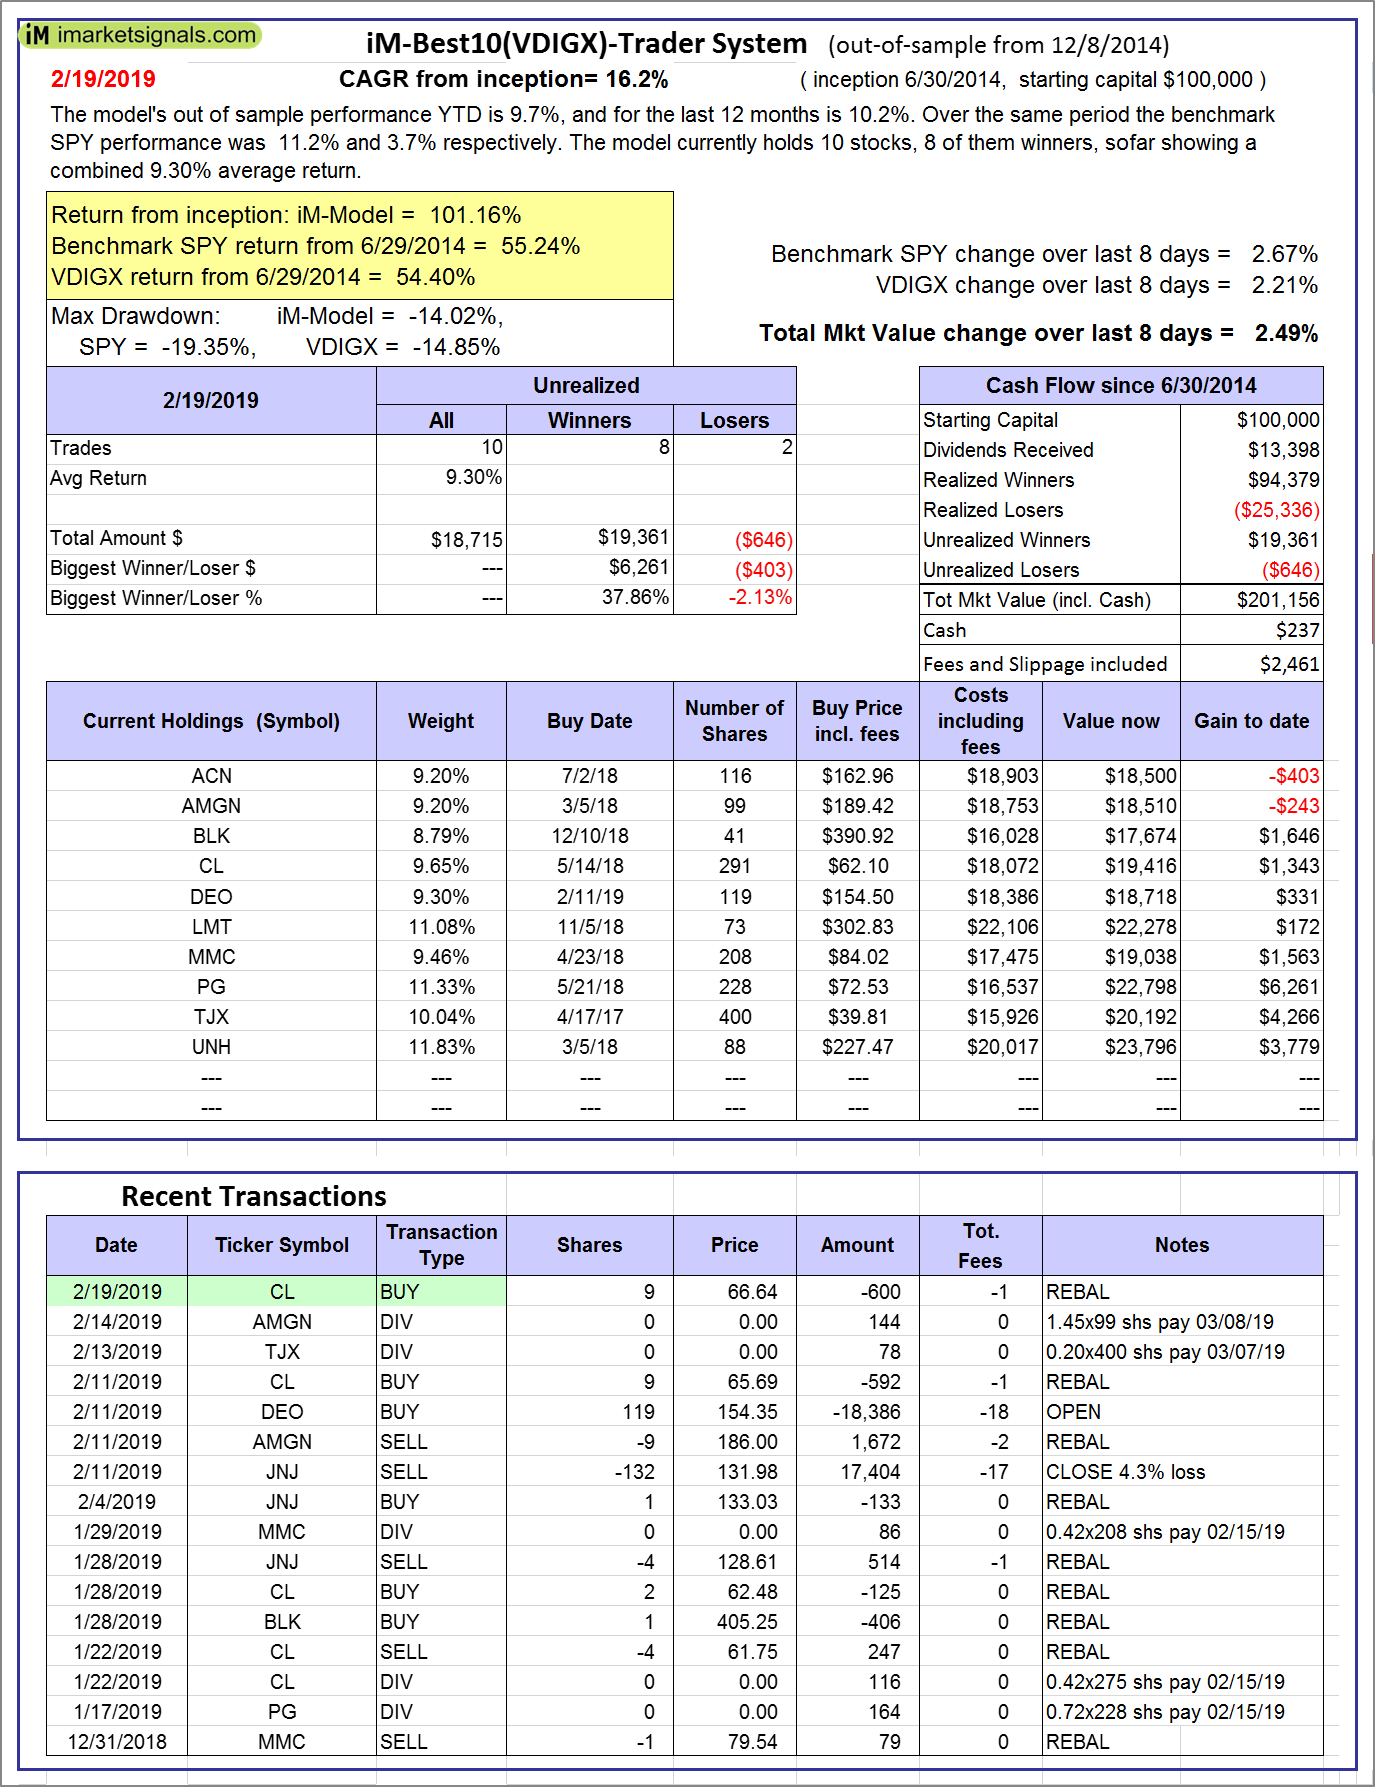 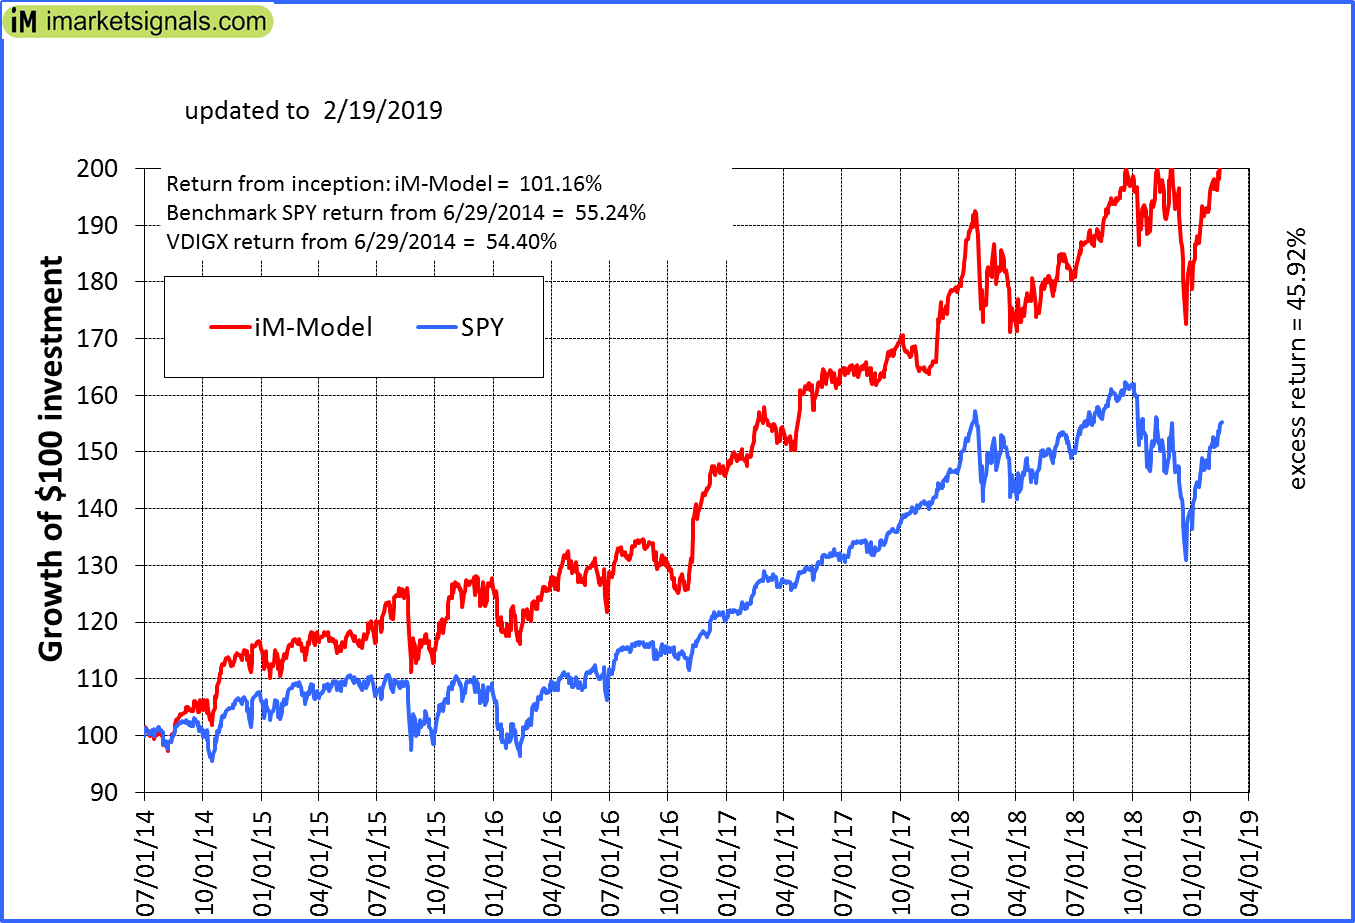 |
iM-Best10(VDIGX)-Trader: The model’s out of sample performance YTD is 9.7%, and for the last 12 months is 10.2%. Over the same period the benchmark SPY performance was 11.2% and 3.7% respectively. Since inception, on 7/1/2014, the model gained 101.16% while the benchmark SPY gained 55.24% and VDIGX gained 54.40% over the same period. Over the previous week the market value of iM-Best10(VDIGX) gained 2.49% at a time when SPY gained 2.67%. A starting capital of $100,000 at inception on 7/1/2014 would have grown to $201,156 which includes $237 cash and excludes $2,461 spent on fees and slippage. |
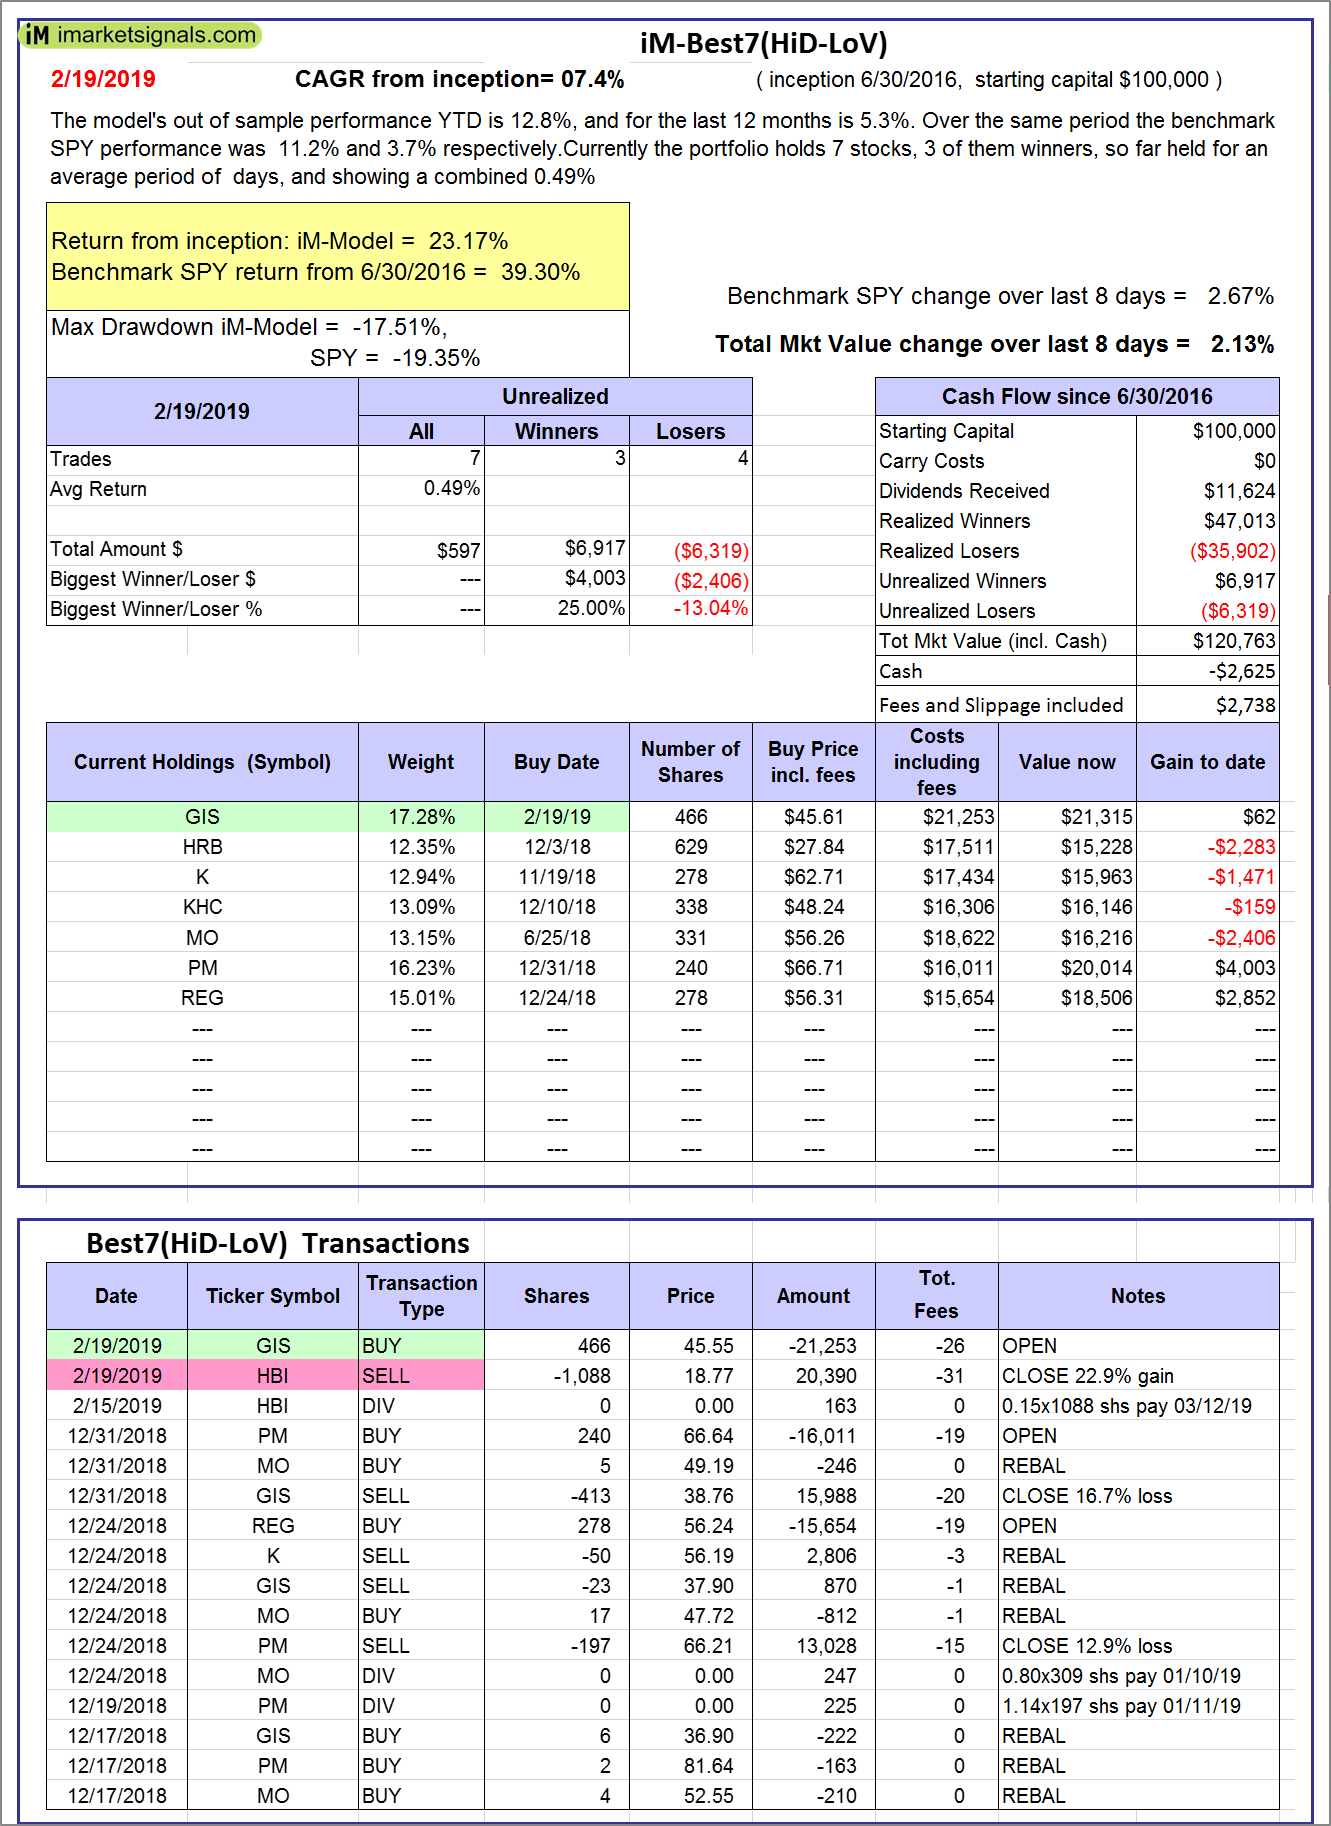 |
iM-Best7(HiD-LoV): The model’s out of sample performance YTD is 10.5%, and for the last 12 months is 7.7%. Over the same period the benchmark SPY performance was 8.3% and 5.5% respectively. Over the previous week the market value of iM-BESTOGA-3 gained 2.98% at a time when SPY gained -0.49%. A starting capital of $100,000 at inception on 6/30/2016 would have grown to $120,763 which includes $645 cash and excludes $2,681 spent on fees and slippage. |
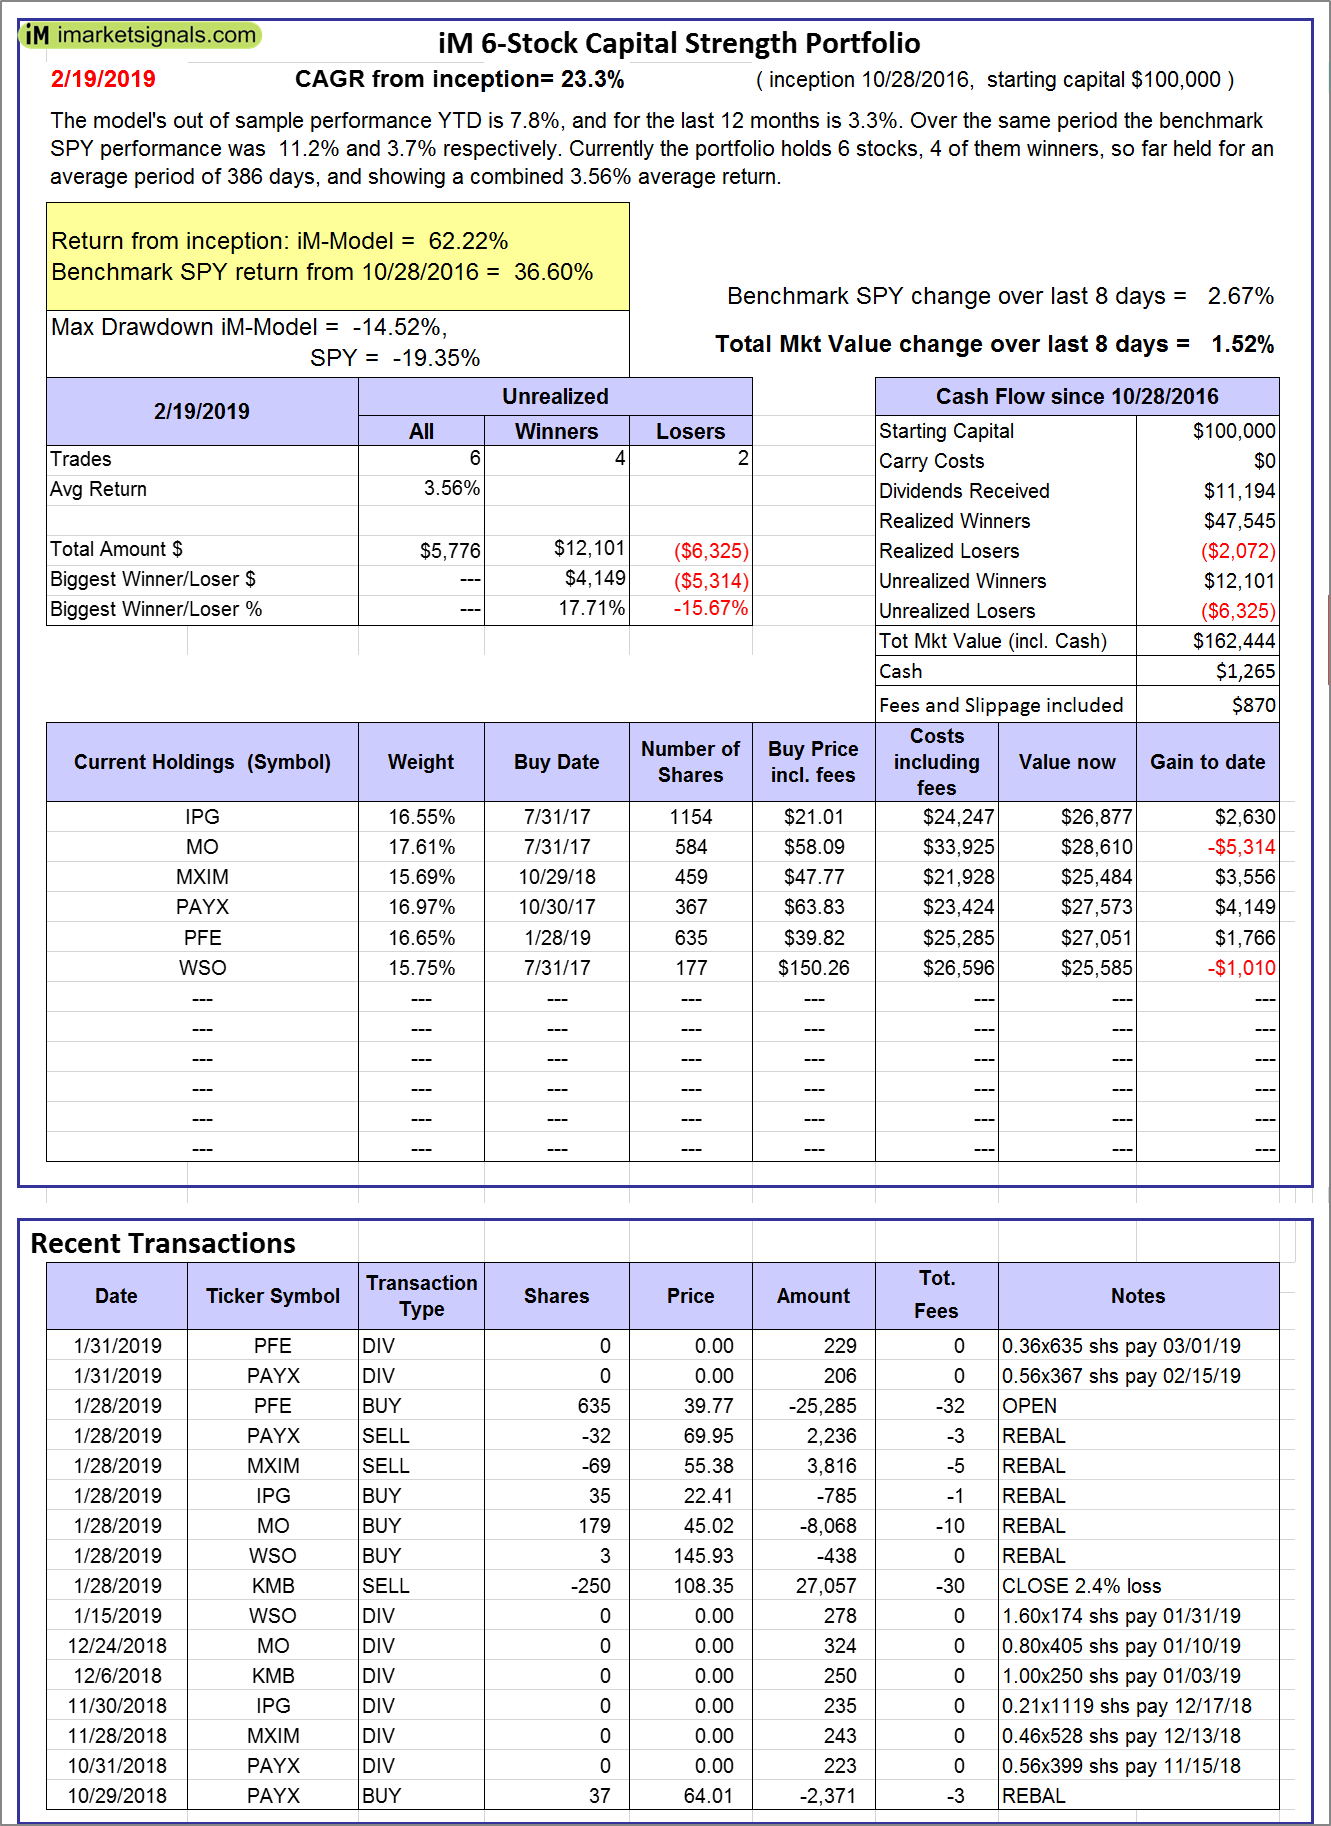 |
iM 6-Stock Capital Strength Portfolio: The model’s out of sample performance YTD is 7.8%, and for the last 12 months is 3.3%. Over the same period the benchmark SPY performance was 11.2% and 3.7% respectively. Over the previous week the market value of the iM 6-Stock Capital Strength Portfolio gained 1.52% at a time when SPY gained 2.67%. A starting capital of $100,000 at inception on 10/28/2016 would have grown to $162,444 which includes $1,265 cash and excludes $870 spent on fees and slippage. |
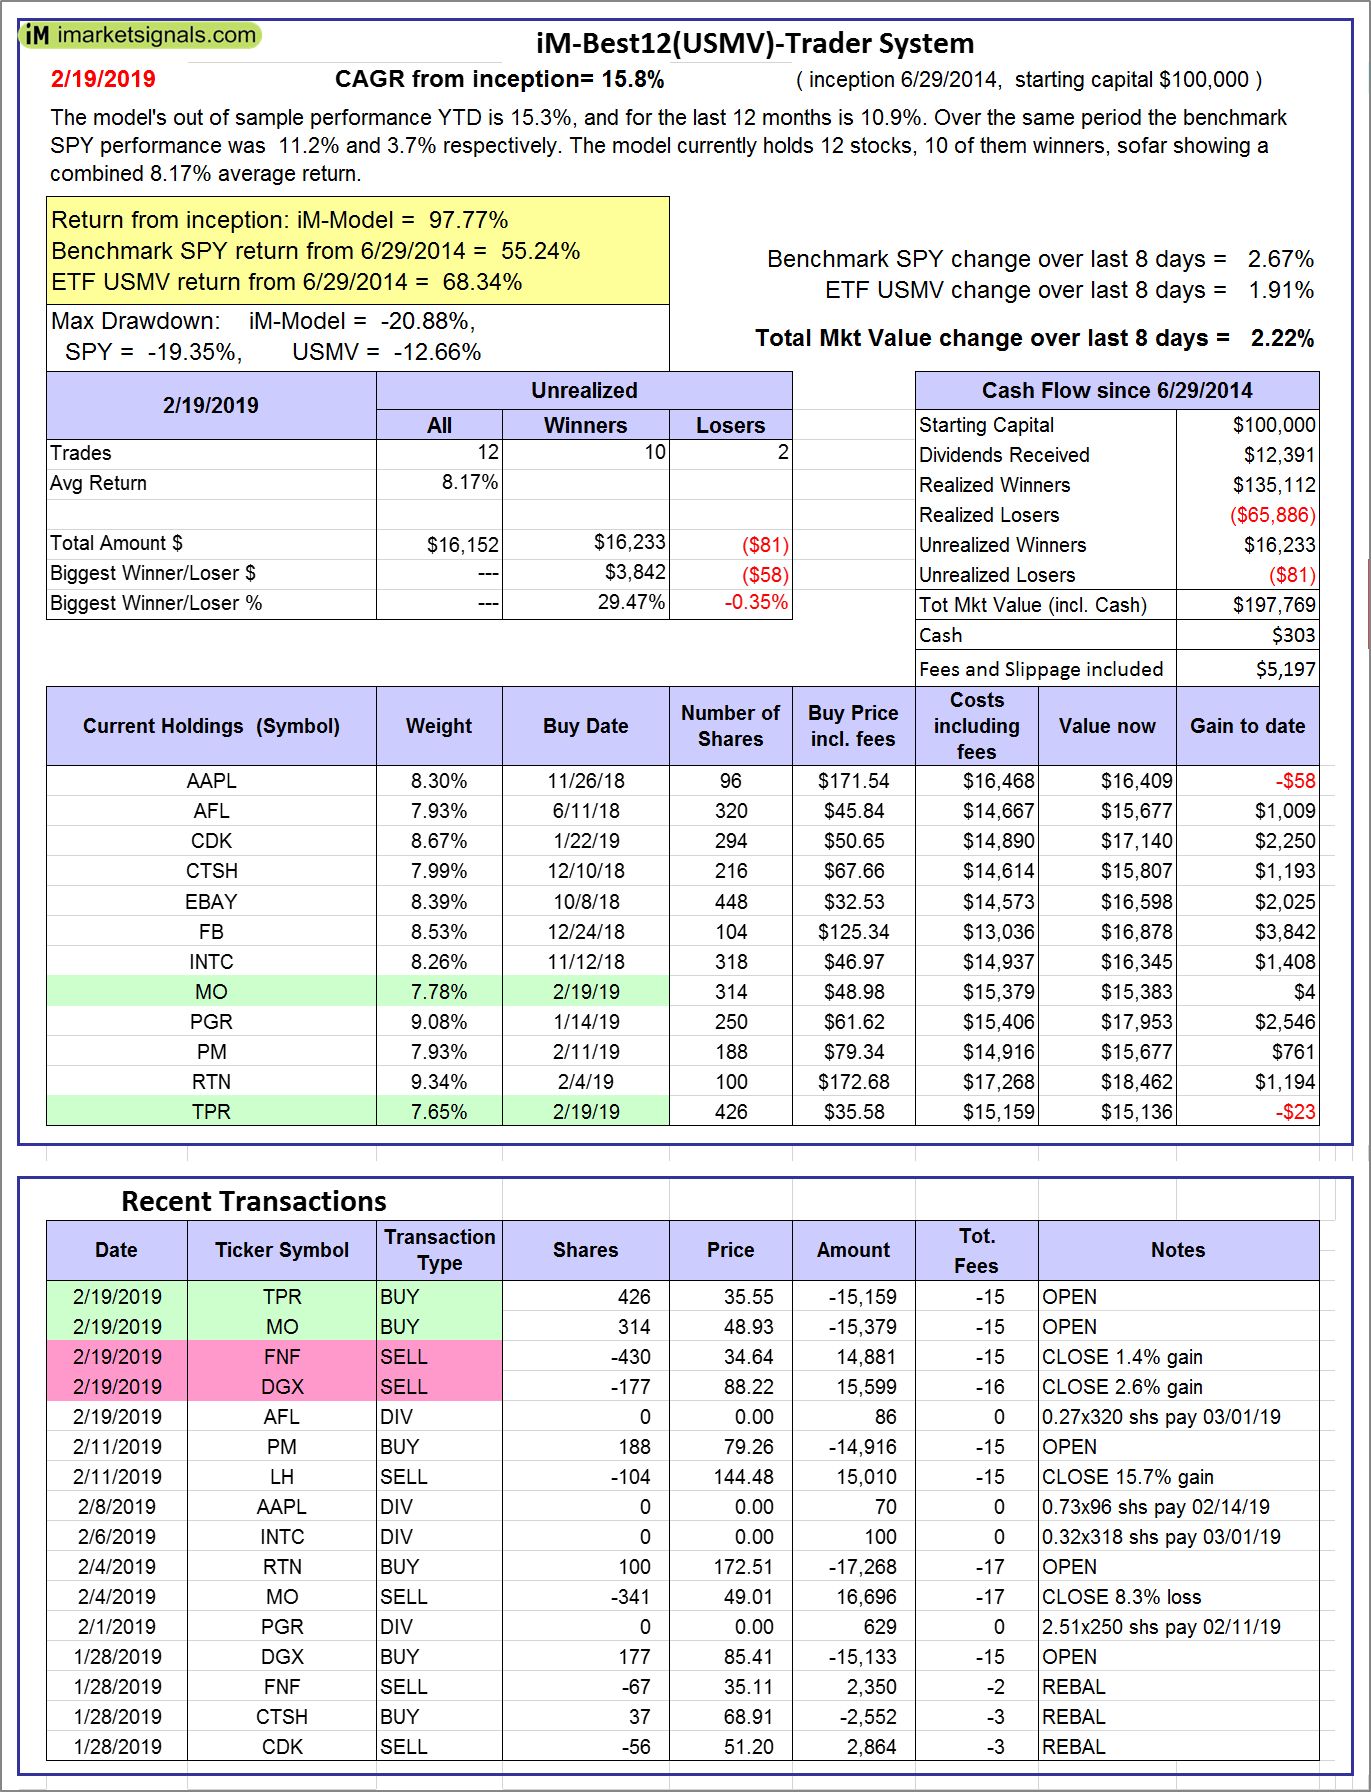 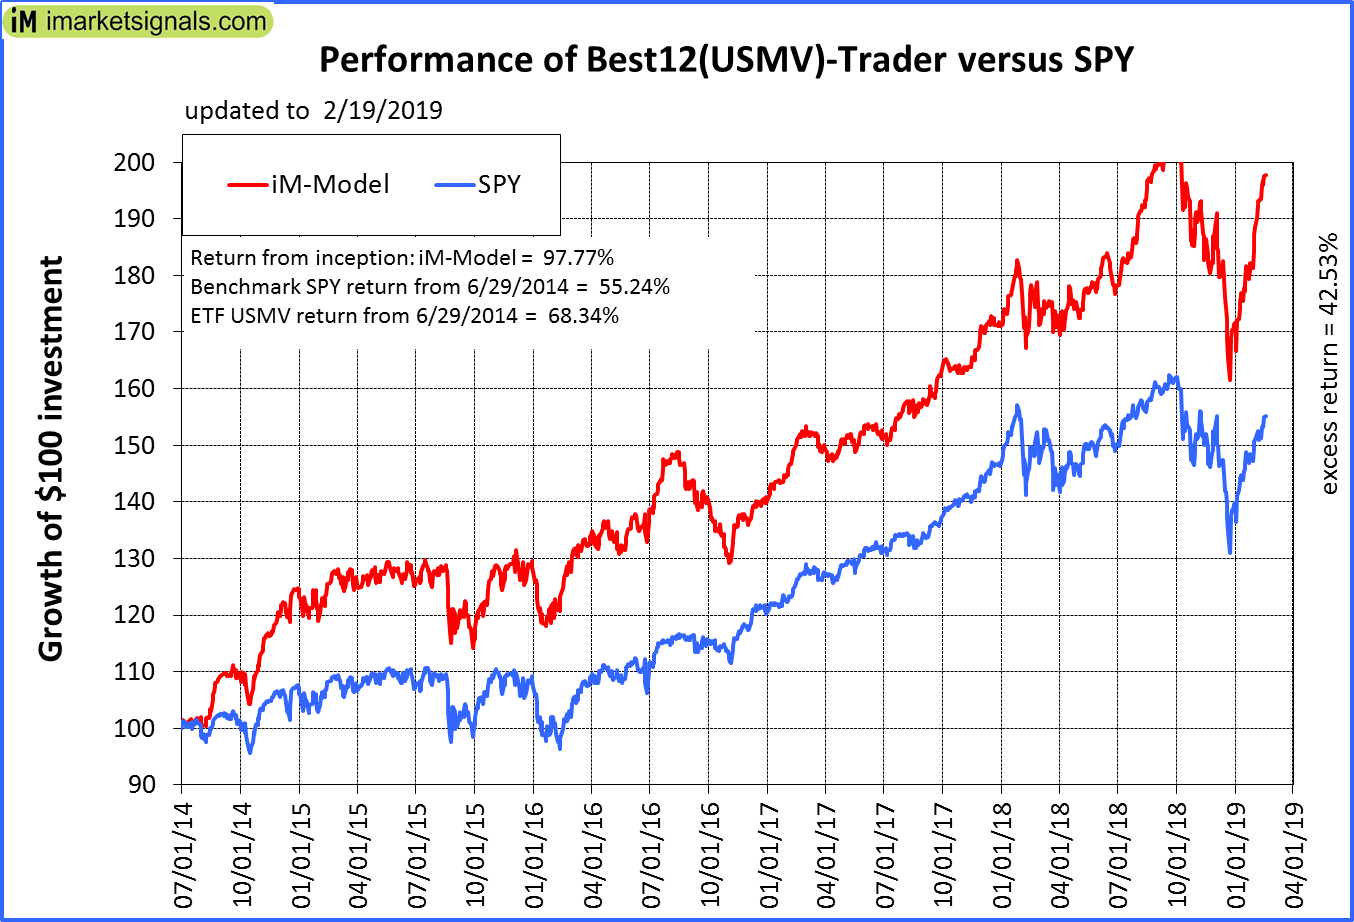 |
iM-Best12(USMV)-Trader: The model’s out of sample performance YTD is 15.3%, and for the last 12 months is 10.9%. Over the same period the benchmark SPY performance was 11.2% and 3.7% respectively. Since inception, on 6/30/2014, the model gained 97.77% while the benchmark SPY gained 55.24% and the ETF USMV gained 68.34% over the same period. Over the previous week the market value of iM-Best12(USMV)-Trader gained 2.22% at a time when SPY gained 2.67%. A starting capital of $100,000 at inception on 6/30/2014 would have grown to $197,769 which includes $303 cash and excludes $5,197 spent on fees and slippage. |
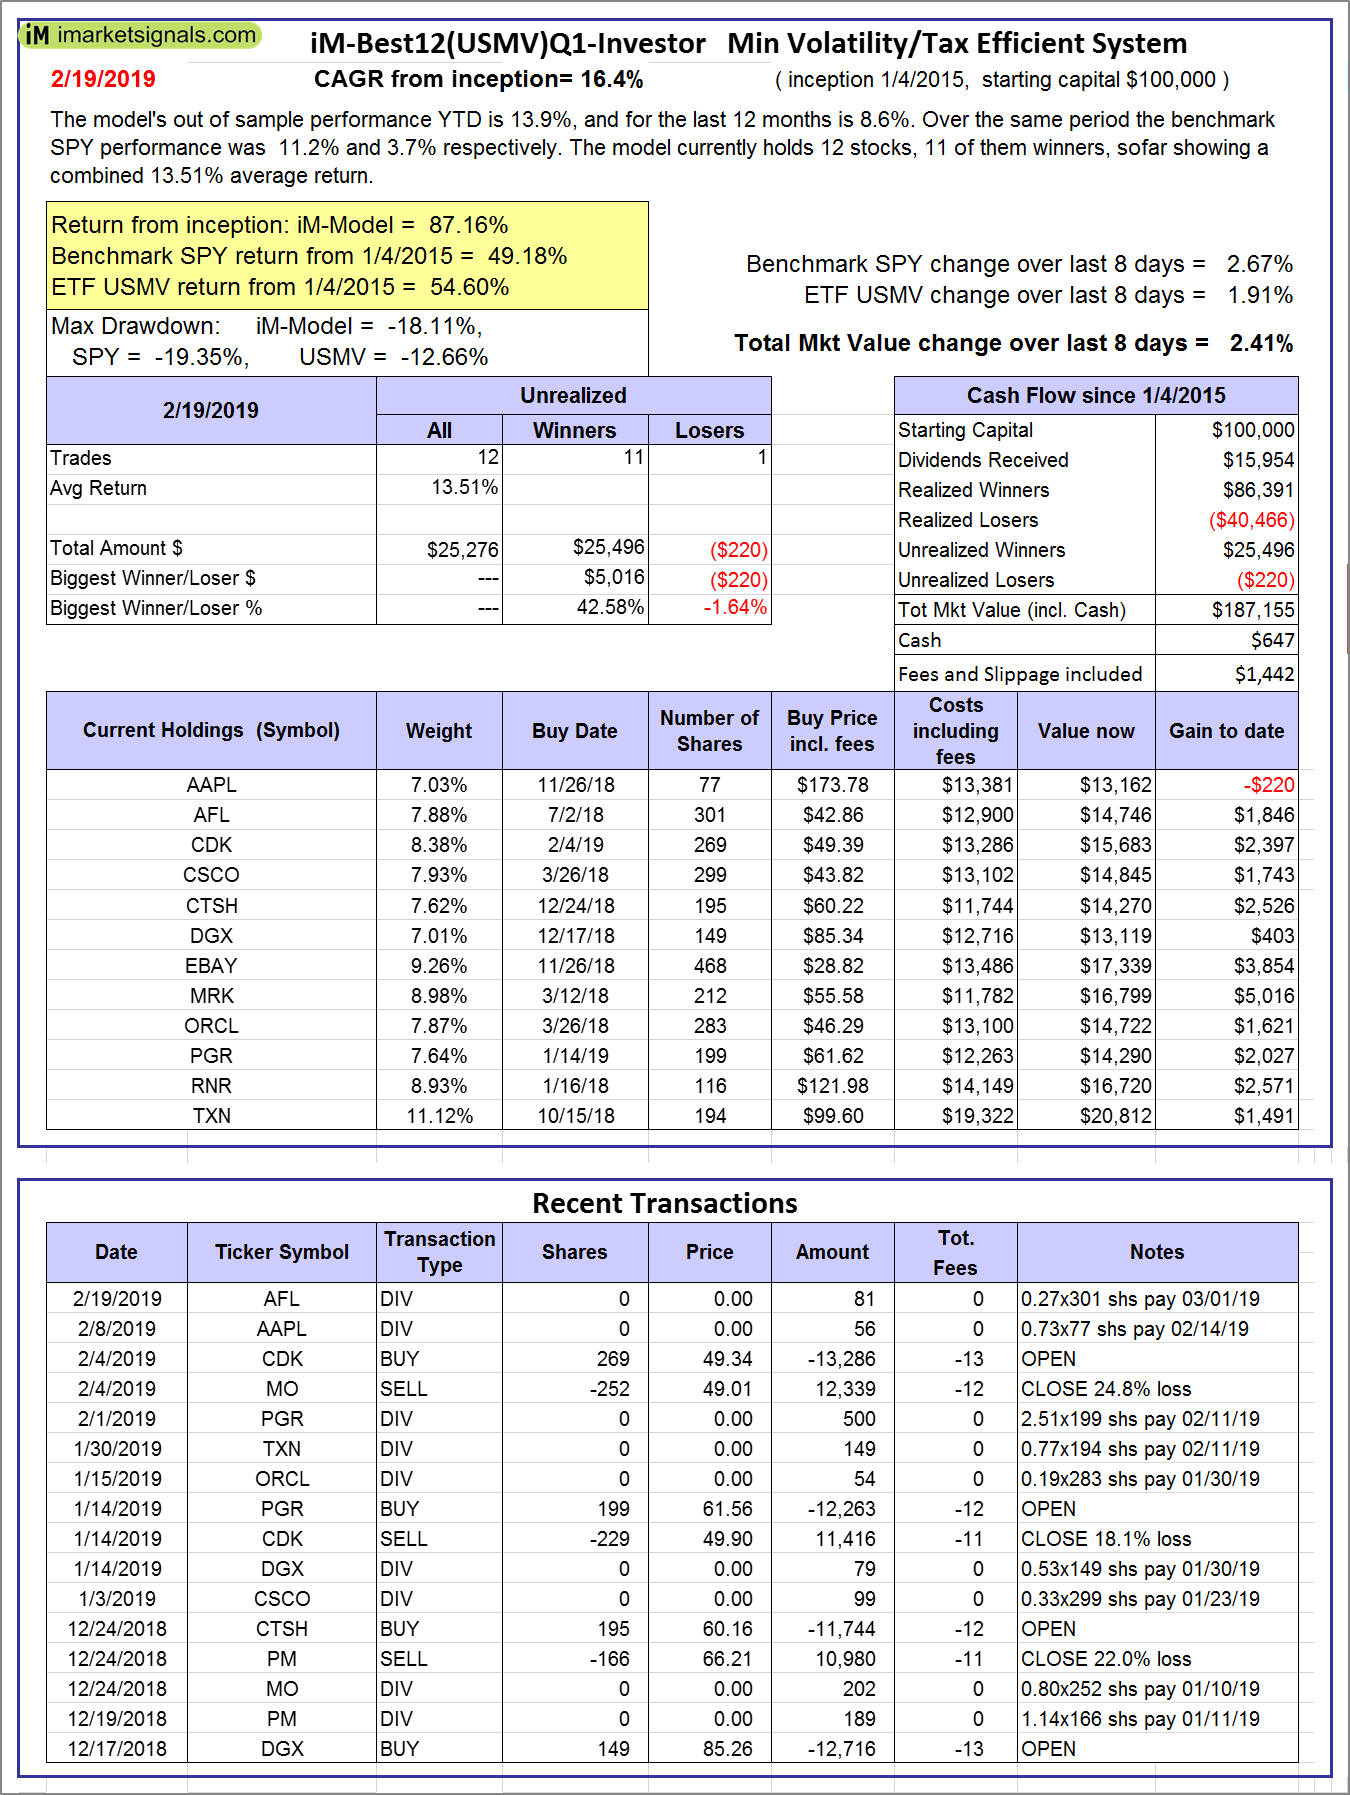 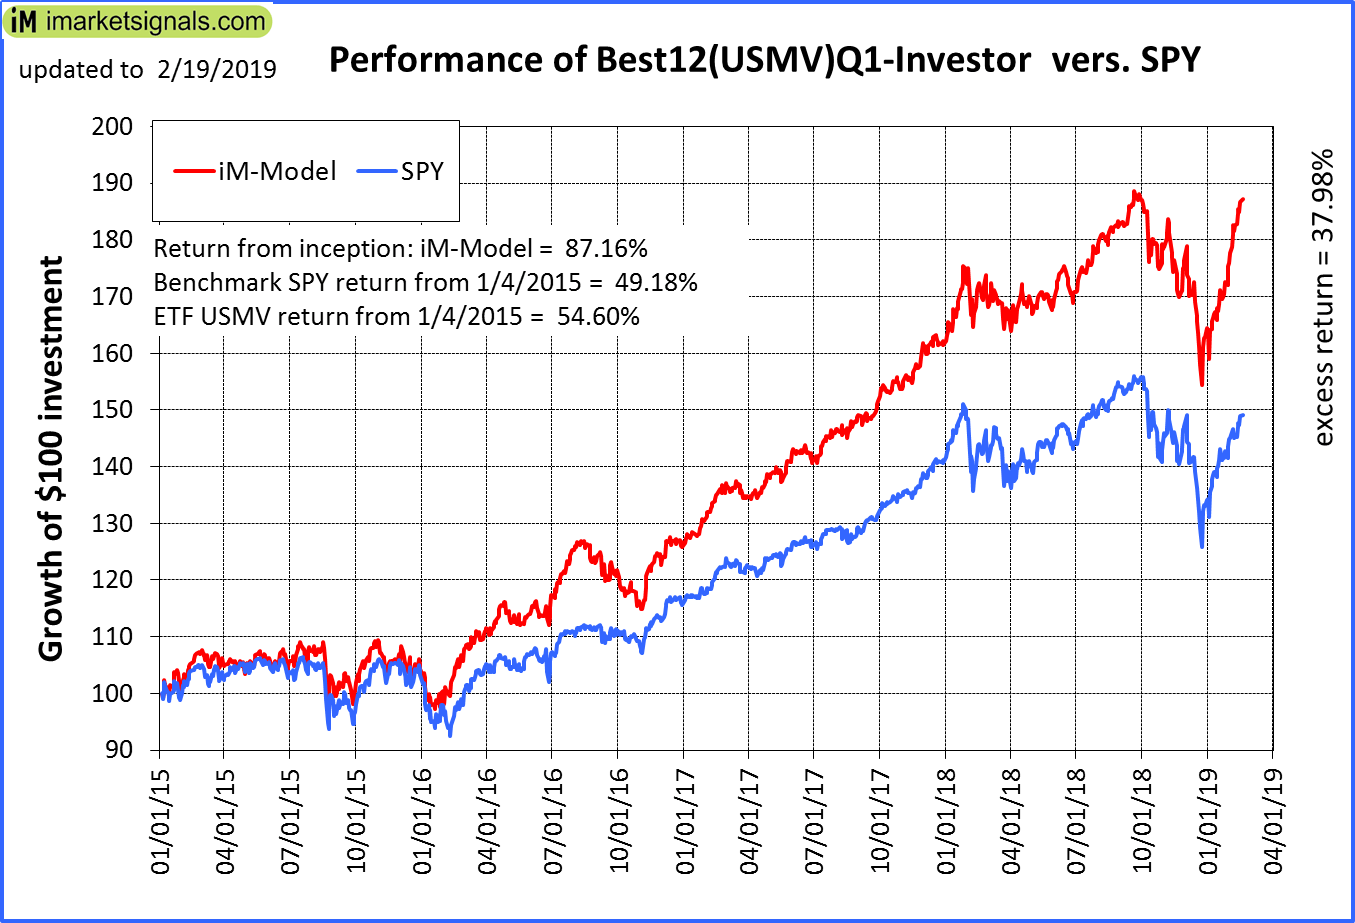 |
iM-Best12(USMV)Q1-Investor: The model’s out of sample performance YTD is 13.9%, and for the last 12 months is 8.6%. Over the same period the benchmark SPY performance was 11.2% and 3.7% respectively. Since inception, on 1/5/2015, the model gained 87.16% while the benchmark SPY gained 49.18% and the ETF USMV gained 54.60% over the same period. Over the previous week the market value of iM-Best12(USMV)Q1 gained 2.41% at a time when SPY gained 2.67%. A starting capital of $100,000 at inception on 1/5/2015 would have grown to $187,155 which includes $647 cash and excludes $1,442 spent on fees and slippage. |
  |
iM-Best12(USMV)Q2-Investor: The model’s out of sample performance YTD is 14.3%, and for the last 12 months is 13.2%. Over the same period the benchmark SPY performance was 11.2% and 3.7% respectively. Since inception, on 3/30/2015, the model gained 58.75% while the benchmark SPY gained 43.85% and the ETF USMV gained 49.32% over the same period. Over the previous week the market value of iM-Best12(USMV)Q2 gained 2.12% at a time when SPY gained 2.67%. A starting capital of $100,000 at inception on 3/30/2015 would have grown to $158,747 which includes -$397 cash and excludes $1,310 spent on fees and slippage. |
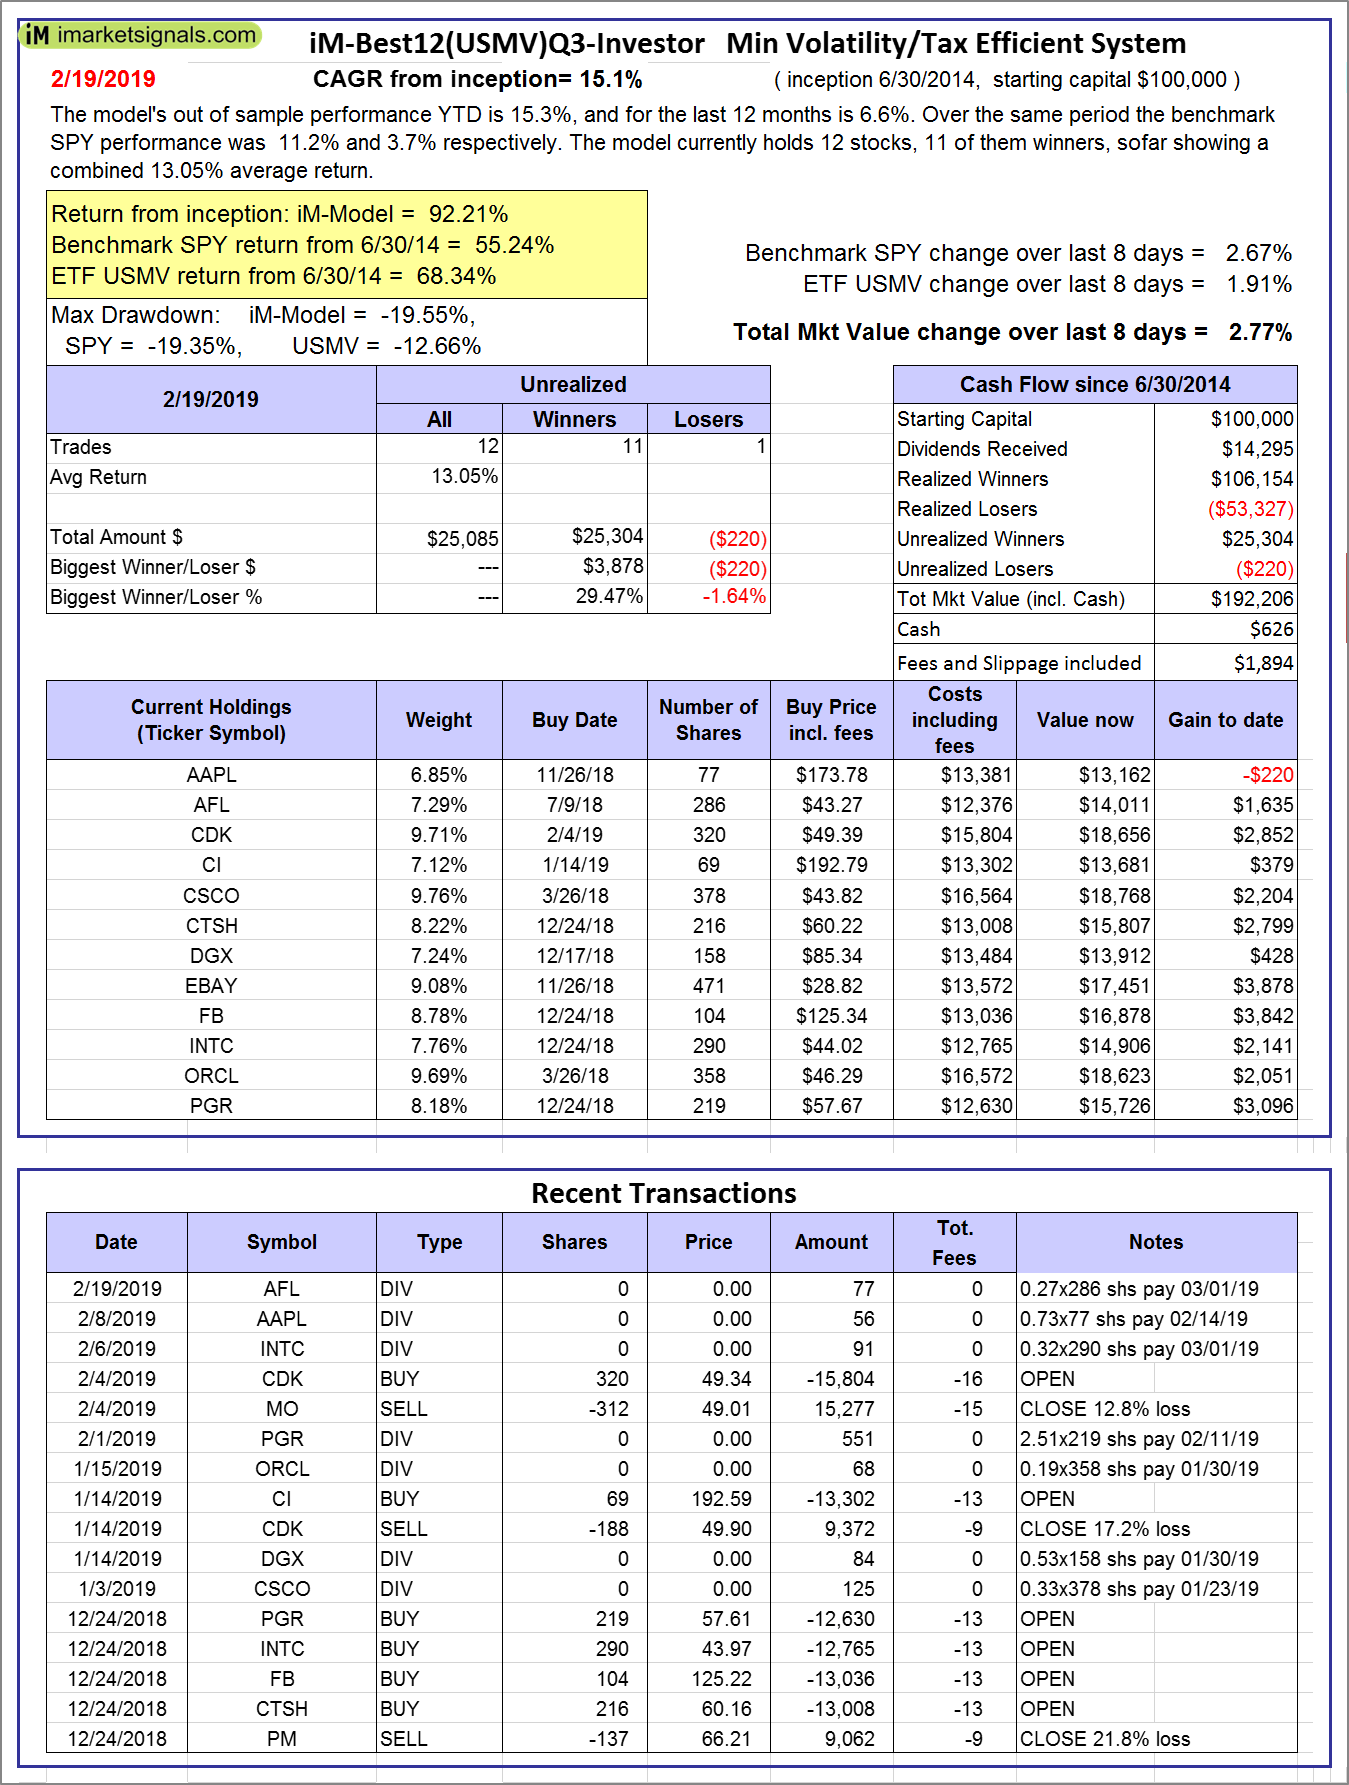 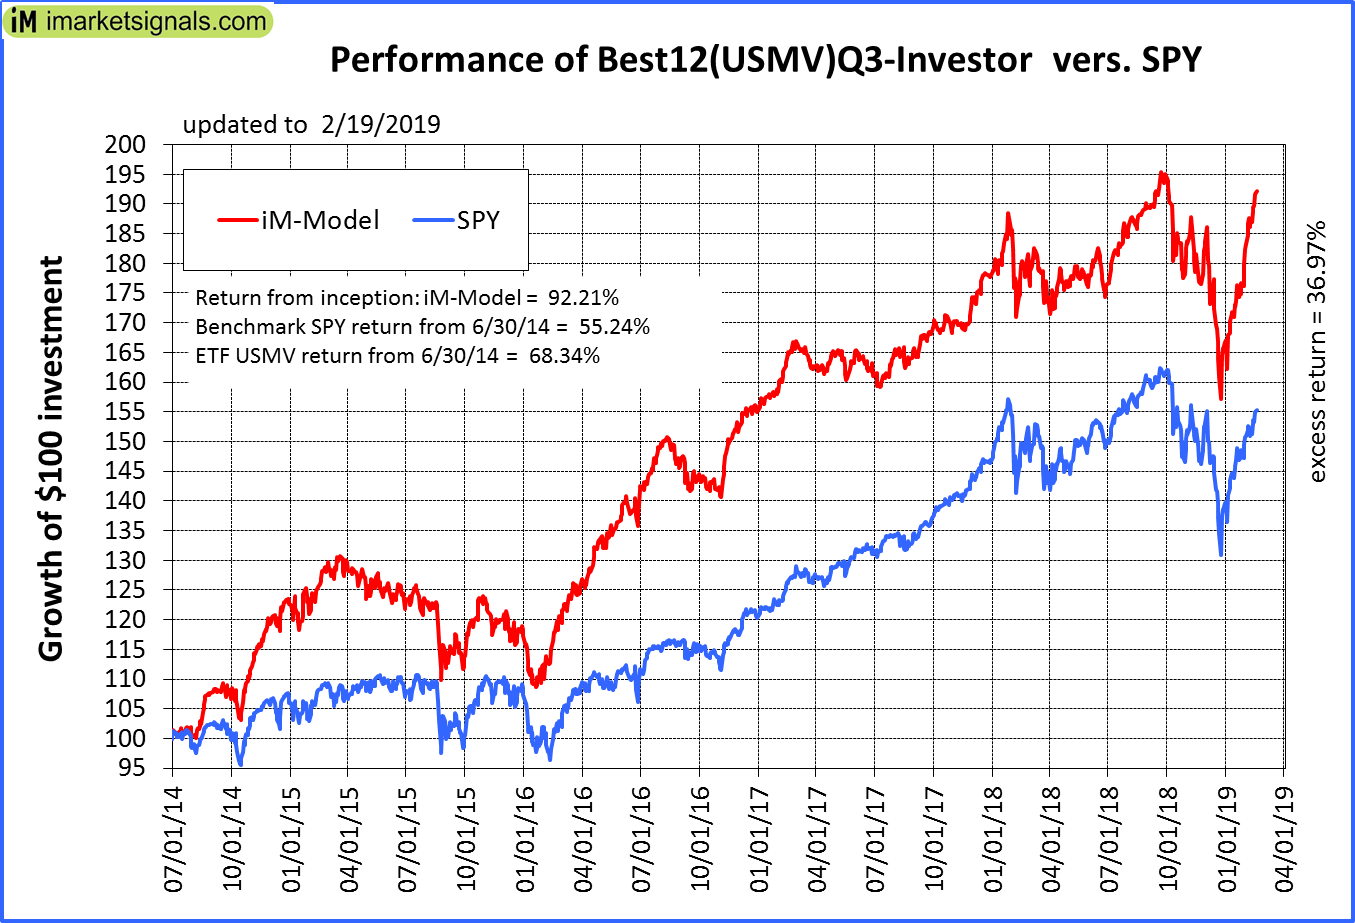 |
iM-Best12(USMV)Q3-Investor: The model’s out of sample performance YTD is 15.3%, and for the last 12 months is 6.6%. Over the same period the benchmark SPY performance was 11.2% and 3.7% respectively. Since inception, on 7/1/2014, the model gained 92.21% while the benchmark SPY gained 55.24% and the ETF USMV gained 68.34% over the same period. Over the previous week the market value of iM-Best12(USMV)Q3 gained 2.77% at a time when SPY gained 2.67%. A starting capital of $100,000 at inception on 7/1/2014 would have grown to $192,206 which includes $626 cash and excludes $1,894 spent on fees and slippage. |
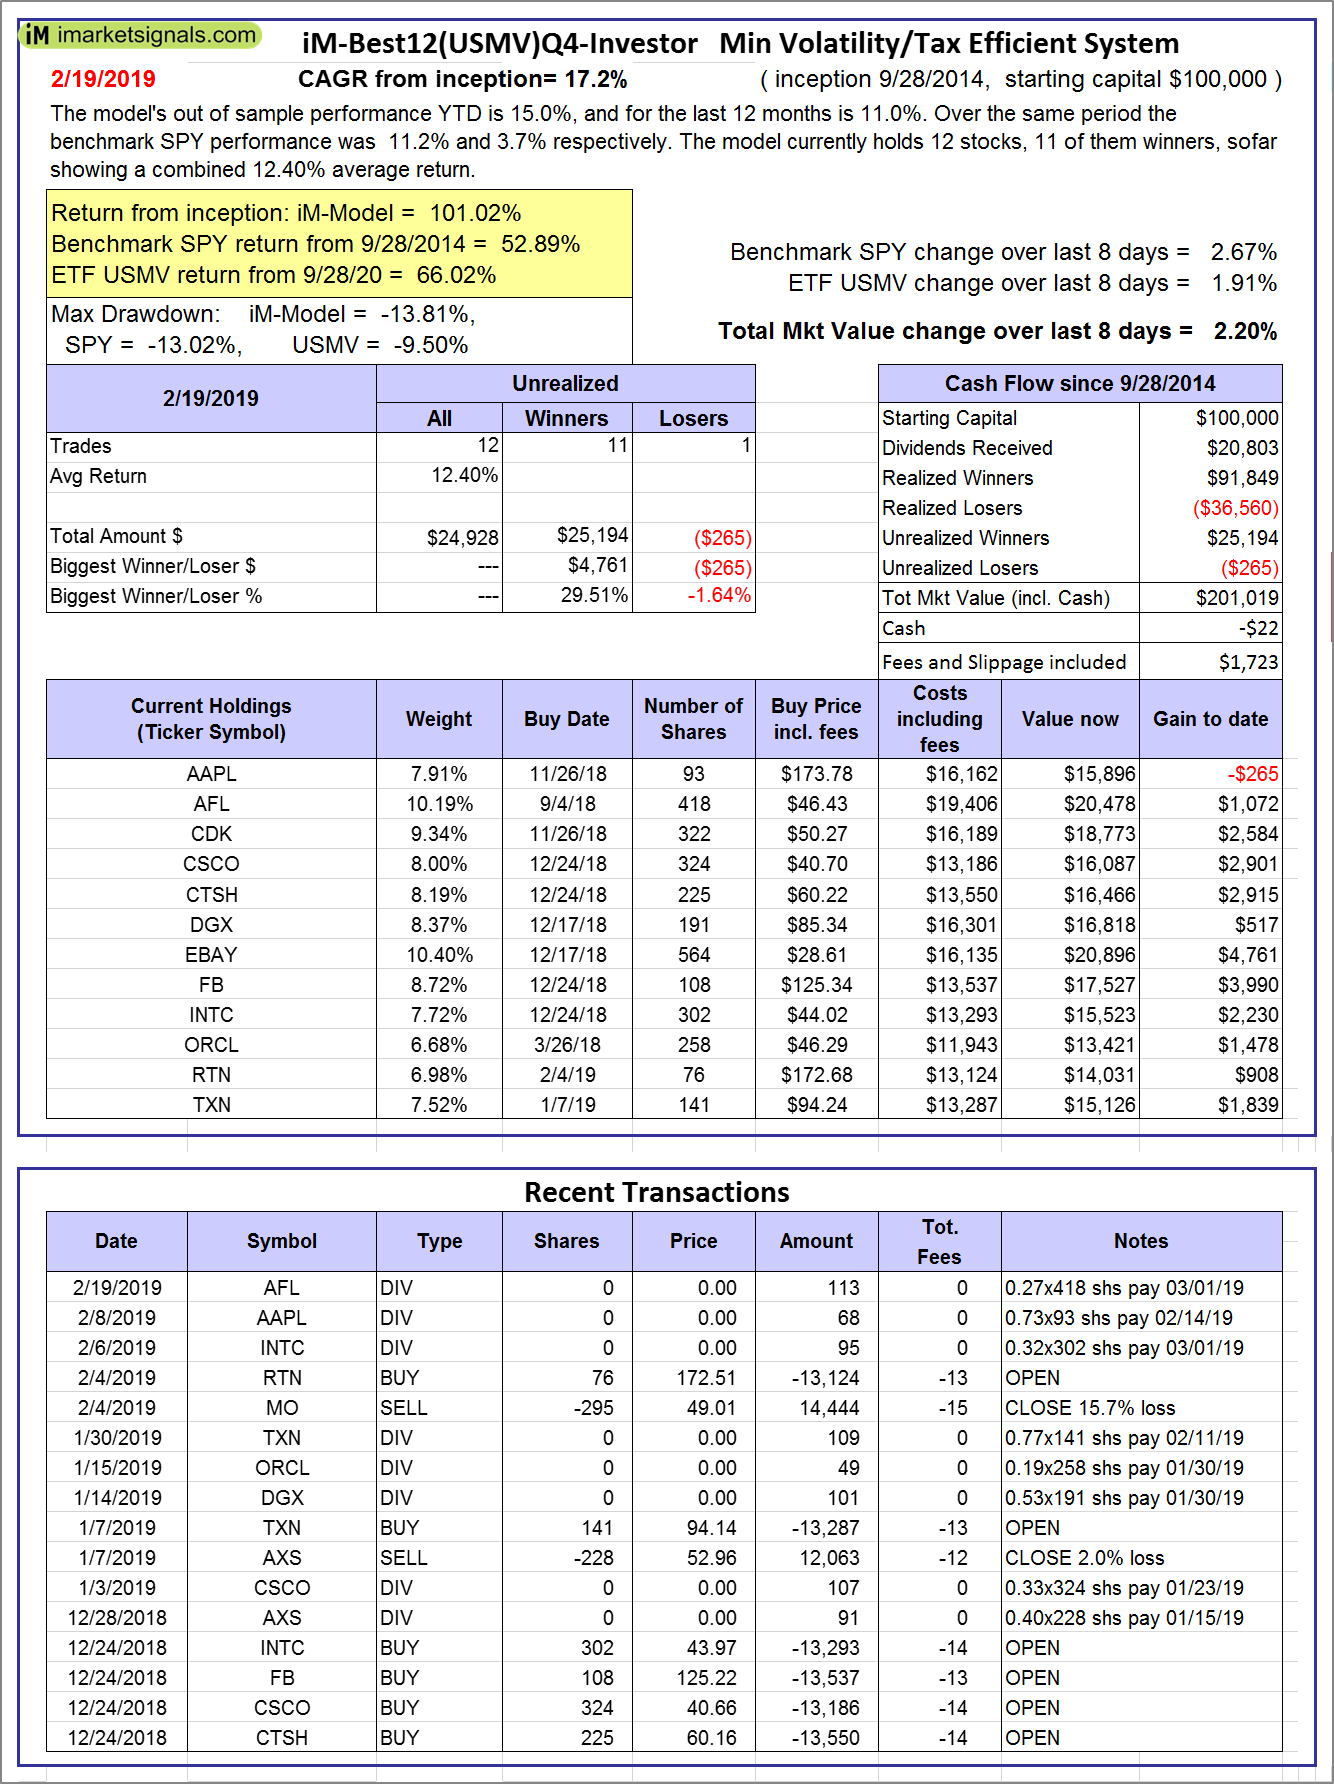  |
iM-Best12(USMV)Q4-Investor: Since inception, on 9/29/2014, the model gained 101.02% while the benchmark SPY gained 52.89% and the ETF USMV gained 66.02% over the same period. Over the previous week the market value of iM-Best12(USMV)Q4 gained 2.20% at a time when SPY gained 2.67%. A starting capital of $100,000 at inception on 9/29/2014 would have grown to $201,019 which includes -$22 cash and excludes $1,723 spent on fees and slippage. |
 |
Average Performance of iM-Best12(USMV)Q1+Q2+Q3+Q4-Investor resulted in an excess return of 52.04% over SPY. (see iM-USMV Investor Portfolio) |
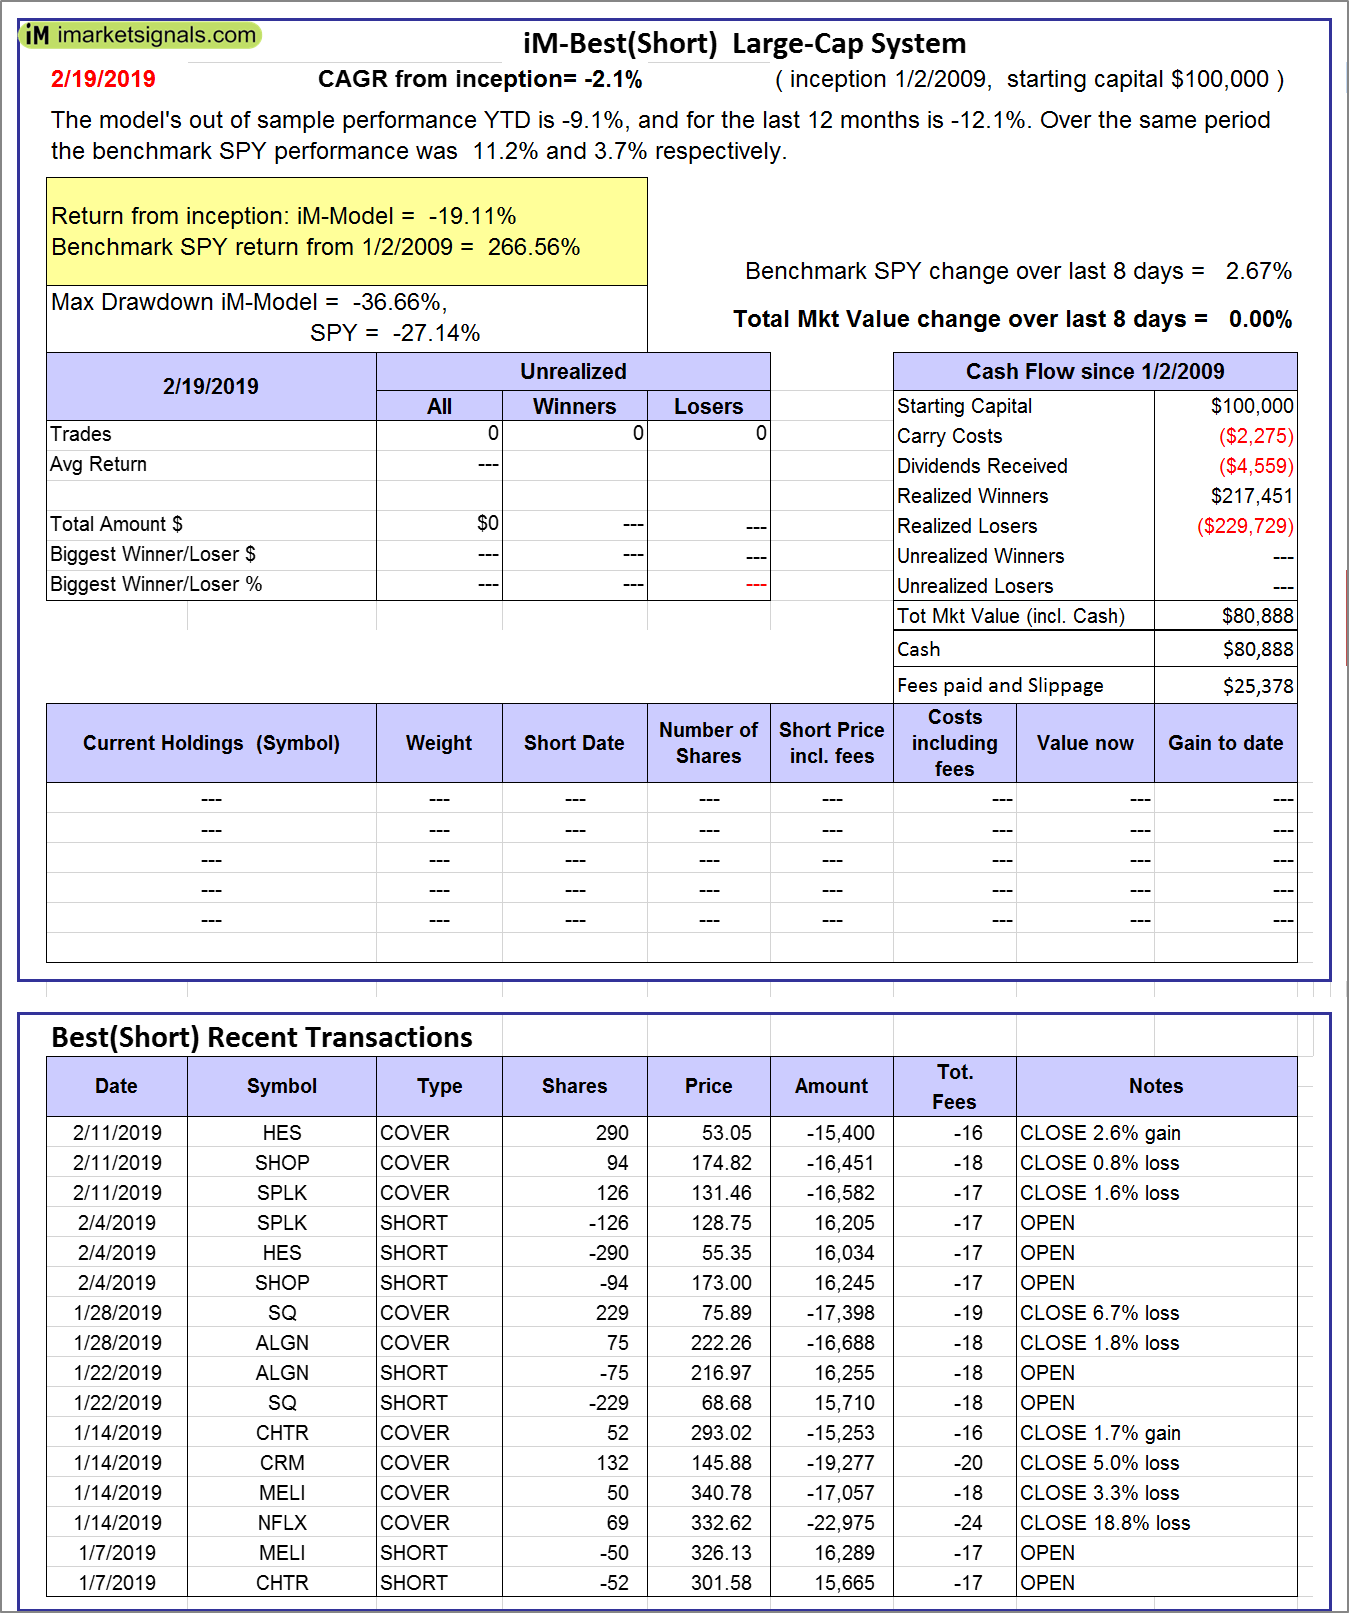 |
iM-Best(Short): The model’s out of sample performance YTD is -9.1%, and for the last 12 months is -12.1%. Over the same period the benchmark SPY performance was 11.2% and 3.7% respectively. Over the previous week the market value of iM-Best(Short) gained 0.00% at a time when SPY gained 2.67%. Over the period 1/2/2009 to 2/19/2019 the starting capital of $100,000 would have grown to $80,888 which includes $80,888 cash and excludes $25,378 spent on fees and slippage. |
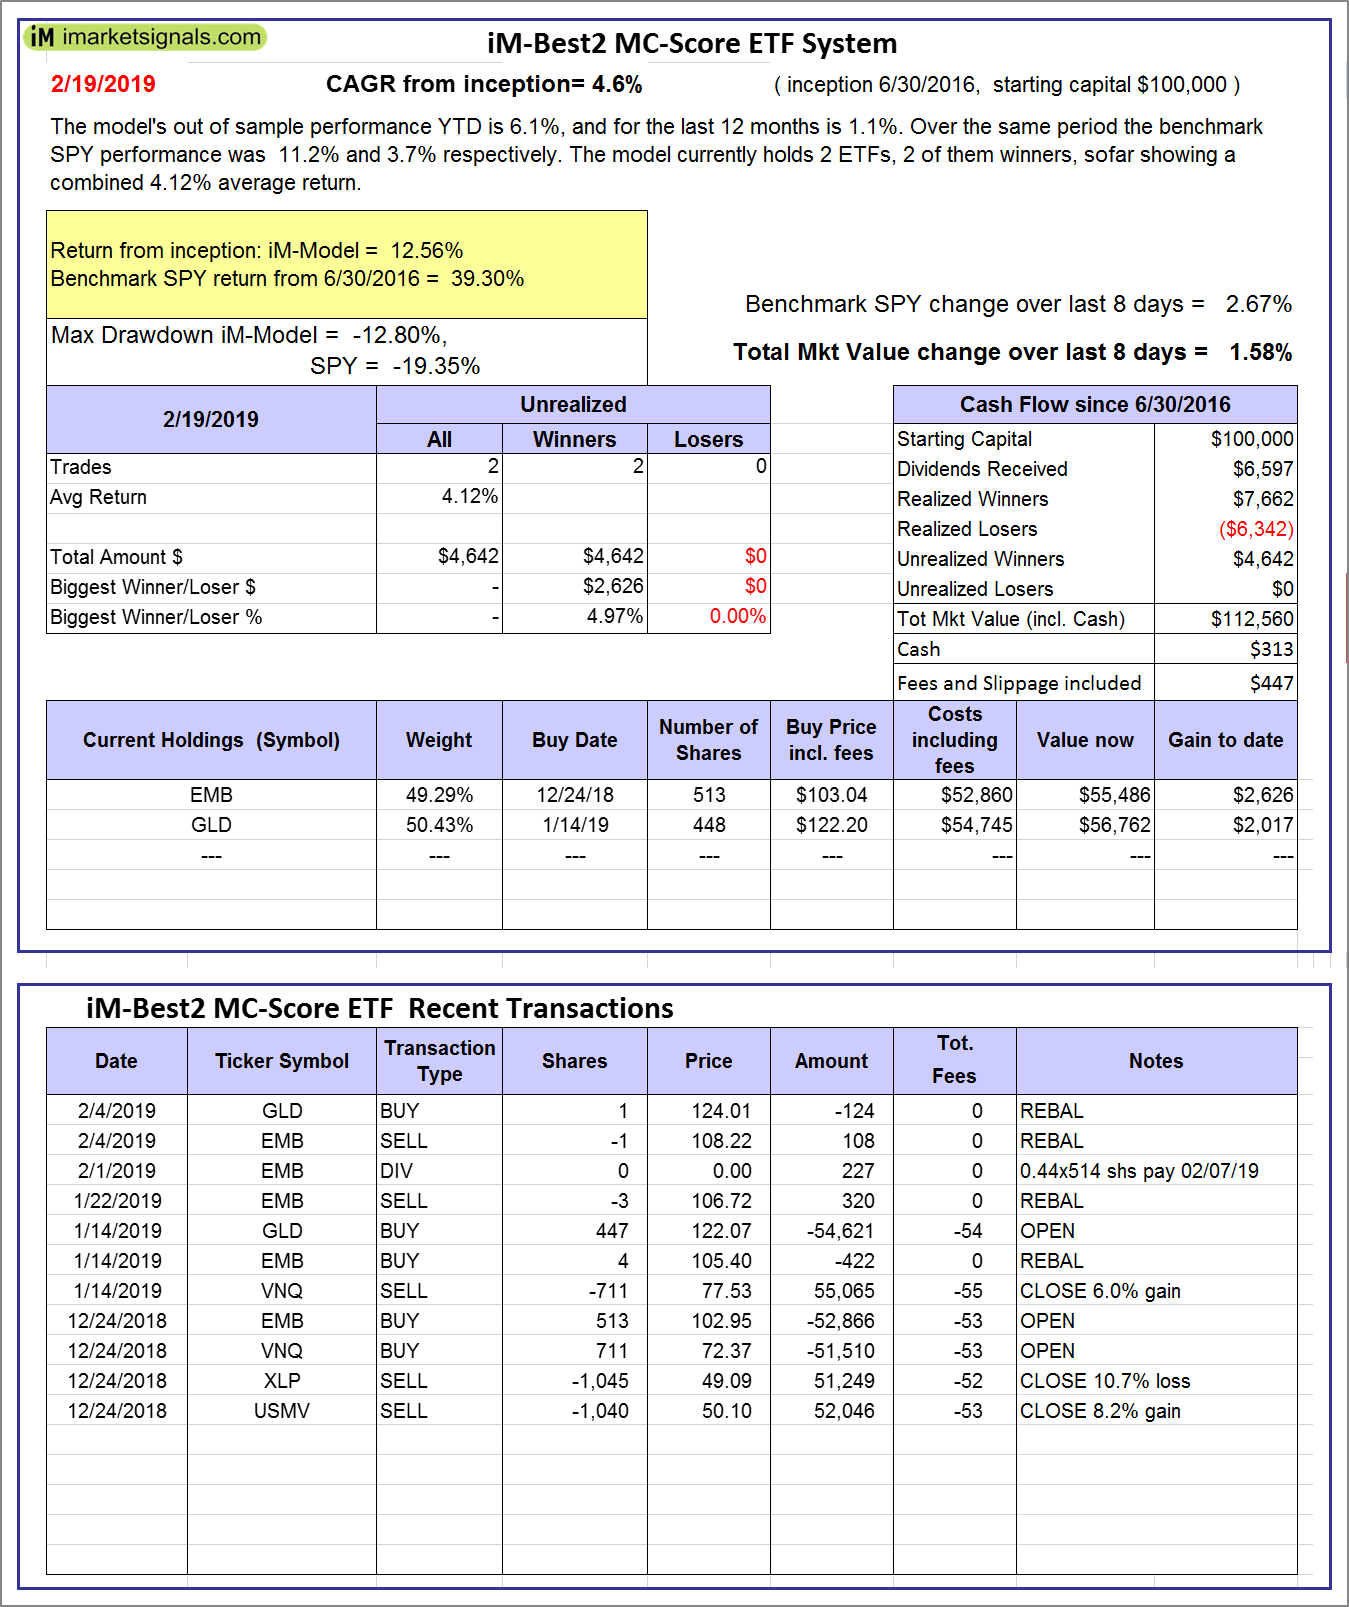 |
iM-Best2 MC-Score ETF System: The model’s out of sample performance YTD is 6.1%, and for the last 12 months is 1.1%. Over the same period the benchmark SPY performance was 11.2% and 3.7% respectively. Over the previous week the market value of the iM-Best2 MC-Score ETF System gained 1.58% at a time when SPY gained 2.67%. A starting capital of $100,000 at inception on 6/30/2016 would have grown to $112,560 which includes $313 cash and excludes $447 spent on fees and slippage. |
 |
iM-Best4 MC-Score Vanguard System: The model’s out of sample performance YTD is 6.9%, and for the last 12 months is 8.2%. Over the same period the benchmark SPY performance was 11.2% and 3.7% respectively. Over the previous week the market value of the iM-Best4 MC-Score Vanguard System gained 1.34% at a time when SPY gained 2.67%. A starting capital of $100,000 at inception on 6/30/2016 would have grown to $115,501 which includes -$20 cash and excludes $00 spent on fees and slippage. |
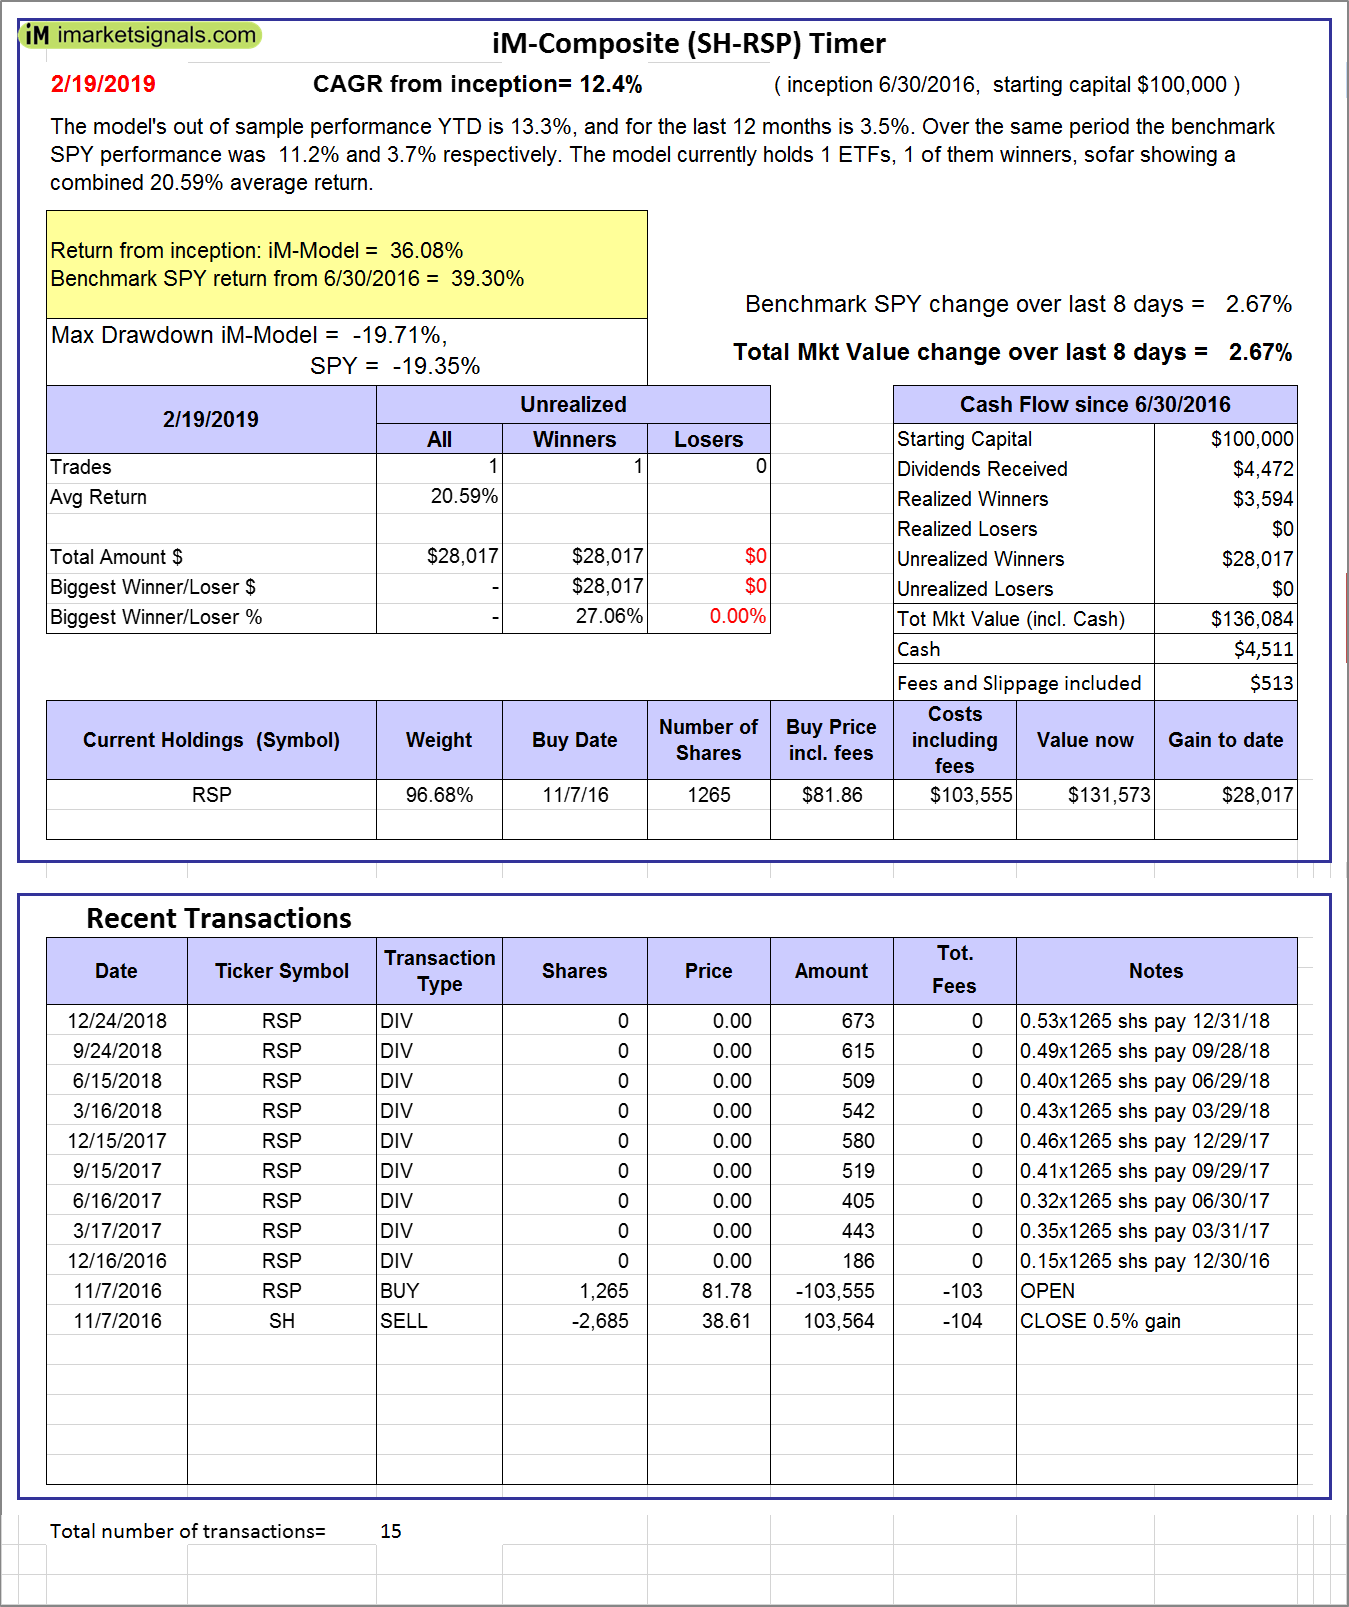 |
iM-Composite (SH-RSP) Timer: The model’s out of sample performance YTD is 13.3%, and for the last 12 months is 3.5%. Over the same period the benchmark SPY performance was 11.2% and 3.7% respectively. Over the previous week the market value of the iM-Composite (SH-RSP) Timer gained 2.67% at a time when SPY gained 2.67%. A starting capital of $100,000 at inception on 6/30/2016 would have grown to $136,084 which includes $4,511 cash and excludes $513 spent on fees and slippage. |
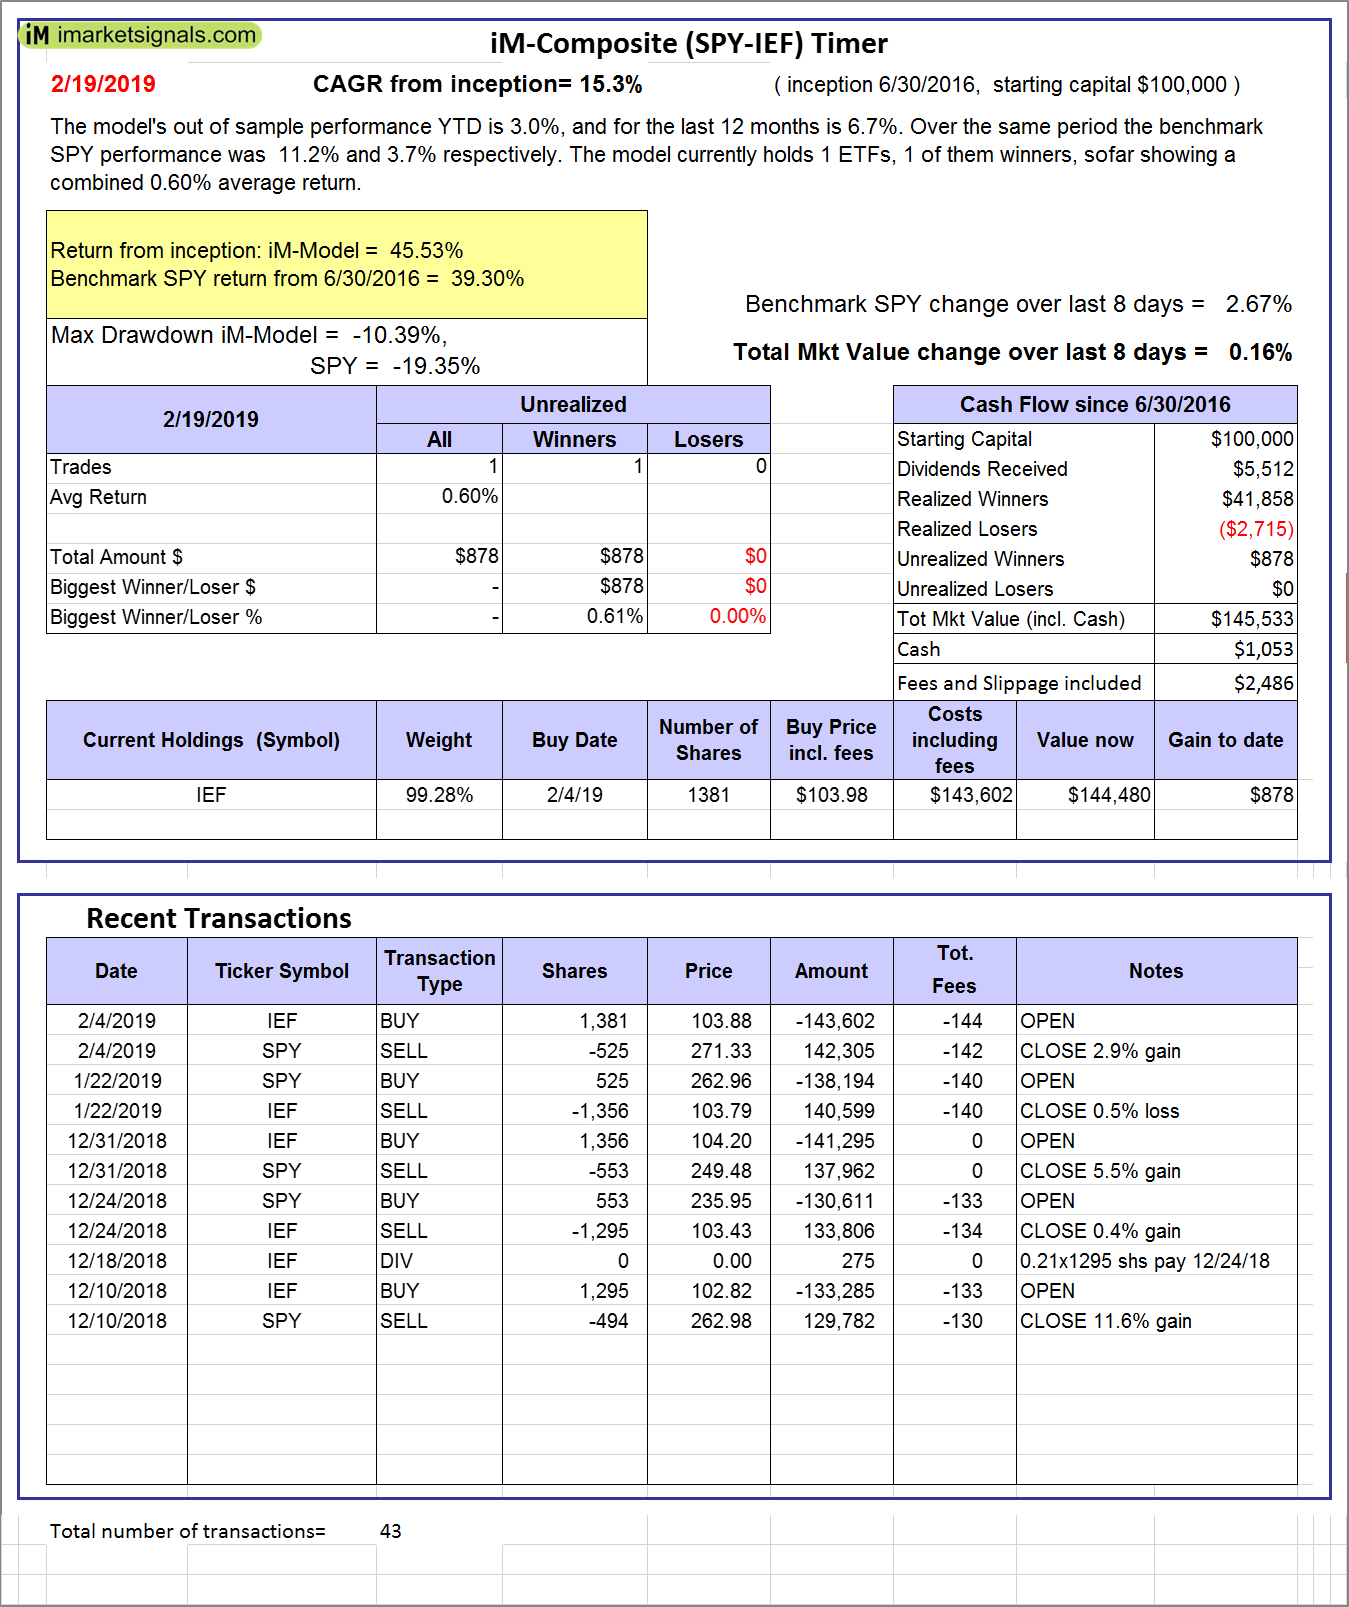 |
iM-Composite (SPY-IEF) Timer: The model’s out of sample performance YTD is 3.0%, and for the last 12 months is 6.7%. Over the same period the benchmark SPY performance was 11.2% and 3.7% respectively. Over the previous week the market value of the iM-Composite (SPY-IEF) Timer gained 0.16% at a time when SPY gained 2.67%. A starting capital of $100,000 at inception on 6/30/2016 would have grown to $145,533 which includes $1,053 cash and excludes $2,486 spent on fees and slippage. |
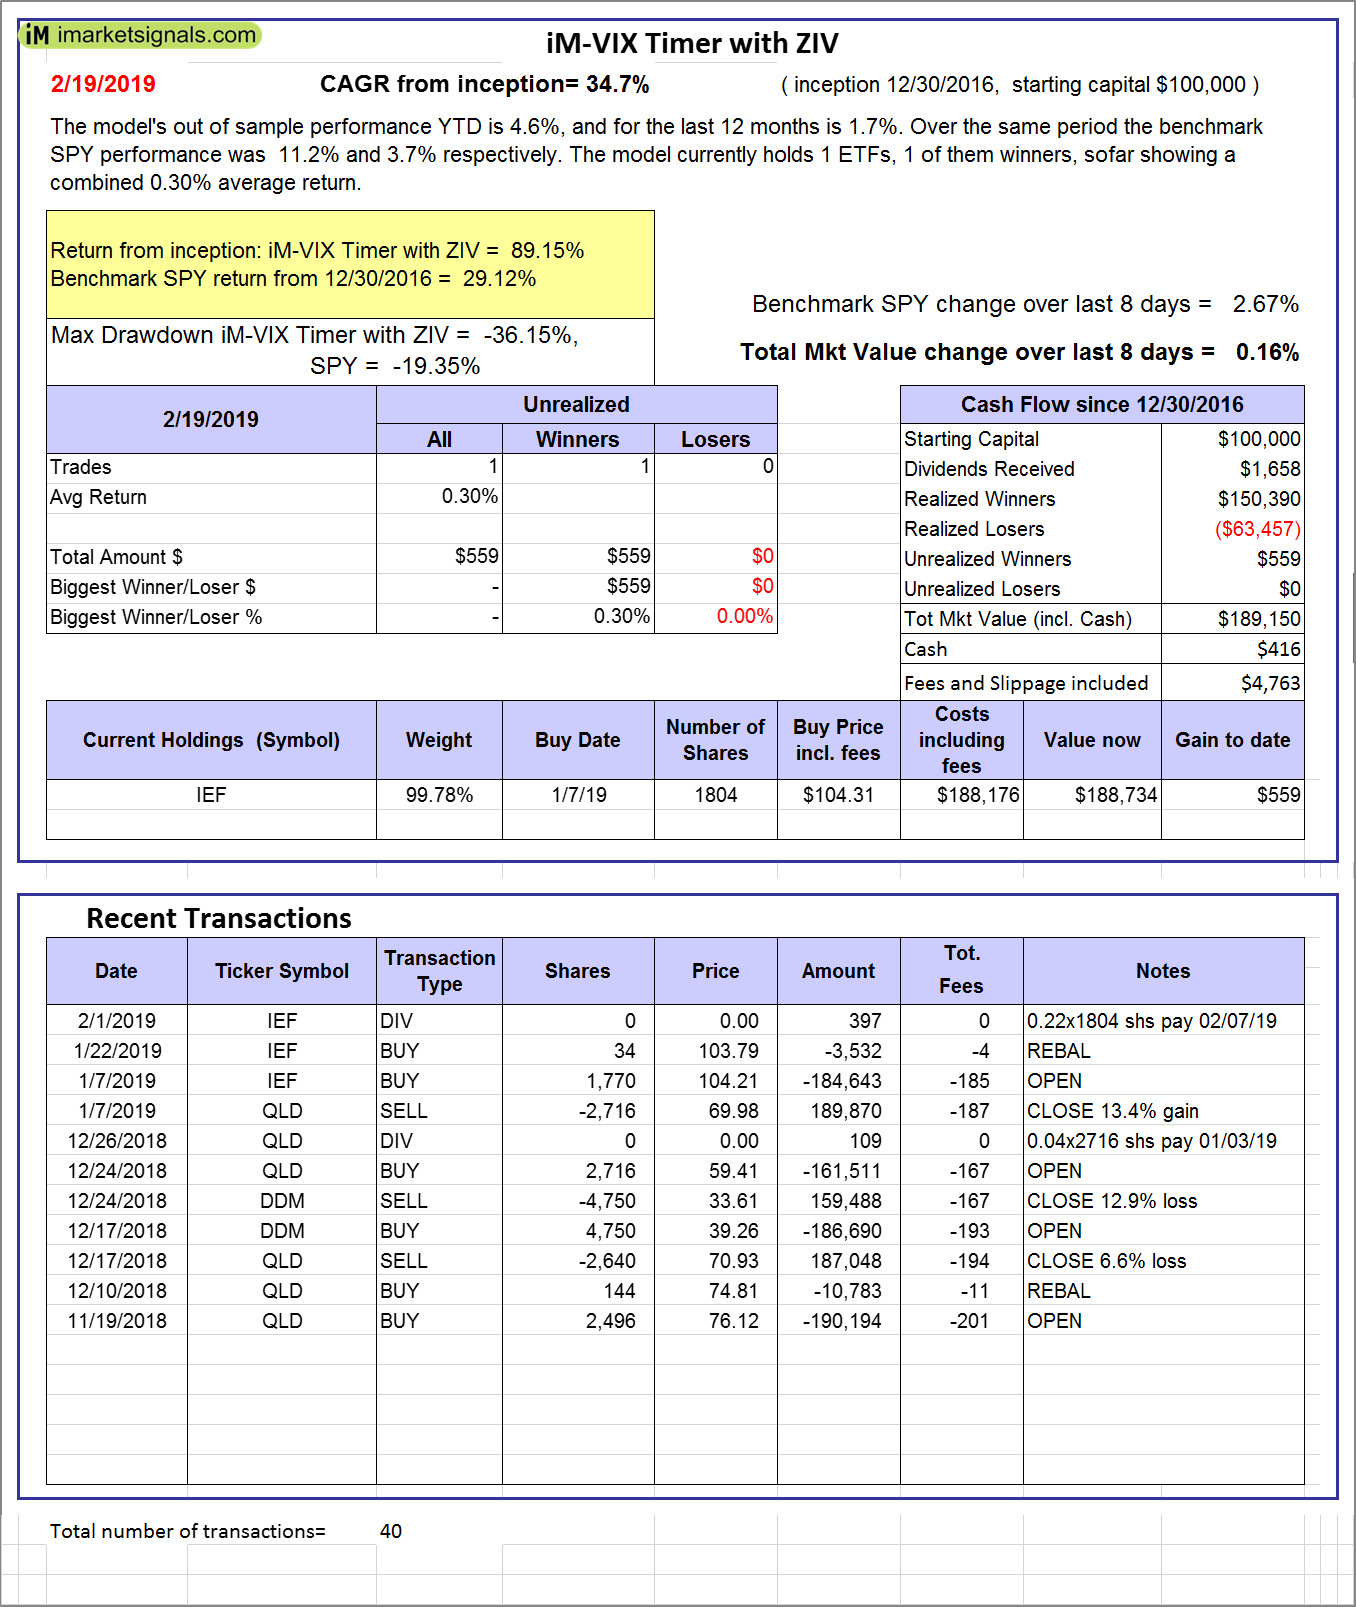 |
iM-VIX Timer with ZIV: The model’s out of sample performance YTD is 4.4%, and for the last 12 months is 13.0%. Over the same period the benchmark SPY performance was 8.3% and 5.5% respectively. Over the previous week the market value of the iM-VIX Timer with ZIV gained 0.56% at a time when SPY gained -0.49%. A starting capital of $100,000 at inception on 6/30/2016 would have grown to $188,843 which includes $416 cash and excludes $4,763 spent on fees and slippage. |
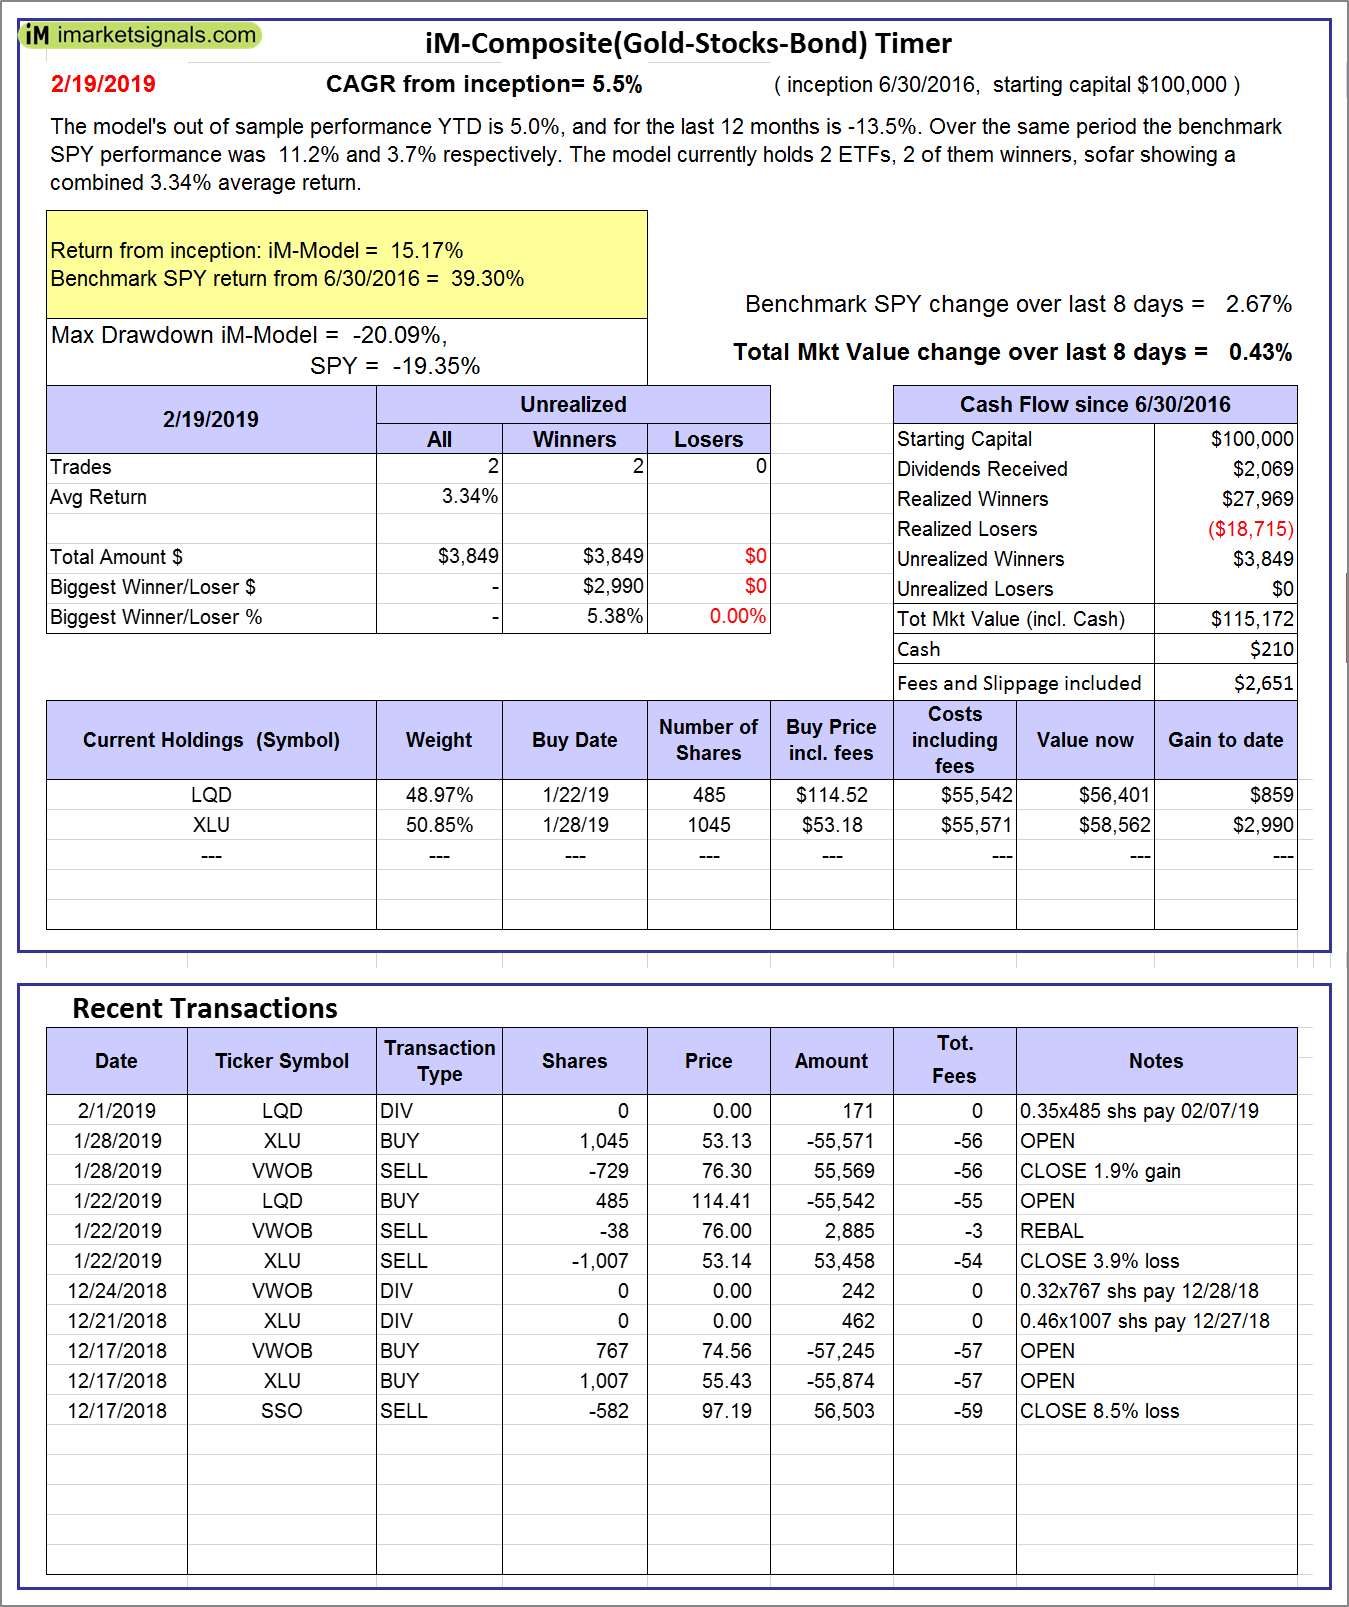 |
iM-Composite(Gold-Stocks-Bond) Timer: The model’s out of sample performance YTD is 5.0%, and for the last 12 months is -13.5%. Over the same period the benchmark SPY performance was 11.2% and 3.7% respectively. Over the previous week the market value of the iM-Composite(Gold-Stocks-Bond) Timer gained 0.43% at a time when SPY gained 2.67%. A starting capital of $100,000 at inception on 6/30/2016 would have grown to $115,172 which includes $210 cash and excludes $2,651 spent on fees and slippage. |
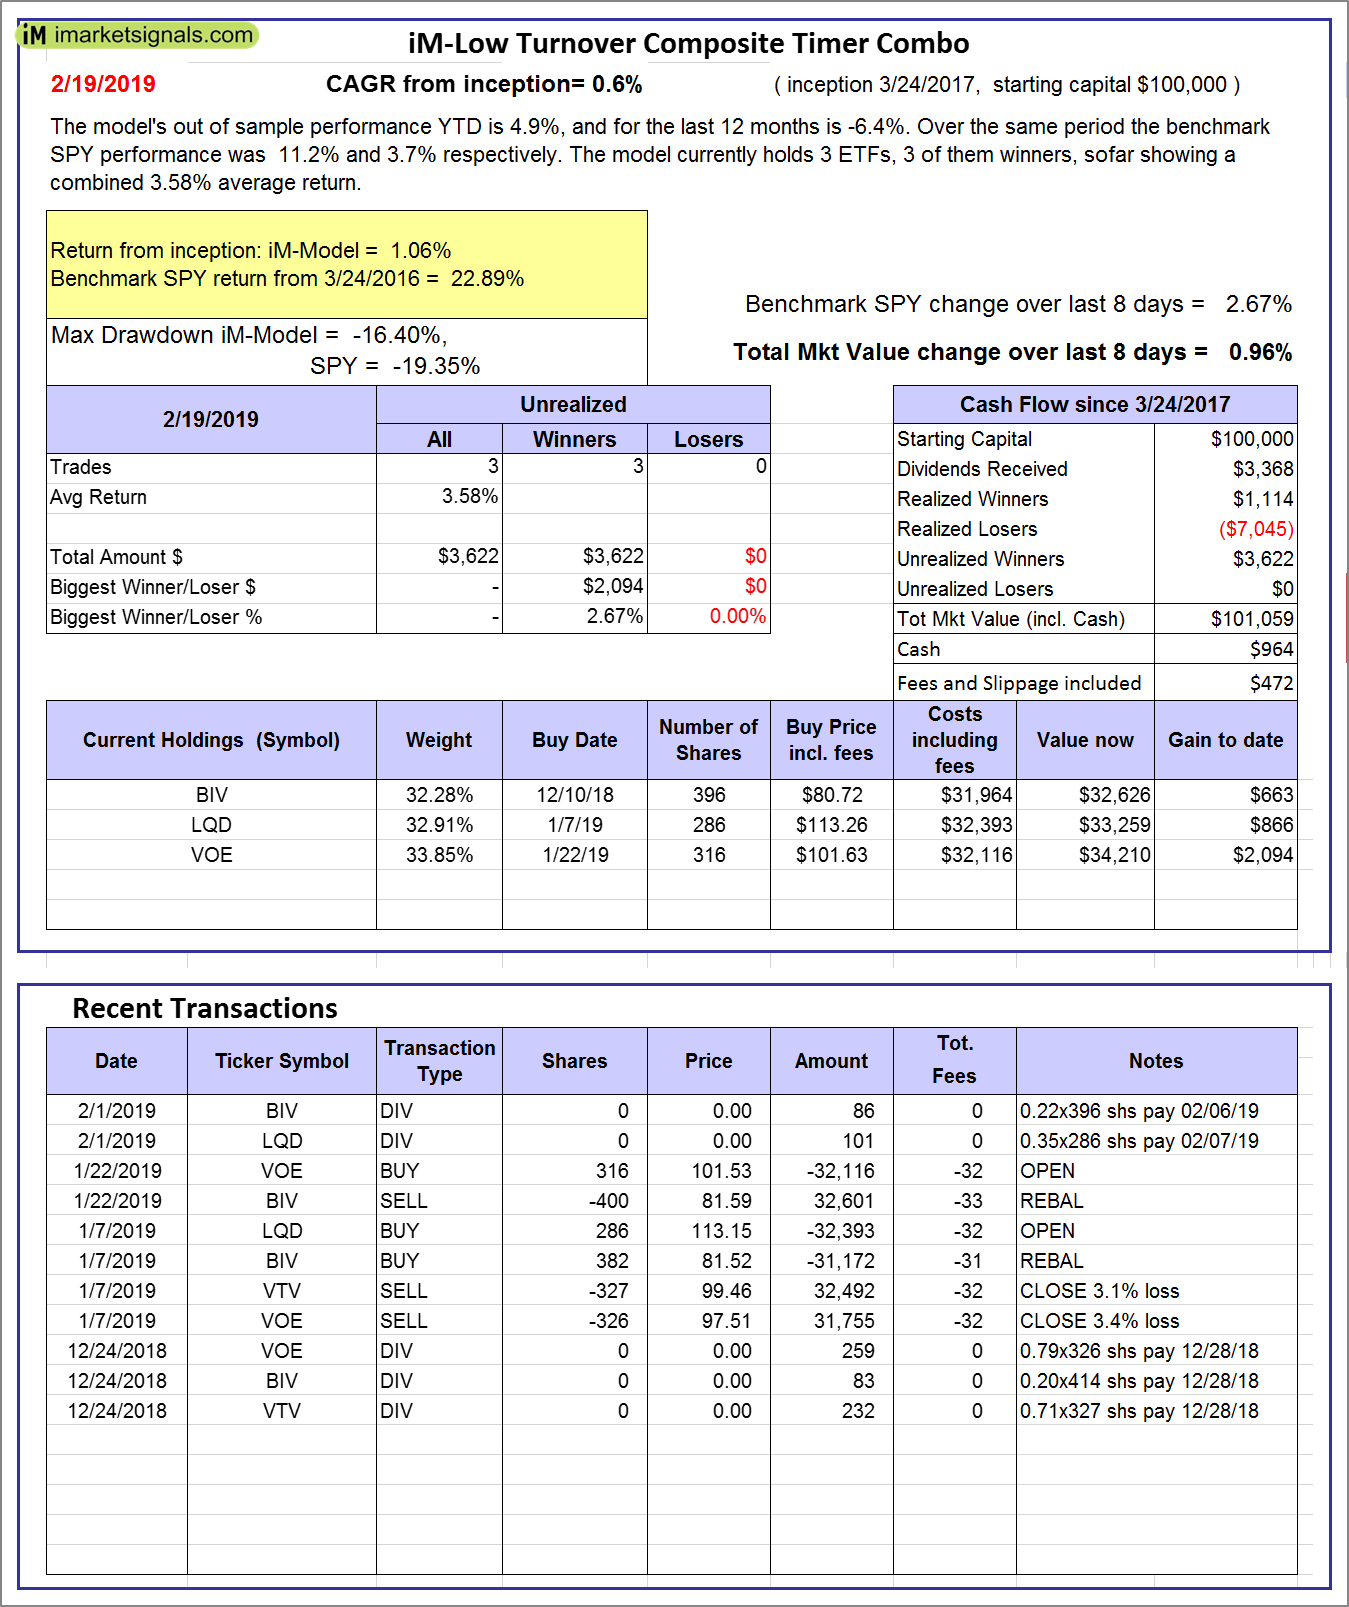 |
iM-Low Turnover Composite Timer Combo: The model’s out of sample performance YTD is 4.9%, and for the last 12 months is -6.4%. Over the same period the benchmark SPY performance was 11.2% and 3.7% respectively. Over the previous week the market value of the iM-Low Turnover Composite Timer Combo gained 0.96% at a time when SPY gained 2.67%. A starting capital of $100,000 at inception on 3/24/27 would have grown to $101,059 which includes $964 cash and excludes $472 spent on fees and slippage. |
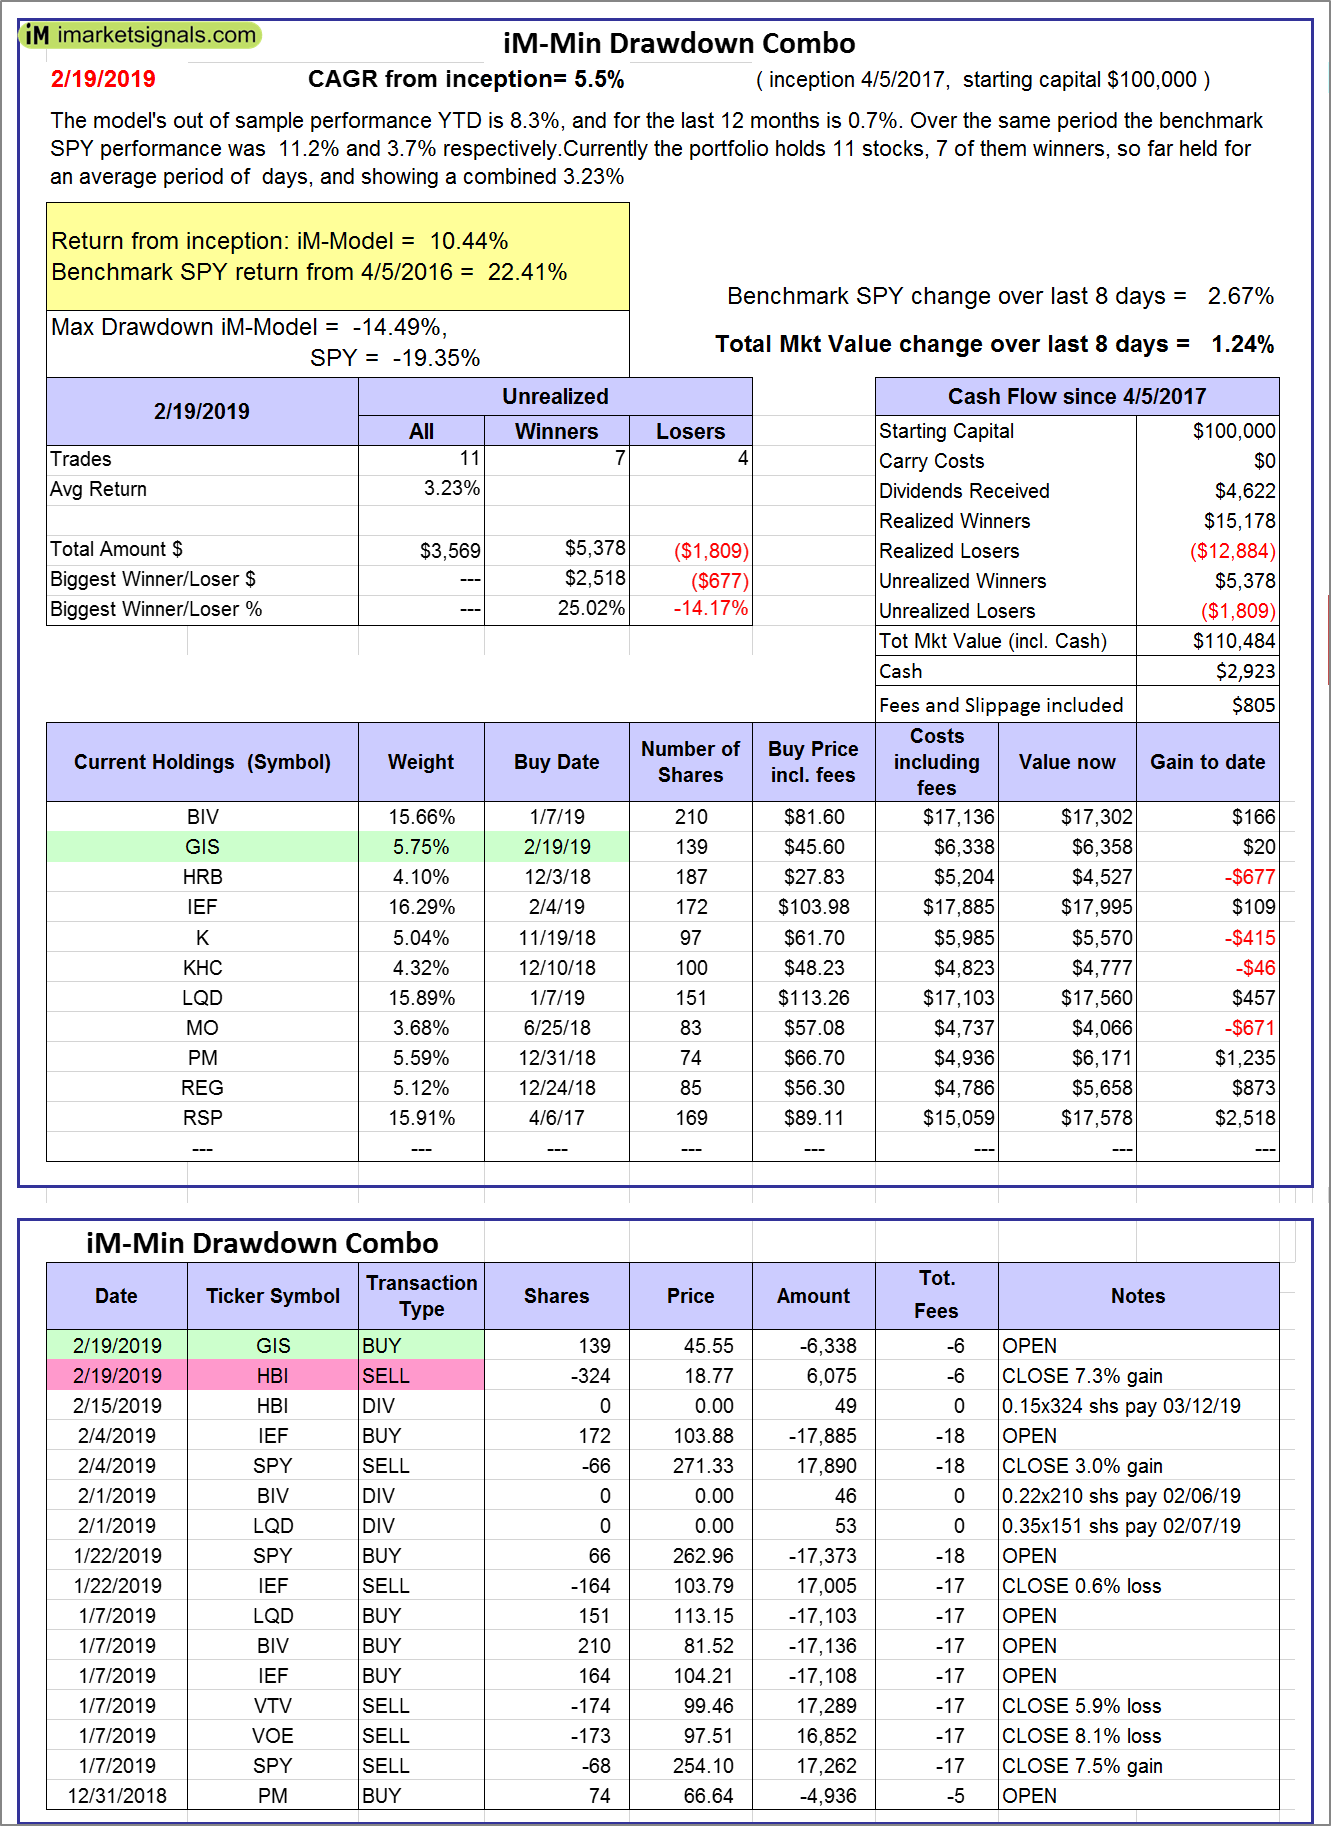 |
iM-Min Drawdown Combo: The model’s out of sample performance YTD is 8.3%, and for the last 12 months is 0.7%. Over the same period the benchmark SPY performance was 11.2% and 3.7% respectively. Over the previous week the market value of the iM-Min Drawdown Combo gained 1.24% at a time when SPY gained 2.67%. A starting capital of $100,000 at inception on 4/5/2017 would have grown to $110,484 which includes $2,923 cash and excludes $805 spent on fees and slippage. |
 |
iM-5ETF Trader (includes leveraged ETFs): The model’s out of sample performance YTD is 2.4%, and for the last 12 months is -16.2%. Over the same period the benchmark SPY performance was 11.2% and 3.7% respectively. Over the previous week the market value of the iM-5ETF Trader (includes leveraged ETFs) gained -0.24% at a time when SPY gained 2.67%. A starting capital of $100,000 at inception on 10/30/2016 would have grown to $141,743 which includes $26 cash and excludes $2,282 spent on fees and slippage. |
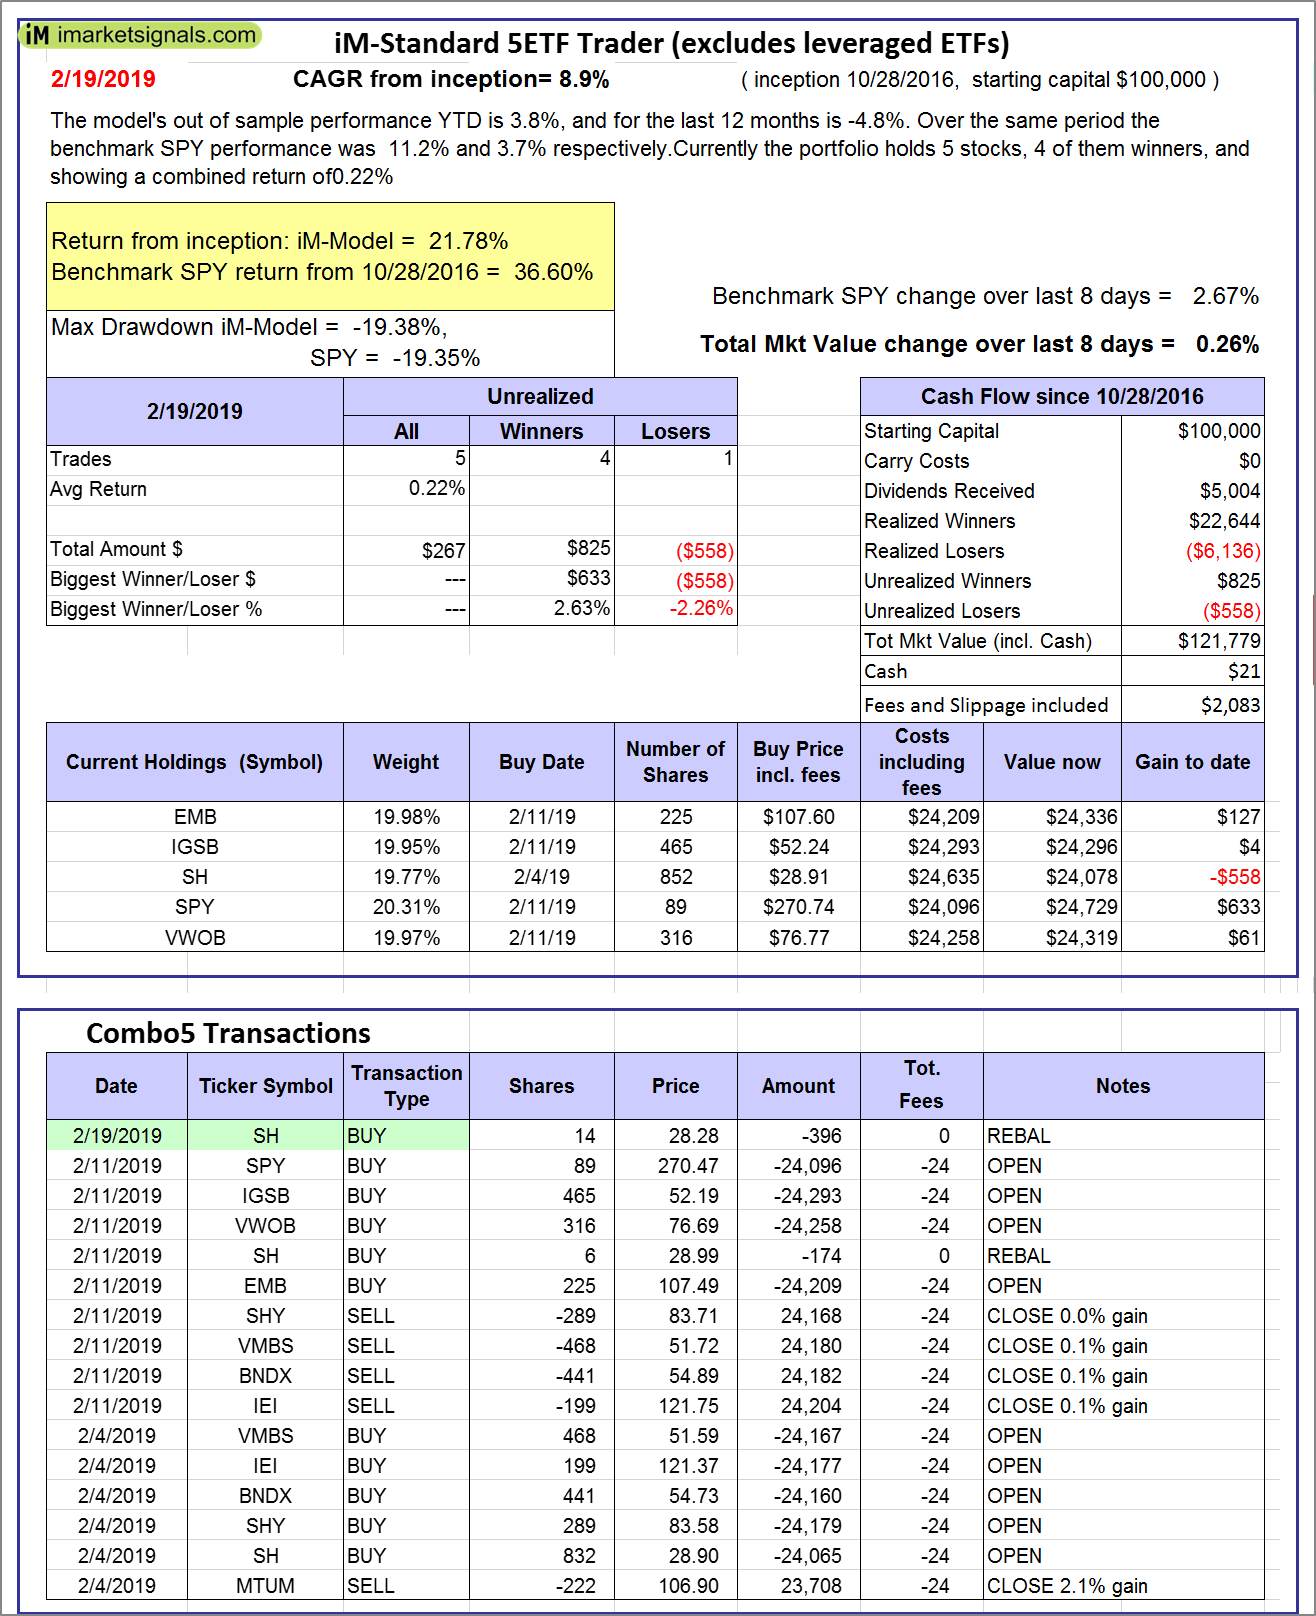 |
iM-Standard 5ETF Trader (excludes leveraged ETFs): The model’s out of sample performance YTD is 3.8%, and for the last 12 months is -4.8%. Over the same period the benchmark SPY performance was 11.2% and 3.7% respectively. Over the previous week the market value of the iM-Standard 5ETF Trader (excludes leveraged ETFs) gained 0.26% at a time when SPY gained 2.67%. A starting capital of $100,000 at inception on 10/30/2016 would have grown to $121,779 which includes $21 cash and excludes $2,083 spent on fees and slippage. |
iM-Best Reports – 2/19/2019
Posted in pmp SPY-SH
Leave a Reply
You must be logged in to post a comment.