
  |
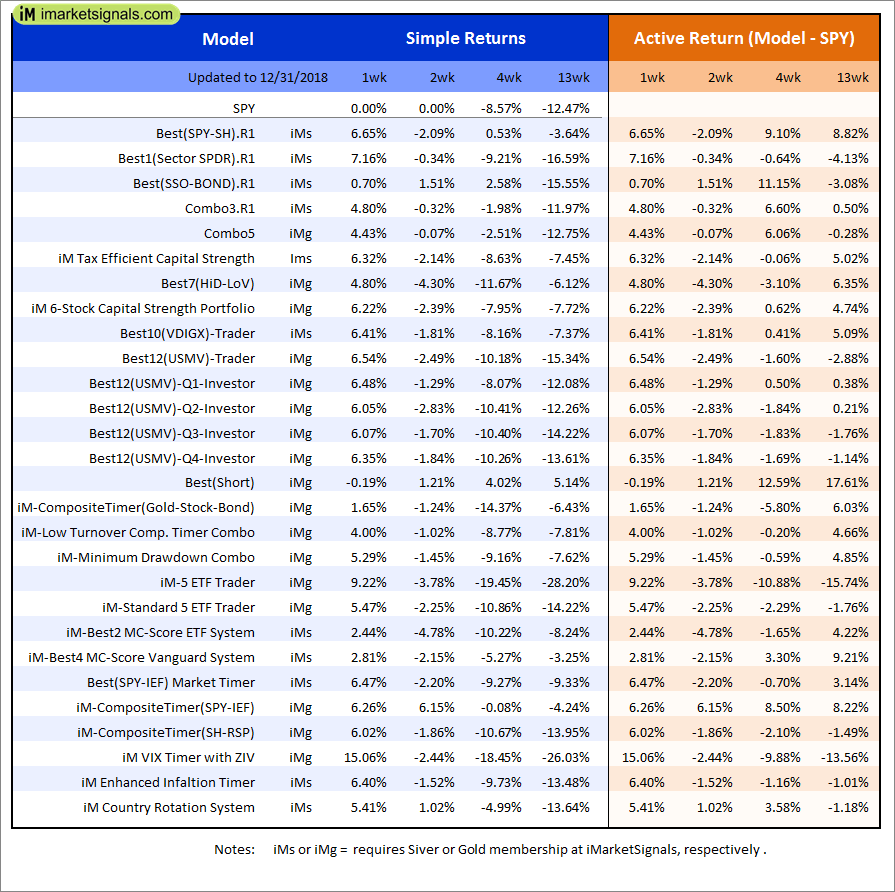
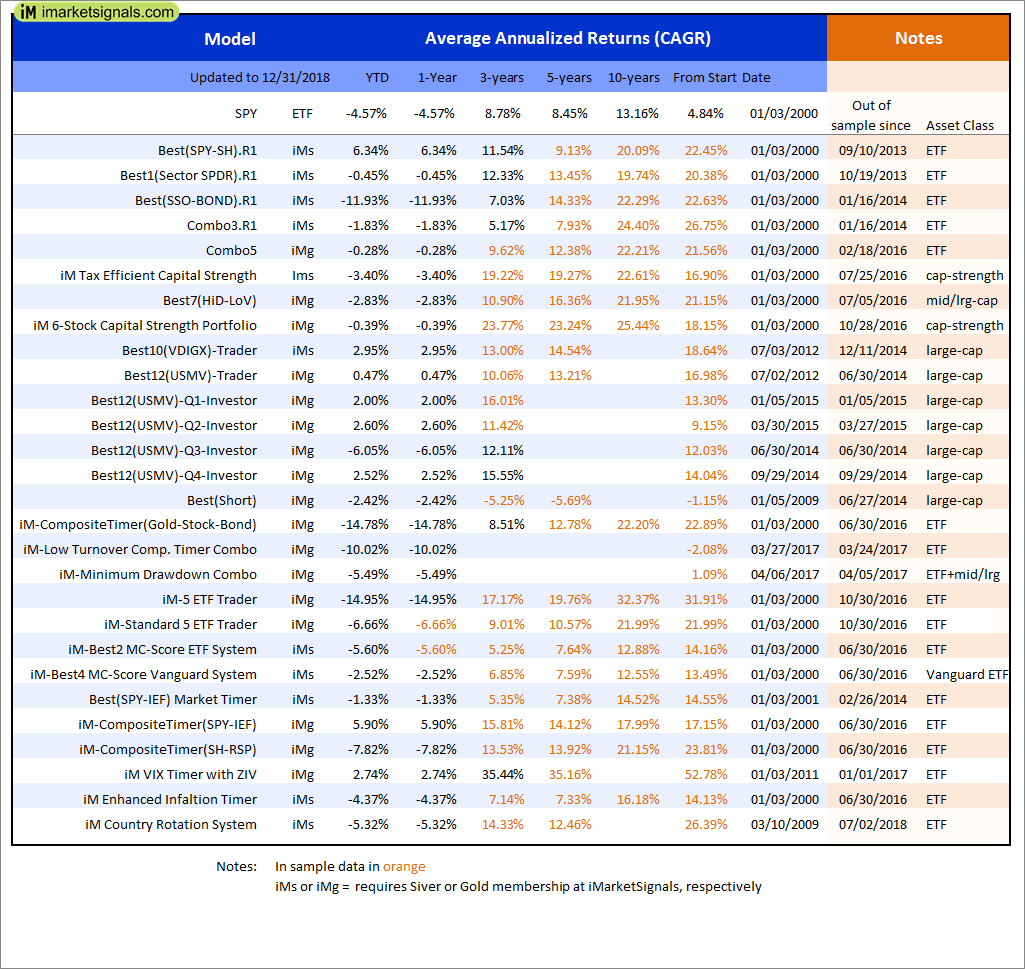
Out of sample performance summary of our models for the past 1, 2, 4 and 13 week periods. The active active return indicates how the models over- or underperformed the benchmark ETF SPY. Also the YTD, and the 1-, 3-, 5- and 10-year annualized returns are shown in the second table |
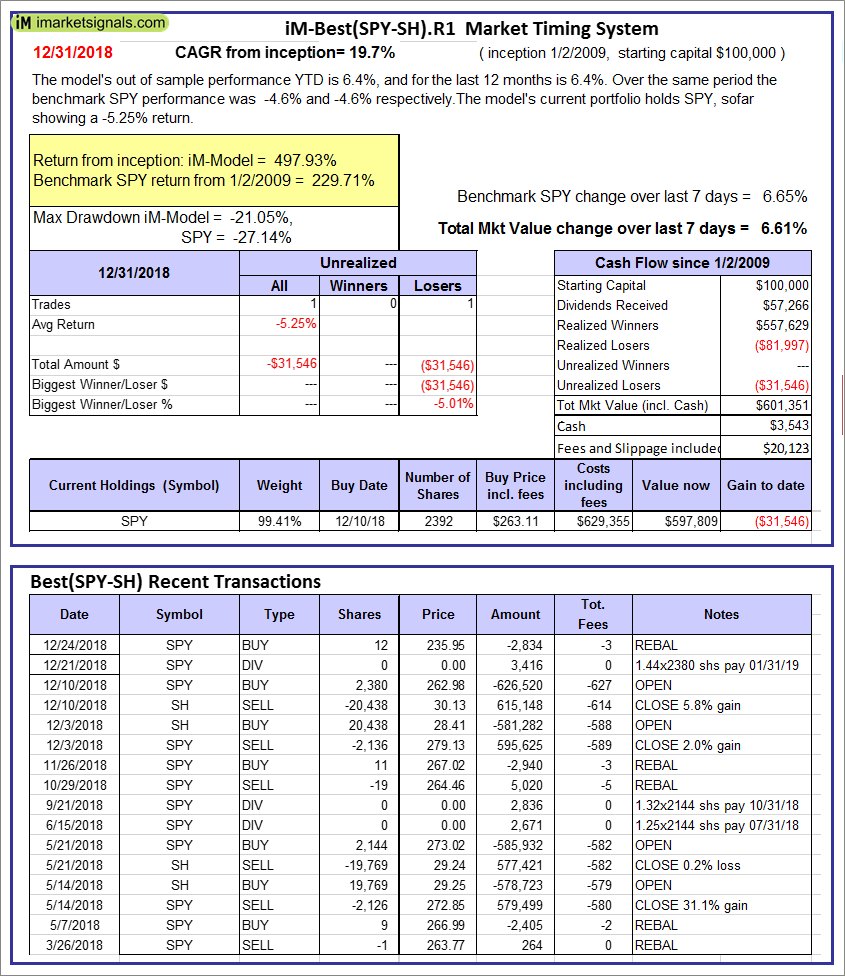 |
iM-Best(SPY-SH).R1: The model’s out of sample performance YTD is 6.4%, and for the last 12 months is 6.4%. Over the same period the benchmark SPY performance was -4.6% and -4.6% respectively. Over the previous week the market value of Best(SPY-SH) gained 6.61% at a time when SPY gained 6.65%. A starting capital of $100,000 at inception on 1/2/2009 would have grown to $601,351 which includes $3,543 cash and excludes $20,123 spent on fees and slippage. |
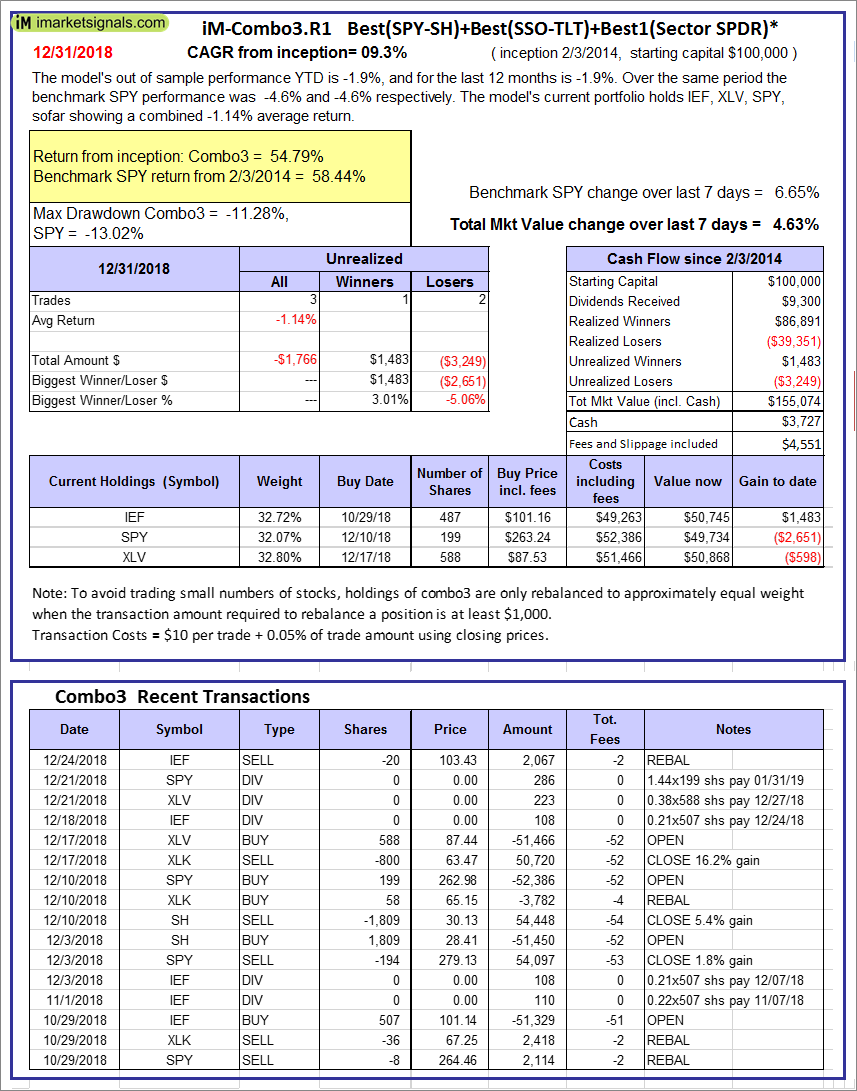 |
iM-Combo3.R1: The model’s out of sample performance YTD is -1.9%, and for the last 12 months is -1.9%. Over the same period the benchmark SPY performance was -4.6% and -4.6% respectively. Over the previous week the market value of iM-Combo3.R1 gained 4.63% at a time when SPY gained 6.65%. A starting capital of $100,000 at inception on 2/3/2014 would have grown to $155,074 which includes $3,727 cash and excludes $4,551 spent on fees and slippage. |
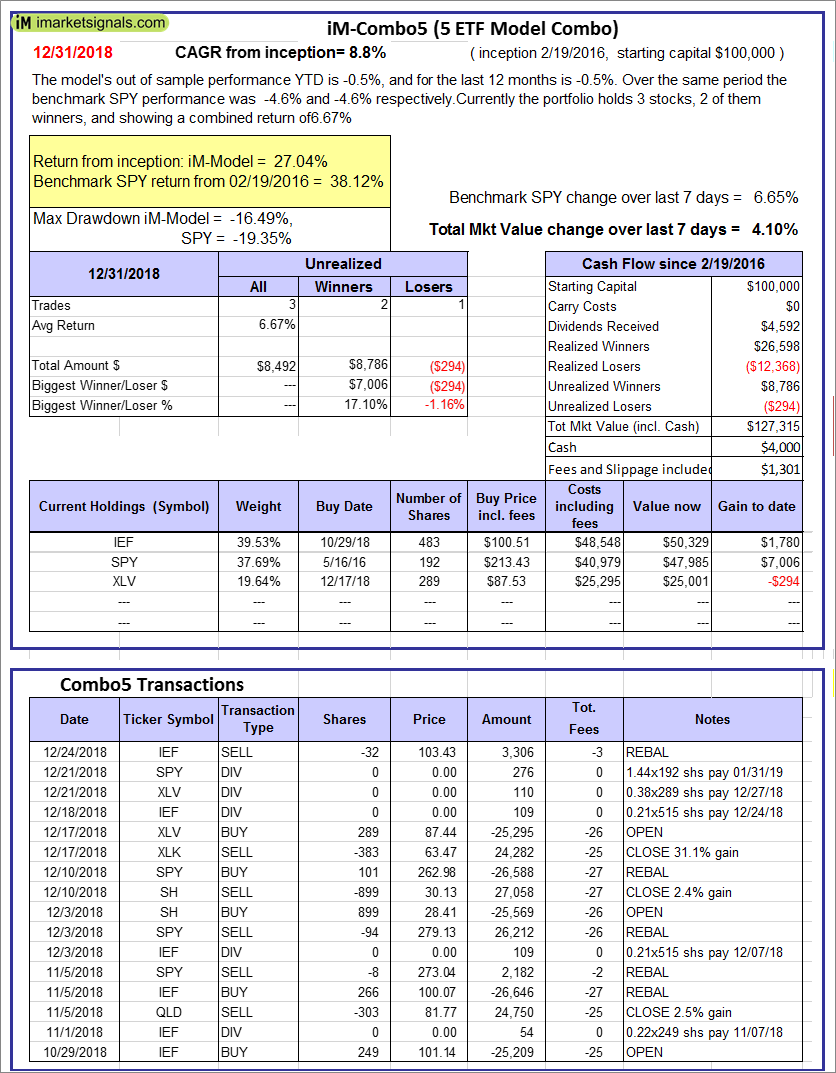 |
iM-Combo5: The model’s out of sample performance YTD is -0.5%, and for the last 12 months is -0.5%. Over the same period the benchmark SPY performance was -4.6% and -4.6% respectively. Over the previous week the market value of iM-Combo5 gained 4.10% at a time when SPY gained 6.65%. A starting capital of $100,000 at inception on 2/22/2016 would have grown to $127,315 which includes $4,000 cash and excludes $1,301 spent on fees and slippage. |
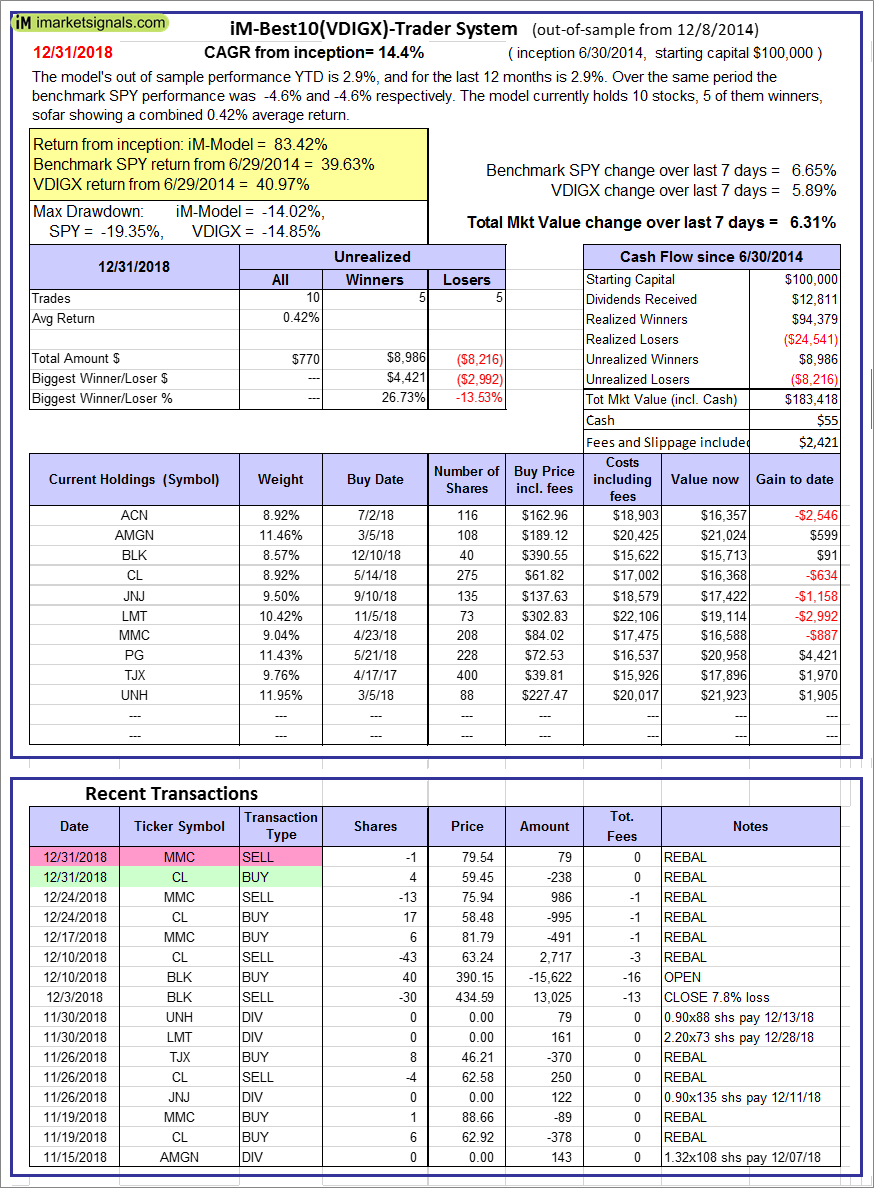 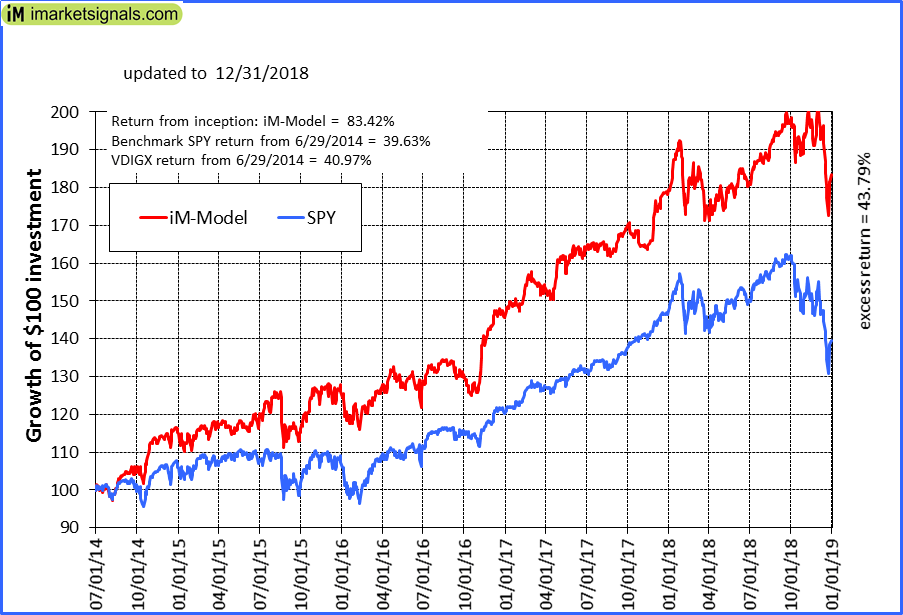 |
iM-Best10(VDIGX)-Trader: The model’s out of sample performance YTD is 2.9%, and for the last 12 months is 2.9%. Over the same period the benchmark SPY performance was -4.6% and -4.6% respectively. Since inception, on 7/1/2014, the model gained 83.42% while the benchmark SPY gained 39.63% and VDIGX gained 40.97% over the same period. Over the previous week the market value of iM-Best10(VDIGX) gained 6.31% at a time when SPY gained 6.65%. A starting capital of $100,000 at inception on 7/1/2014 would have grown to $183,418 which includes $55 cash and excludes $2,421 spent on fees and slippage. |
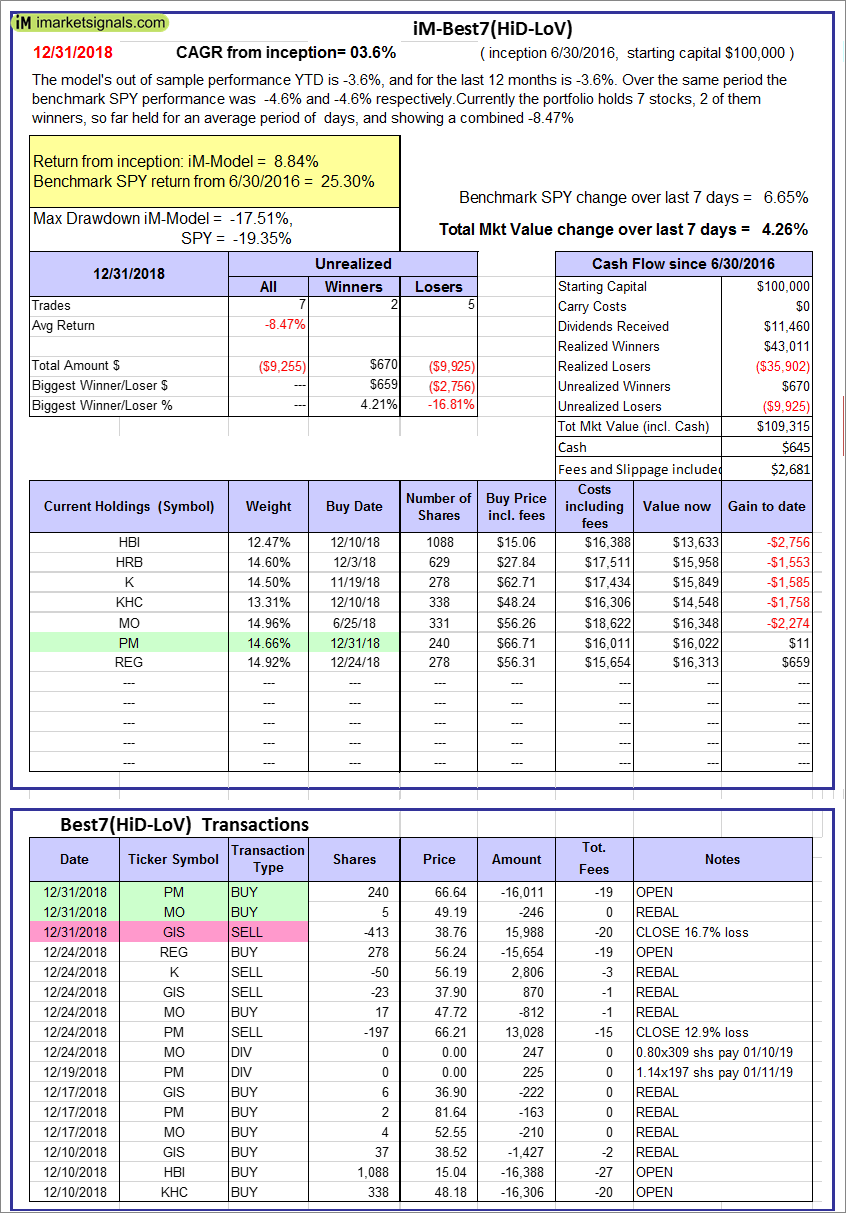 |
iM-Best7(HiD-LoV): The model’s out of sample performance YTD is -3.6%, and for the last 12 months is -3.6%. Over the same period the benchmark SPY performance was -4.6% and -4.6% respectively. Over the previous week the market value of iM-BESTOGA-3 gained 4.26% at a time when SPY gained 6.65%. A starting capital of $100,000 at inception on 6/30/2016 would have grown to $109,315 which includes $645 cash and excludes $2,681 spent on fees and slippage. |
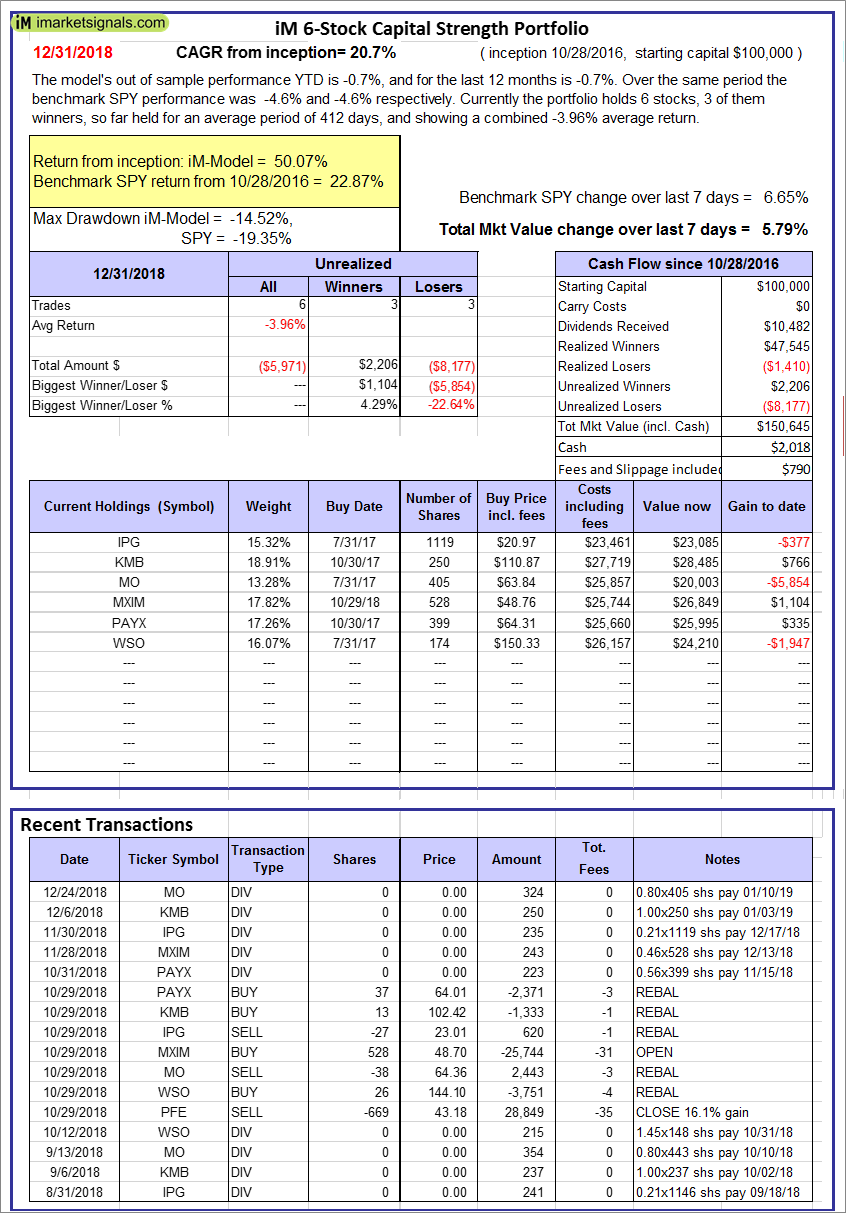 |
iM 6-Stock Capital Strength Portfolio: The model’s out of sample performance YTD is -0.7%, and for the last 12 months is -0.7%. Over the same period the benchmark SPY performance was -4.6% and -4.6% respectively. Over the previous week the market value of the iM 6-Stock Capital Strength Portfolio gained 5.79% at a time when SPY gained 6.65%. A starting capital of $100,000 at inception on 10/28/2016 would have grown to $150,645 which includes $2,018 cash and excludes $790 spent on fees and slippage. |
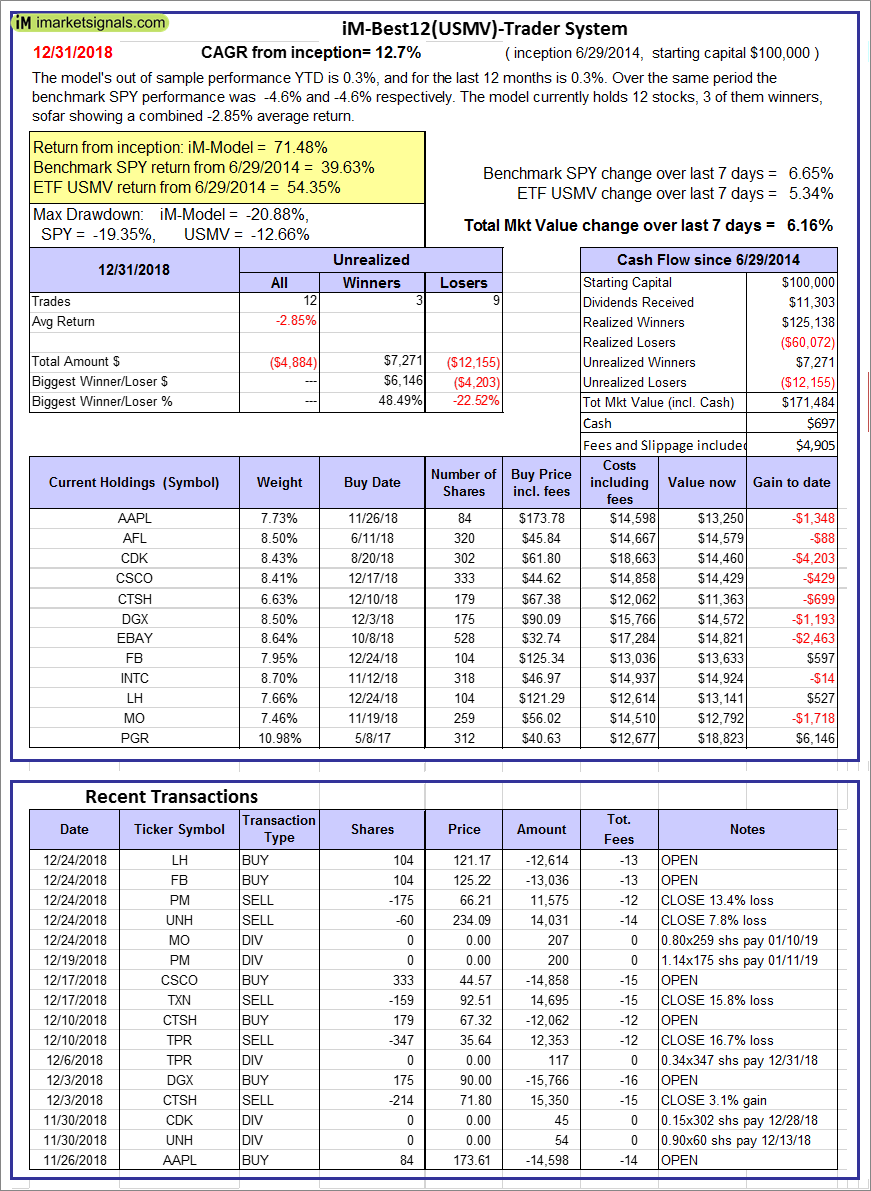 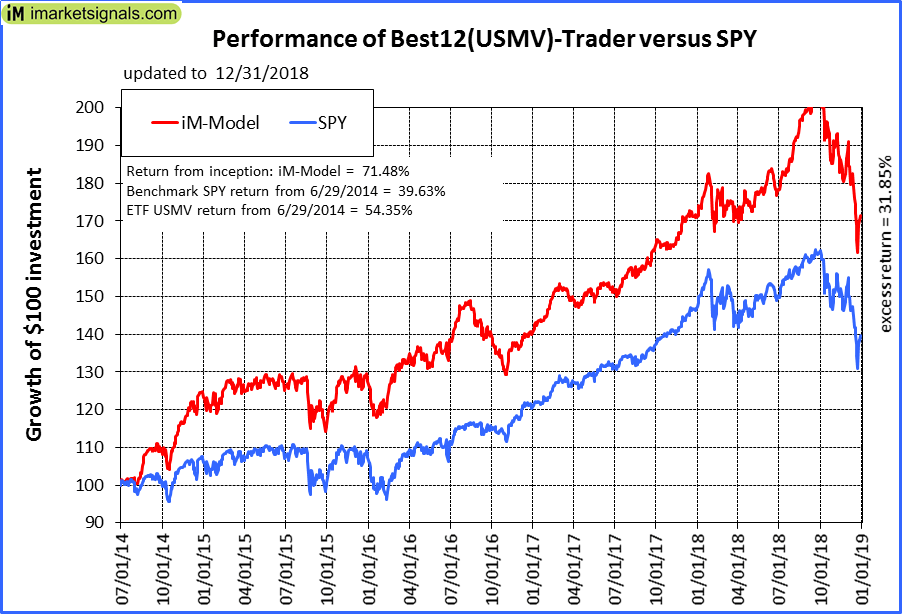 |
iM-Best12(USMV)-Trader: The model’s out of sample performance YTD is 0.3%, and for the last 12 months is 0.3%. Over the same period the benchmark SPY performance was -4.6% and -4.6% respectively. Since inception, on 6/30/2014, the model gained 71.48% while the benchmark SPY gained 39.63% and the ETF USMV gained 54.35% over the same period. Over the previous week the market value of iM-Best12(USMV)-Trader gained 6.16% at a time when SPY gained 6.65%. A starting capital of $100,000 at inception on 6/30/2014 would have grown to $171,484 which includes $697 cash and excludes $4,905 spent on fees and slippage. |
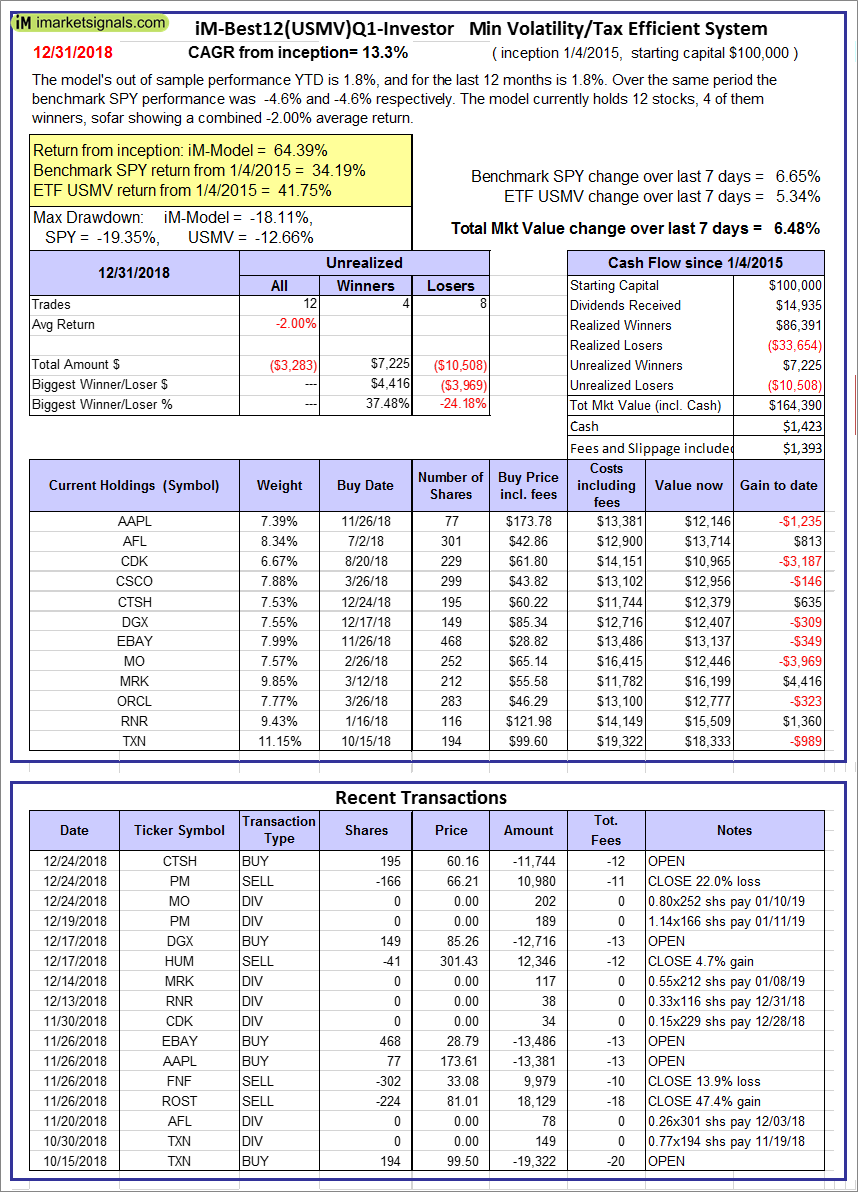 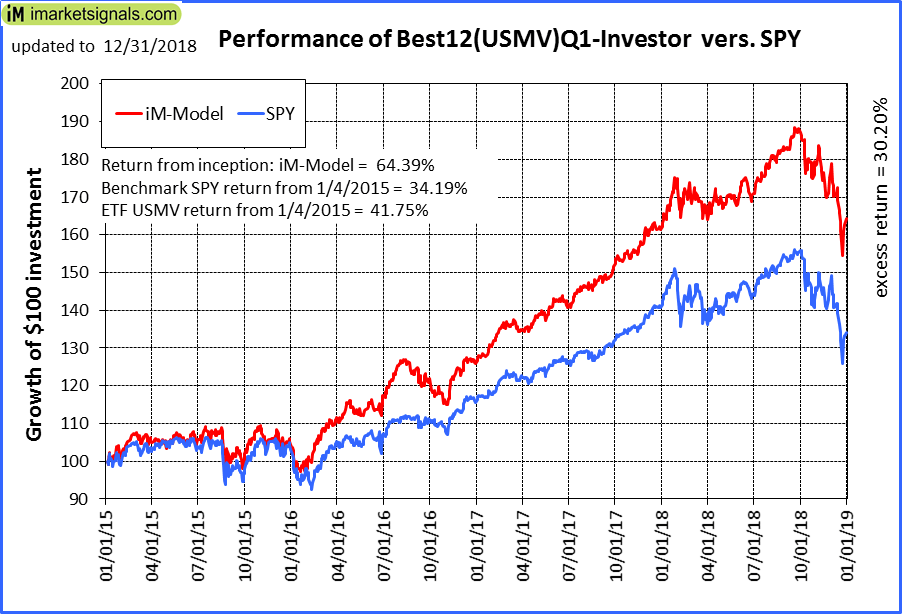 |
iM-Best12(USMV)Q1-Investor: The model’s out of sample performance YTD is 1.8%, and for the last 12 months is 1.8%. Over the same period the benchmark SPY performance was -4.6% and -4.6% respectively. Since inception, on 1/5/2015, the model gained 64.39% while the benchmark SPY gained 34.19% and the ETF USMV gained 41.75% over the same period. Over the previous week the market value of iM-Best12(USMV)Q1 gained 6.48% at a time when SPY gained 6.65%. A starting capital of $100,000 at inception on 1/5/2015 would have grown to $164,390 which includes $1,423 cash and excludes $1,393 spent on fees and slippage. |
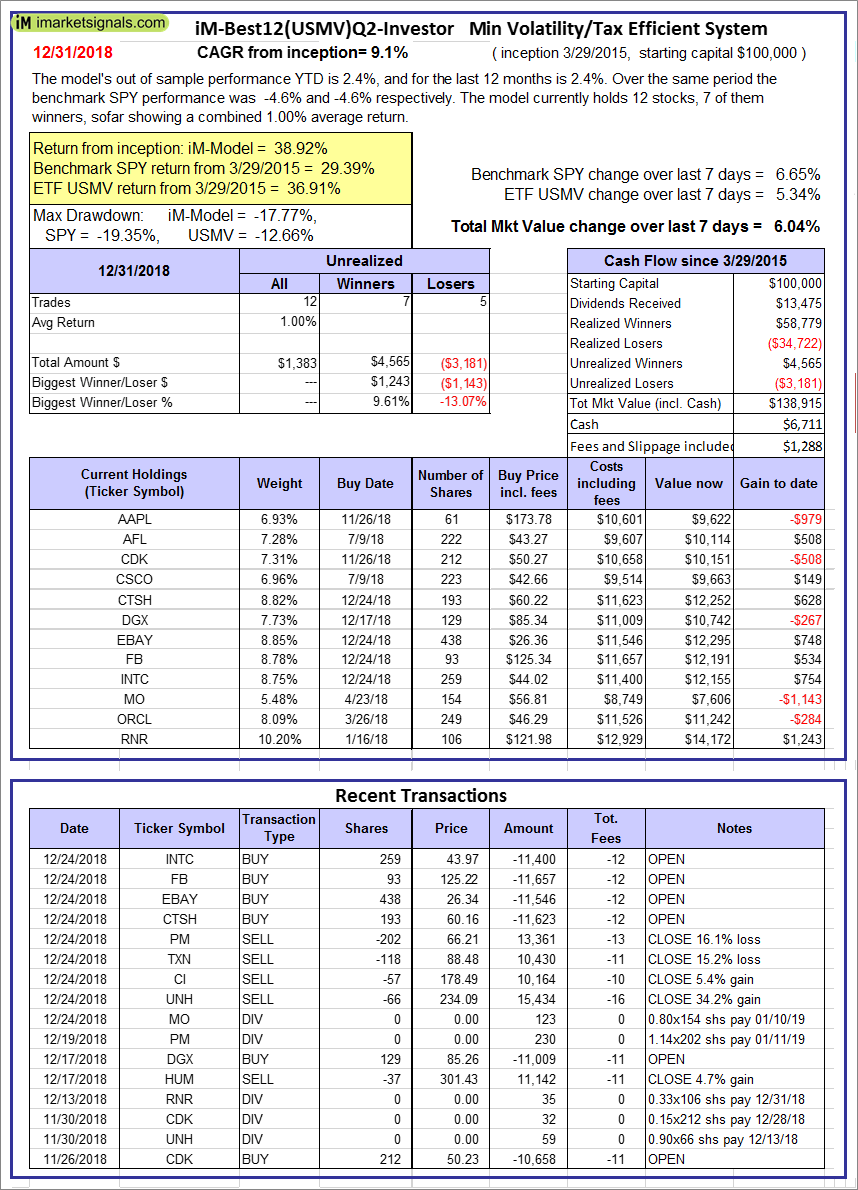 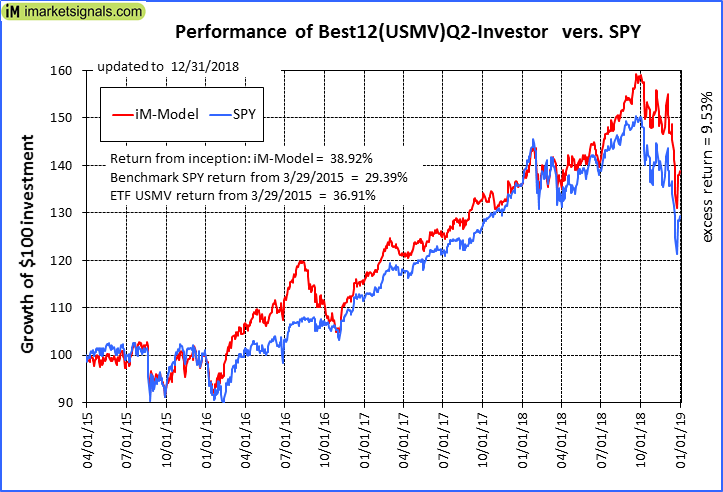 |
iM-Best12(USMV)Q2-Investor: The model’s out of sample performance YTD is 2.4%, and for the last 12 months is 2.4%. Over the same period the benchmark SPY performance was -4.6% and -4.6% respectively. Since inception, on 3/30/2015, the model gained 38.92% while the benchmark SPY gained 29.39% and the ETF USMV gained 36.91% over the same period. Over the previous week the market value of iM-Best12(USMV)Q2 gained 6.04% at a time when SPY gained 6.65%. A starting capital of $100,000 at inception on 3/30/2015 would have grown to $138,915 which includes $6,711 cash and excludes $1,288 spent on fees and slippage. |
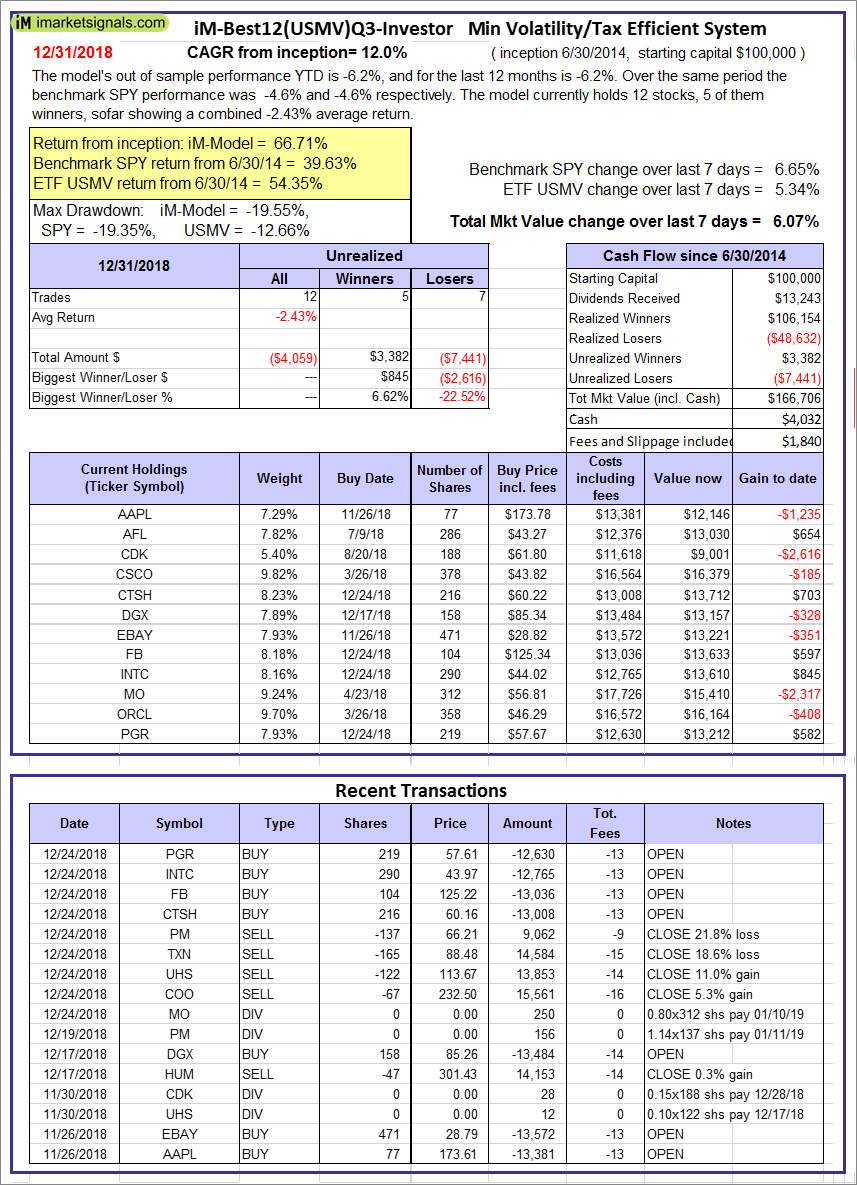 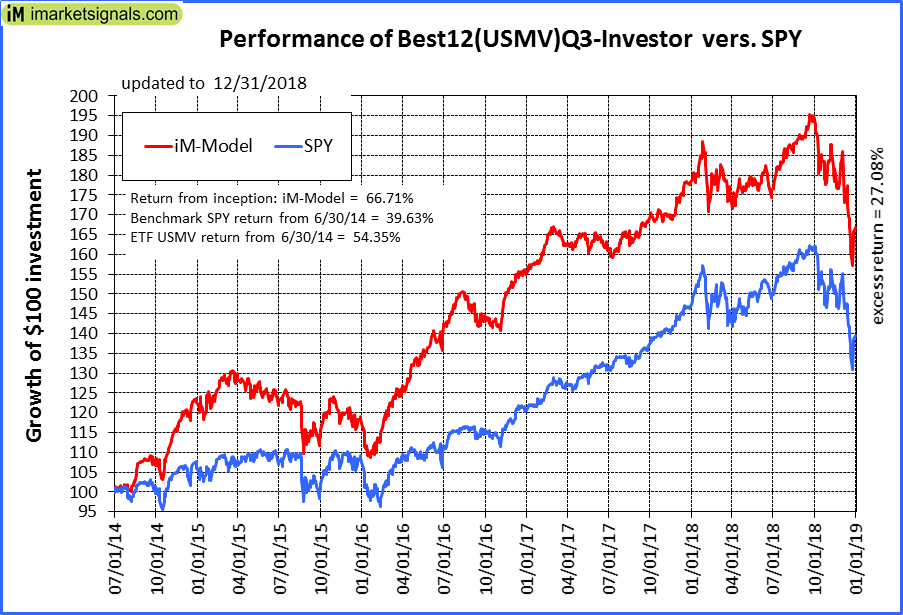 |
iM-Best12(USMV)Q3-Investor: The model’s out of sample performance YTD is -6.2%, and for the last 12 months is -6.2%. Over the same period the benchmark SPY performance was -4.6% and -4.6% respectively. Since inception, on 7/1/2014, the model gained 66.71% while the benchmark SPY gained 39.63% and the ETF USMV gained 54.35% over the same period. Over the previous week the market value of iM-Best12(USMV)Q3 gained 6.07% at a time when SPY gained 6.65%. A starting capital of $100,000 at inception on 7/1/2014 would have grown to $166,706 which includes $4,032 cash and excludes $1,840 spent on fees and slippage. |
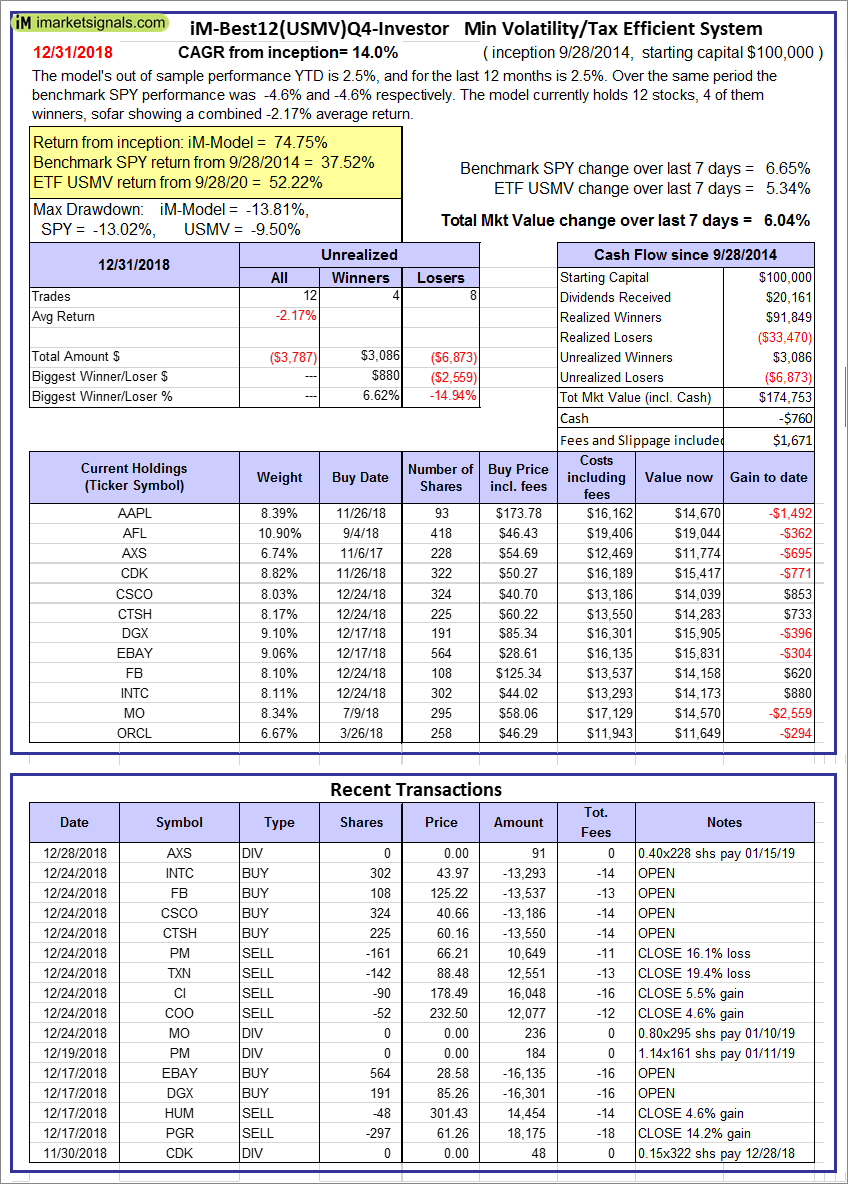 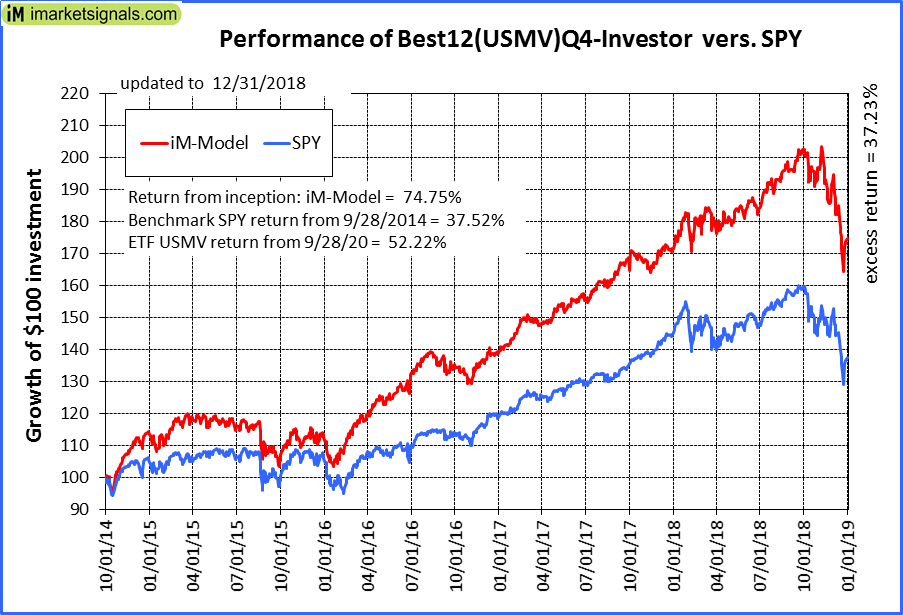 |
iM-Best12(USMV)Q4-Investor: Since inception, on 9/29/2014, the model gained 74.75% while the benchmark SPY gained 37.52% and the ETF USMV gained 52.22% over the same period. Over the previous week the market value of iM-Best12(USMV)Q4 gained 6.04% at a time when SPY gained 6.65%. A starting capital of $100,000 at inception on 9/29/2014 would have grown to $174,753 which includes -$760 cash and excludes $1,671 spent on fees and slippage. |
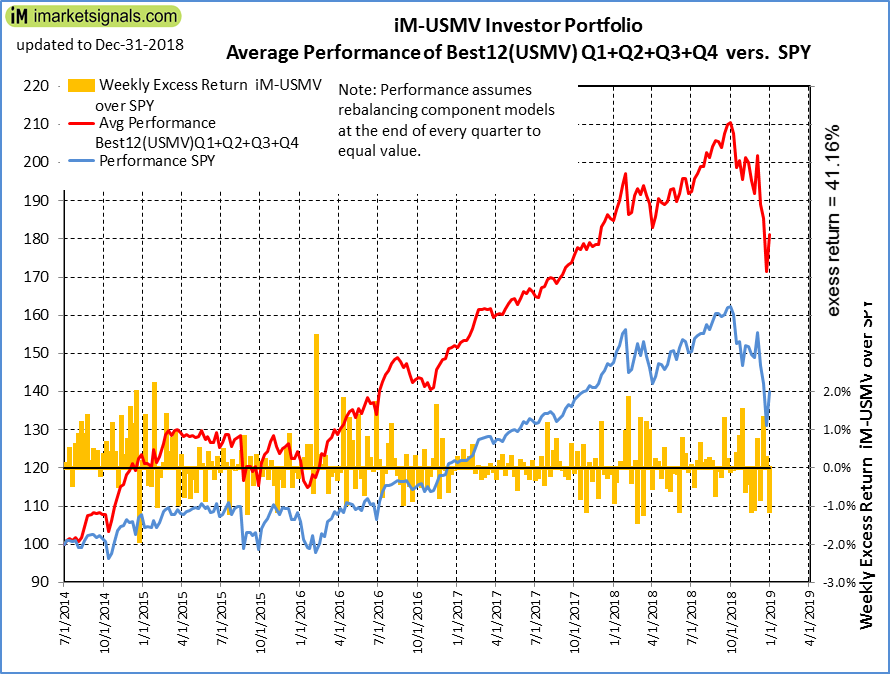 |
Average Performance of iM-Best12(USMV)Q1+Q2+Q3+Q4-Investor resulted in an excess return of 41.16% over SPY. (see iM-USMV Investor Portfolio) |
 |
iM-Best(Short): The model’s out of sample performance YTD is -2.4%, and for the last 12 months is -2.4%. Over the same period the benchmark SPY performance was -4.6% and -4.6% respectively. Over the previous week the market value of iM-Best(Short) gained -0.20% at a time when SPY gained 6.65%. Over the period 1/2/2009 to 12/31/2018 the starting capital of $100,000 would have grown to $89,016 which includes $125,565 cash and excludes $25,091 spent on fees and slippage. |
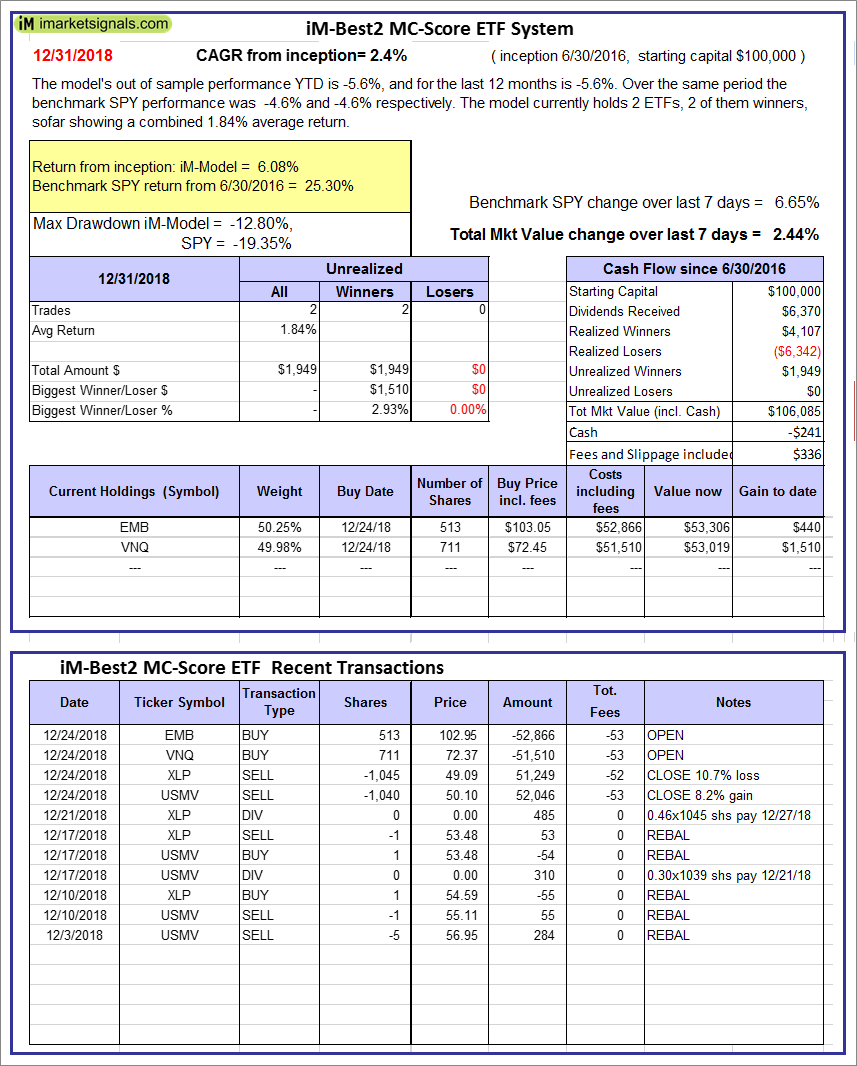 |
iM-Best2 MC-Score ETF System: The model’s out of sample performance YTD is -5.6%, and for the last 12 months is -5.6%. Over the same period the benchmark SPY performance was -4.6% and -4.6% respectively. Over the previous week the market value of the iM-Best2 MC-Score ETF System gained 2.44% at a time when SPY gained 6.65%. A starting capital of $100,000 at inception on 6/30/2016 would have grown to $106,085 which includes -$241 cash and excludes $336 spent on fees and slippage. |
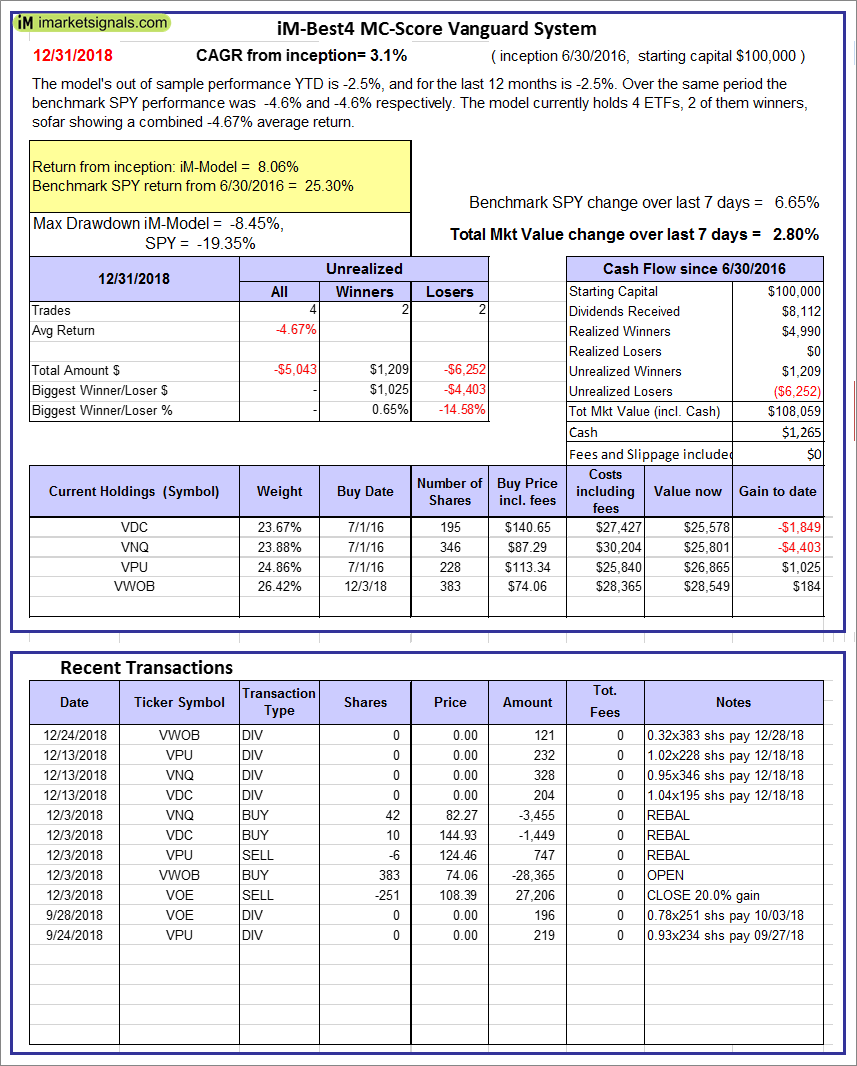 |
iM-Best4 MC-Score Vanguard System: The model’s out of sample performance YTD is -2.5%, and for the last 12 months is -2.5%. Over the same period the benchmark SPY performance was -4.6% and -4.6% respectively. Over the previous week the market value of the iM-Best4 MC-Score Vanguard System gained 2.80% at a time when SPY gained 6.65%. A starting capital of $100,000 at inception on 6/30/2016 would have grown to $108,059 which includes $1,265 cash and excludes $00 spent on fees and slippage. |
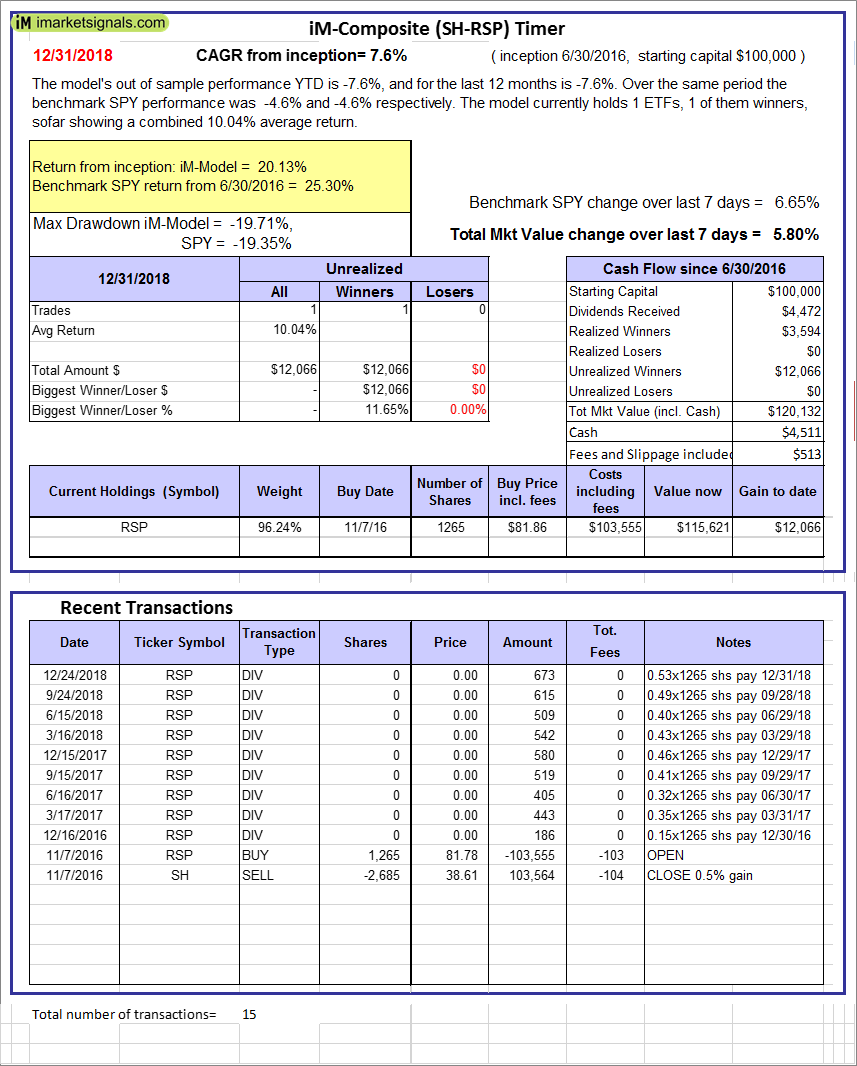 |
iM-Composite (SH-RSP) Timer: The model’s out of sample performance YTD is -7.6%, and for the last 12 months is -7.6%. Over the same period the benchmark SPY performance was -4.6% and -4.6% respectively. Over the previous week the market value of the iM-Composite (SH-RSP) Timer gained 5.80% at a time when SPY gained 6.65%. A starting capital of $100,000 at inception on 6/30/2016 would have grown to $120,132 which includes $4,511 cash and excludes $513 spent on fees and slippage. |
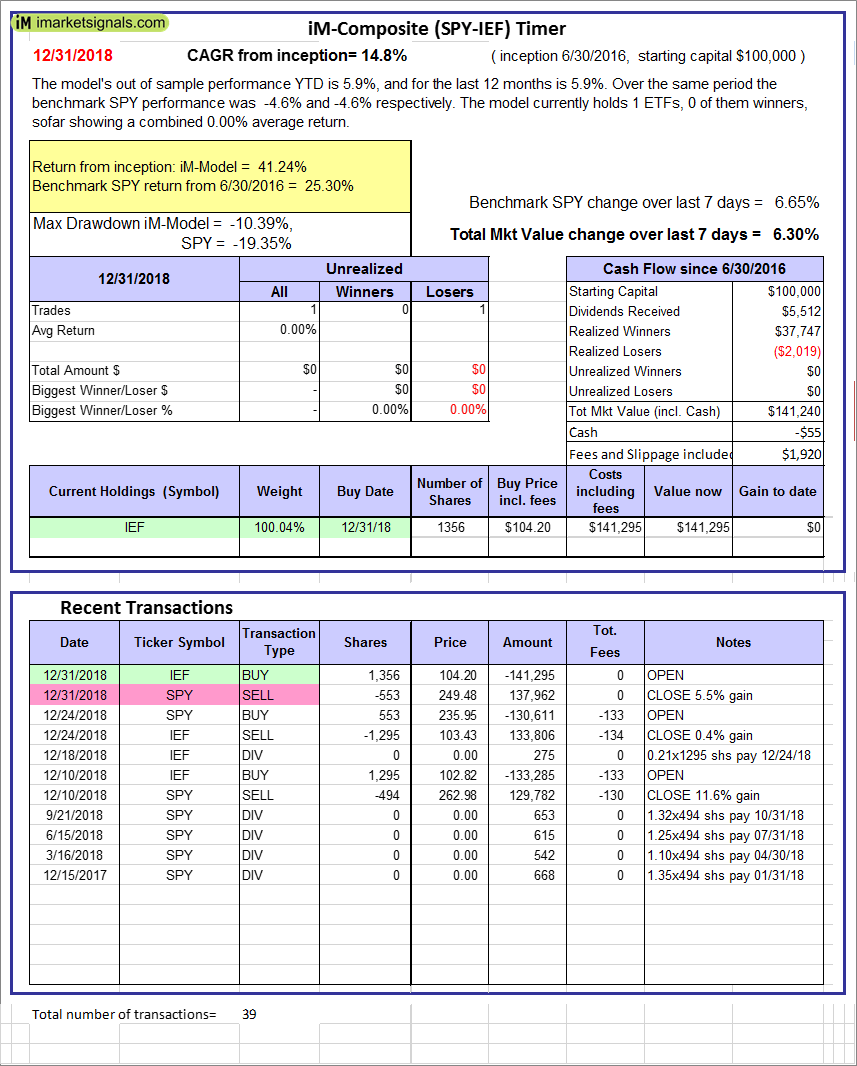 |
iM-Composite (SPY-IEF) Timer: The model’s out of sample performance YTD is 5.9%, and for the last 12 months is 5.9%. Over the same period the benchmark SPY performance was -4.6% and -4.6% respectively. Over the previous week the market value of the iM-Composite (SPY-IEF) Timer gained 6.30% at a time when SPY gained 6.65%. A starting capital of $100,000 at inception on 6/30/2016 would have grown to $141,240 which includes -$55 cash and excludes $1,920 spent on fees and slippage. |
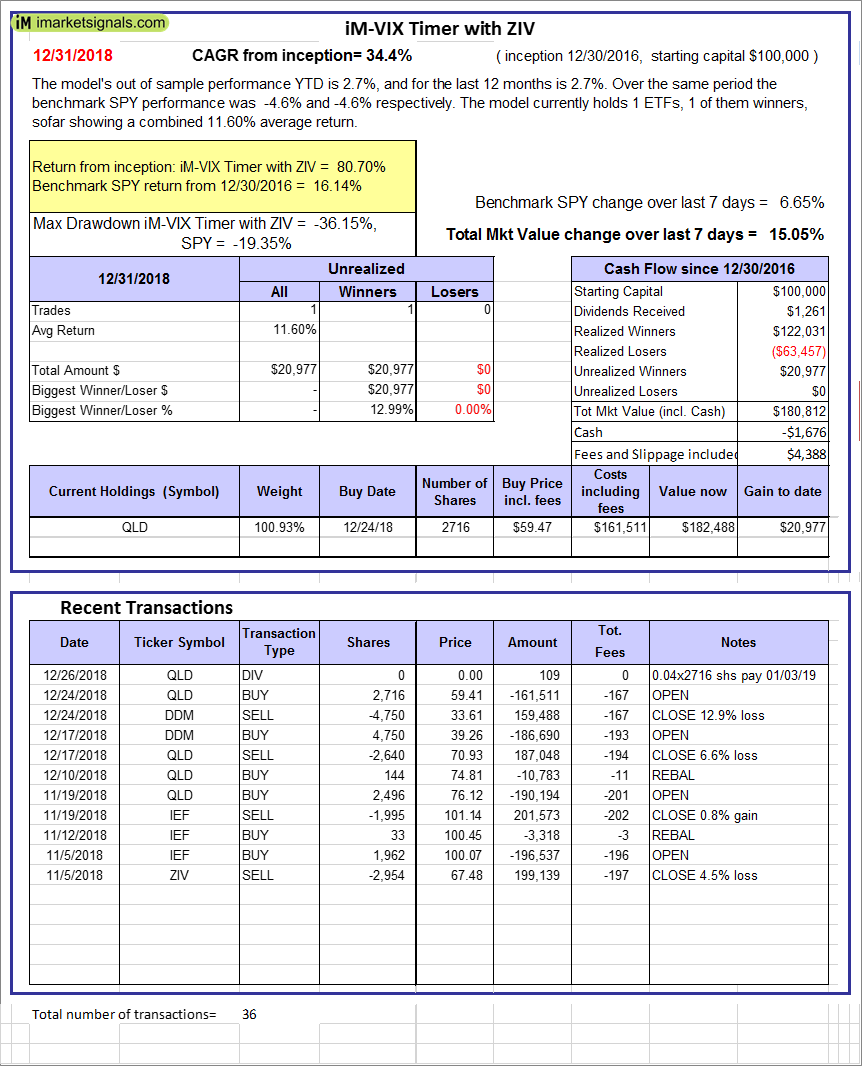 |
iM-VIX Timer with ZIV: The model’s out of sample performance YTD is 2.7%, and for the last 12 months is 2.7%. Over the same period the benchmark SPY performance was -4.6% and -4.6% respectively. Over the previous week the market value of the iM-VIX Timer with ZIV gained 15.05% at a time when SPY gained 6.65%. A starting capital of $100,000 at inception on 6/30/2016 would have grown to $180,812 which includes -$1,676 cash and excludes $4,388 spent on fees and slippage. |
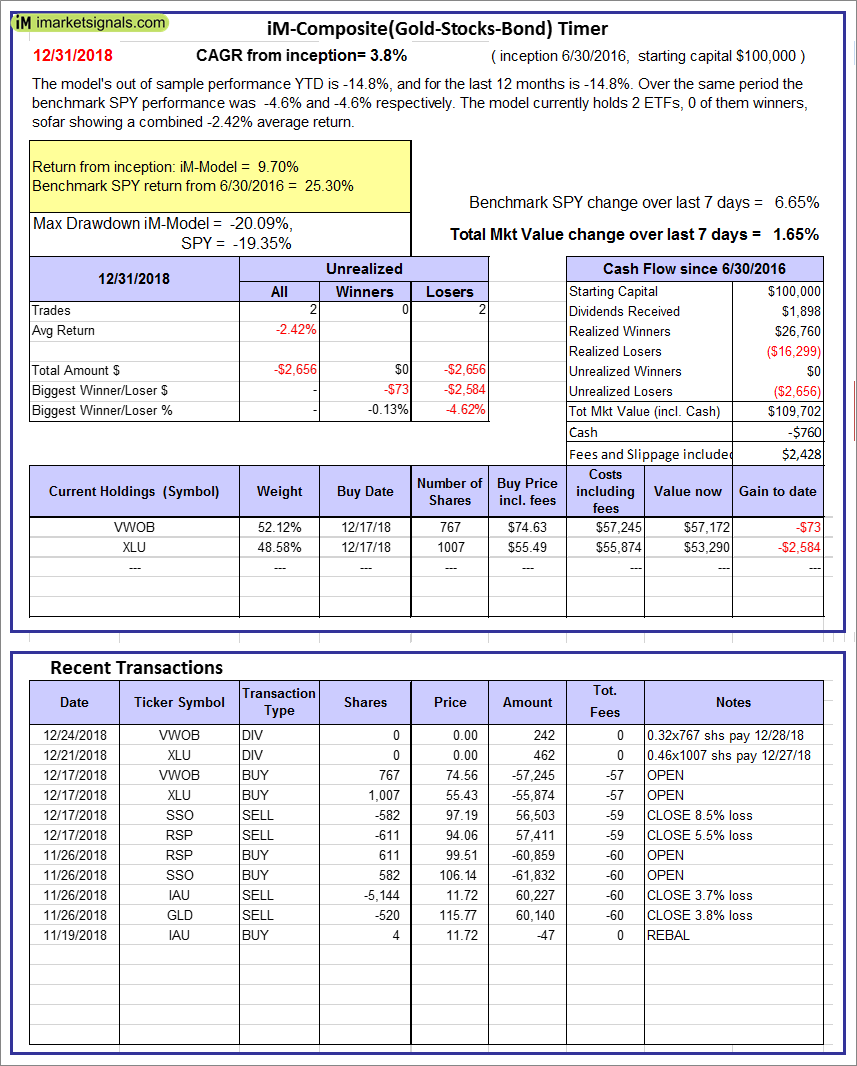 |
iM-Composite(Gold-Stocks-Bond) Timer: The model’s out of sample performance YTD is -14.8%, and for the last 12 months is -14.8%. Over the same period the benchmark SPY performance was -4.6% and -4.6% respectively. Over the previous week the market value of the iM-Composite(Gold-Stocks-Bond) Timer gained 1.65% at a time when SPY gained 6.65%. A starting capital of $100,000 at inception on 6/30/2016 would have grown to $109,702 which includes -$760 cash and excludes $2,428 spent on fees and slippage. |
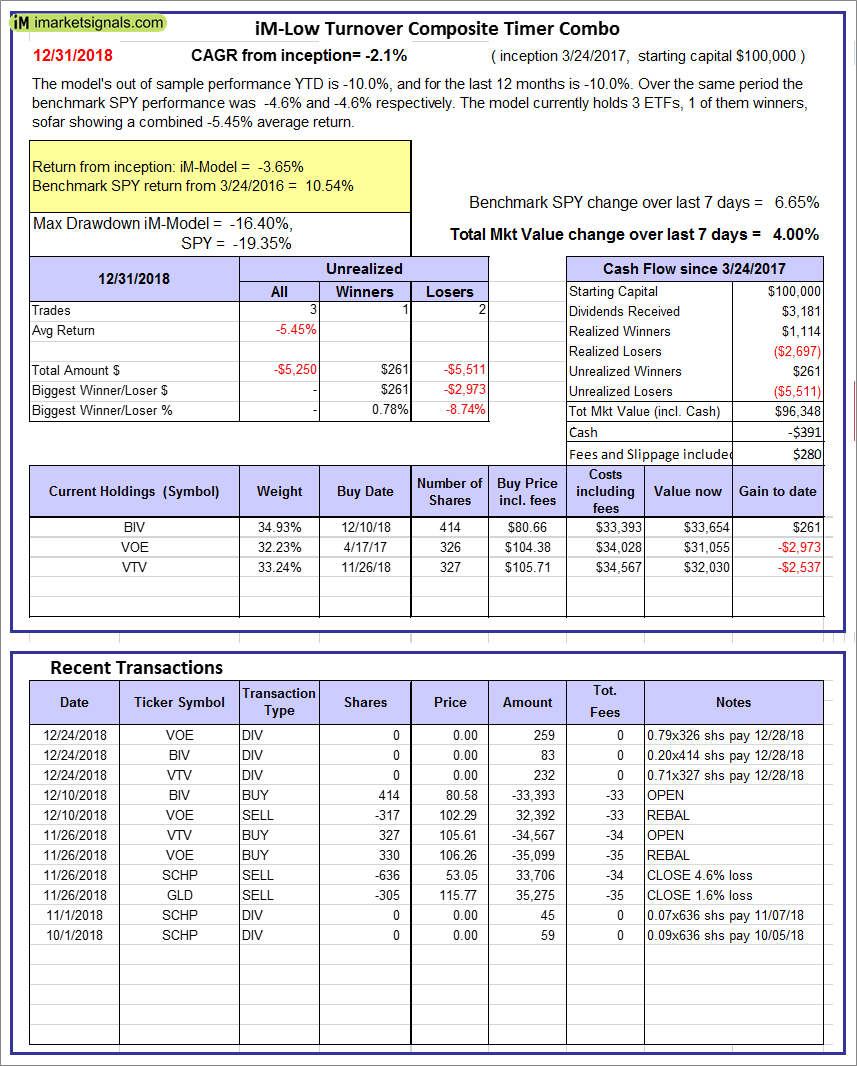 |
iM-Low Turnover Composite Timer Combo: The model’s out of sample performance YTD is -10.0%, and for the last 12 months is -10.0%. Over the same period the benchmark SPY performance was -4.6% and -4.6% respectively. Over the previous week the market value of the iM-Low Turnover Composite Timer Combo gained 4.00% at a time when SPY gained 6.65%. A starting capital of $100,000 at inception on 3/24/27 would have grown to $96,348 which includes -$391 cash and excludes $280 spent on fees and slippage. |
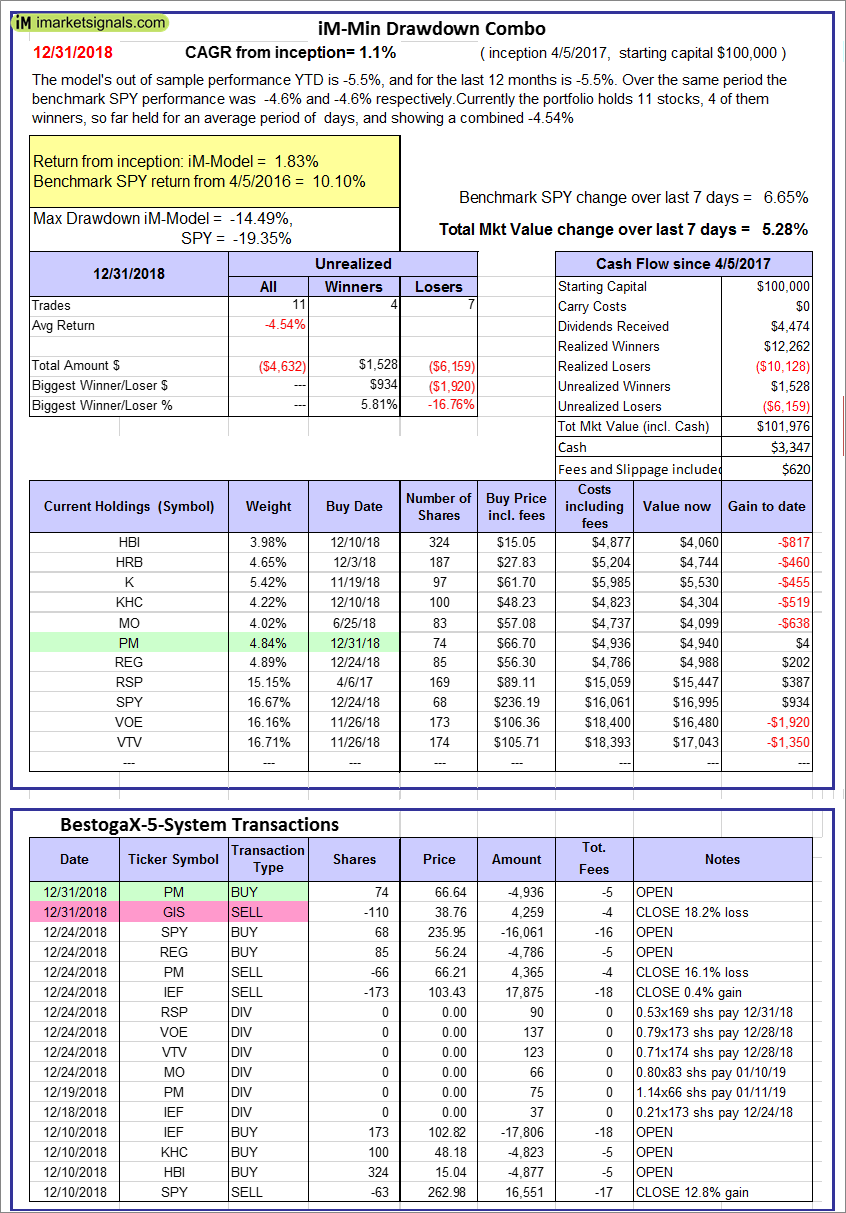 |
iM-Min Drawdown Combo: The model’s out of sample performance YTD is -5.5%, and for the last 12 months is -5.5%. Over the same period the benchmark SPY performance was -4.6% and -4.6% respectively. Over the previous week the market value of the iM-Min Drawdown Combo gained 5.28% at a time when SPY gained 6.65%. A starting capital of $100,000 at inception on 4/5/2017 would have grown to $101,976 which includes $3,347 cash and excludes $620 spent on fees and slippage. |
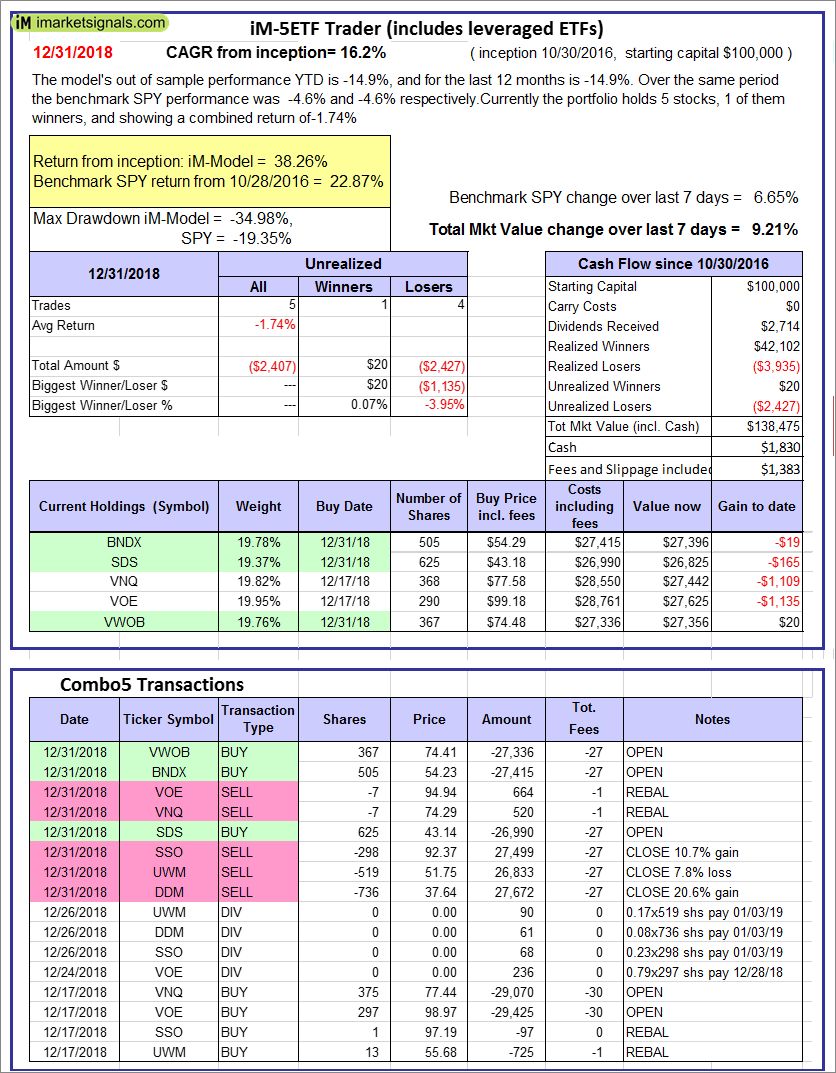 |
iM-5ETF Trader (includes leveraged ETFs): The model’s out of sample performance YTD is -14.9%, and for the last 12 months is -14.9%. Over the same period the benchmark SPY performance was -4.6% and -4.6% respectively. Over the previous week the market value of the iM-5ETF Trader (includes leveraged ETFs) gained 9.21% at a time when SPY gained 6.65%. A starting capital of $100,000 at inception on 10/30/2016 would have grown to $138,475 which includes $1,830 cash and excludes $1,383 spent on fees and slippage. |
 |
iM-Standard 5ETF Trader (excludes leveraged ETFs): The model’s out of sample performance YTD is -6.6%, and for the last 12 months is -6.6%. Over the same period the benchmark SPY performance was -4.6% and -4.6% respectively. Over the previous week the market value of the iM-Standard 5ETF Trader (excludes leveraged ETFs) gained 5.45% at a time when SPY gained 6.65%. A starting capital of $100,000 at inception on 10/30/2016 would have grown to $117,282 which includes $951 cash and excludes $1,315 spent on fees and slippage. |
iM-Best Reports – 12/31/2018
Posted in pmp SPY-SH
Leave a Reply
You must be logged in to post a comment.