
  |
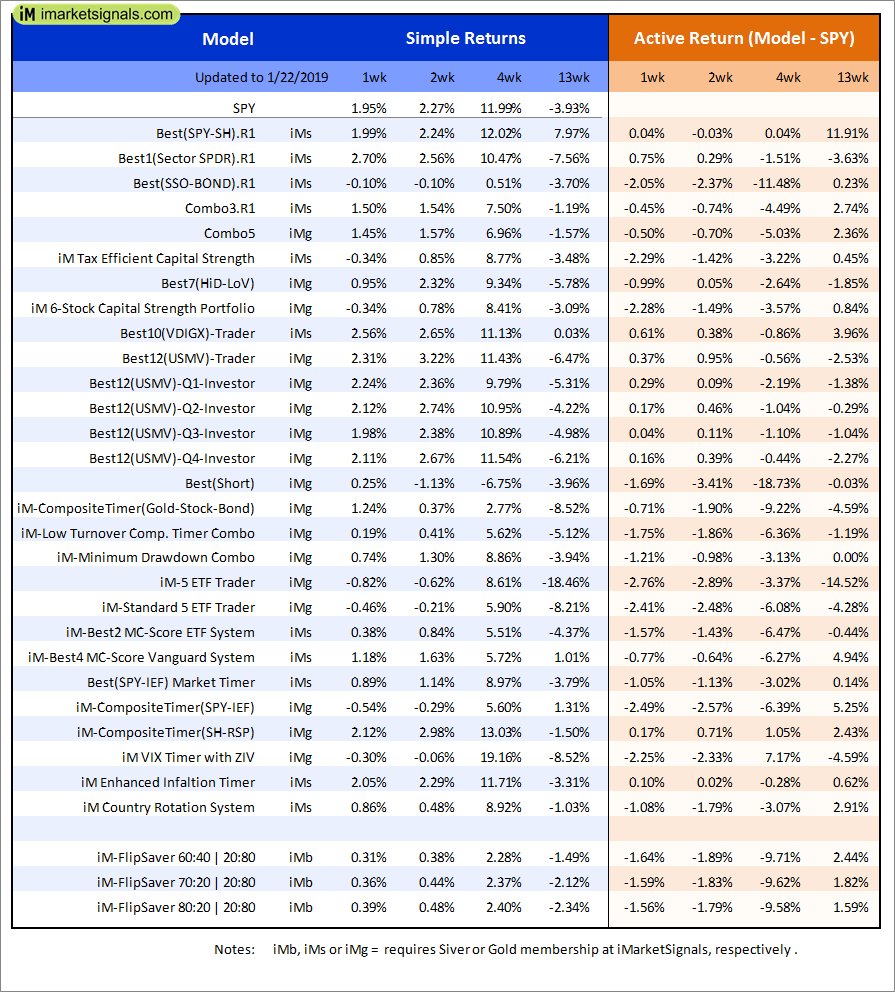
Out of sample performance summary of our models for the past 1, 2, 4 and 13 week periods. The active active return indicates how the models over- or underperformed the benchmark ETF SPY. Also the YTD, and the 1-, 3-, 5- and 10-year annualized returns are shown in the second table |
 |
iM-FlipSaver 60:40 | 20:80 – 2017: The model’s out of sample performance YTD is 0.9%, and for the last 12 months is -3.1%. Over the same period the benchmark SPY performance was 3.2% and -1.9% respectively. Over the previous week the market value of iM-FlipSaver 80:20 | 20:80 gained 0.35% at a time when SPY gained 1.29%. A starting capital of $100,000 at inception on 7/16/2015 would have grown to $112,975 which includes $412 cash and excludes $497 spent on fees and slippage. |
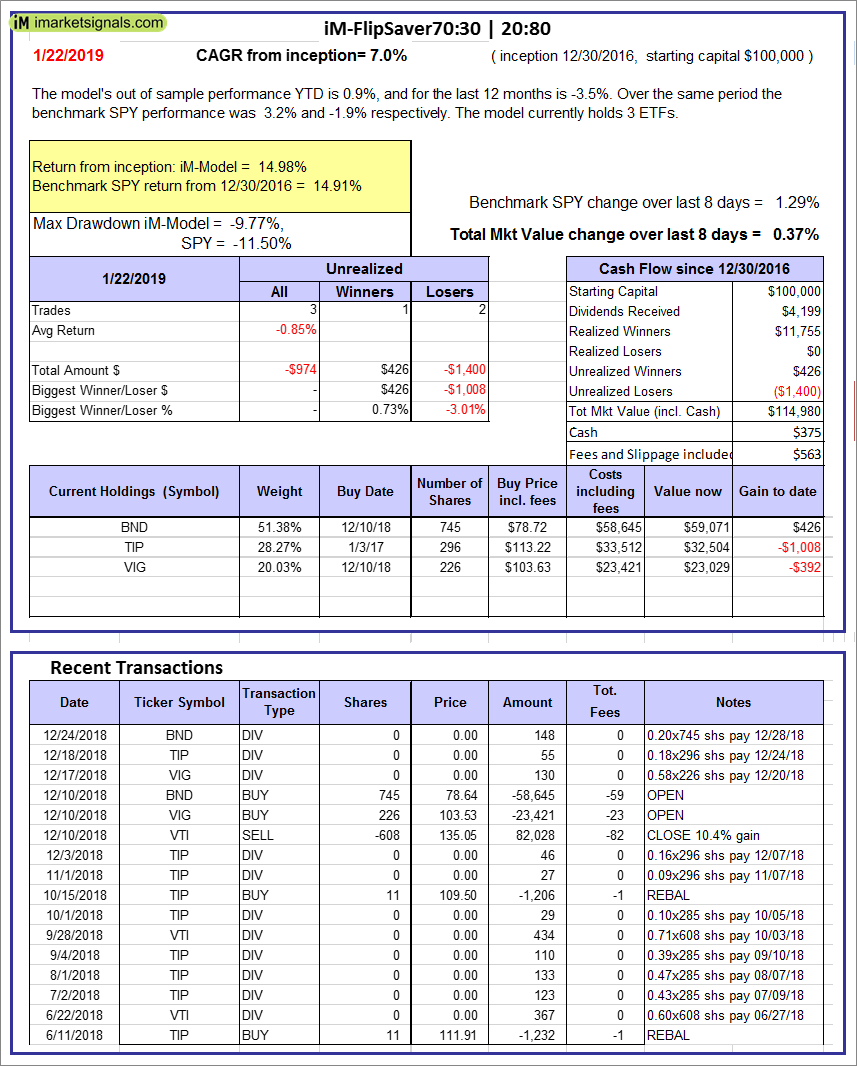 |
iM-FlipSaver 70:30 | 20:80 – 2017: The model’s out of sample performance YTD is 0.9%, and for the last 12 months is -3.5%. Over the same period the benchmark SPY performance was 3.2% and -1.9% respectively. Over the previous week the market value of iM-FlipSaver 70:30 | 20:80 gained 0.37% at a time when SPY gained 1.29%. A starting capital of $100,000 at inception on 7/15/2015 would have grown to $114,980 which includes $375 cash and excludes $563 spent on fees and slippage. |
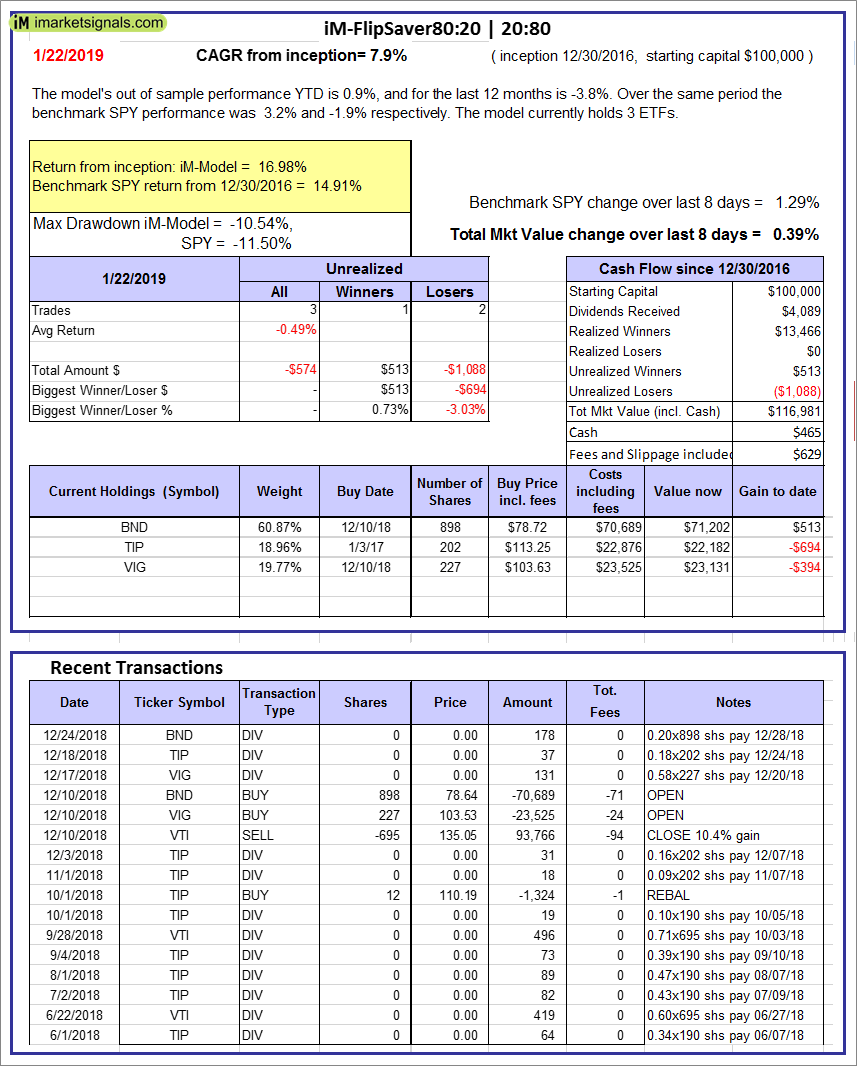 |
iM-FlipSaver 80:20 | 20:80 – 2017: The model’s out of sample performance YTD is 0.9%, and for the last 12 months is -3.8%. Over the same period the benchmark SPY performance was 3.2% and -1.9% respectively. Over the previous week the market value of iM-FlipSaver 80:20 | 20:80 gained 0.39% at a time when SPY gained 1.29%. A starting capital of $100,000 at inception on 1/2/2017 would have grown to $116,981 which includes $465 cash and excludes $629 spent on fees and slippage. |
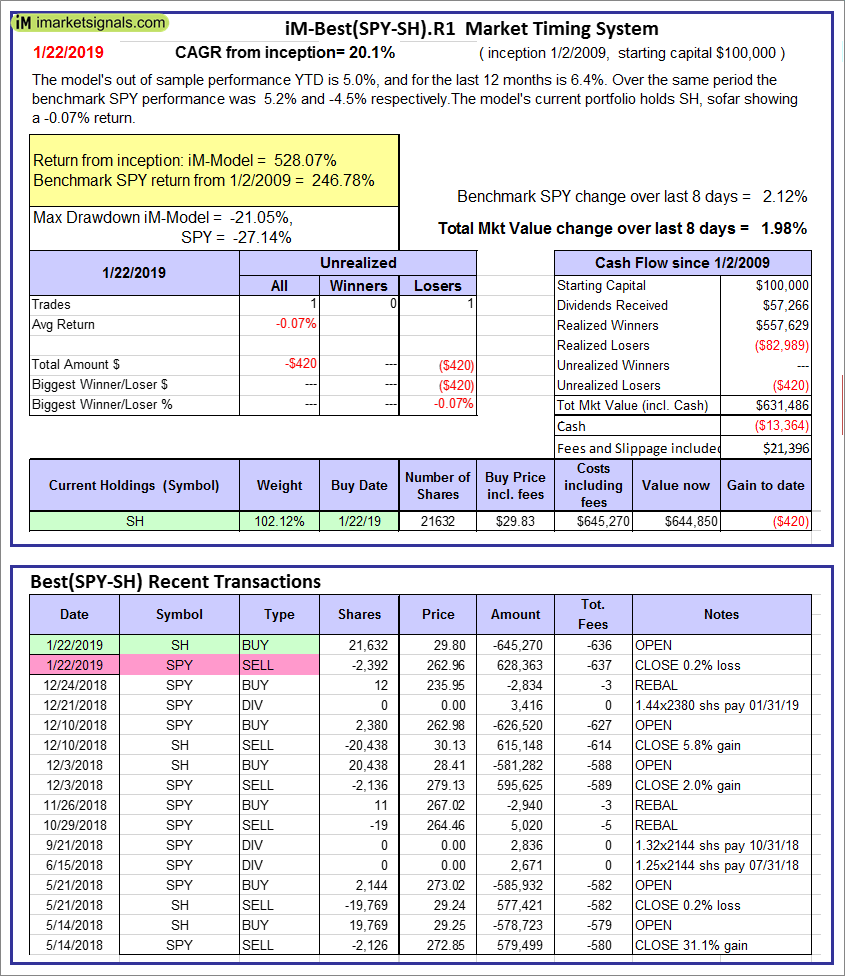 |
iM-Best(SPY-SH).R1: The model’s out of sample performance YTD is 5.0%, and for the last 12 months is 6.4%. Over the same period the benchmark SPY performance was 5.2% and -4.5% respectively. Over the previous week the market value of Best(SPY-SH) gained 1.98% at a time when SPY gained 2.12%. A starting capital of $100,000 at inception on 1/2/2009 would have grown to $631,486 which includes -$13,364 cash and excludes $21,396 spent on fees and slippage. |
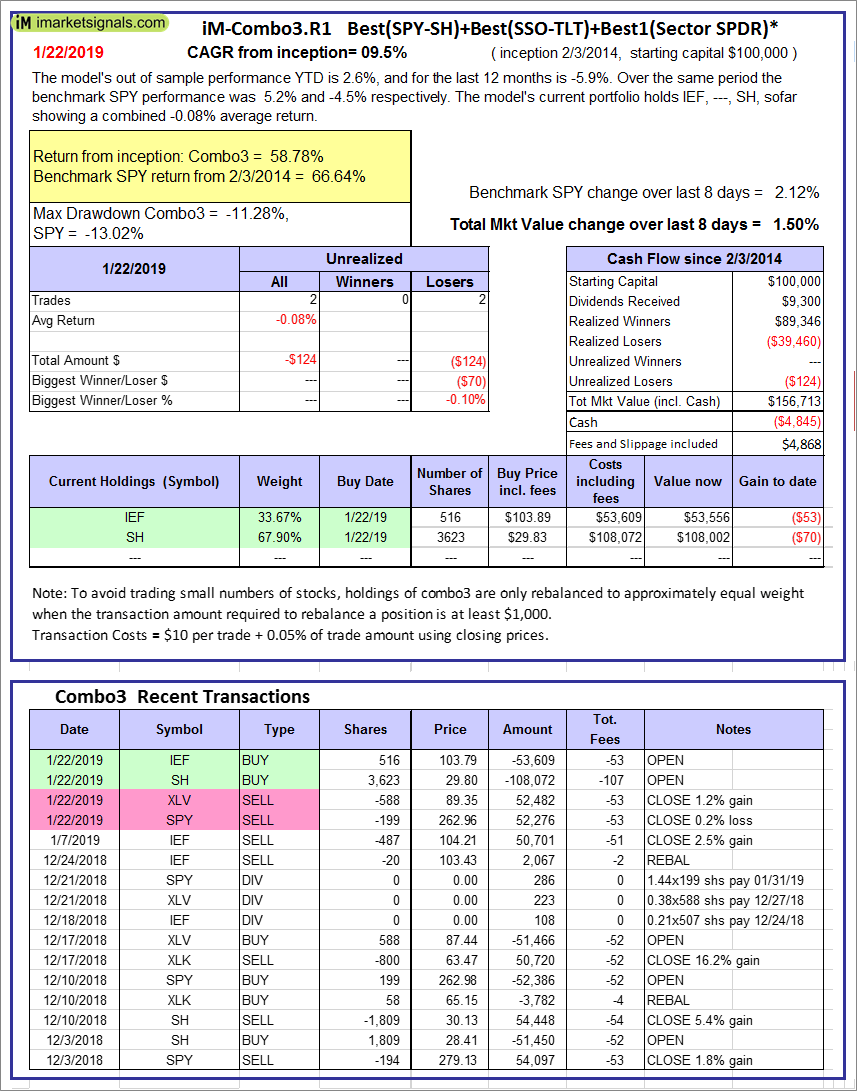 |
iM-Combo3.R1: The model’s out of sample performance YTD is 2.6%, and for the last 12 months is -5.9%. Over the same period the benchmark SPY performance was 5.2% and -4.5% respectively. Over the previous week the market value of iM-Combo3.R1 gained 1.50% at a time when SPY gained 2.12%. A starting capital of $100,000 at inception on 2/3/2014 would have grown to $156,713 which includes -$4,845 cash and excludes $4,868 spent on fees and slippage. |
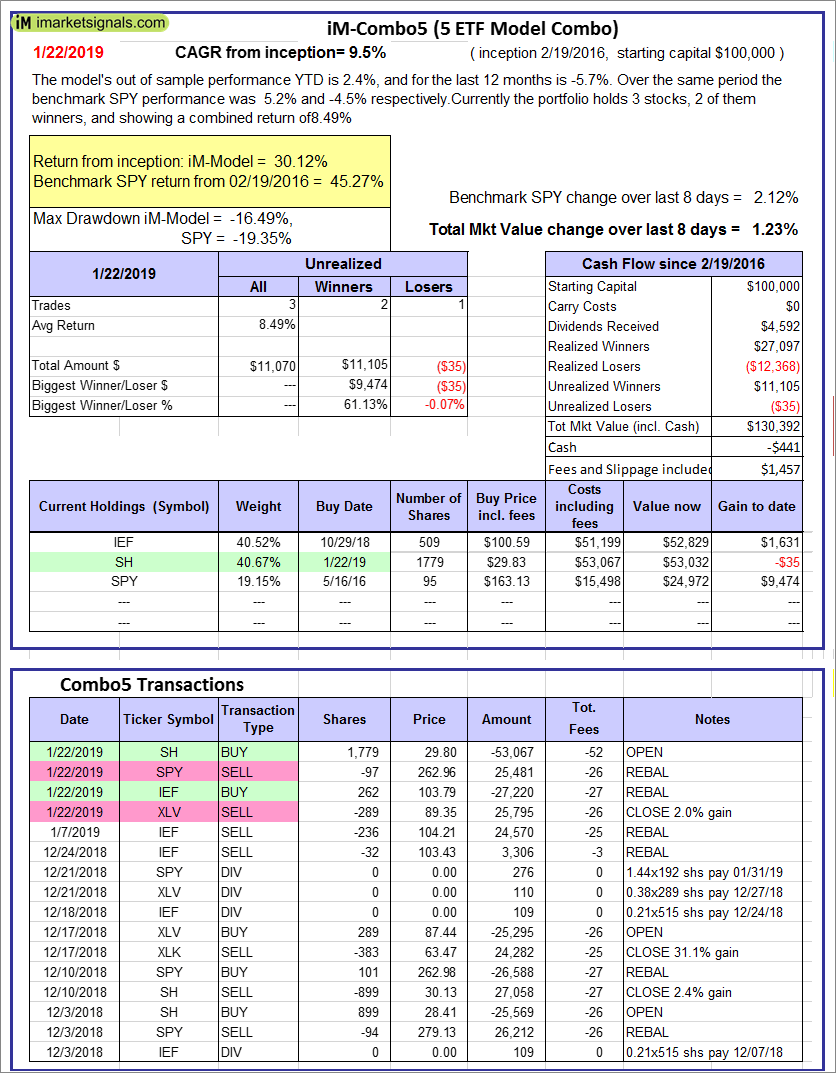 |
iM-Combo5: The model’s out of sample performance YTD is 2.4%, and for the last 12 months is -5.7%. Over the same period the benchmark SPY performance was 5.2% and -4.5% respectively. Over the previous week the market value of iM-Combo5 gained 1.23% at a time when SPY gained 2.12%. A starting capital of $100,000 at inception on 2/22/2016 would have grown to $130,392 which includes -$441 cash and excludes $1,457 spent on fees and slippage. |
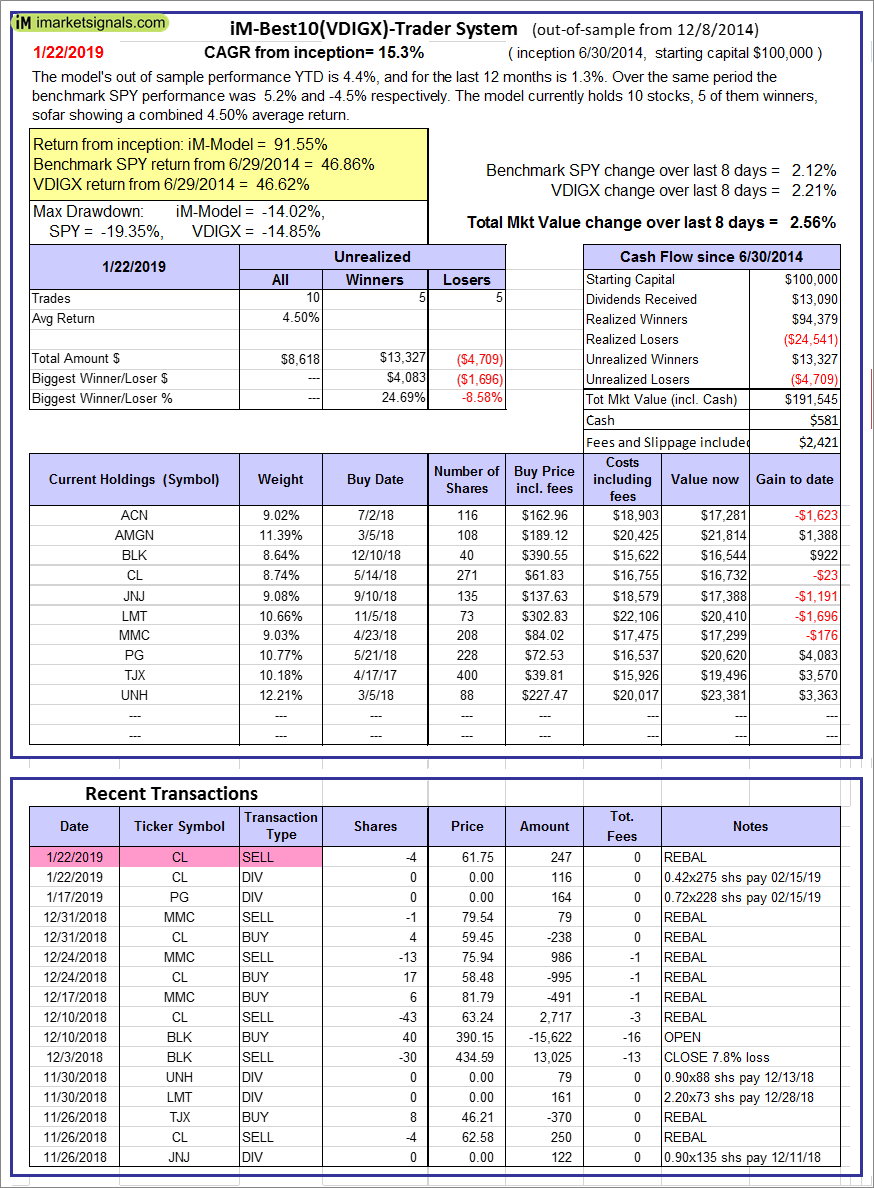 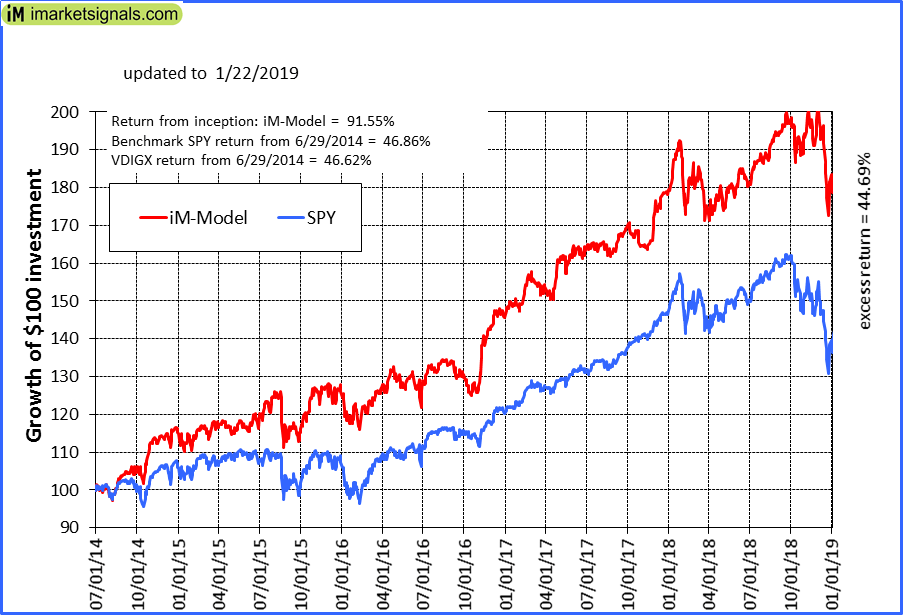 |
iM-Best10(VDIGX)-Trader: The model’s out of sample performance YTD is 4.4%, and for the last 12 months is 1.3%. Over the same period the benchmark SPY performance was 5.2% and -4.5% respectively. Since inception, on 7/1/2014, the model gained 91.55% while the benchmark SPY gained 46.86% and VDIGX gained 46.62% over the same period. Over the previous week the market value of iM-Best10(VDIGX) gained 2.56% at a time when SPY gained 2.12%. A starting capital of $100,000 at inception on 7/1/2014 would have grown to $191,545 which includes $581 cash and excludes $2,421 spent on fees and slippage. |
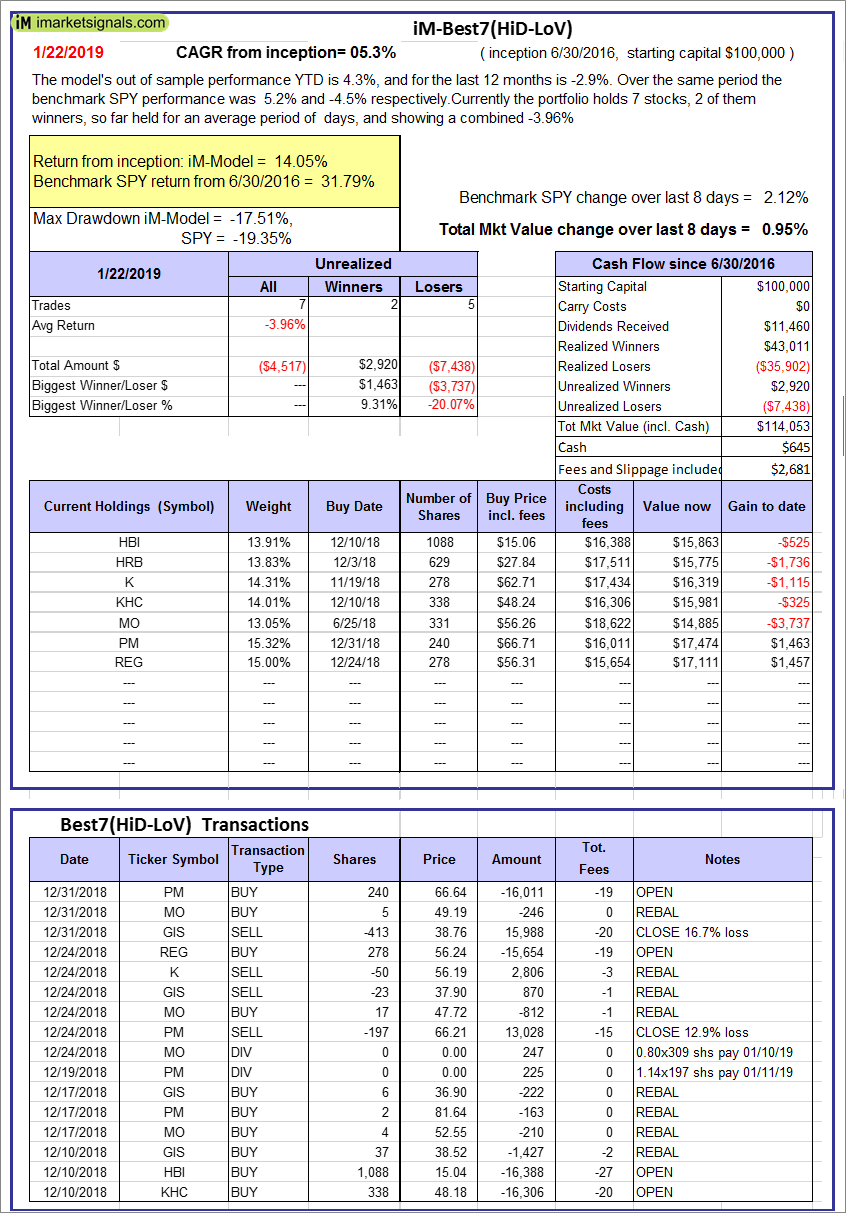 |
iM-Best7(HiD-LoV): The model’s out of sample performance YTD is 4.3%, and for the last 12 months is -2.9%. Over the same period the benchmark SPY performance was 5.2% and -4.5% respectively. Over the previous week the market value of iM-BESTOGA-3 gained 0.95% at a time when SPY gained 2.12%. A starting capital of $100,000 at inception on 6/30/2016 would have grown to $114,053 which includes $645 cash and excludes $2,681 spent on fees and slippage. |
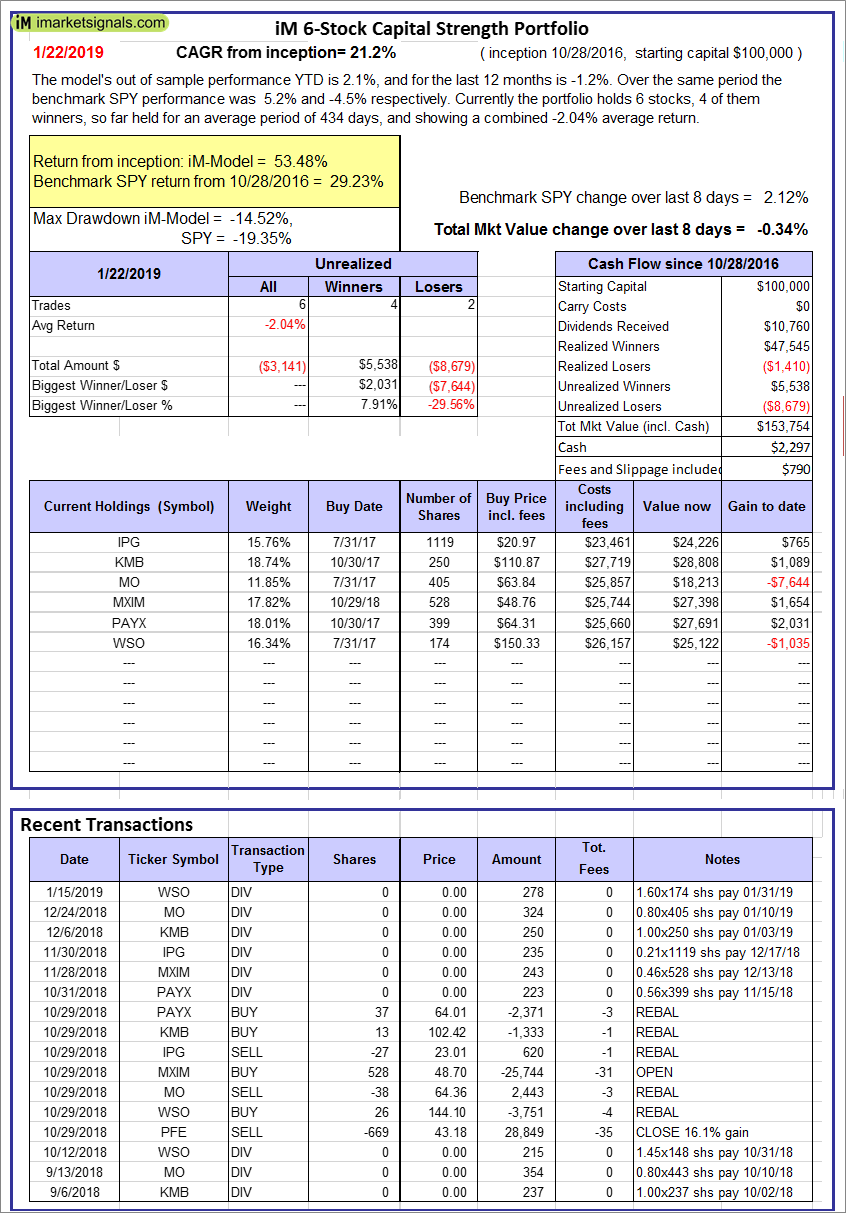 |
iM 6-Stock Capital Strength Portfolio: The model’s out of sample performance YTD is 2.1%, and for the last 12 months is -1.2%. Over the same period the benchmark SPY performance was 5.2% and -4.5% respectively. Over the previous week the market value of the iM 6-Stock Capital Strength Portfolio gained -0.34% at a time when SPY gained 2.12%. A starting capital of $100,000 at inception on 10/28/2016 would have grown to $153,754 which includes $2,297 cash and excludes $790 spent on fees and slippage. |
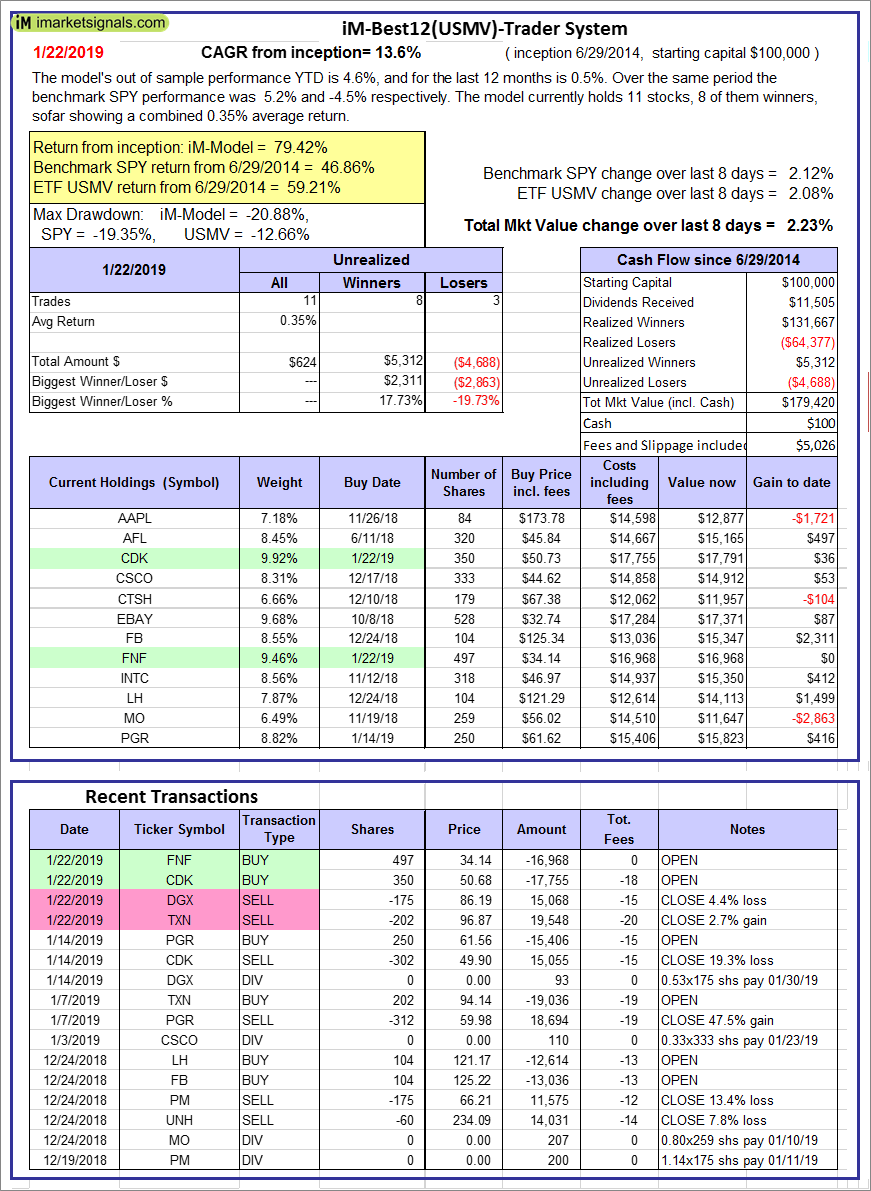 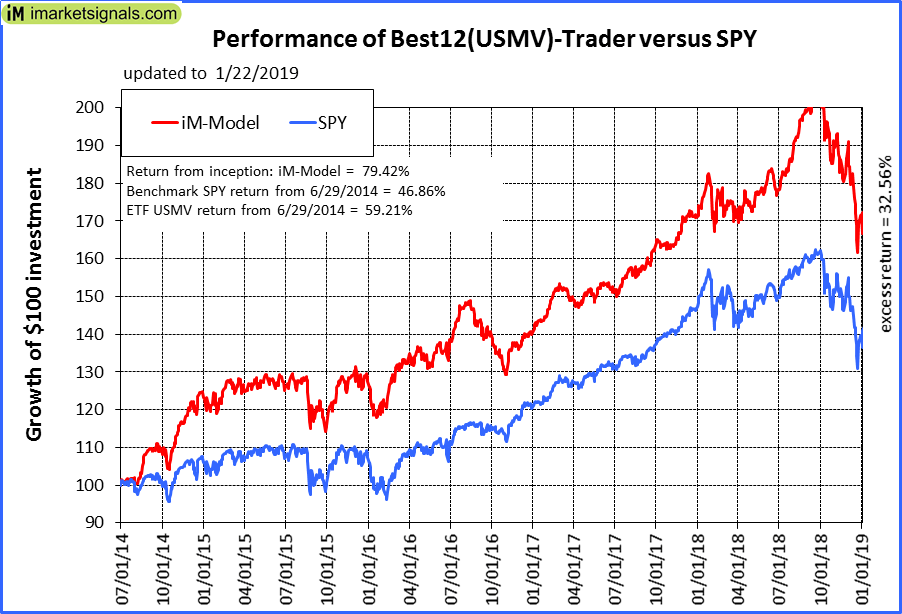 |
iM-Best12(USMV)-Trader: The model’s out of sample performance YTD is 4.6%, and for the last 12 months is 0.5%. Over the same period the benchmark SPY performance was 5.2% and -4.5% respectively. Since inception, on 6/30/2014, the model gained 79.42% while the benchmark SPY gained 46.86% and the ETF USMV gained 59.21% over the same period. Over the previous week the market value of iM-Best12(USMV)-Trader gained 2.23% at a time when SPY gained 2.12%. A starting capital of $100,000 at inception on 6/30/2014 would have grown to $179,420 which includes $100 cash and excludes $5,026 spent on fees and slippage. |
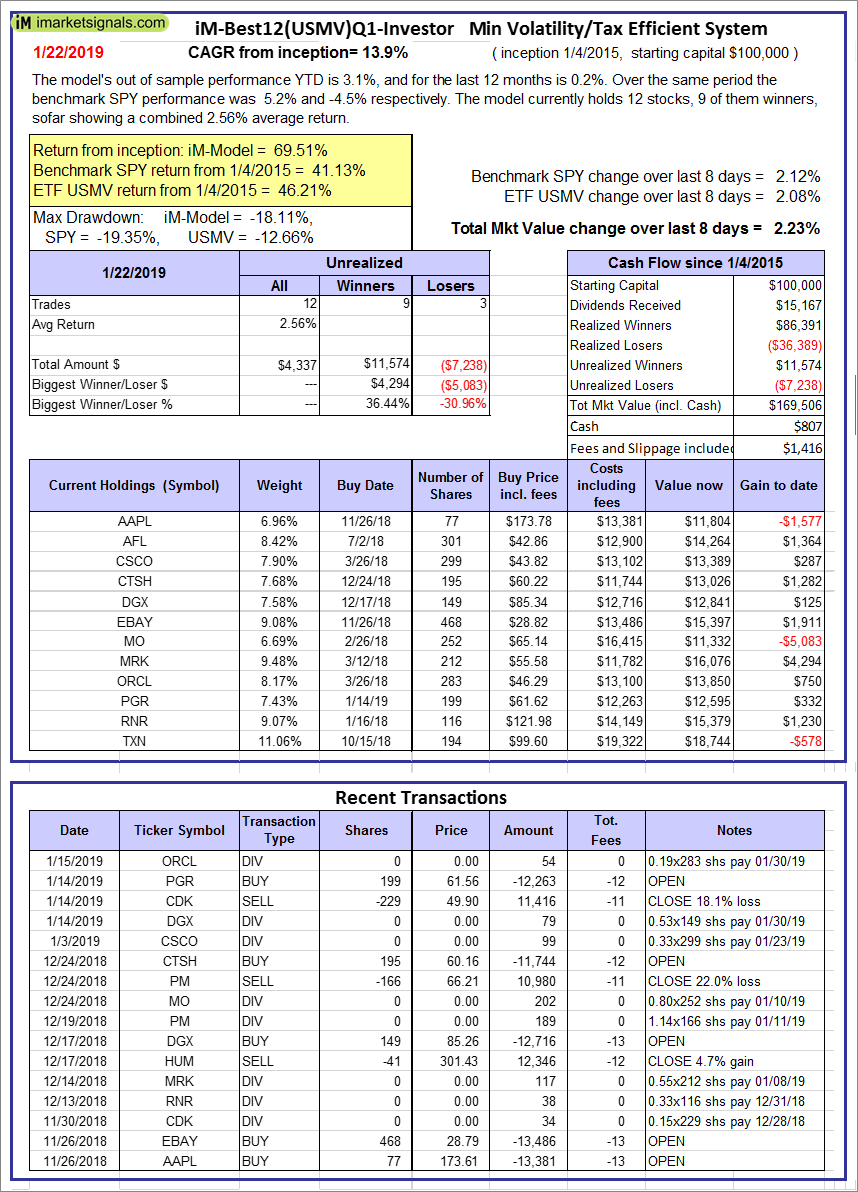  |
iM-Best12(USMV)Q1-Investor: The model’s out of sample performance YTD is 3.1%, and for the last 12 months is 0.2%. Over the same period the benchmark SPY performance was 5.2% and -4.5% respectively. Since inception, on 1/5/2015, the model gained 69.51% while the benchmark SPY gained 41.13% and the ETF USMV gained 46.21% over the same period. Over the previous week the market value of iM-Best12(USMV)Q1 gained 2.23% at a time when SPY gained 2.12%. A starting capital of $100,000 at inception on 1/5/2015 would have grown to $169,506 which includes $807 cash and excludes $1,416 spent on fees and slippage. |
 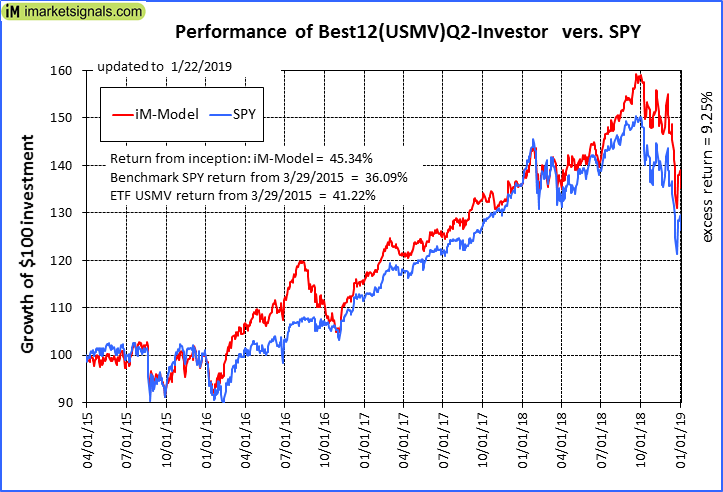 |
iM-Best12(USMV)Q2-Investor: The model’s out of sample performance YTD is 4.6%, and for the last 12 months is 2.9%. Over the same period the benchmark SPY performance was 5.2% and -4.5% respectively. Since inception, on 3/30/2015, the model gained 45.34% while the benchmark SPY gained 36.09% and the ETF USMV gained 41.22% over the same period. Over the previous week the market value of iM-Best12(USMV)Q2 gained 2.12% at a time when SPY gained 2.12%. A starting capital of $100,000 at inception on 3/30/2015 would have grown to $145,344 which includes $6,900 cash and excludes $1,288 spent on fees and slippage. |
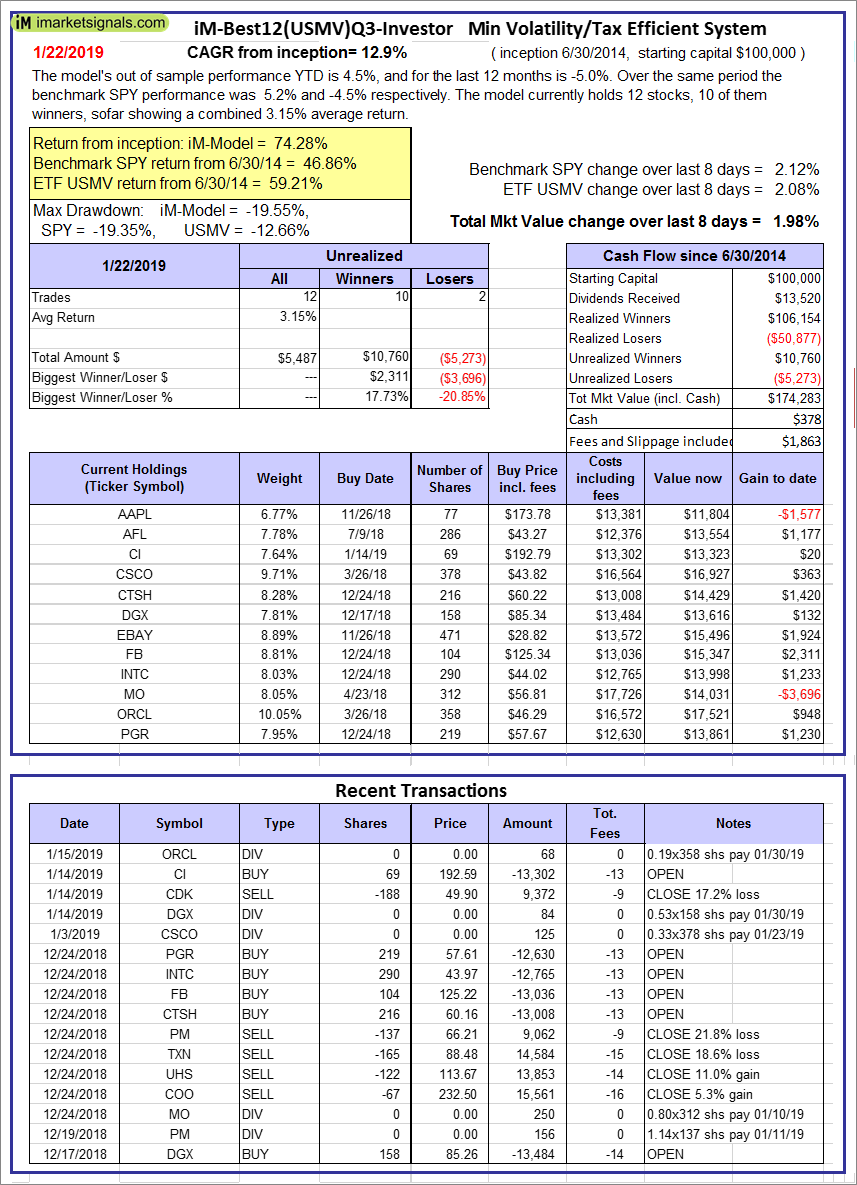 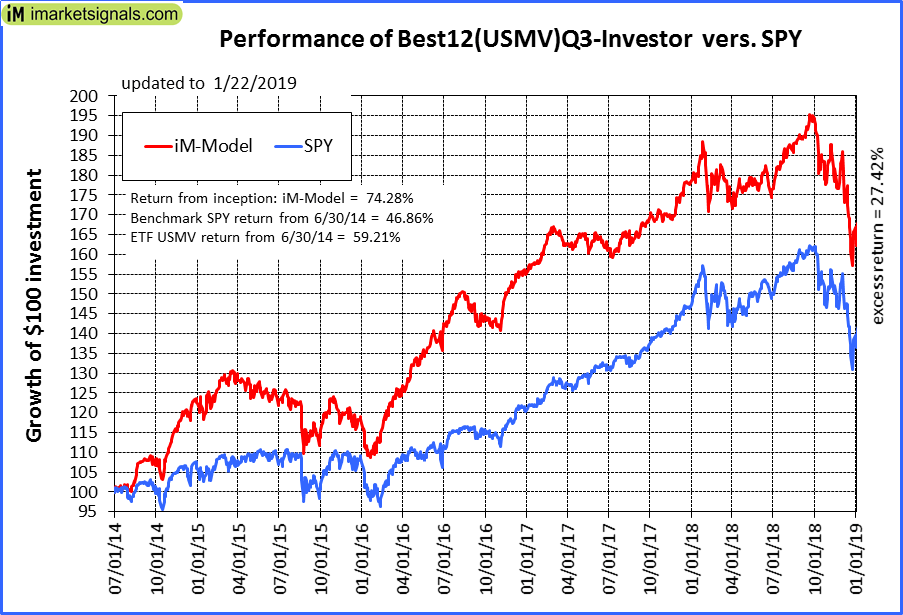 |
iM-Best12(USMV)Q3-Investor: The model’s out of sample performance YTD is 4.5%, and for the last 12 months is -5.0%. Over the same period the benchmark SPY performance was 5.2% and -4.5% respectively. Since inception, on 7/1/2014, the model gained 74.28% while the benchmark SPY gained 46.86% and the ETF USMV gained 59.21% over the same period. Over the previous week the market value of iM-Best12(USMV)Q3 gained 1.98% at a time when SPY gained 2.12%. A starting capital of $100,000 at inception on 7/1/2014 would have grown to $174,283 which includes $378 cash and excludes $1,863 spent on fees and slippage. |
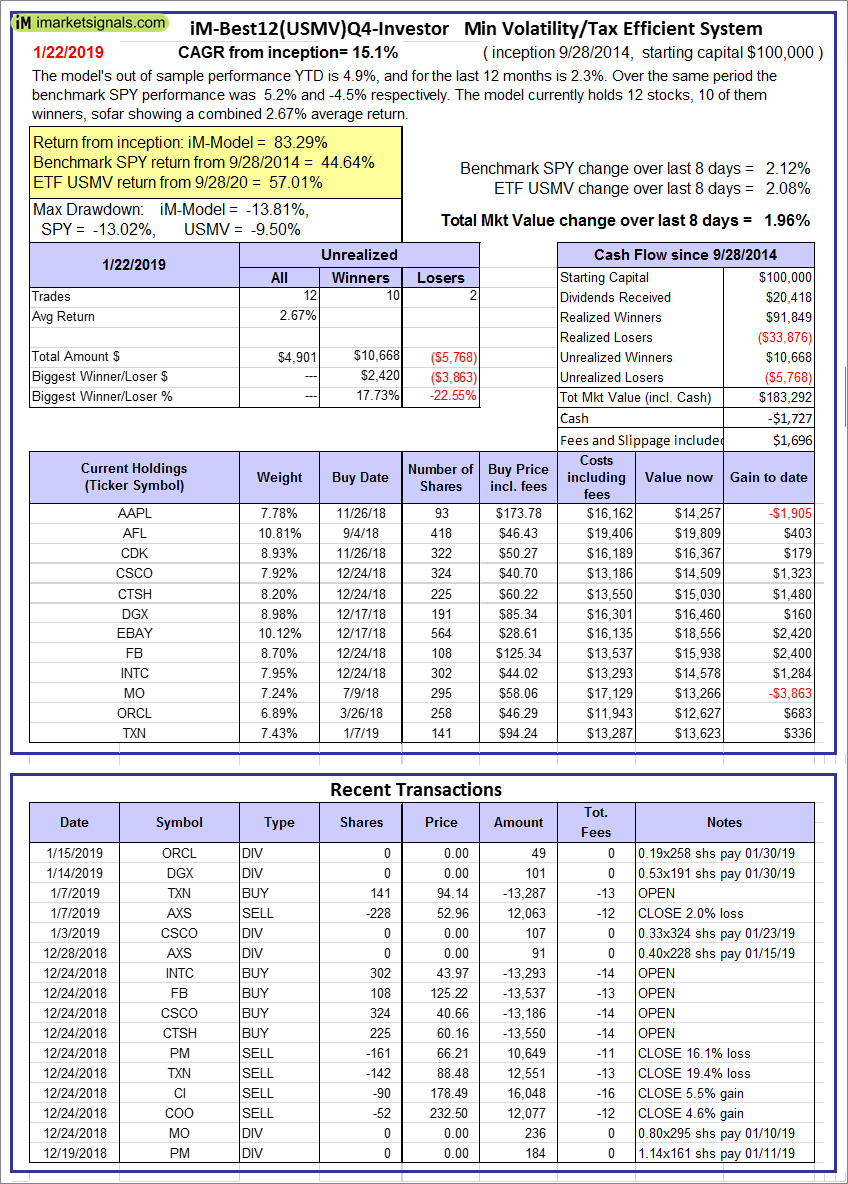 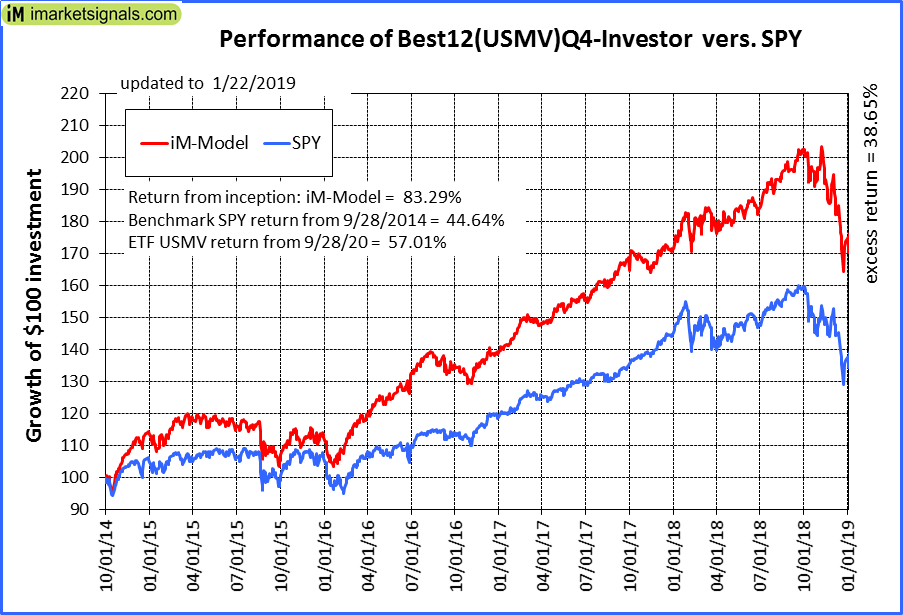 |
iM-Best12(USMV)Q4-Investor: Since inception, on 9/29/2014, the model gained 83.29% while the benchmark SPY gained 44.64% and the ETF USMV gained 57.01% over the same period. Over the previous week the market value of iM-Best12(USMV)Q4 gained 1.96% at a time when SPY gained 2.12%. A starting capital of $100,000 at inception on 9/29/2014 would have grown to $183,292 which includes -$1,727 cash and excludes $1,696 spent on fees and slippage. |
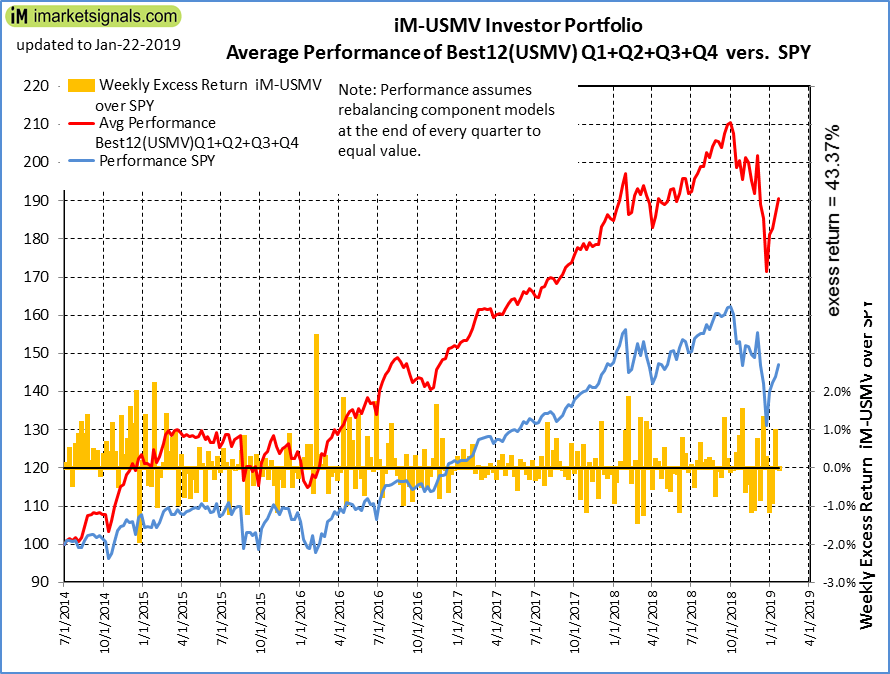 |
Average Performance of iM-Best12(USMV)Q1+Q2+Q3+Q4-Investor resulted in an excess return of 43.37% over SPY. (see iM-USMV Investor Portfolio) |
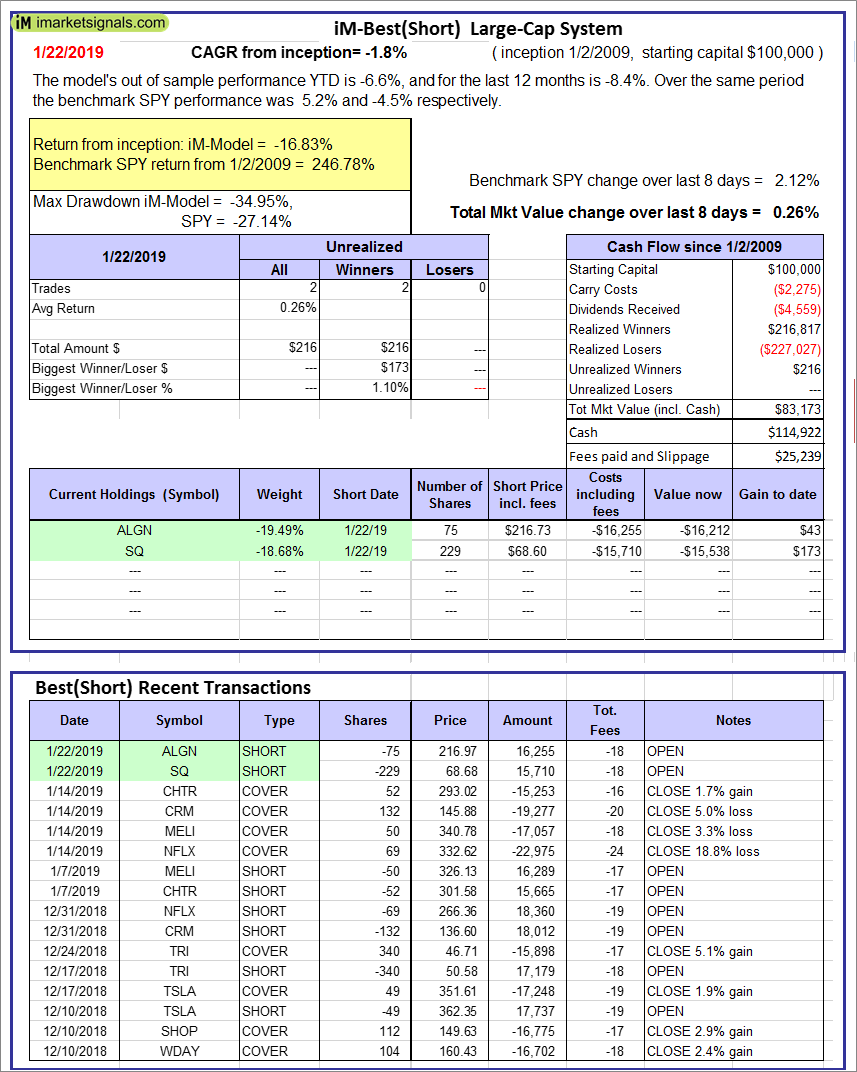 |
iM-Best(Short): The model’s out of sample performance YTD is -6.6%, and for the last 12 months is -8.4%. Over the same period the benchmark SPY performance was 5.2% and -4.5% respectively. Over the previous week the market value of iM-Best(Short) gained 0.26% at a time when SPY gained 2.12%. Over the period 1/2/2009 to 1/22/2019 the starting capital of $100,000 would have grown to $83,173 which includes $114,922 cash and excludes $25,239 spent on fees and slippage. |
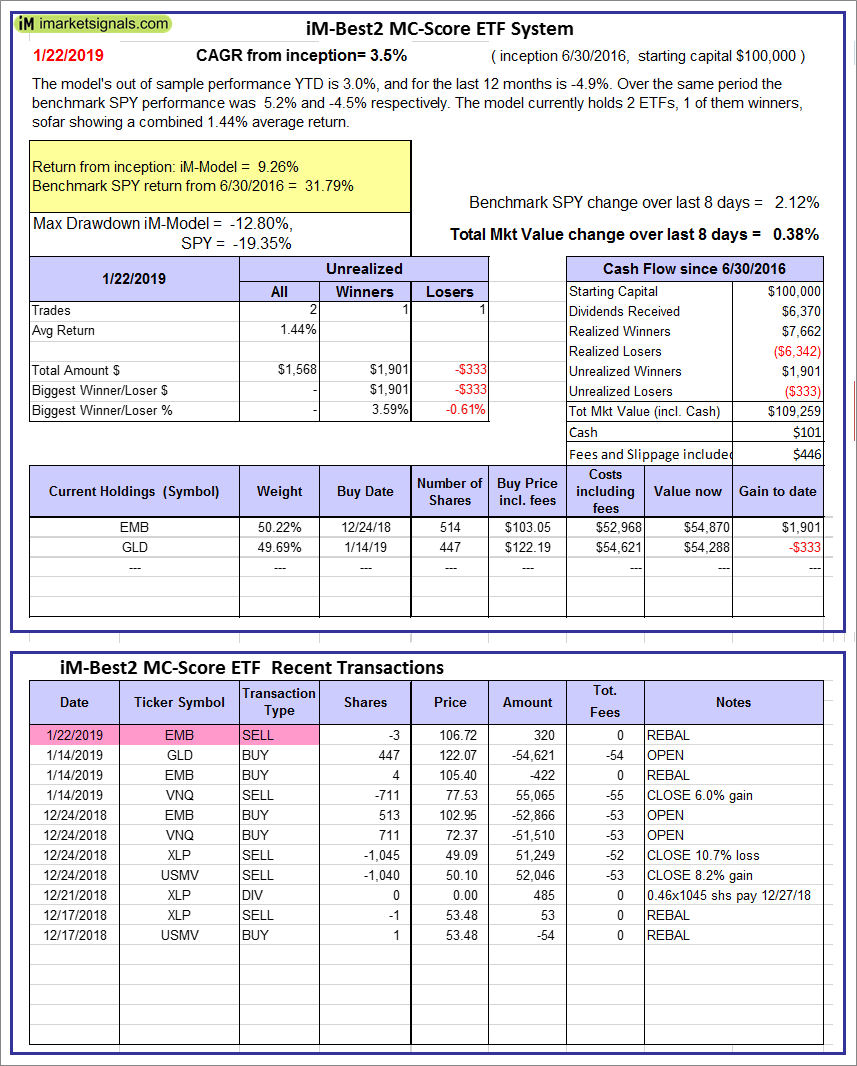 |
iM-Best2 MC-Score ETF System: The model’s out of sample performance YTD is 3.0%, and for the last 12 months is -4.9%. Over the same period the benchmark SPY performance was 5.2% and -4.5% respectively. Over the previous week the market value of the iM-Best2 MC-Score ETF System gained 0.38% at a time when SPY gained 2.12%. A starting capital of $100,000 at inception on 6/30/2016 would have grown to $109,259 which includes $101 cash and excludes $446 spent on fees and slippage. |
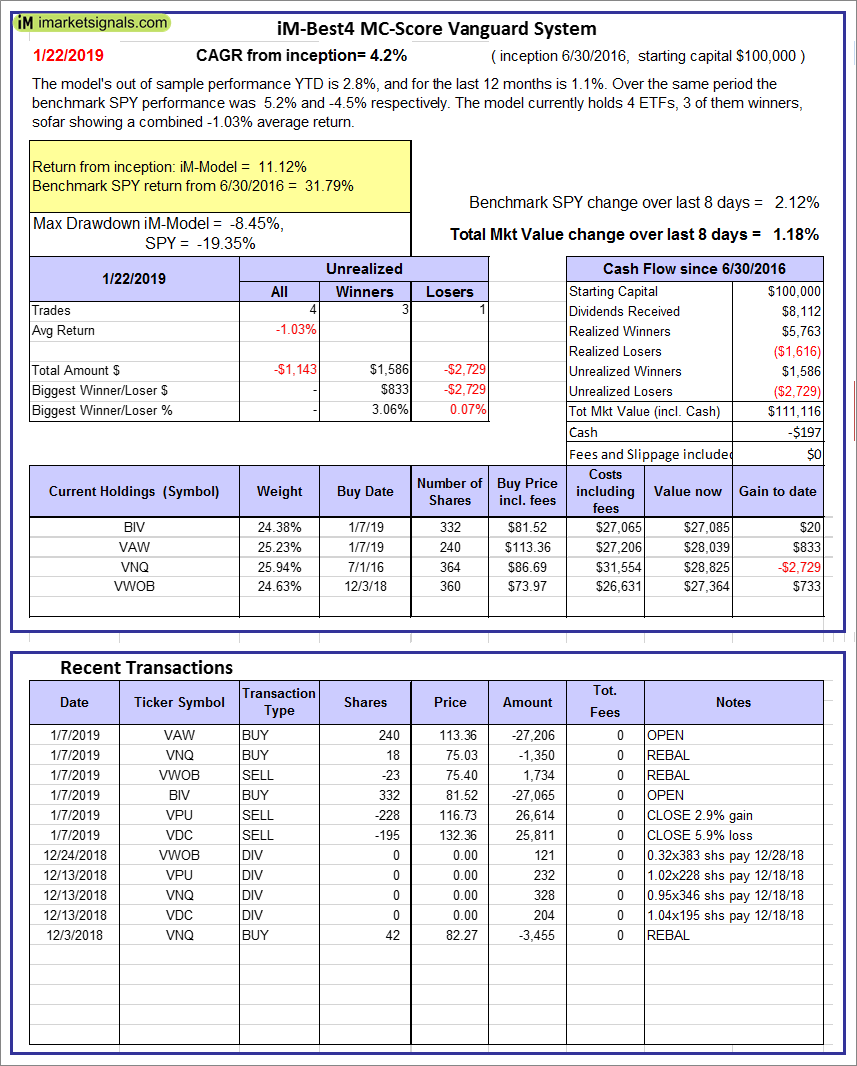 |
iM-Best4 MC-Score Vanguard System: The model’s out of sample performance YTD is 2.8%, and for the last 12 months is 1.1%. Over the same period the benchmark SPY performance was 5.2% and -4.5% respectively. Over the previous week the market value of the iM-Best4 MC-Score Vanguard System gained 1.18% at a time when SPY gained 2.12%. A starting capital of $100,000 at inception on 6/30/2016 would have grown to $111,116 which includes -$197 cash and excludes $00 spent on fees and slippage. |
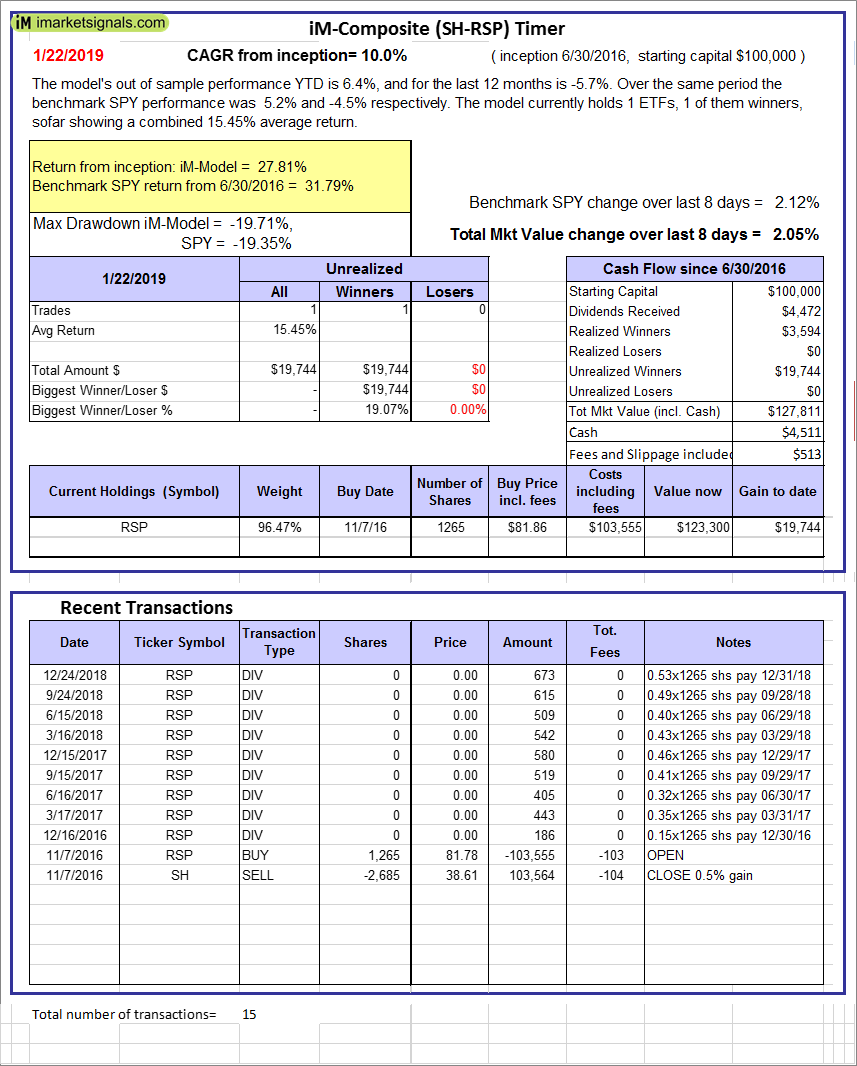 |
iM-Composite (SH-RSP) Timer: The model’s out of sample performance YTD is 6.4%, and for the last 12 months is -5.7%. Over the same period the benchmark SPY performance was 5.2% and -4.5% respectively. Over the previous week the market value of the iM-Composite (SH-RSP) Timer gained 2.05% at a time when SPY gained 2.12%. A starting capital of $100,000 at inception on 6/30/2016 would have grown to $127,811 which includes $4,511 cash and excludes $513 spent on fees and slippage. |
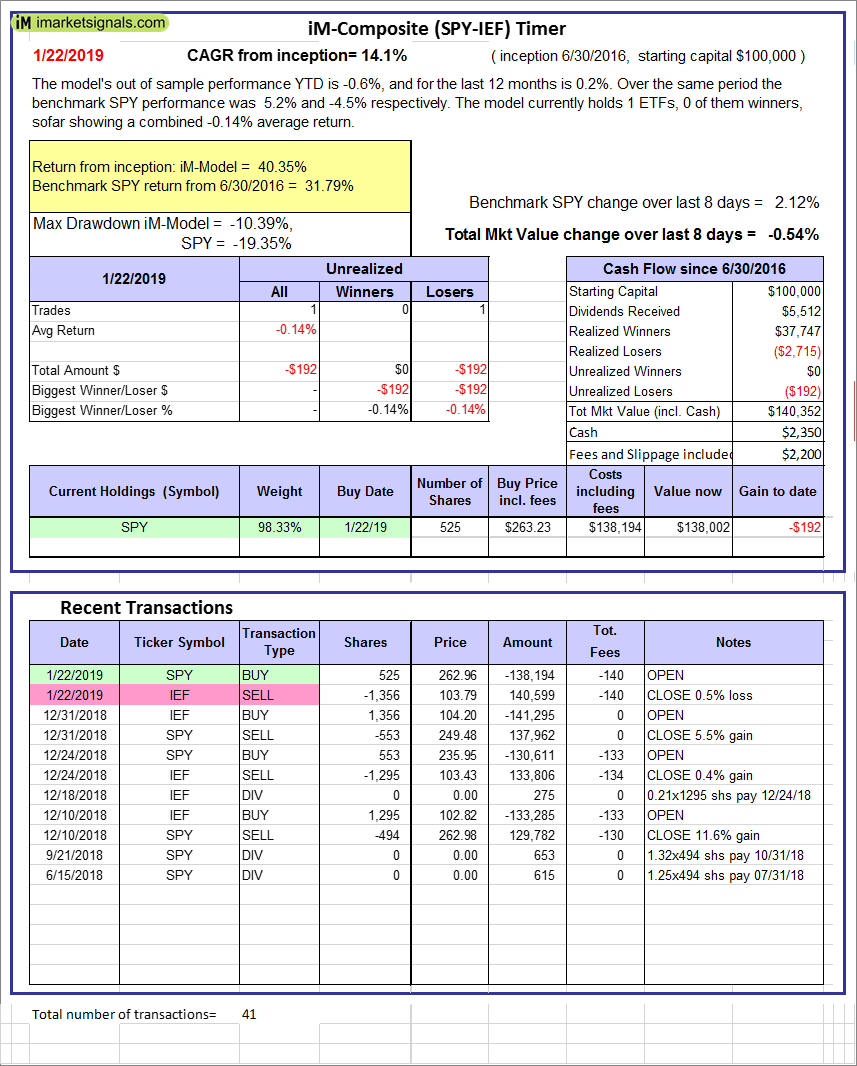 |
iM-Composite (SPY-IEF) Timer: The model’s out of sample performance YTD is -0.6%, and for the last 12 months is 0.2%. Over the same period the benchmark SPY performance was 5.2% and -4.5% respectively. Over the previous week the market value of the iM-Composite (SPY-IEF) Timer gained -0.54% at a time when SPY gained 2.12%. A starting capital of $100,000 at inception on 6/30/2016 would have grown to $140,352 which includes $2,350 cash and excludes $2,200 spent on fees and slippage. |
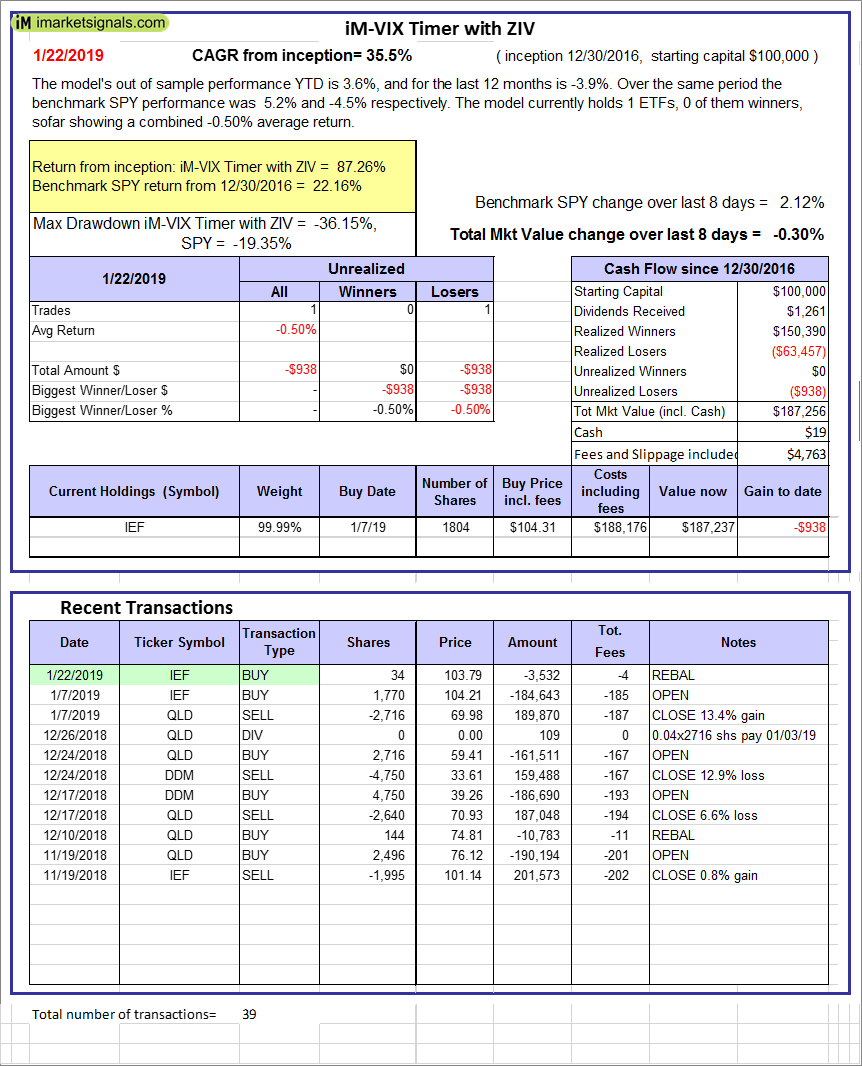 |
iM-VIX Timer with ZIV: The model’s out of sample performance YTD is 3.6%, and for the last 12 months is -3.9%. Over the same period the benchmark SPY performance was 5.2% and -4.5% respectively. Over the previous week the market value of the iM-VIX Timer with ZIV gained -0.30% at a time when SPY gained 2.12%. A starting capital of $100,000 at inception on 6/30/2016 would have grown to $187,256 which includes $19 cash and excludes $4,763 spent on fees and slippage. |
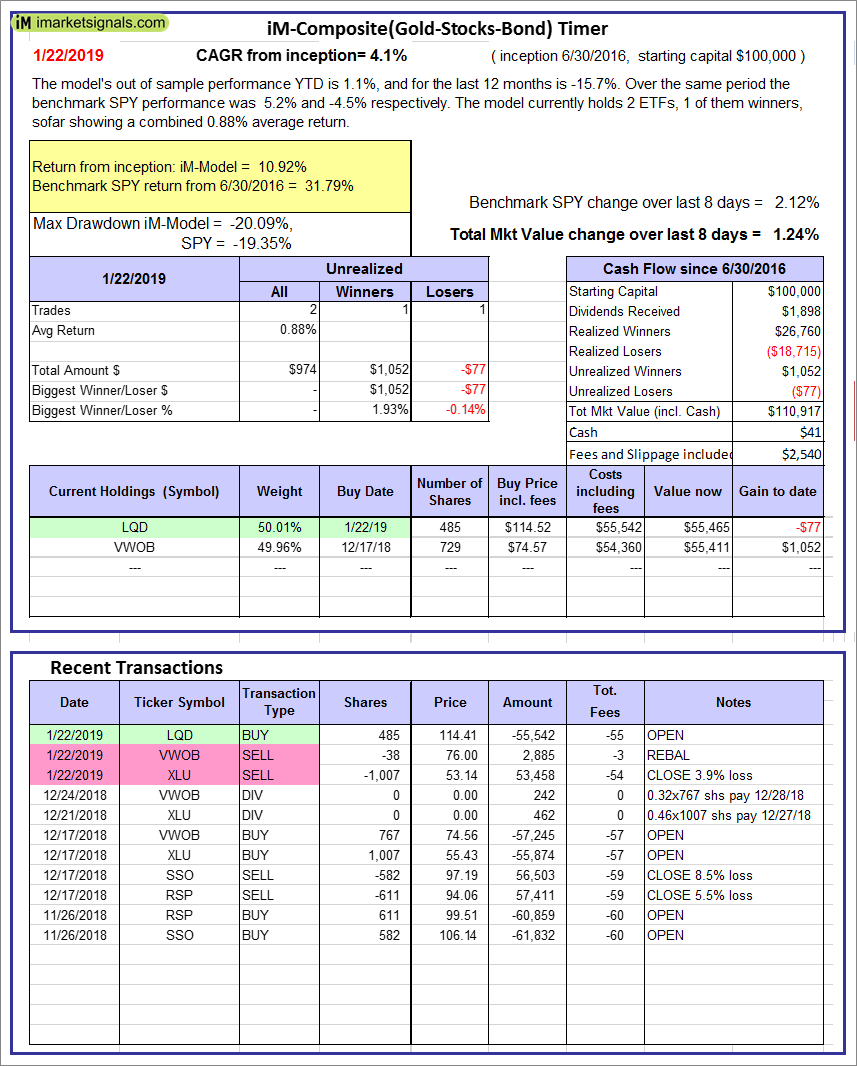 |
iM-Composite(Gold-Stocks-Bond) Timer: The model’s out of sample performance YTD is 1.1%, and for the last 12 months is -15.7%. Over the same period the benchmark SPY performance was 5.2% and -4.5% respectively. Over the previous week the market value of the iM-Composite(Gold-Stocks-Bond) Timer gained 1.24% at a time when SPY gained 2.12%. A starting capital of $100,000 at inception on 6/30/2016 would have grown to $110,917 which includes $41 cash and excludes $2,540 spent on fees and slippage. |
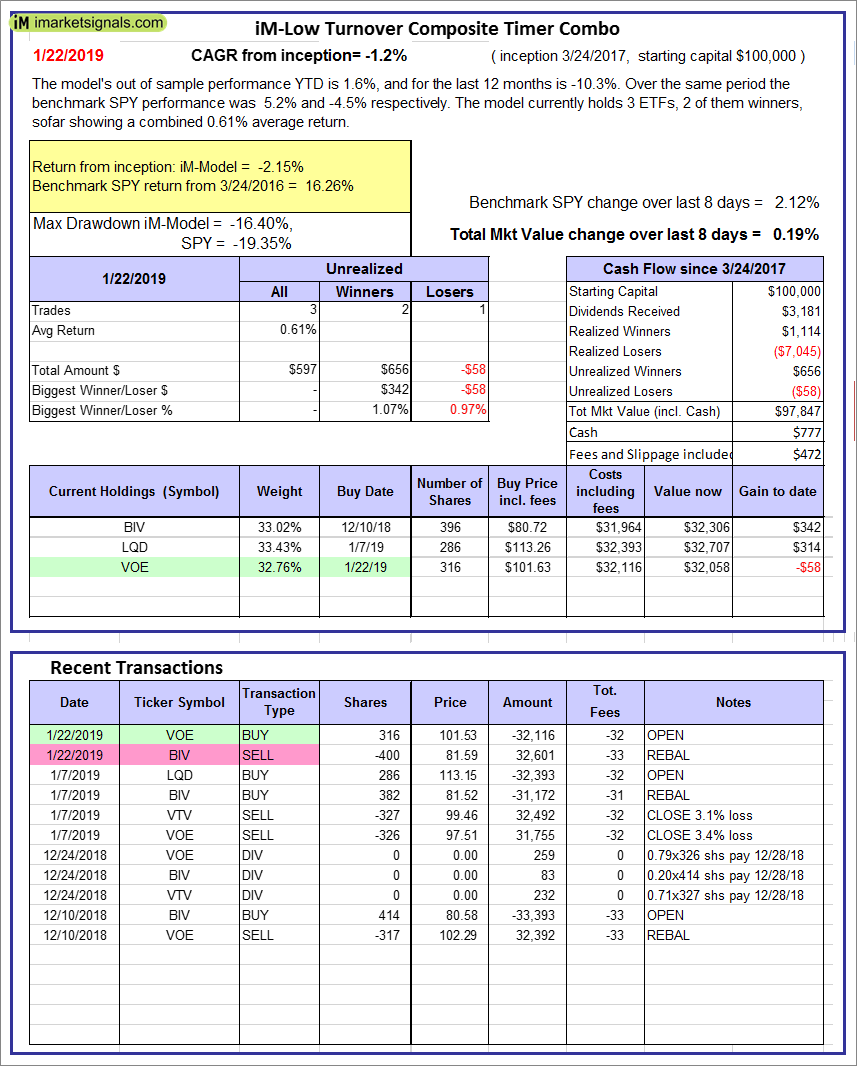 |
iM-Low Turnover Composite Timer Combo: The model’s out of sample performance YTD is 1.6%, and for the last 12 months is -10.3%. Over the same period the benchmark SPY performance was 5.2% and -4.5% respectively. Over the previous week the market value of the iM-Low Turnover Composite Timer Combo gained 0.19% at a time when SPY gained 2.12%. A starting capital of $100,000 at inception on 3/24/27 would have grown to $97,847 which includes $777 cash and excludes $472 spent on fees and slippage. |
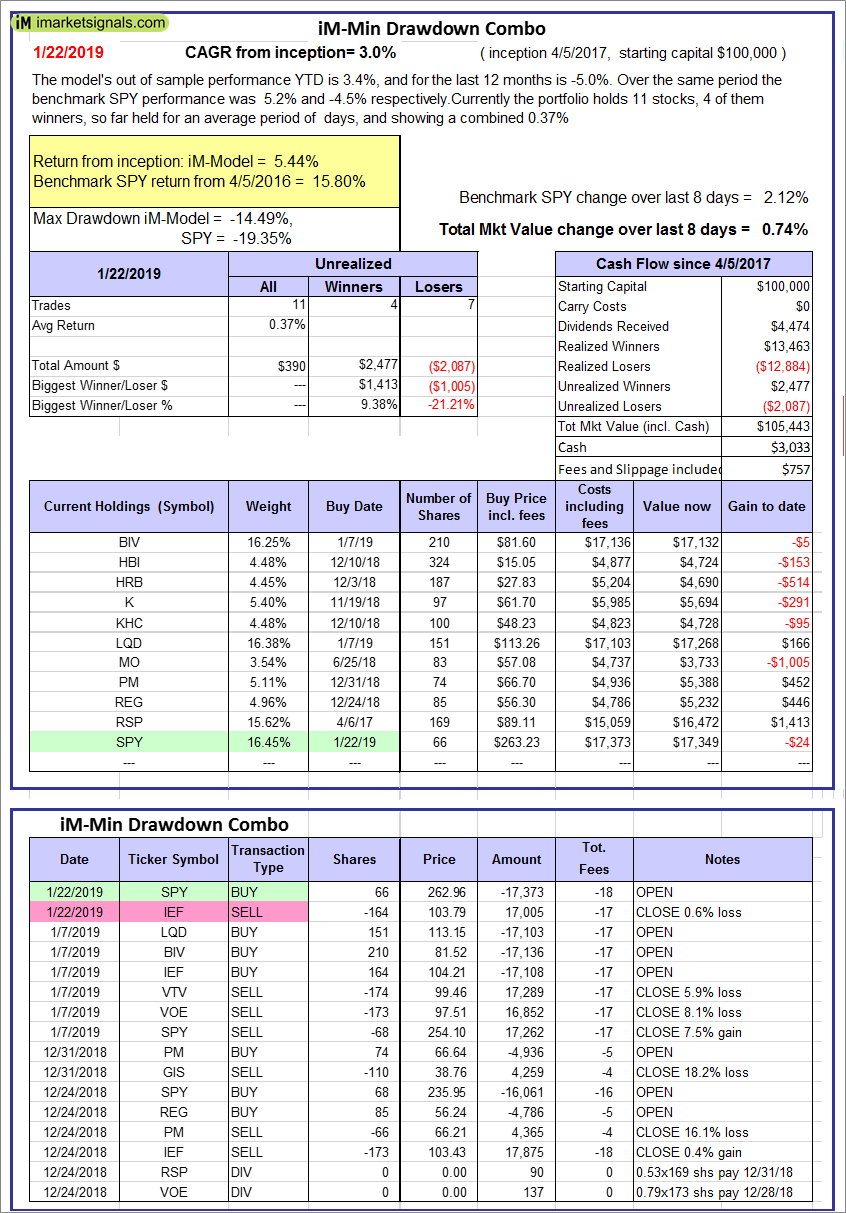 |
iM-Min Drawdown Combo: The model’s out of sample performance YTD is 3.4%, and for the last 12 months is -5.0%. Over the same period the benchmark SPY performance was 5.2% and -4.5% respectively. Over the previous week the market value of the iM-Min Drawdown Combo gained 0.74% at a time when SPY gained 2.12%. A starting capital of $100,000 at inception on 4/5/2017 would have grown to $105,443 which includes $3,033 cash and excludes $757 spent on fees and slippage. |
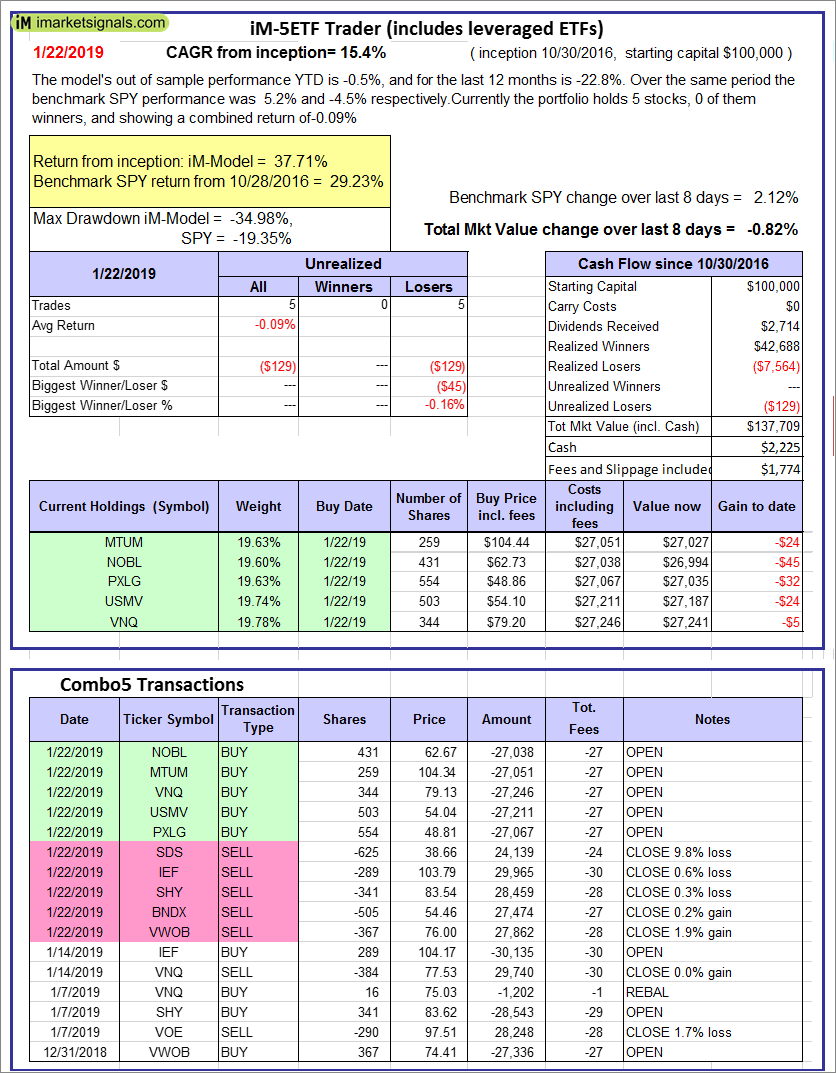 |
iM-5ETF Trader (includes leveraged ETFs): The model’s out of sample performance YTD is -0.5%, and for the last 12 months is -22.8%. Over the same period the benchmark SPY performance was 5.2% and -4.5% respectively. Over the previous week the market value of the iM-5ETF Trader (includes leveraged ETFs) gained -0.82% at a time when SPY gained 2.12%. A starting capital of $100,000 at inception on 10/30/2016 would have grown to $137,709 which includes $2,225 cash and excludes $1,774 spent on fees and slippage. |
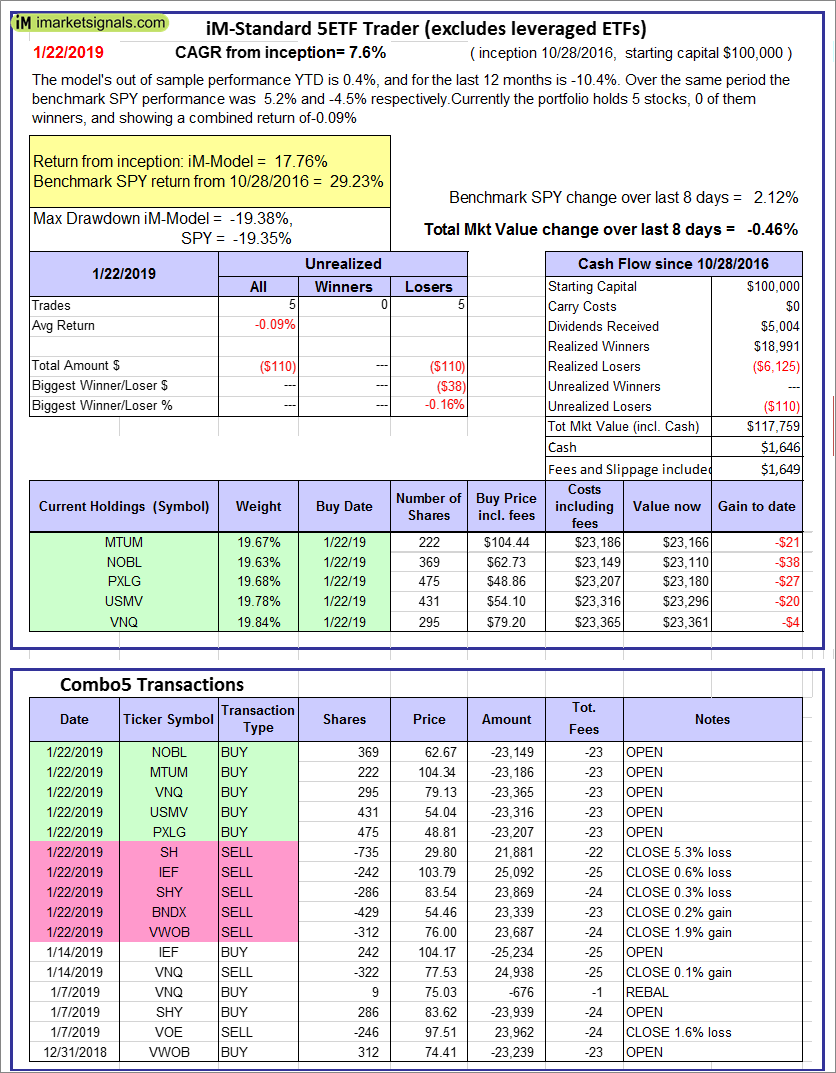 |
iM-Standard 5ETF Trader (excludes leveraged ETFs): The model’s out of sample performance YTD is 0.4%, and for the last 12 months is -10.4%. Over the same period the benchmark SPY performance was 5.2% and -4.5% respectively. Over the previous week the market value of the iM-Standard 5ETF Trader (excludes leveraged ETFs) gained -0.46% at a time when SPY gained 2.12%. A starting capital of $100,000 at inception on 10/30/2016 would have grown to $117,759 which includes $1,646 cash and excludes $1,649 spent on fees and slippage. |
iM-Best Reports – 1/22/2019
Posted in pmp SPY-SH
Leave a Reply
You must be logged in to post a comment.