
  |
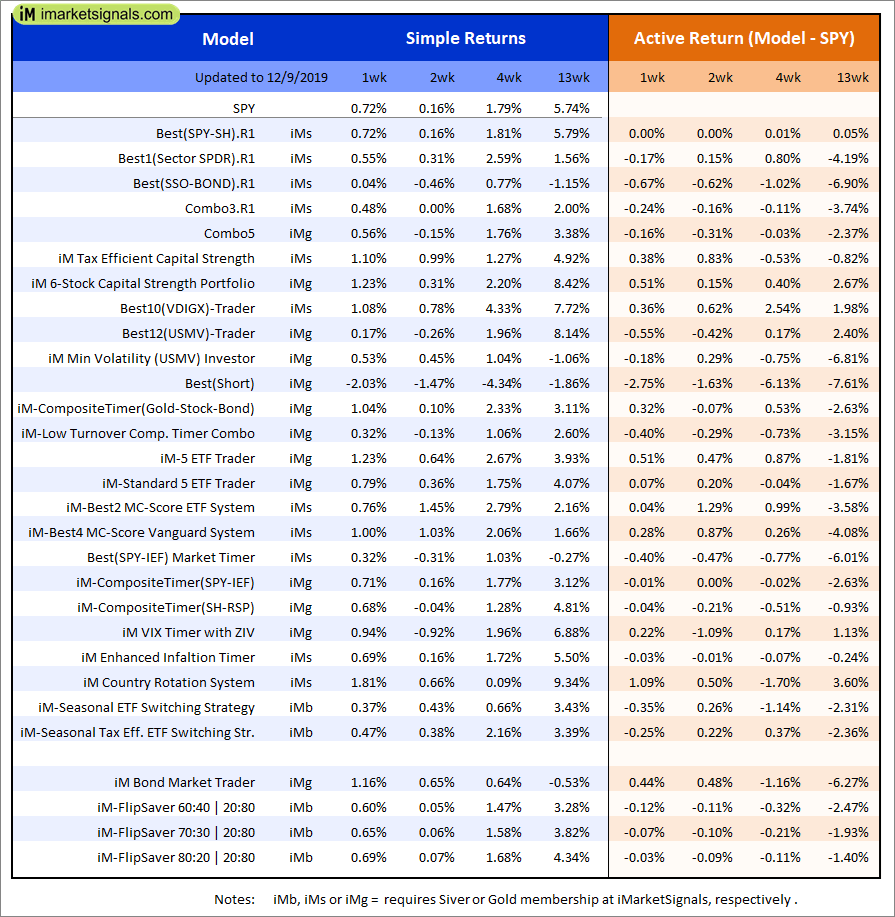
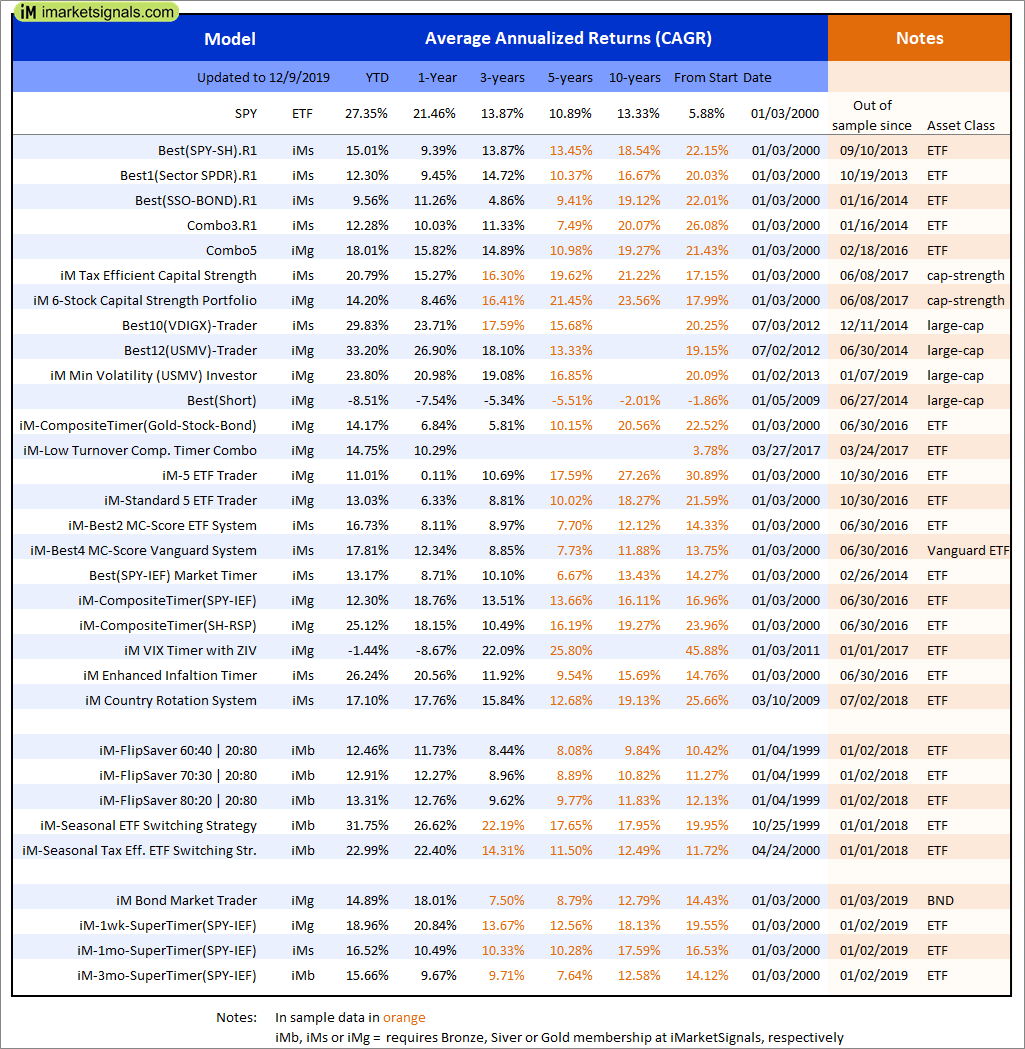
Out of sample performance summary of our models for the past 1, 2, 4 and 13 week periods. The active active return indicates how the models over- or underperformed the benchmark ETF SPY. Also the YTD, and the 1-, 3-, 5- and 10-year annualized returns are shown in the second table |
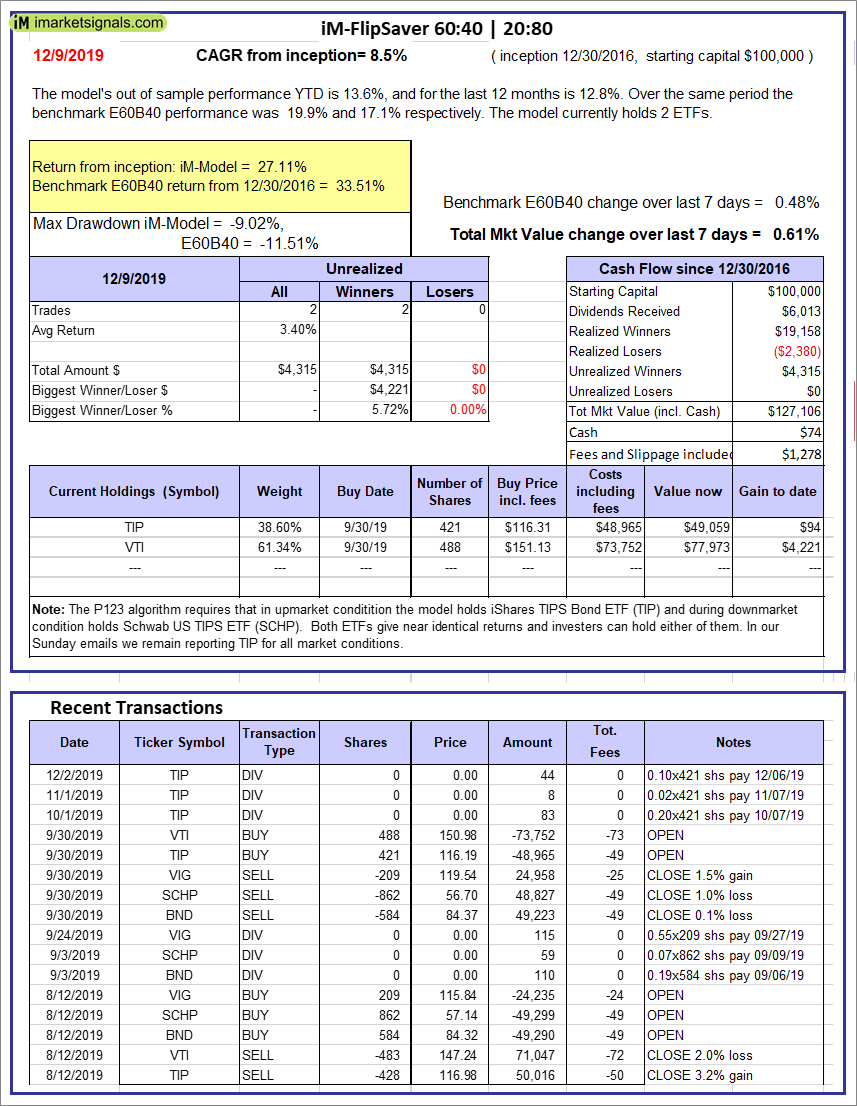 |
iM-FlipSaver 60:40 | 20:80 – 2017: The model’s out of sample performance YTD is 13.6%, and for the last 12 months is 12.8%. Over the same period the benchmark E60B40 performance was 19.9% and 17.1% respectively. Over the previous week the market value of iM-FlipSaver 80:20 | 20:80 gained 0.61% at a time when SPY gained 0.48%. A starting capital of $100,000 at inception on 7/16/2015 would have grown to $127,106 which includes $74 cash and excludes $1,278 spent on fees and slippage. |
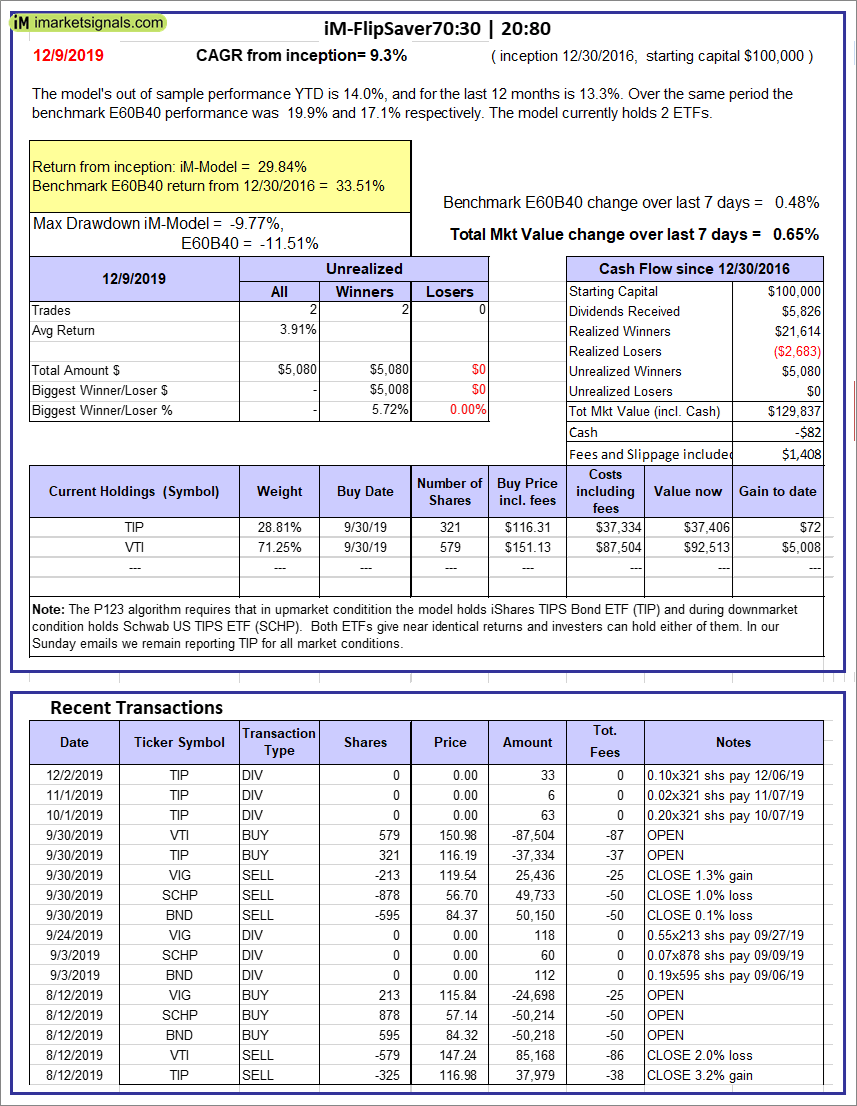 |
iM-FlipSaver 70:30 | 20:80 – 2017: The model’s out of sample performance YTD is 14.0%, and for the last 12 months is 13.3%. Over the same period the benchmark E60B40 performance was 19.9% and 17.1% respectively. Over the previous week the market value of iM-FlipSaver 70:30 | 20:80 gained 0.65% at a time when SPY gained 0.48%. A starting capital of $100,000 at inception on 7/15/2015 would have grown to $129,837 which includes -$82 cash and excludes $1,408 spent on fees and slippage. |
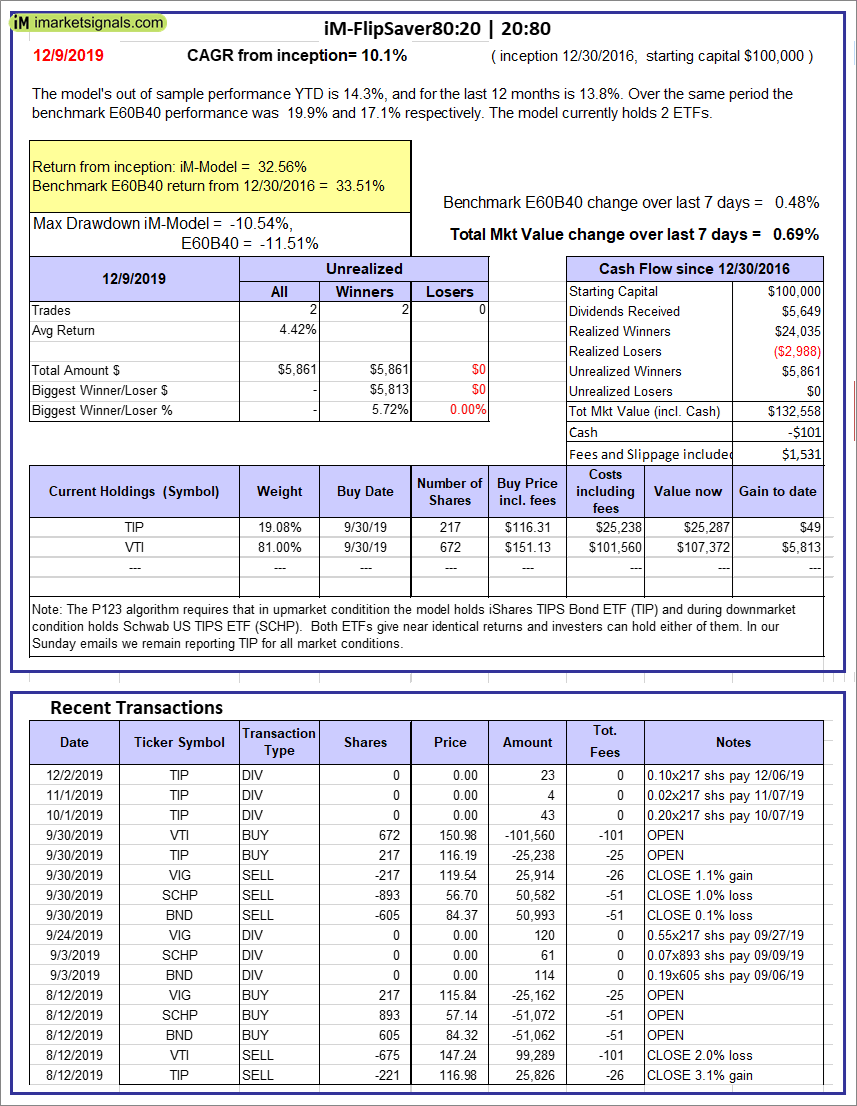 |
iM-FlipSaver 80:20 | 20:80 – 2017: The model’s out of sample performance YTD is 14.3%, and for the last 12 months is 13.8%. Over the same period the benchmark E60B40 performance was 19.9% and 17.1% respectively. Over the previous week the market value of iM-FlipSaver 80:20 | 20:80 gained 0.69% at a time when SPY gained 0.48%. A starting capital of $100,000 at inception on 1/2/2017 would have grown to $132,558 which includes -$101 cash and excludes $1,531 spent on fees and slippage. |
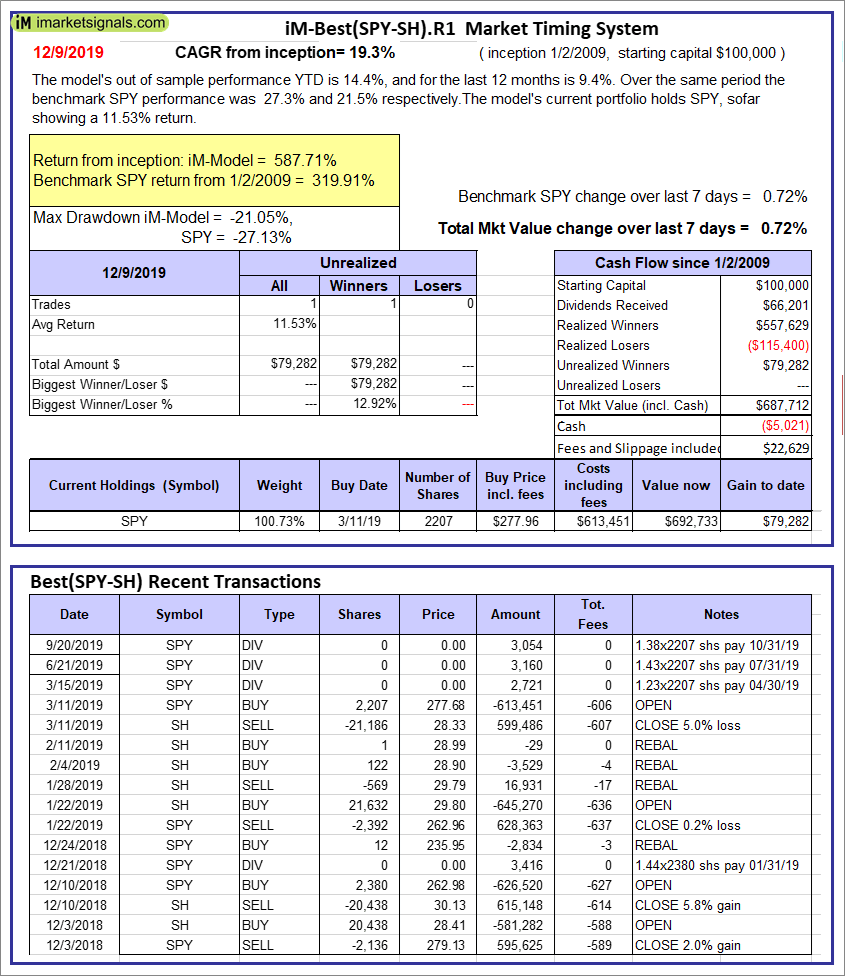 |
iM-Best(SPY-SH).R1: The model’s out of sample performance YTD is 14.4%, and for the last 12 months is 9.4%. Over the same period the benchmark SPY performance was 27.3% and 21.5% respectively. Over the previous week the market value of Best(SPY-SH) gained 0.72% at a time when SPY gained 0.72%. A starting capital of $100,000 at inception on 1/2/2009 would have grown to $687,712 which includes -$5,021 cash and excludes $22,629 spent on fees and slippage. |
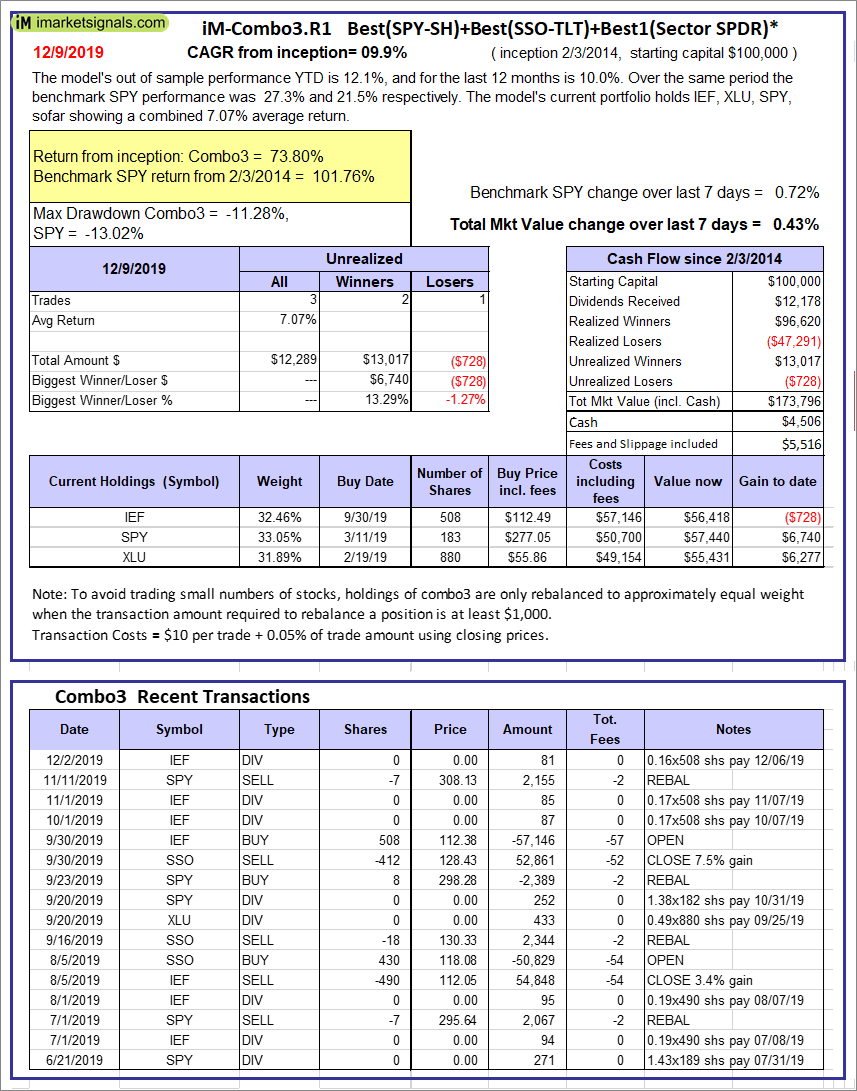 |
iM-Combo3.R1: The model’s out of sample performance YTD is 12.1%, and for the last 12 months is 10.0%. Over the same period the benchmark SPY performance was 27.3% and 21.5% respectively. Over the previous week the market value of iM-Combo3.R1 gained 0.43% at a time when SPY gained 0.72%. A starting capital of $100,000 at inception on 2/3/2014 would have grown to $173,796 which includes $4,506 cash and excludes $5,516 spent on fees and slippage. |
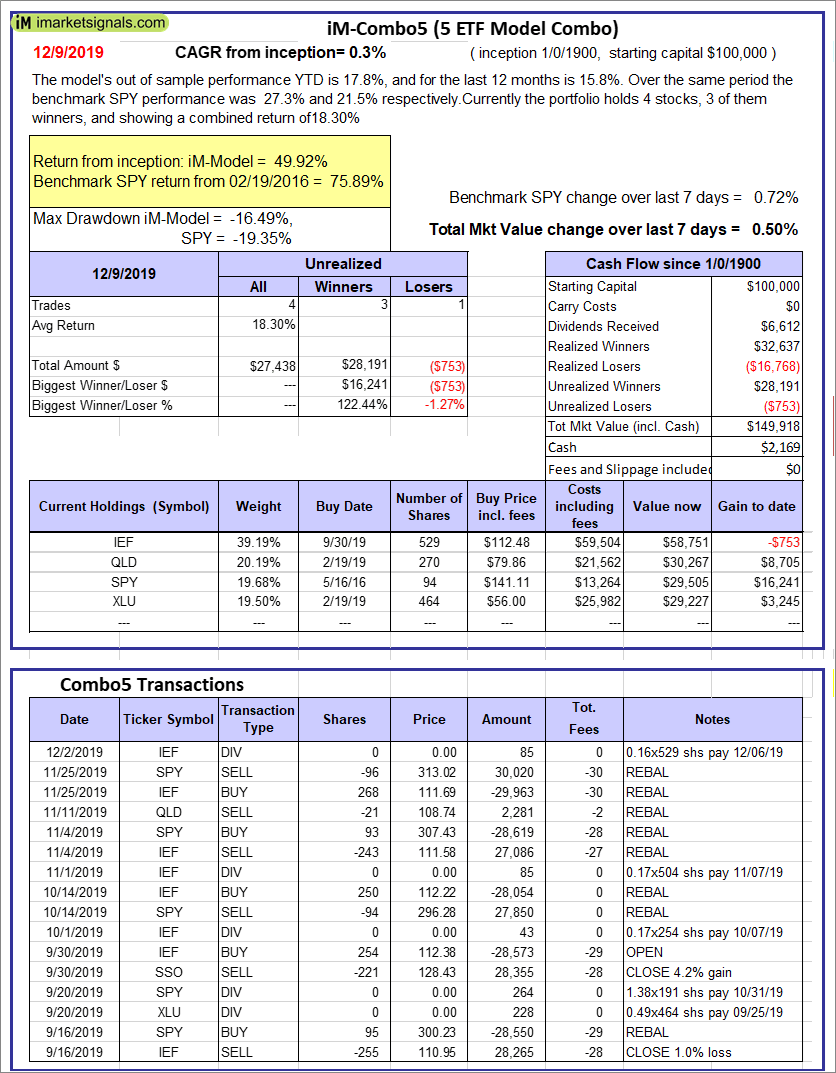 |
iM-Combo5: The model’s out of sample performance YTD is 17.8%, and for the last 12 months is 15.8%. Over the same period the benchmark SPY performance was 27.3% and 21.5% respectively. Over the previous week the market value of iM-Combo5 gained 0.50% at a time when SPY gained 0.72%. A starting capital of $100,000 at inception on 2/22/2016 would have grown to $149,918 which includes $2,169 cash and excludes $0 spent on fees and slippage. |
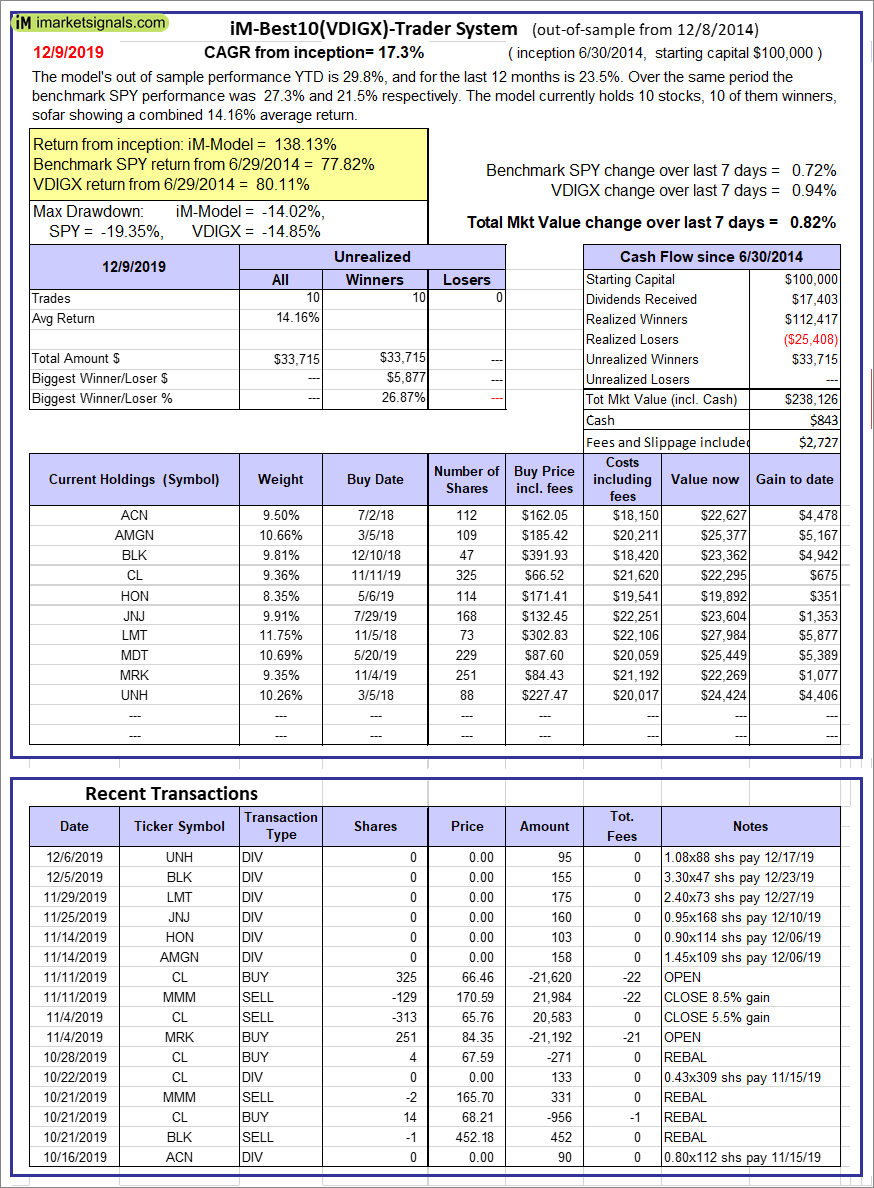 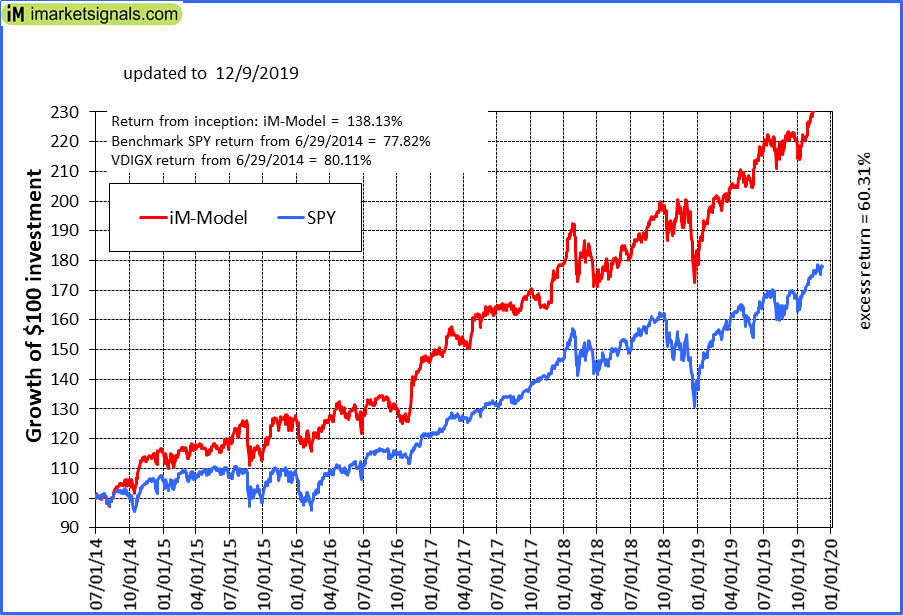 |
iM-Best10(VDIGX)-Trader: The model’s out of sample performance YTD is 29.8%, and for the last 12 months is 23.5%. Over the same period the benchmark SPY performance was 27.3% and 21.5% respectively. Since inception, on 7/1/2014, the model gained 138.13% while the benchmark SPY gained 77.82% and VDIGX gained 80.11% over the same period. Over the previous week the market value of iM-Best10(VDIGX) gained 0.82% at a time when SPY gained 0.72%. A starting capital of $100,000 at inception on 7/1/2014 would have grown to $238,126 which includes $843 cash and excludes $2,727 spent on fees and slippage. |
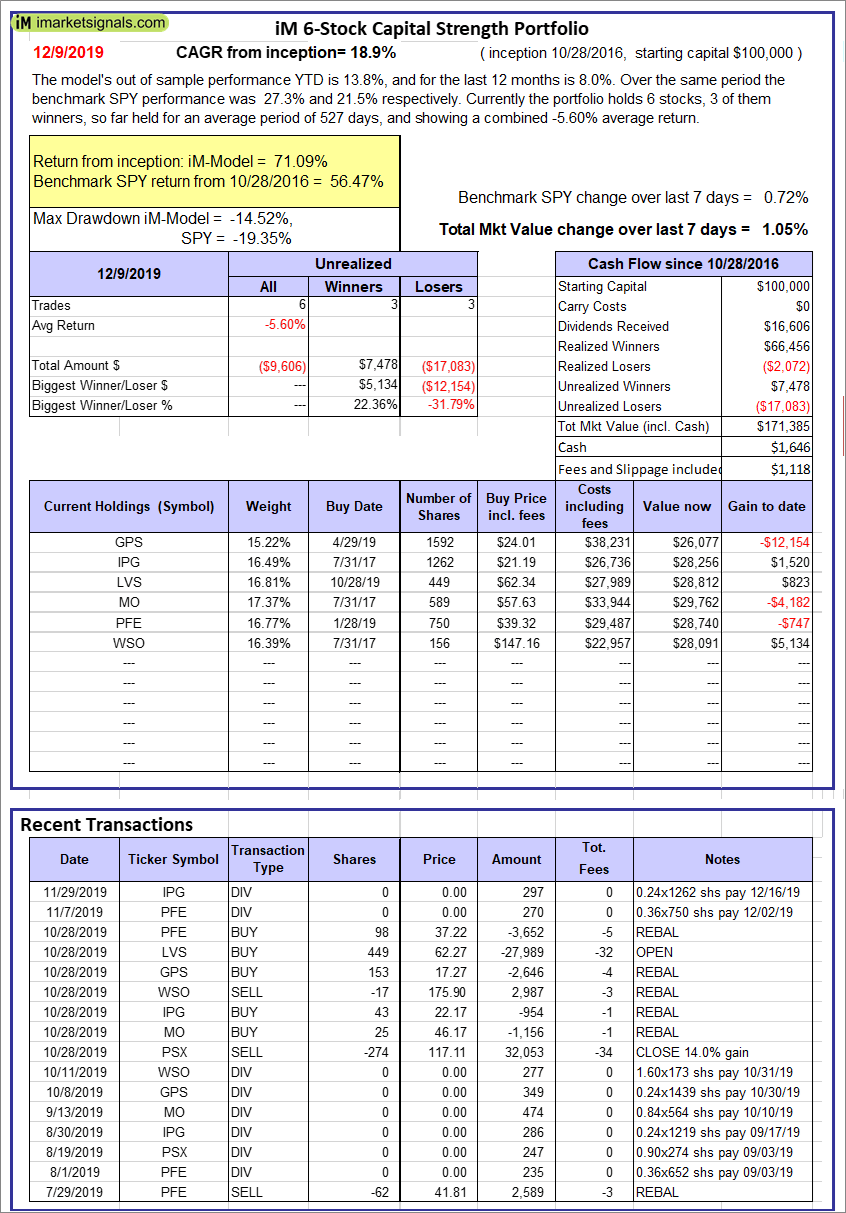 |
iM 6-Stock Capital Strength Portfolio: The model’s out of sample performance YTD is 13.8%, and for the last 12 months is 8.0%. Over the same period the benchmark SPY performance was 27.3% and 21.5% respectively. Over the previous week the market value of the iM 6-Stock Capital Strength Portfolio gained 1.05% at a time when SPY gained 0.72%. A starting capital of $100,000 at inception on 10/28/2016 would have grown to $171,385 which includes $1,646 cash and excludes $1,118 spent on fees and slippage. |
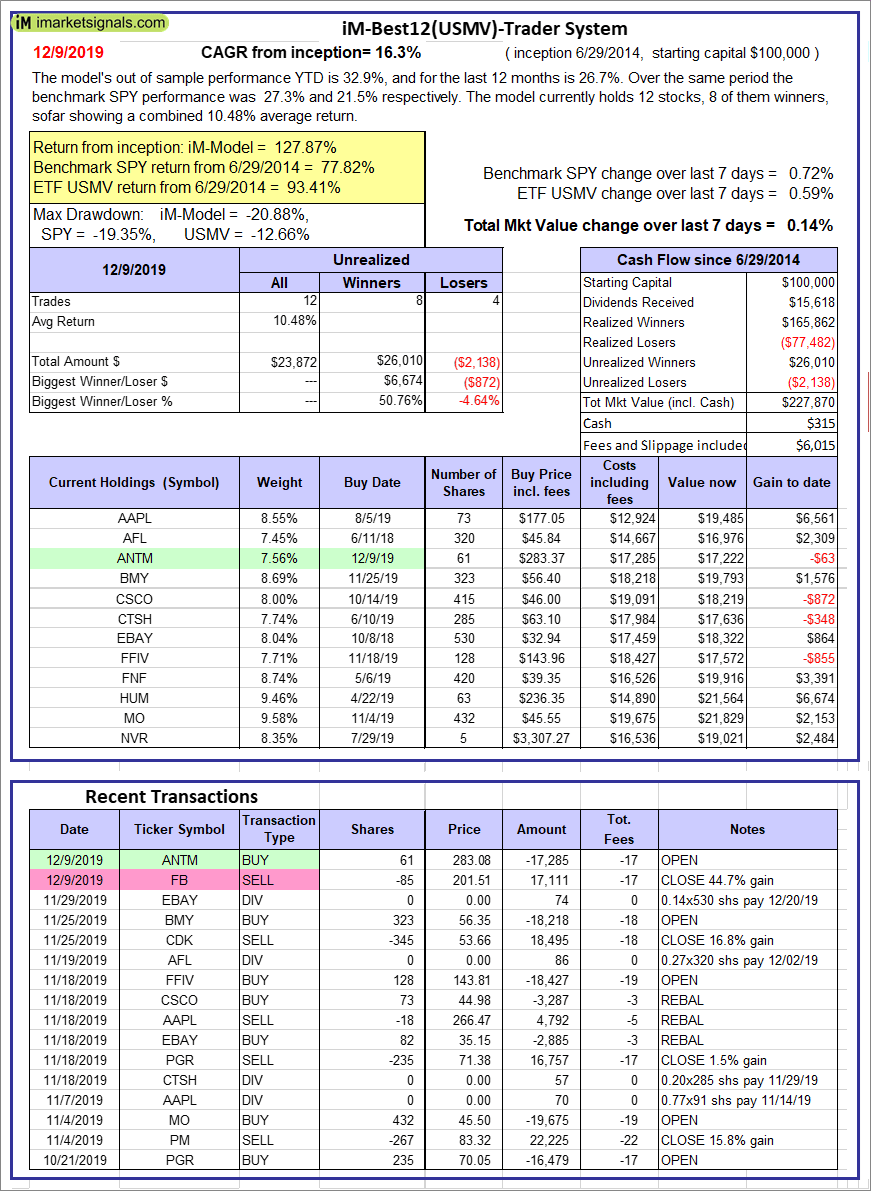 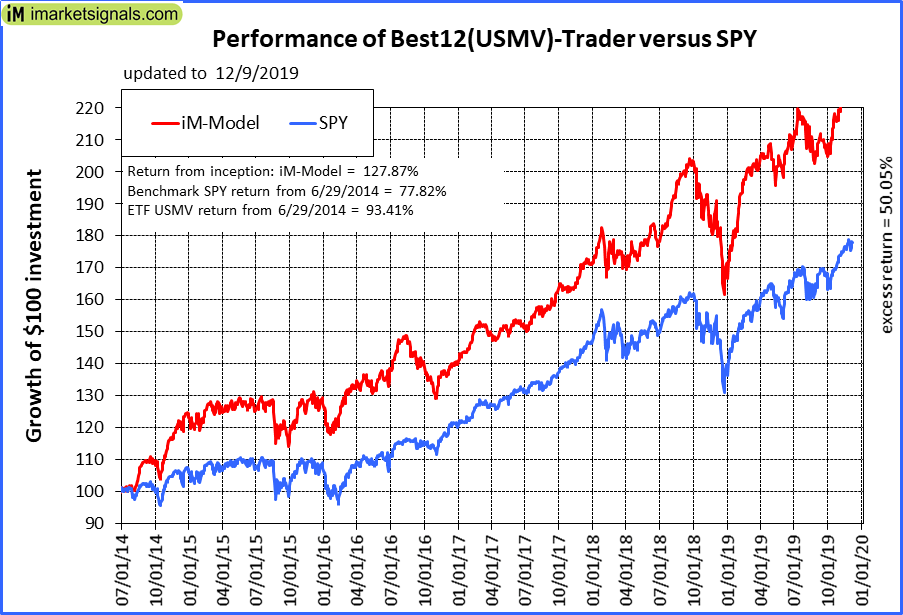 |
iM-Best12(USMV)-Trader: The model’s out of sample performance YTD is 32.9%, and for the last 12 months is 26.7%. Over the same period the benchmark SPY performance was 27.3% and 21.5% respectively. Since inception, on 6/30/2014, the model gained 127.87% while the benchmark SPY gained 77.82% and the ETF USMV gained 93.41% over the same period. Over the previous week the market value of iM-Best12(USMV)-Trader gained 0.14% at a time when SPY gained 0.72%. A starting capital of $100,000 at inception on 6/30/2014 would have grown to $227,870 which includes $315 cash and excludes $6,015 spent on fees and slippage. |
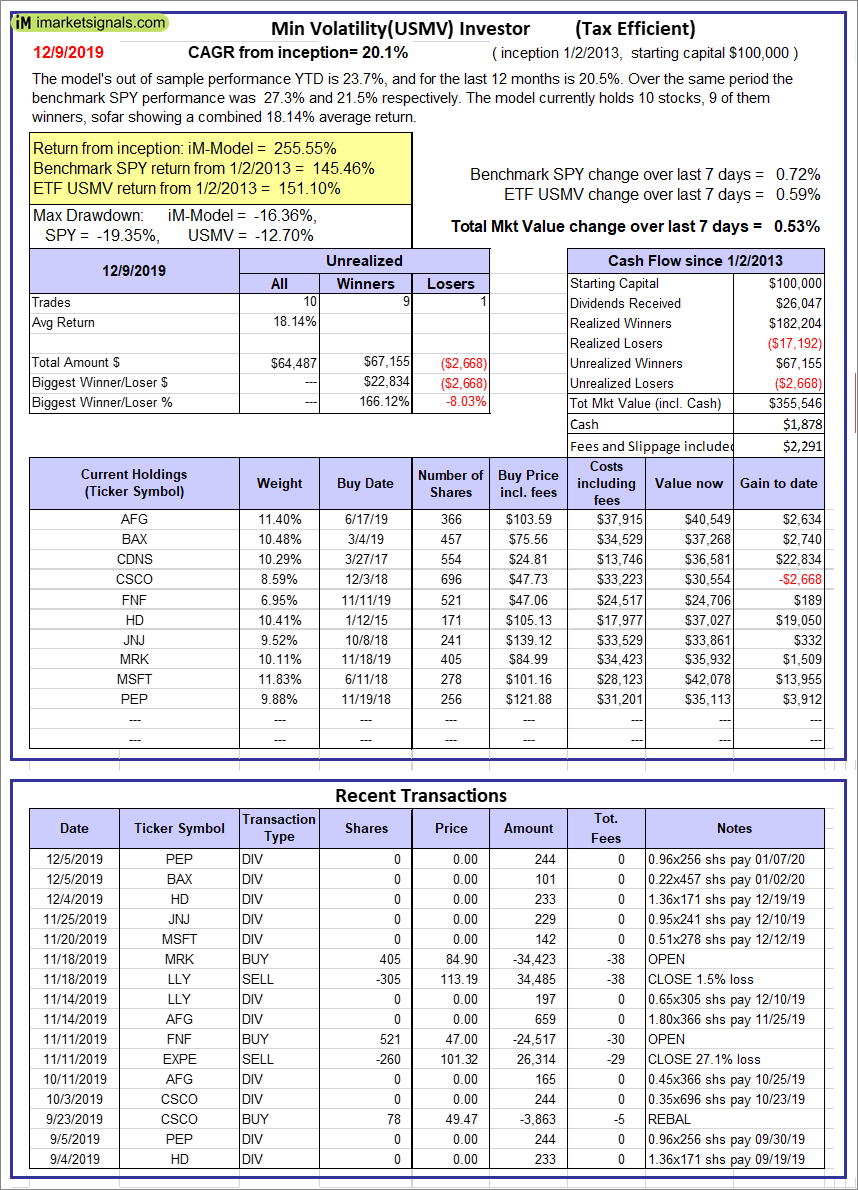 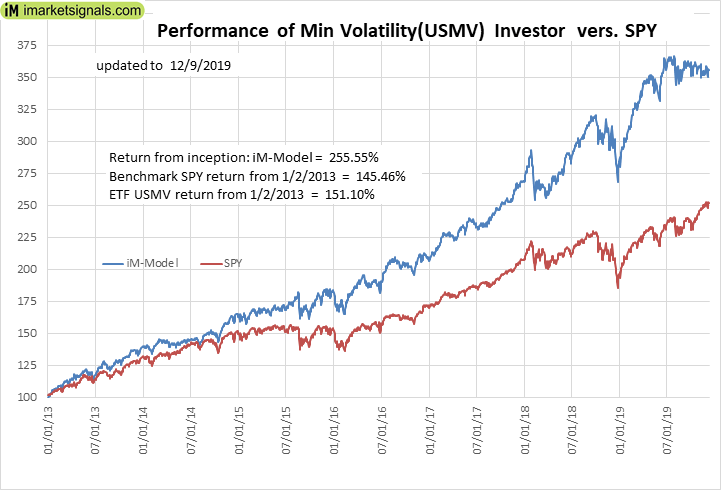 |
iM-Min Volatility(USMV) Investor (Tax Efficient): The model’s out of sample performance YTD is 23.7%, and for the last 12 months is 20.5%. Over the same period the benchmark SPY performance was 27.3% and 21.5% respectively. Since inception, on 1/3/2013, the model gained 255.55% while the benchmark SPY gained 145.46% and the ETF USMV gained 151.10% over the same period. Over the previous week the market value of iM-Best12(USMV)Q1 gained 0.53% at a time when SPY gained 0.72%. A starting capital of $100,000 at inception on 1/3/2013 would have grown to $355,546 which includes $1,878 cash and excludes $2,291 spent on fees and slippage. |
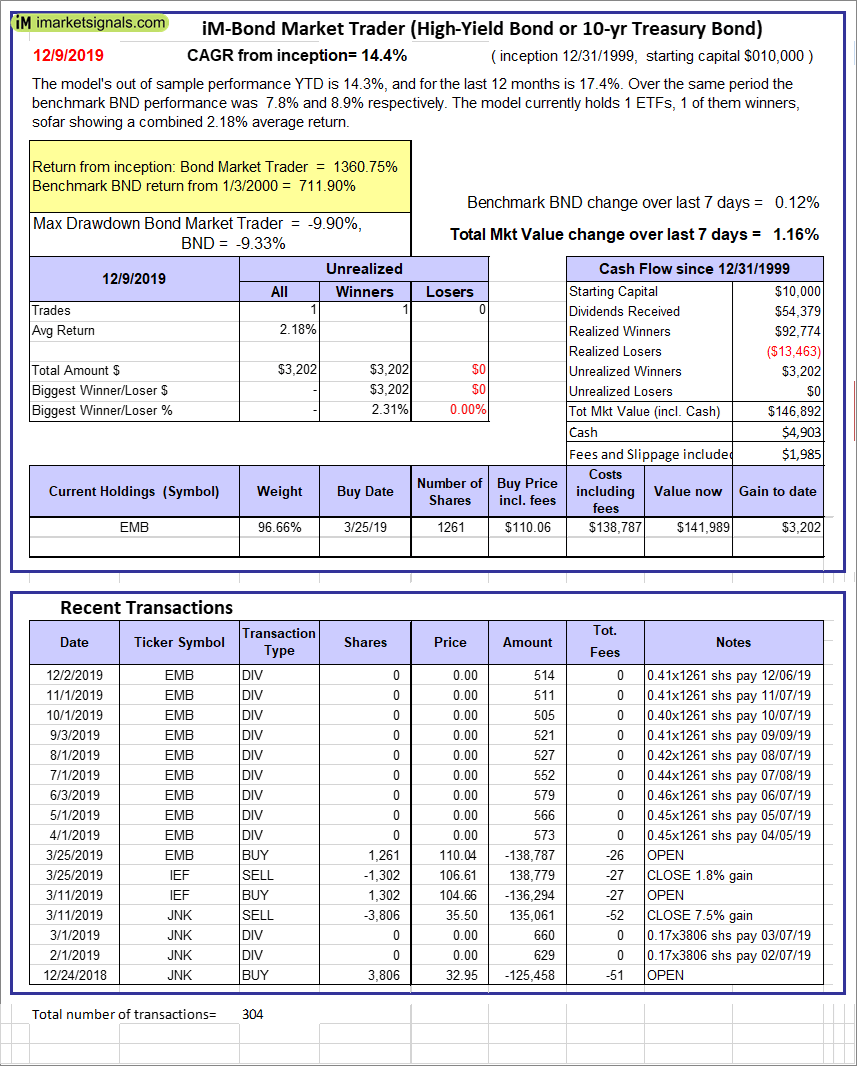 |
iM-Bond Market Trader (High-Yield Bond or 10-yr Treasury Bond): The model’s out of sample performance YTD is 10.7%, and for the last 12 months is -0.1%. Over the same period the benchmark SPY performance was 27.3% and 21.5% respectively. Over the previous week the market value of the iM-Bond Market Trader (High-Yield Bond or 10-yr Treasury Bond) gained 1.16% at a time when BND gained 0.12%. A starting capital of $100,000 at inception on 10/30/2016 would have grown to $146,892 which includes $4,903 cash and excludes $1,985 spent on fees and slippage. |
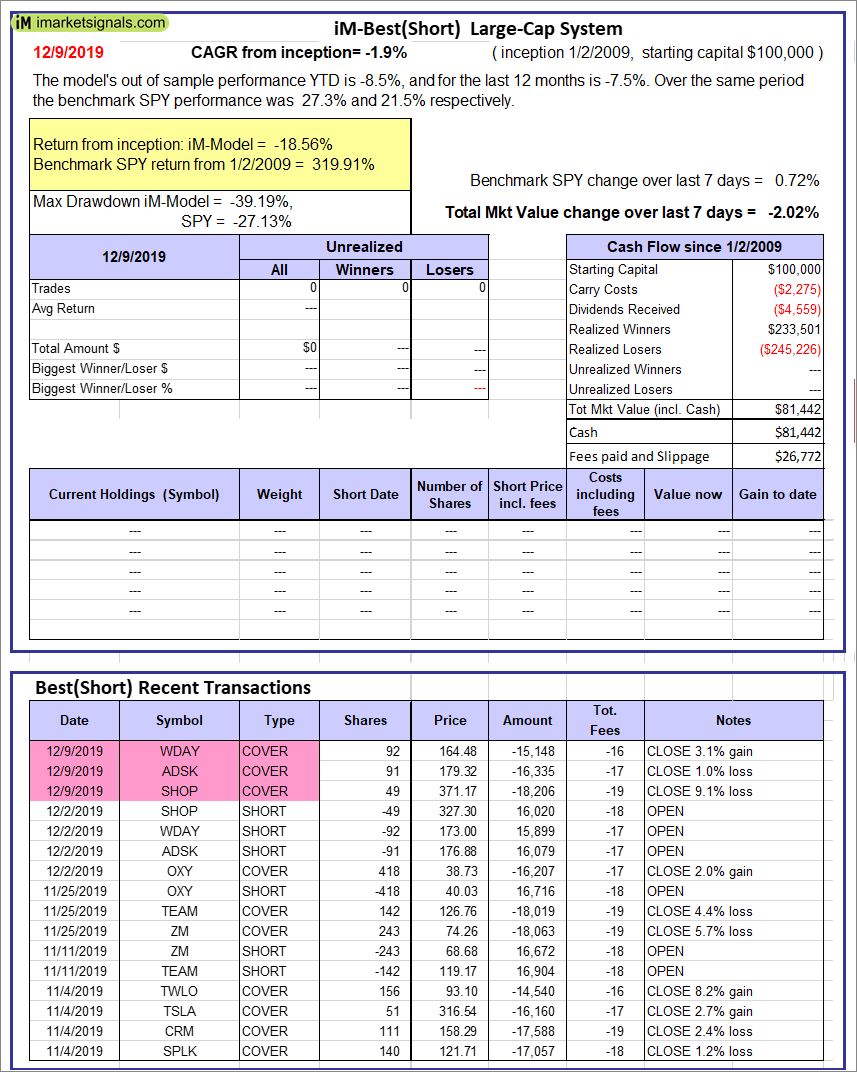 |
iM-Best(Short): The model’s out of sample performance YTD is -8.5%, and for the last 12 months is -7.5%. Over the same period the benchmark SPY performance was 27.3% and 21.5% respectively. Over the previous week the market value of iM-Best(Short) gained -2.02% at a time when SPY gained 0.72%. Over the period 1/2/2009 to 12/9/2019 the starting capital of $100,000 would have grown to $81,442 which includes $81,442 cash and excludes $26,772 spent on fees and slippage. |
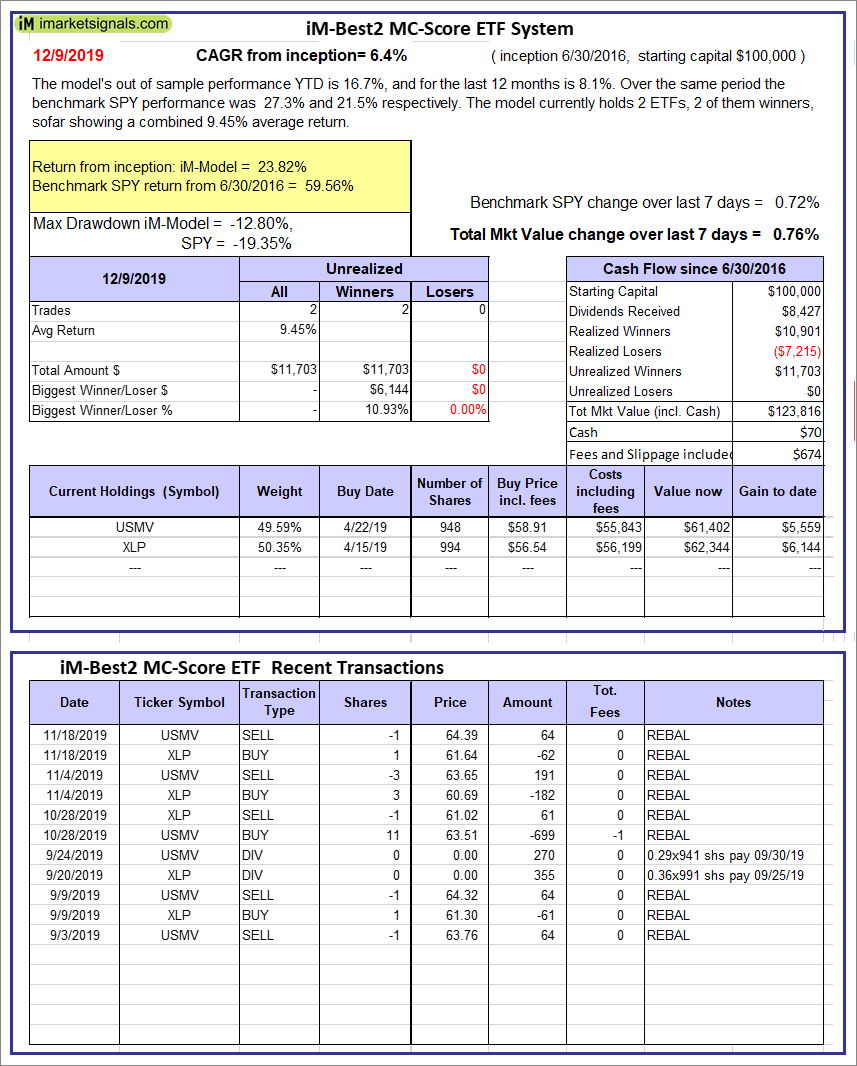 |
iM-Best2 MC-Score ETF System: The model’s out of sample performance YTD is 16.7%, and for the last 12 months is 8.1%. Over the same period the benchmark SPY performance was 27.3% and 21.5% respectively. Over the previous week the market value of the iM-Best2 MC-Score ETF System gained 0.76% at a time when SPY gained 0.72%. A starting capital of $100,000 at inception on 6/30/2016 would have grown to $123,816 which includes $70 cash and excludes $674 spent on fees and slippage. |
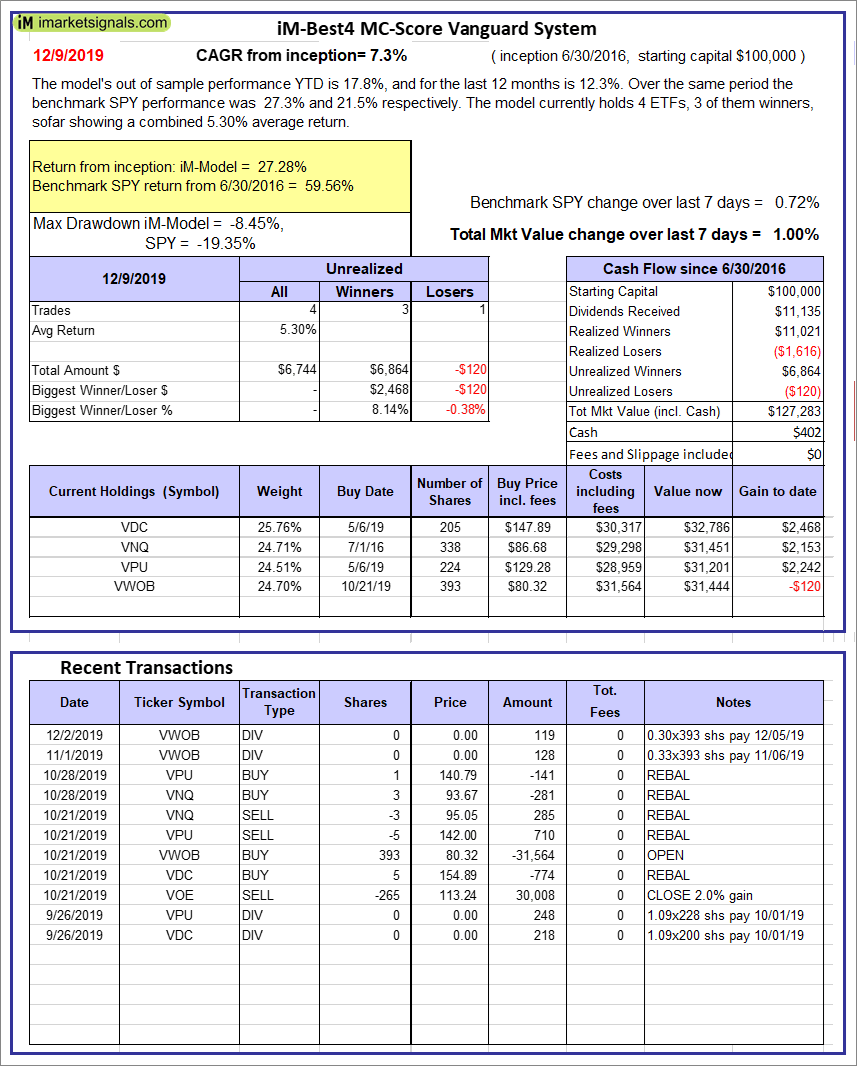 |
iM-Best4 MC-Score Vanguard System: The model’s out of sample performance YTD is 17.8%, and for the last 12 months is 12.3%. Over the same period the benchmark SPY performance was 27.3% and 21.5% respectively. Over the previous week the market value of the iM-Best4 MC-Score Vanguard System gained 1.00% at a time when SPY gained 0.72%. A starting capital of $100,000 at inception on 6/30/2016 would have grown to $127,283 which includes $402 cash and excludes $00 spent on fees and slippage. |
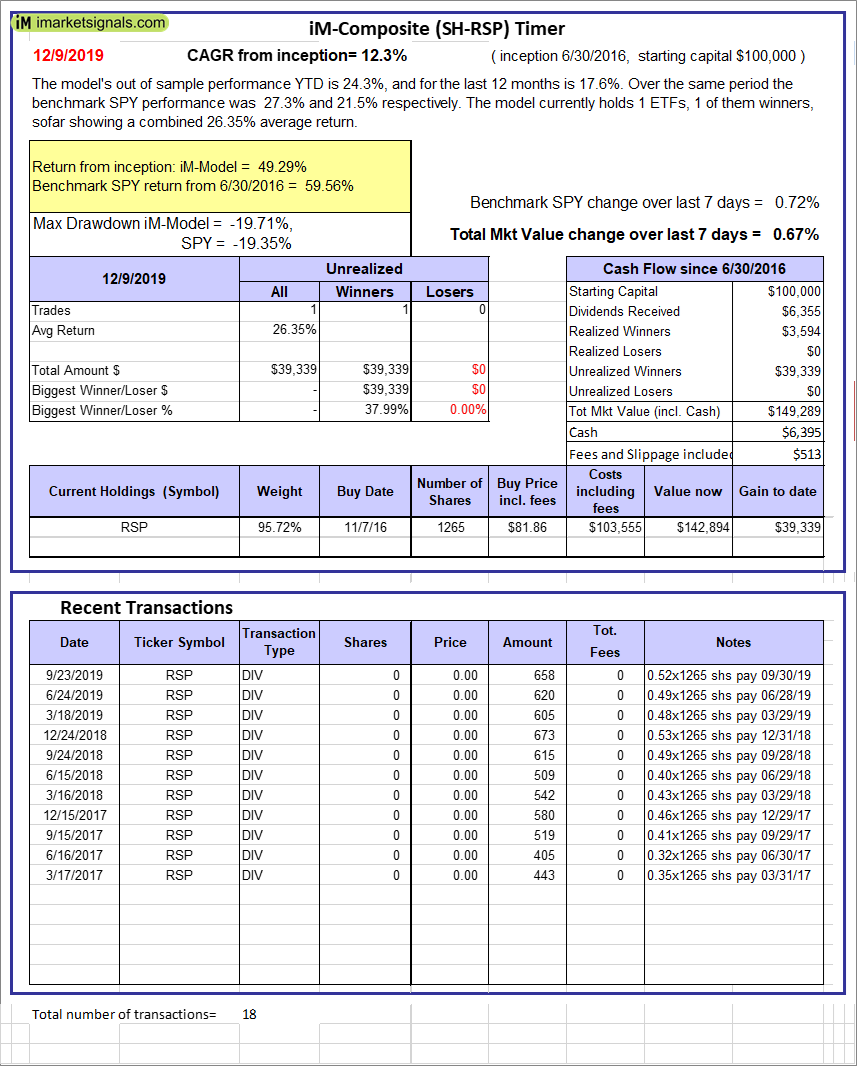 |
iM-Composite (SH-RSP) Timer: The model’s out of sample performance YTD is 24.3%, and for the last 12 months is 17.6%. Over the same period the benchmark SPY performance was 27.3% and 21.5% respectively. Over the previous week the market value of the iM-Composite (SH-RSP) Timer gained 0.67% at a time when SPY gained 0.72%. A starting capital of $100,000 at inception on 6/30/2016 would have grown to $149,289 which includes $6,395 cash and excludes $513 spent on fees and slippage. |
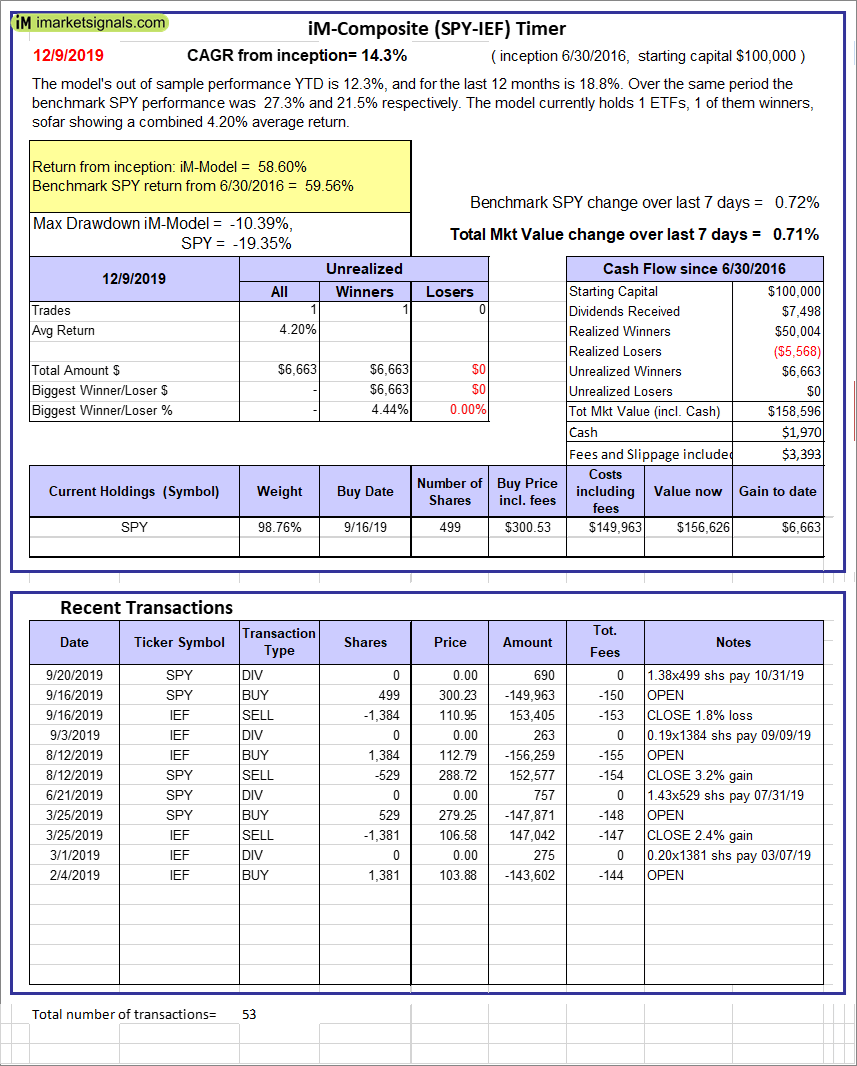 |
iM-Composite (SPY-IEF) Timer: The model’s out of sample performance YTD is 12.3%, and for the last 12 months is 18.8%. Over the same period the benchmark SPY performance was 27.3% and 21.5% respectively. Over the previous week the market value of the iM-Composite (SPY-IEF) Timer gained 0.71% at a time when SPY gained 0.72%. A starting capital of $100,000 at inception on 6/30/2016 would have grown to $158,596 which includes $1,970 cash and excludes $3,393 spent on fees and slippage. |
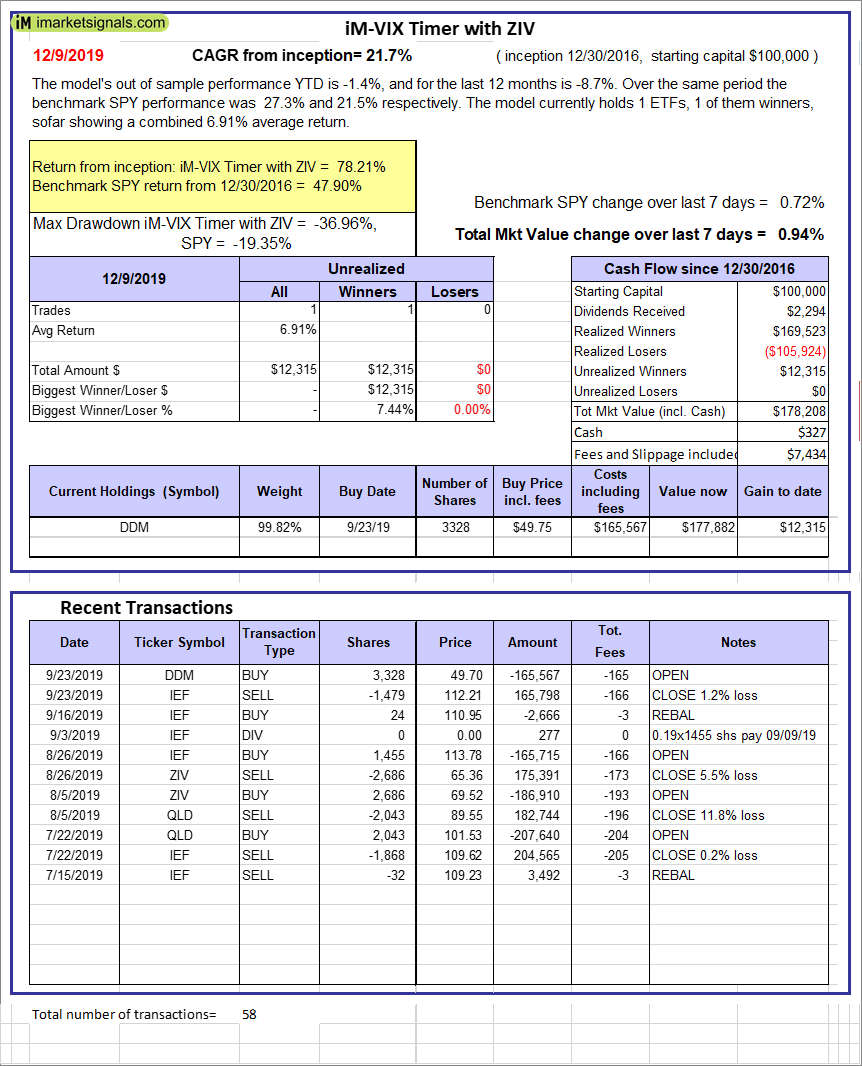 |
iM-VIX Timer with ZIV: The model’s out of sample performance YTD is -1.4%, and for the last 12 months is -8.7%. Over the same period the benchmark SPY performance was 27.3% and 21.5% respectively. Over the previous week the market value of the iM-VIX Timer with ZIV gained 0.94% at a time when SPY gained 0.72%. A starting capital of $100,000 at inception on 6/30/2016 would have grown to $178,208 which includes $327 cash and excludes $7,434 spent on fees and slippage. |
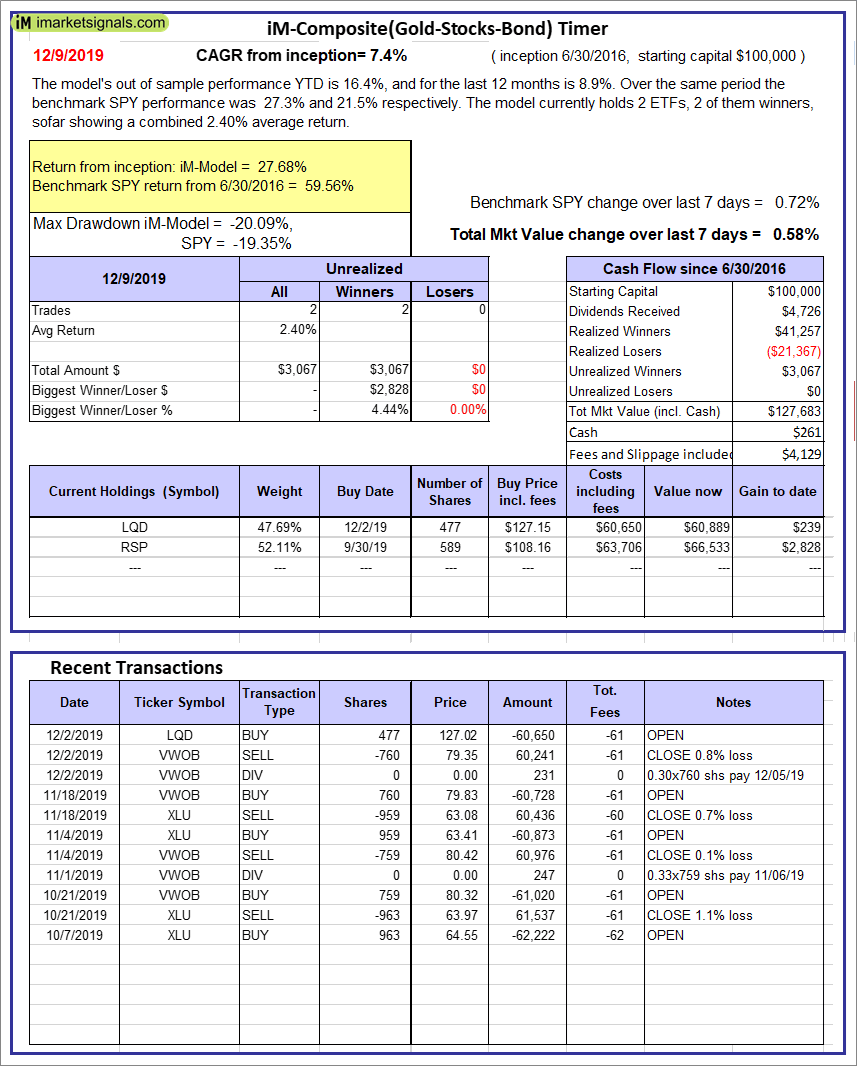 |
iM-Composite(Gold-Stocks-Bond) Timer: The model’s out of sample performance YTD is 16.4%, and for the last 12 months is 8.9%. Over the same period the benchmark SPY performance was 27.3% and 21.5% respectively. Over the previous week the market value of the iM-Composite(Gold-Stocks-Bond) Timer gained 0.58% at a time when SPY gained 0.72%. A starting capital of $100,000 at inception on 6/30/2016 would have grown to $127,683 which includes $261 cash and excludes $4,129 spent on fees and slippage. |
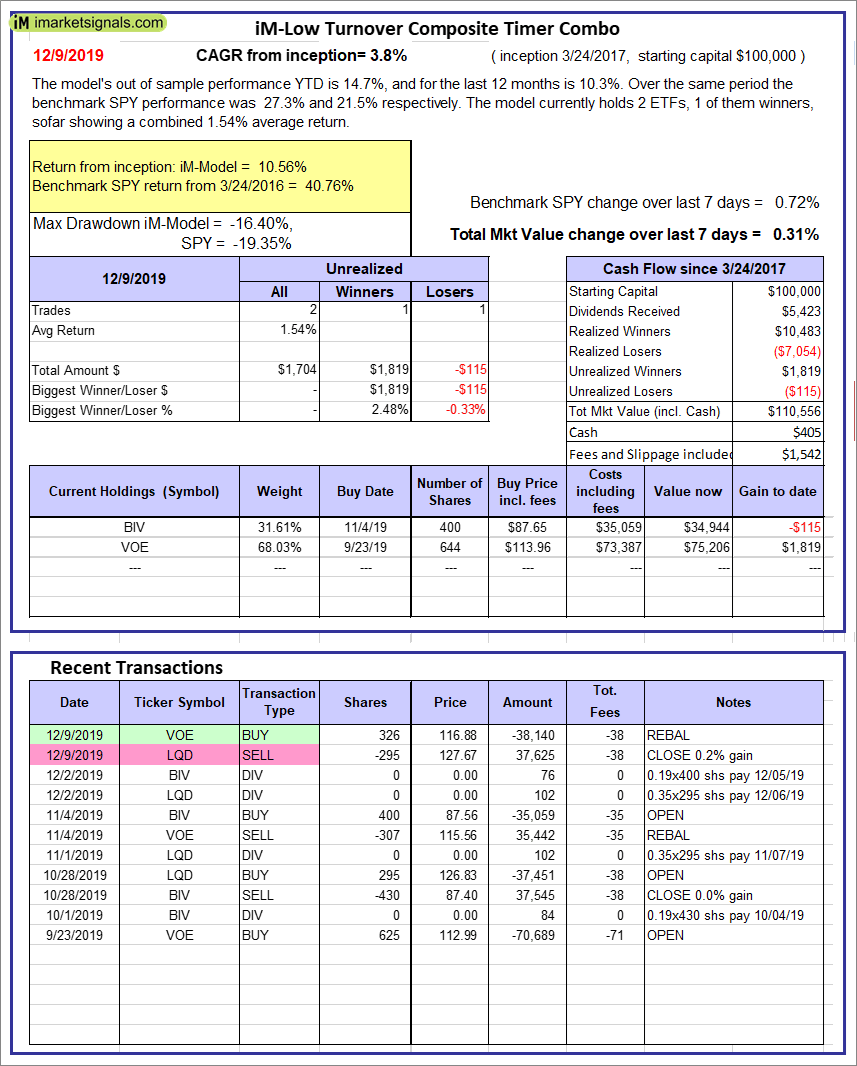 |
iM-Low Turnover Composite Timer Combo: The model’s out of sample performance YTD is 14.7%, and for the last 12 months is 10.3%. Over the same period the benchmark SPY performance was 27.3% and 21.5% respectively. Over the previous week the market value of the iM-Low Turnover Composite Timer Combo gained 0.31% at a time when SPY gained 0.72%. A starting capital of $100,000 at inception on 3/24/27 would have grown to $110,556 which includes $405 cash and excludes $1,542 spent on fees and slippage. |
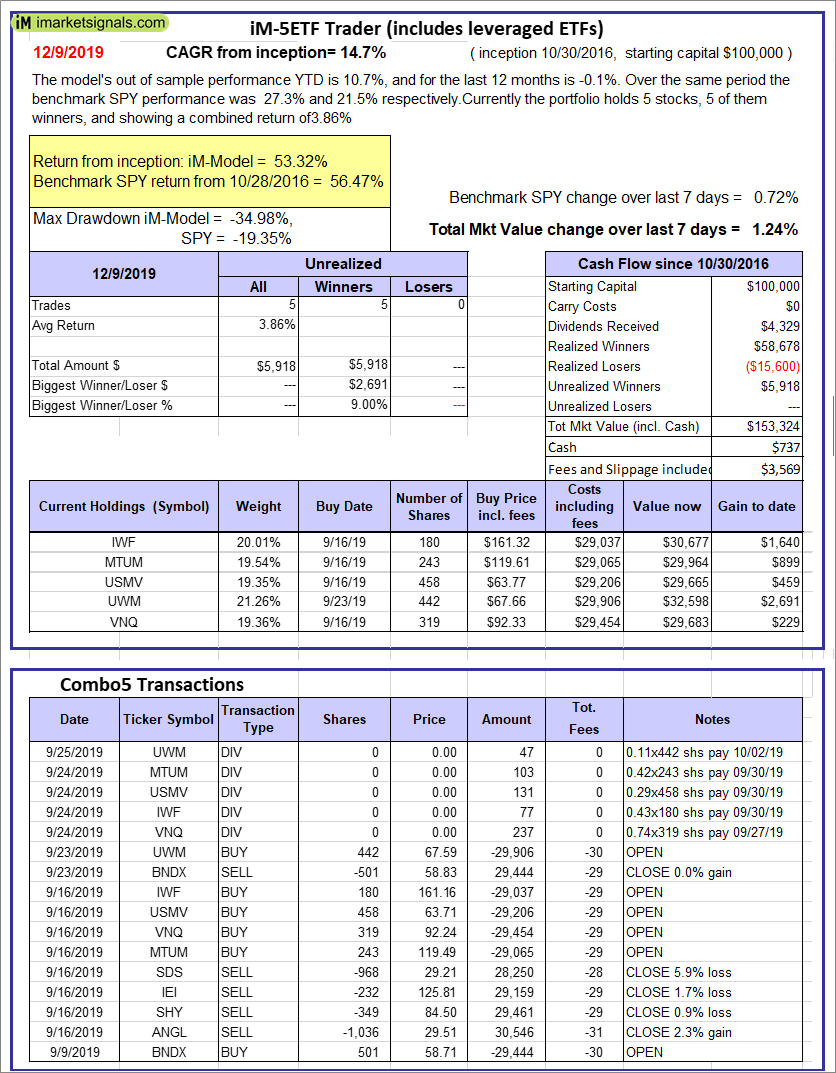 |
iM-5ETF Trader (includes leveraged ETFs): The model’s out of sample performance YTD is 10.7%, and for the last 12 months is -0.1%. Over the same period the benchmark SPY performance was 27.3% and 21.5% respectively. Over the previous week the market value of the iM-5ETF Trader (includes leveraged ETFs) gained 1.24% at a time when SPY gained 0.72%. A starting capital of $100,000 at inception on 10/30/2016 would have grown to $153,324 which includes $737 cash and excludes $3,569 spent on fees and slippage. |
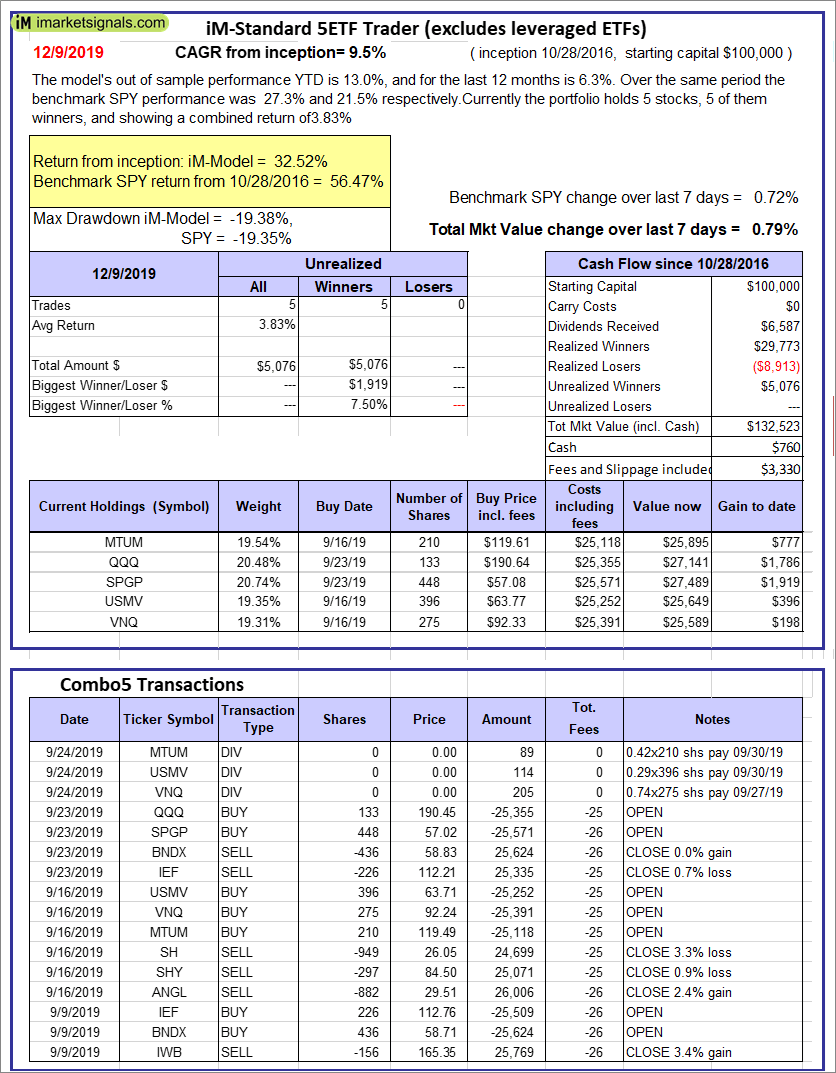 |
iM-Standard 5ETF Trader (excludes leveraged ETFs): The model’s out of sample performance YTD is 13.0%, and for the last 12 months is 6.3%. Over the same period the benchmark SPY performance was 27.3% and 21.5% respectively. Over the previous week the market value of the iM-Standard 5ETF Trader (excludes leveraged ETFs) gained 0.79% at a time when SPY gained 0.72%. A starting capital of $100,000 at inception on 10/30/2016 would have grown to $132,523 which includes $760 cash and excludes $3,330 spent on fees and slippage. |
iM-Best Reports – 12/9/2019
Posted in pmp SPY-SH
Leave a Reply
You must be logged in to post a comment.