
  |
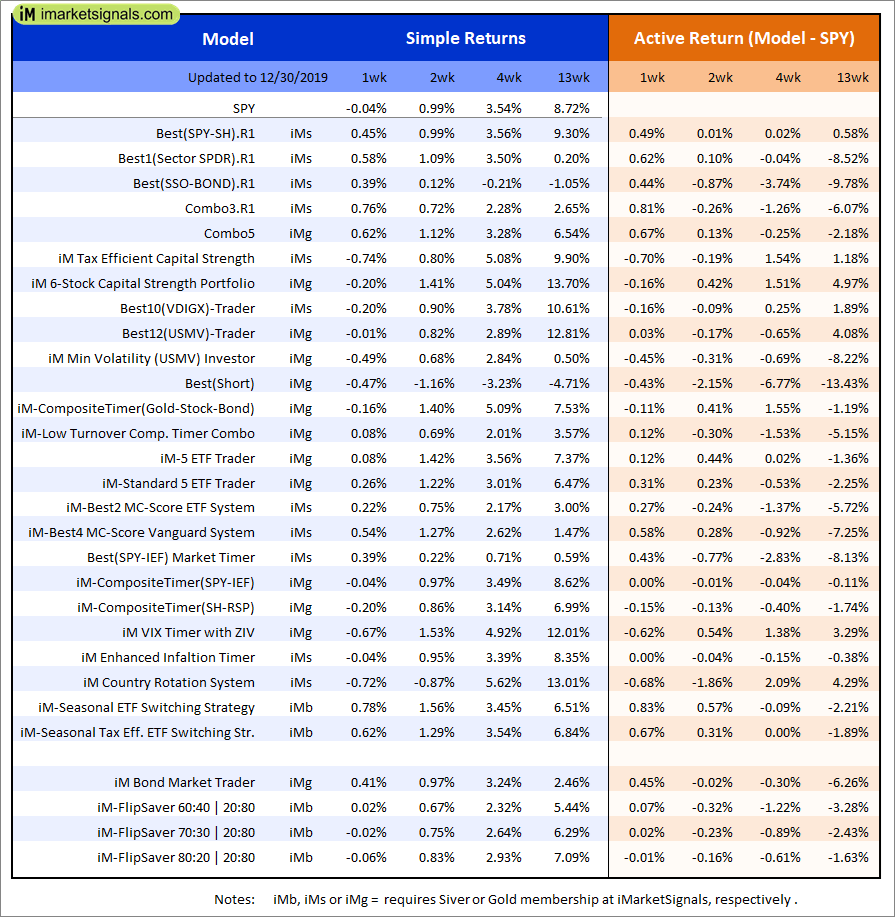
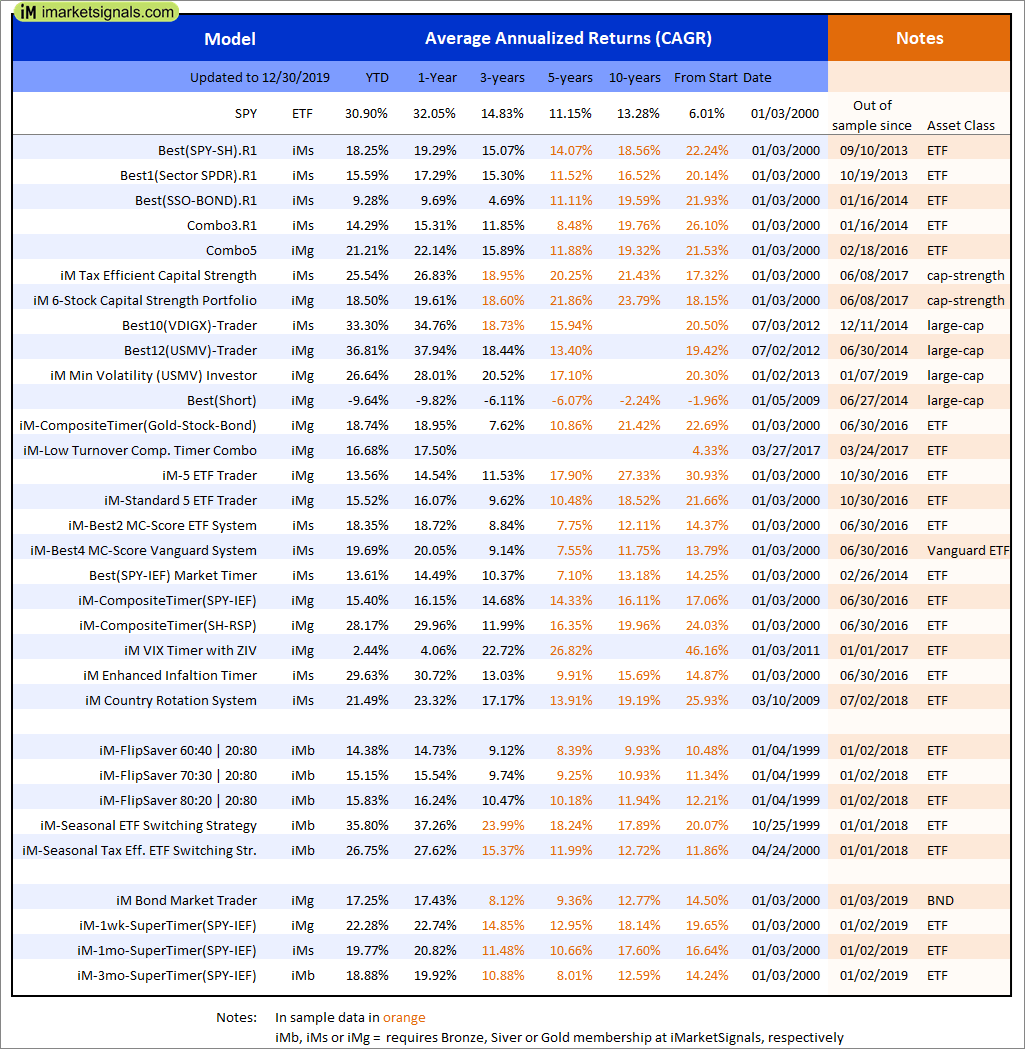
Out of sample performance summary of our models for the past 1, 2, 4 and 13 week periods. The active active return indicates how the models over- or underperformed the benchmark ETF SPY. Also the YTD, and the 1-, 3-, 5- and 10-year annualized returns are shown in the second table |
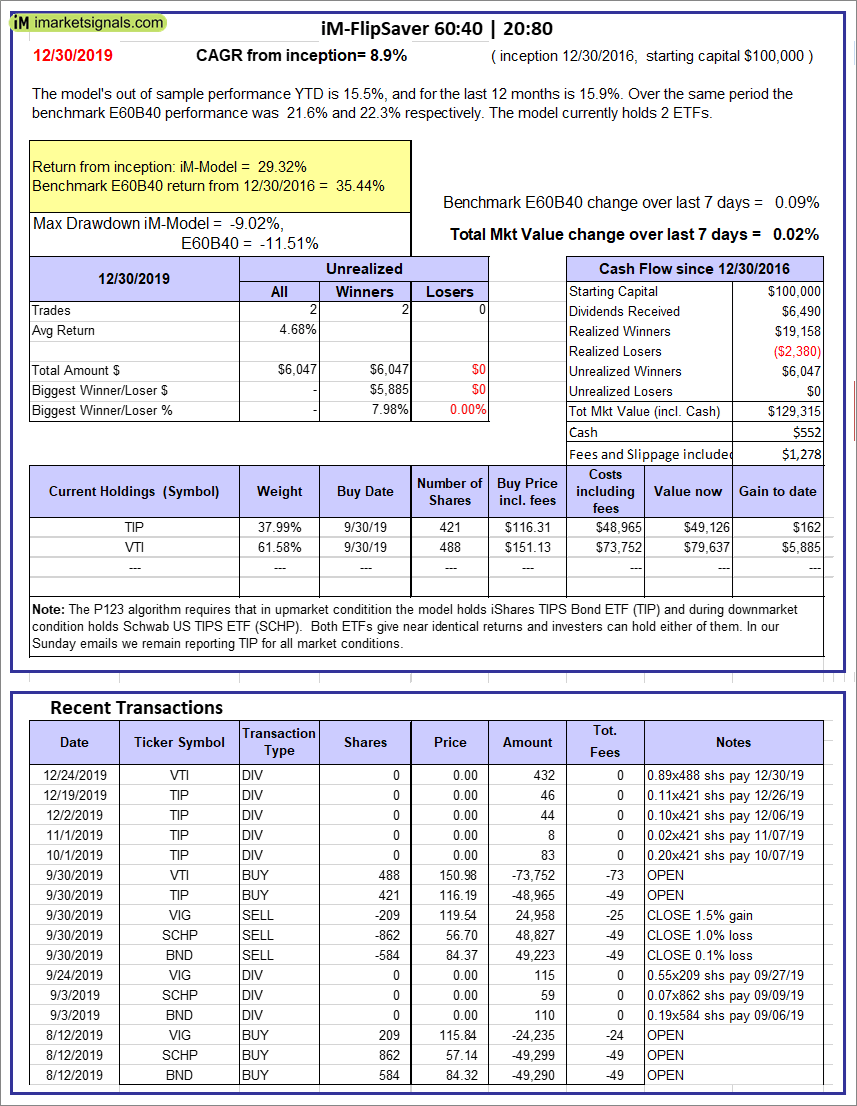 |
iM-FlipSaver 60:40 | 20:80 – 2017: The model’s out of sample performance YTD is 15.5%, and for the last 12 months is 15.9%. Over the same period the benchmark E60B40 performance was 21.6% and 22.3% respectively. Over the previous week the market value of iM-FlipSaver 80:20 | 20:80 gained 0.02% at a time when SPY gained 0.09%. A starting capital of $100,000 at inception on 7/16/2015 would have grown to $129,315 which includes $552 cash and excludes $1,278 spent on fees and slippage. |
 |
iM-FlipSaver 70:30 | 20:80 – 2017: The model’s out of sample performance YTD is 16.2%, and for the last 12 months is 16.6%. Over the same period the benchmark E60B40 performance was 21.6% and 22.3% respectively. Over the previous week the market value of iM-FlipSaver 70:30 | 20:80 gained -0.02% at a time when SPY gained 0.09%. A starting capital of $100,000 at inception on 7/15/2015 would have grown to $132,410 which includes $466 cash and excludes $1,408 spent on fees and slippage. |
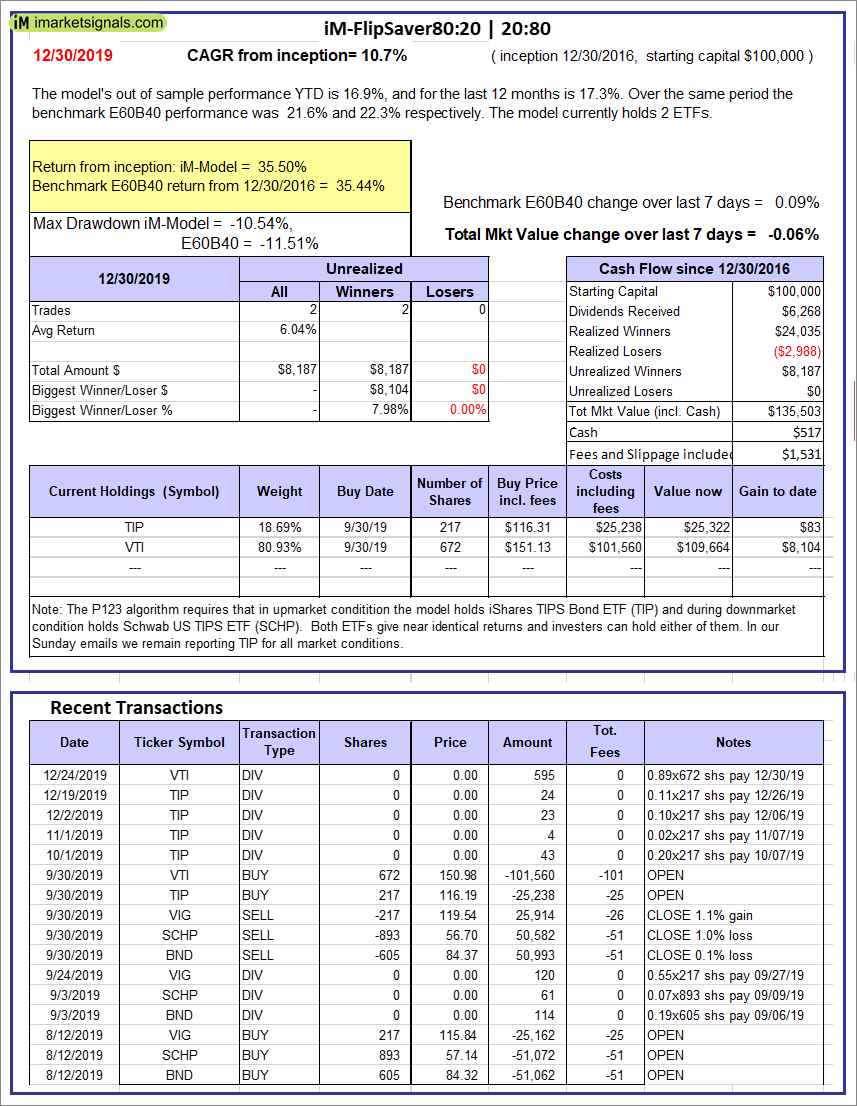 |
iM-FlipSaver 80:20 | 20:80 – 2017: The model’s out of sample performance YTD is 16.9%, and for the last 12 months is 17.3%. Over the same period the benchmark E60B40 performance was 21.6% and 22.3% respectively. Over the previous week the market value of iM-FlipSaver 80:20 | 20:80 gained -0.06% at a time when SPY gained 0.09%. A starting capital of $100,000 at inception on 1/2/2017 would have grown to $135,503 which includes $517 cash and excludes $1,531 spent on fees and slippage. |
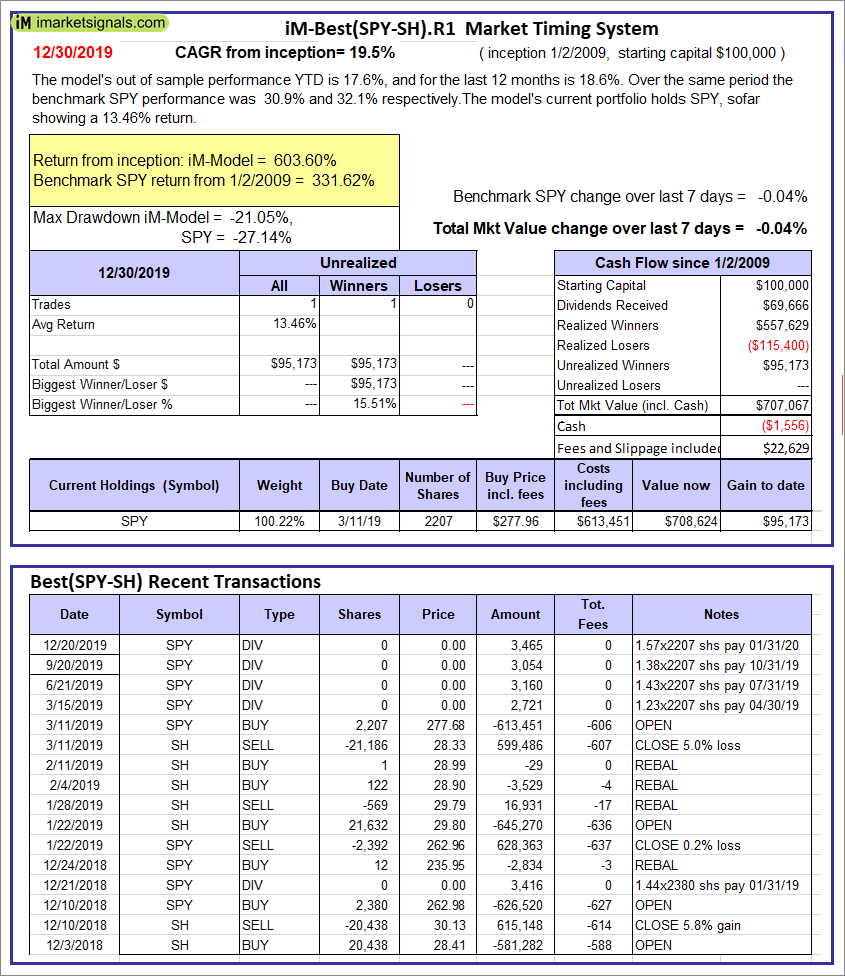 |
iM-Best(SPY-SH).R1: The model’s out of sample performance YTD is 17.6%, and for the last 12 months is 18.6%. Over the same period the benchmark SPY performance was 30.9% and 32.1% respectively. Over the previous week the market value of Best(SPY-SH) gained -0.04% at a time when SPY gained -0.04%. A starting capital of $100,000 at inception on 1/2/2009 would have grown to $707,067 which includes -$1,556 cash and excludes $22,629 spent on fees and slippage. |
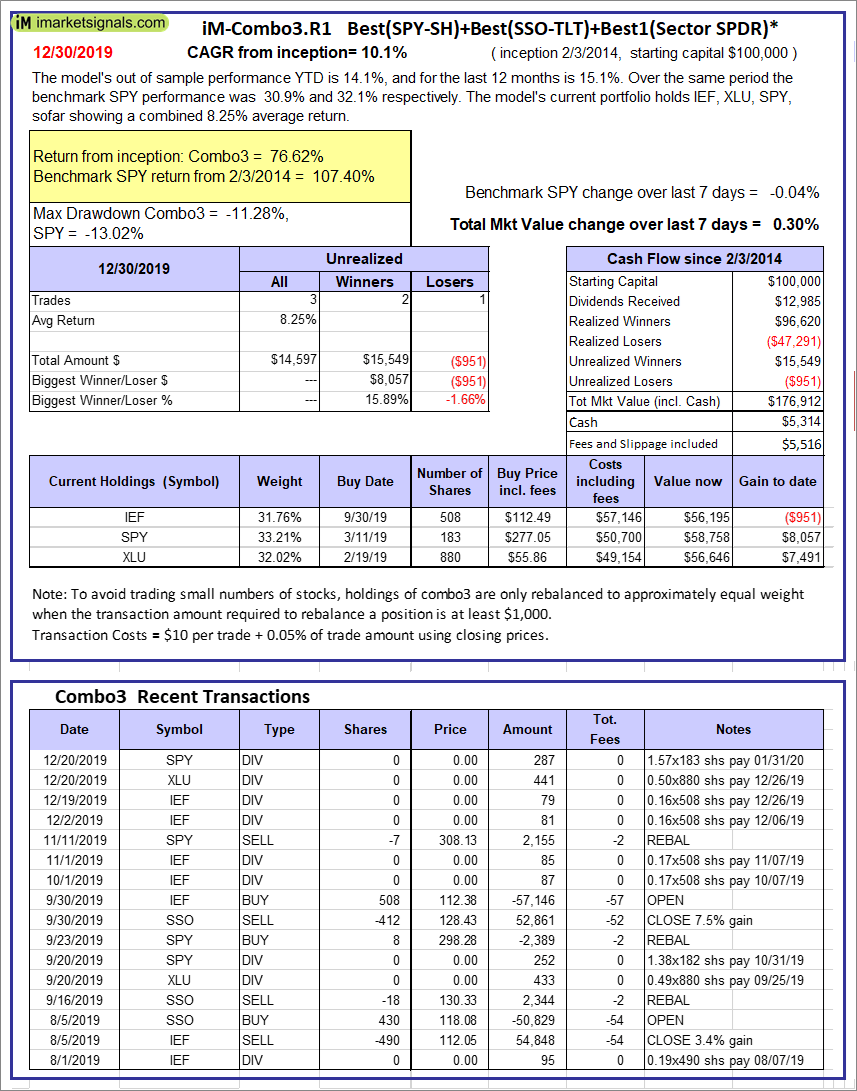 |
iM-Combo3.R1: The model’s out of sample performance YTD is 14.1%, and for the last 12 months is 15.1%. Over the same period the benchmark SPY performance was 30.9% and 32.1% respectively. Over the previous week the market value of iM-Combo3.R1 gained 0.30% at a time when SPY gained -0.04%. A starting capital of $100,000 at inception on 2/3/2014 would have grown to $176,912 which includes $5,314 cash and excludes $5,516 spent on fees and slippage. |
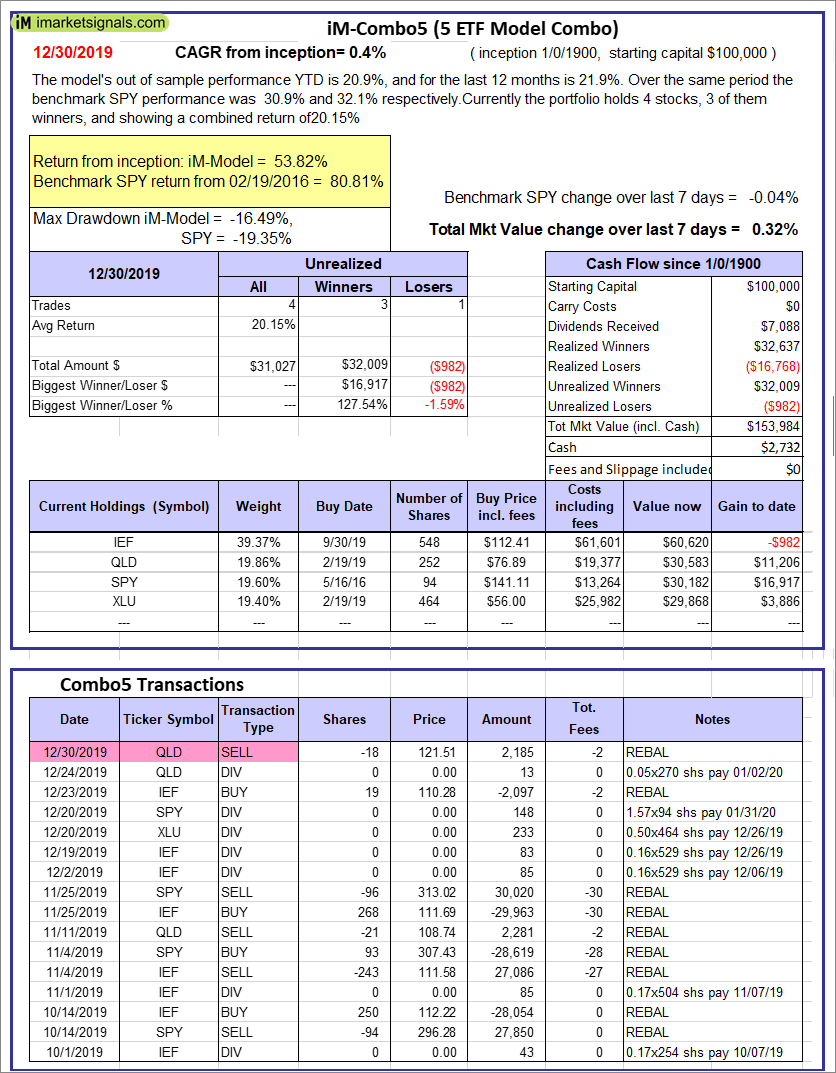 |
iM-Combo5: The model’s out of sample performance YTD is 20.9%, and for the last 12 months is 21.9%. Over the same period the benchmark SPY performance was 30.9% and 32.1% respectively. Over the previous week the market value of iM-Combo5 gained 0.32% at a time when SPY gained -0.04%. A starting capital of $100,000 at inception on 2/22/2016 would have grown to $153,984 which includes $2,732 cash and excludes $0 spent on fees and slippage. |
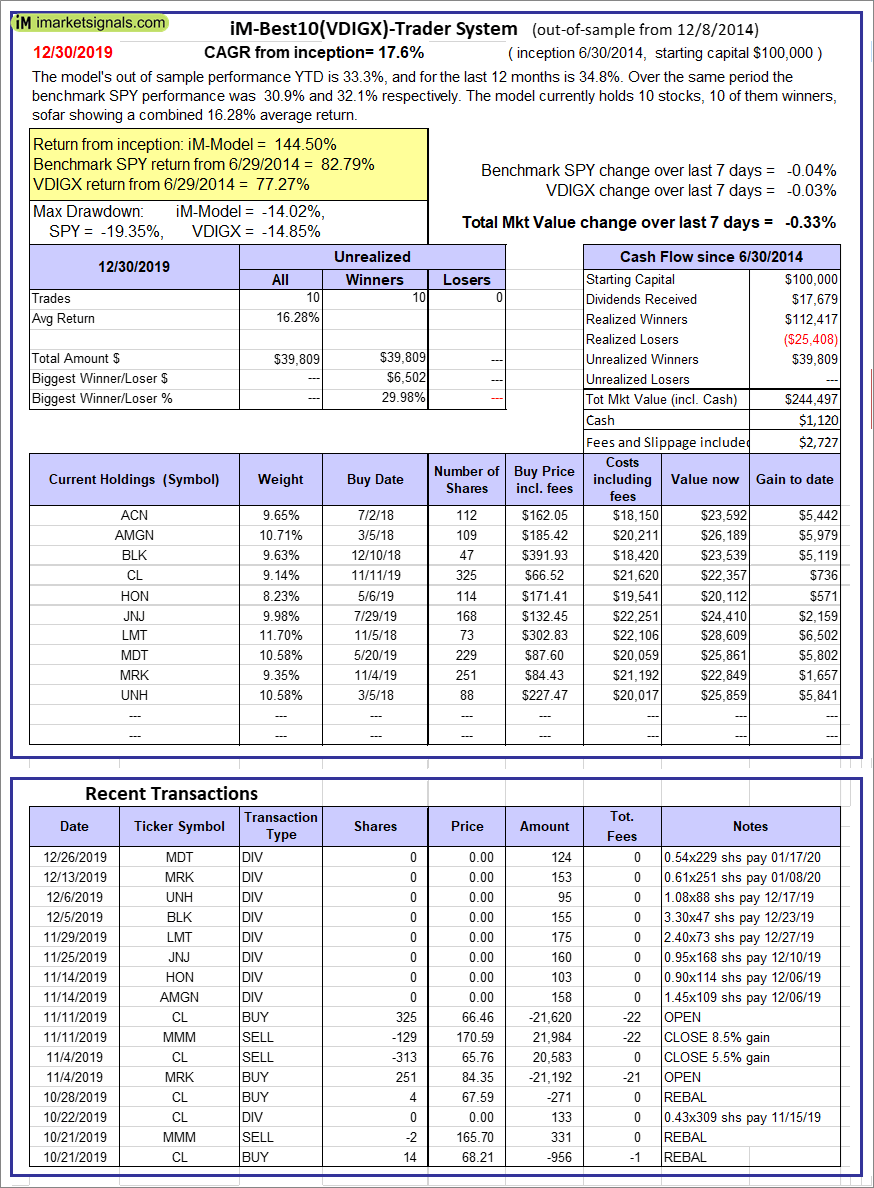 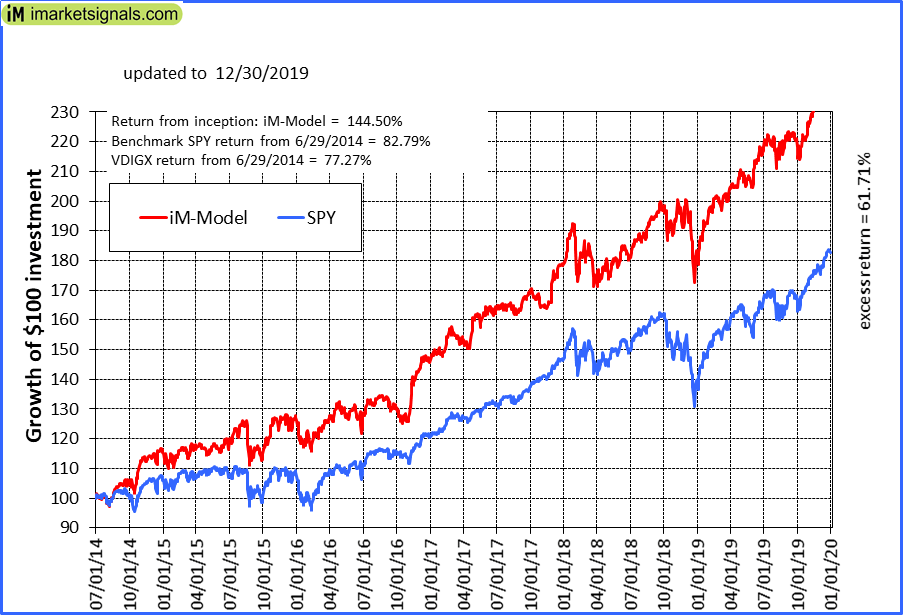 |
iM-Best10(VDIGX)-Trader: The model’s out of sample performance YTD is 33.3%, and for the last 12 months is 34.8%. Over the same period the benchmark SPY performance was 30.9% and 32.1% respectively. Since inception, on 7/1/2014, the model gained 144.50% while the benchmark SPY gained 82.79% and VDIGX gained 77.27% over the same period. Over the previous week the market value of iM-Best10(VDIGX) gained -0.33% at a time when SPY gained -0.04%. A starting capital of $100,000 at inception on 7/1/2014 would have grown to $244,497 which includes $1,120 cash and excludes $2,727 spent on fees and slippage. |
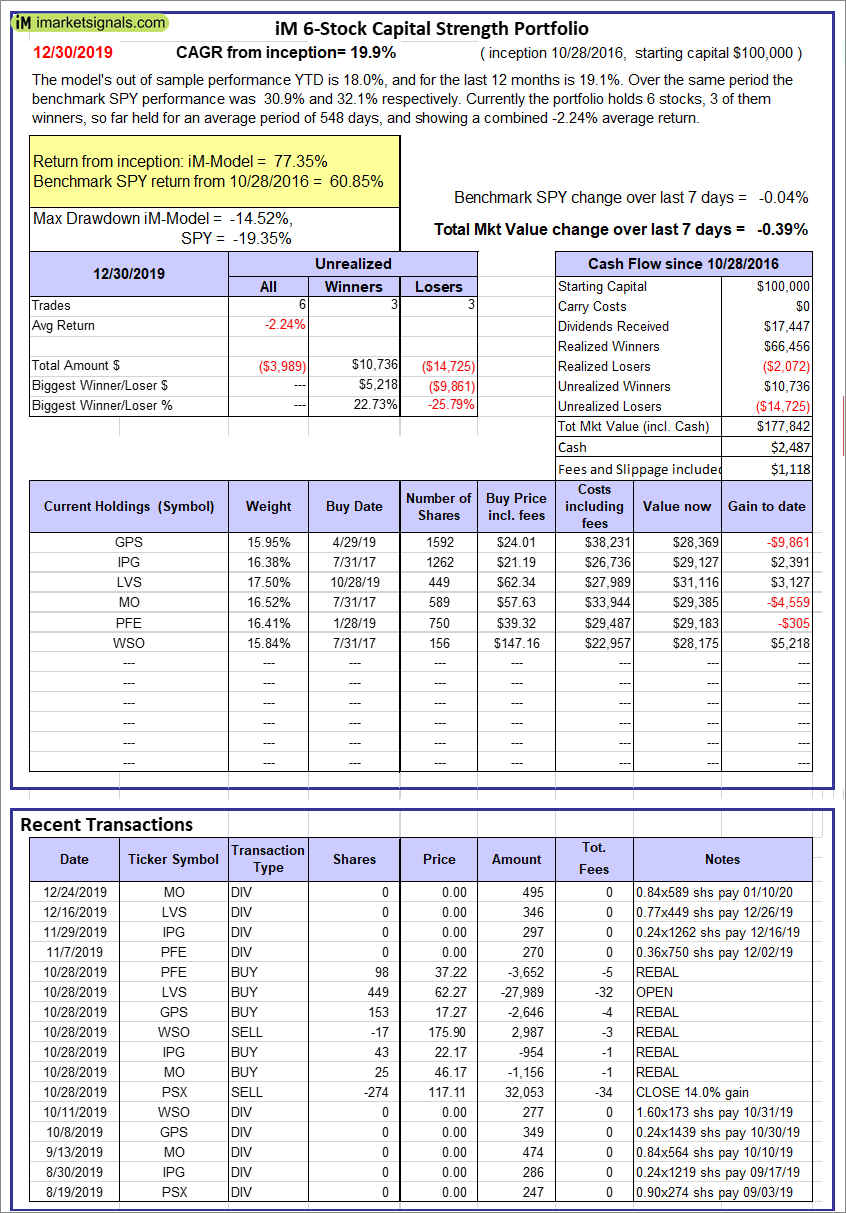 |
iM 6-Stock Capital Strength Portfolio: The model’s out of sample performance YTD is 18.0%, and for the last 12 months is 19.1%. Over the same period the benchmark SPY performance was 30.9% and 32.1% respectively. Over the previous week the market value of the iM 6-Stock Capital Strength Portfolio gained -0.39% at a time when SPY gained -0.04%. A starting capital of $100,000 at inception on 10/28/2016 would have grown to $177,842 which includes $2,487 cash and excludes $1,118 spent on fees and slippage. |
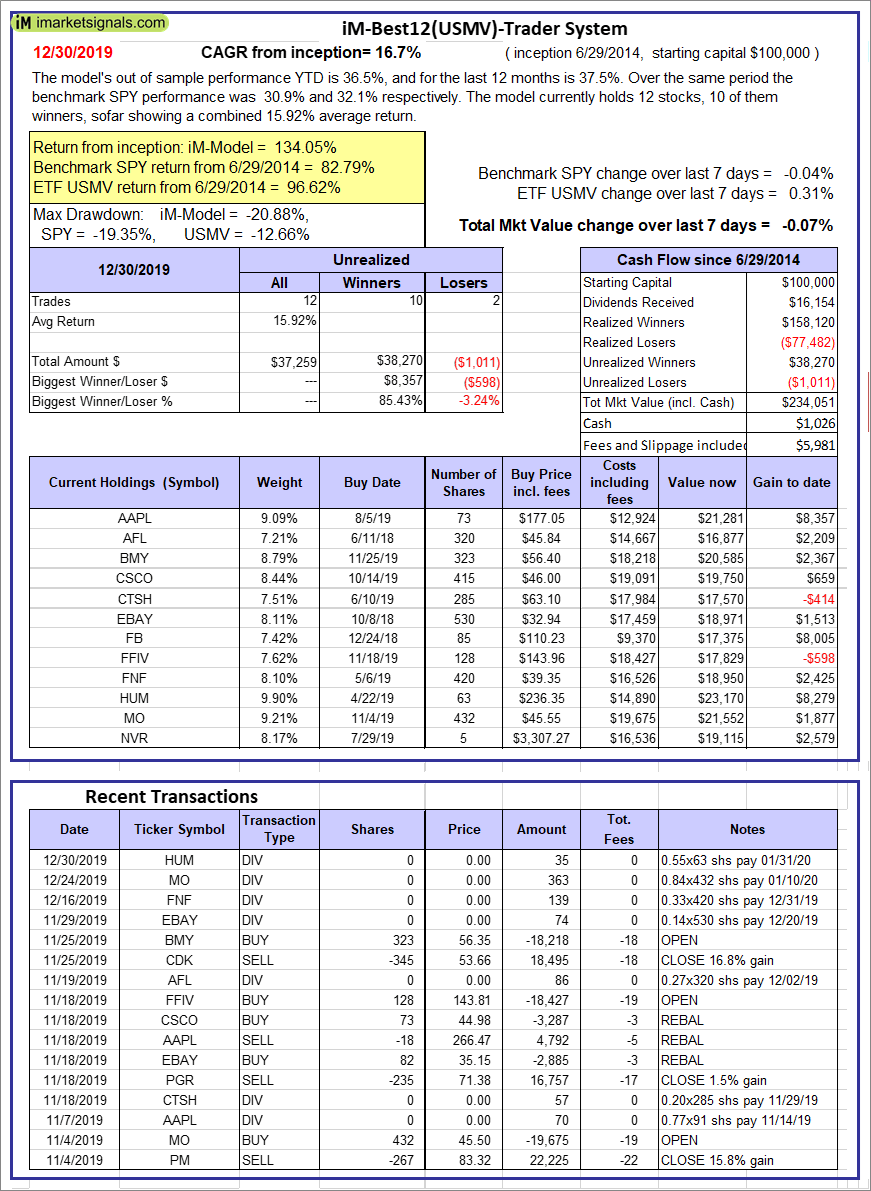 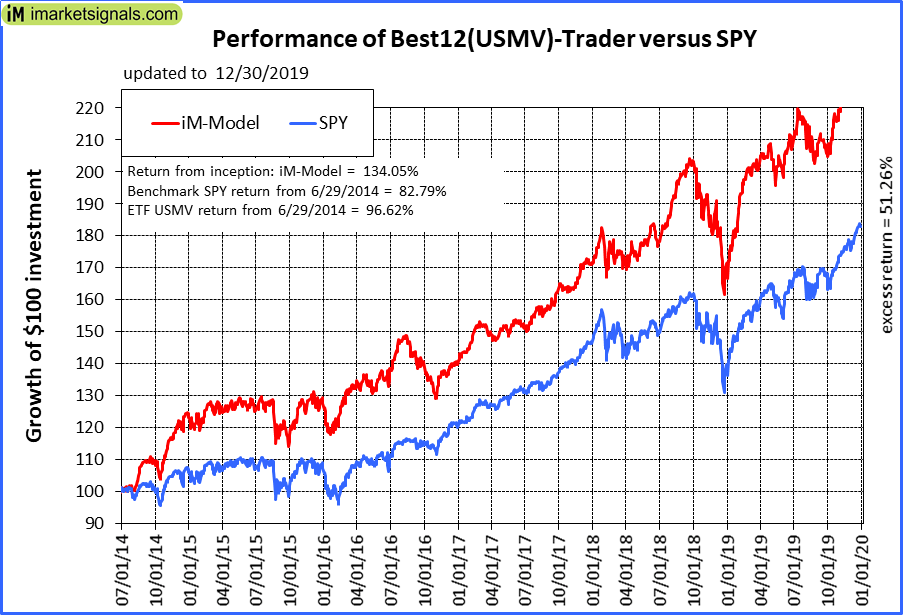 |
iM-Best12(USMV)-Trader: The model’s out of sample performance YTD is 36.5%, and for the last 12 months is 37.5%. Over the same period the benchmark SPY performance was 30.9% and 32.1% respectively. Since inception, on 6/30/2014, the model gained 134.05% while the benchmark SPY gained 82.79% and the ETF USMV gained 96.62% over the same period. Over the previous week the market value of iM-Best12(USMV)-Trader gained -0.07% at a time when SPY gained -0.04%. A starting capital of $100,000 at inception on 6/30/2014 would have grown to $234,051 which includes $1,026 cash and excludes $5,981 spent on fees and slippage. |
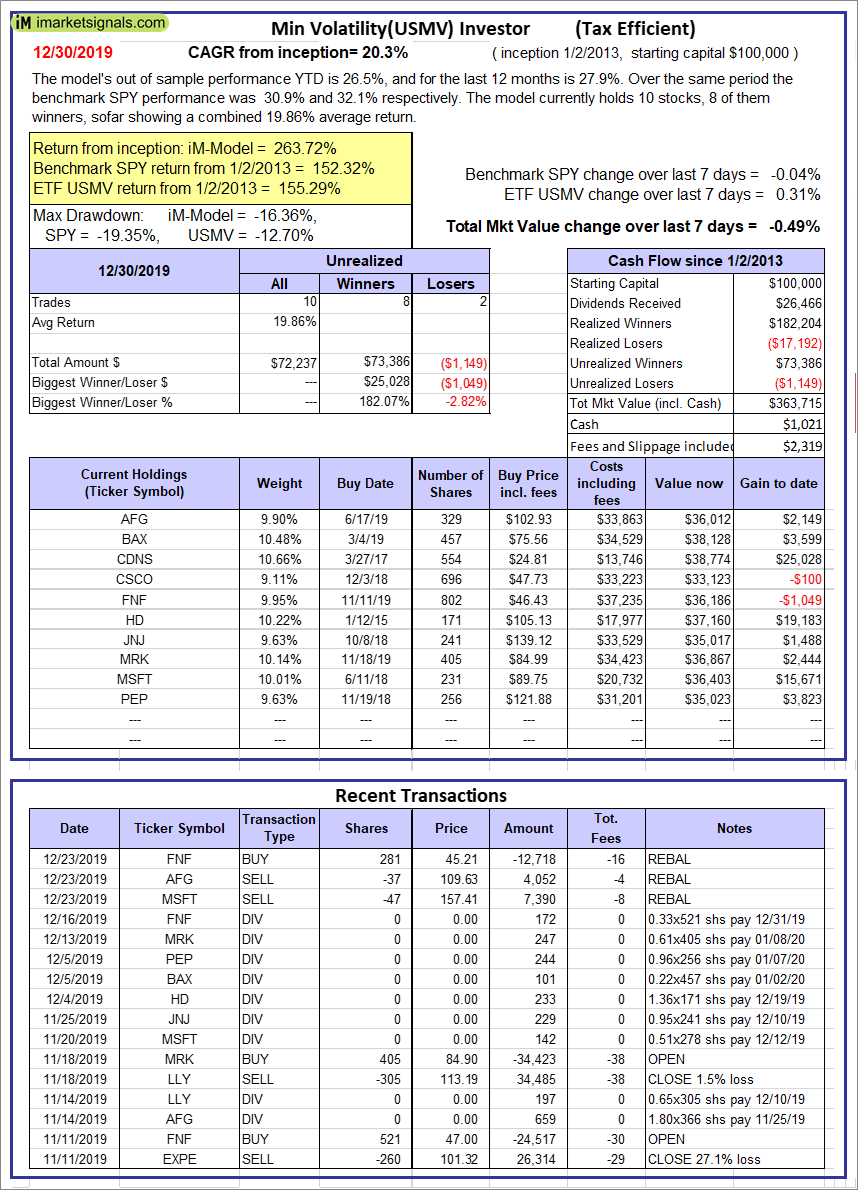 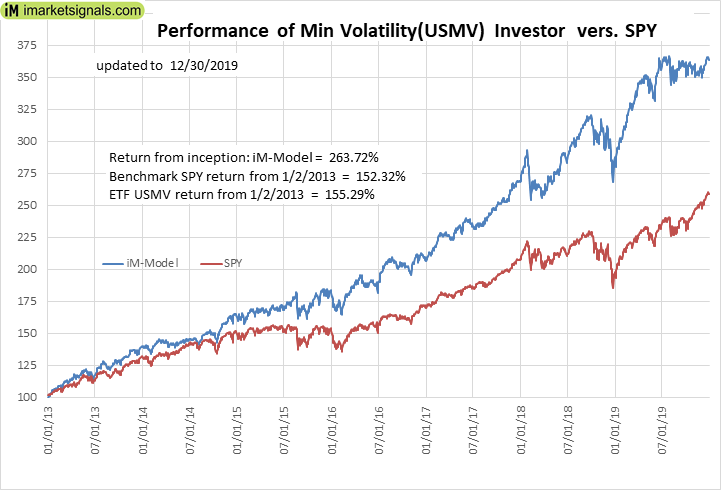 |
iM-Min Volatility(USMV) Investor (Tax Efficient): The model’s out of sample performance YTD is 26.5%, and for the last 12 months is 27.9%. Over the same period the benchmark SPY performance was 30.9% and 32.1% respectively. Since inception, on 1/3/2013, the model gained 263.72% while the benchmark SPY gained 152.32% and the ETF USMV gained 155.29% over the same period. Over the previous week the market value of iM-Best12(USMV)Q1 gained -0.49% at a time when SPY gained -0.04%. A starting capital of $100,000 at inception on 1/3/2013 would have grown to $363,715 which includes $1,021 cash and excludes $2,319 spent on fees and slippage. |
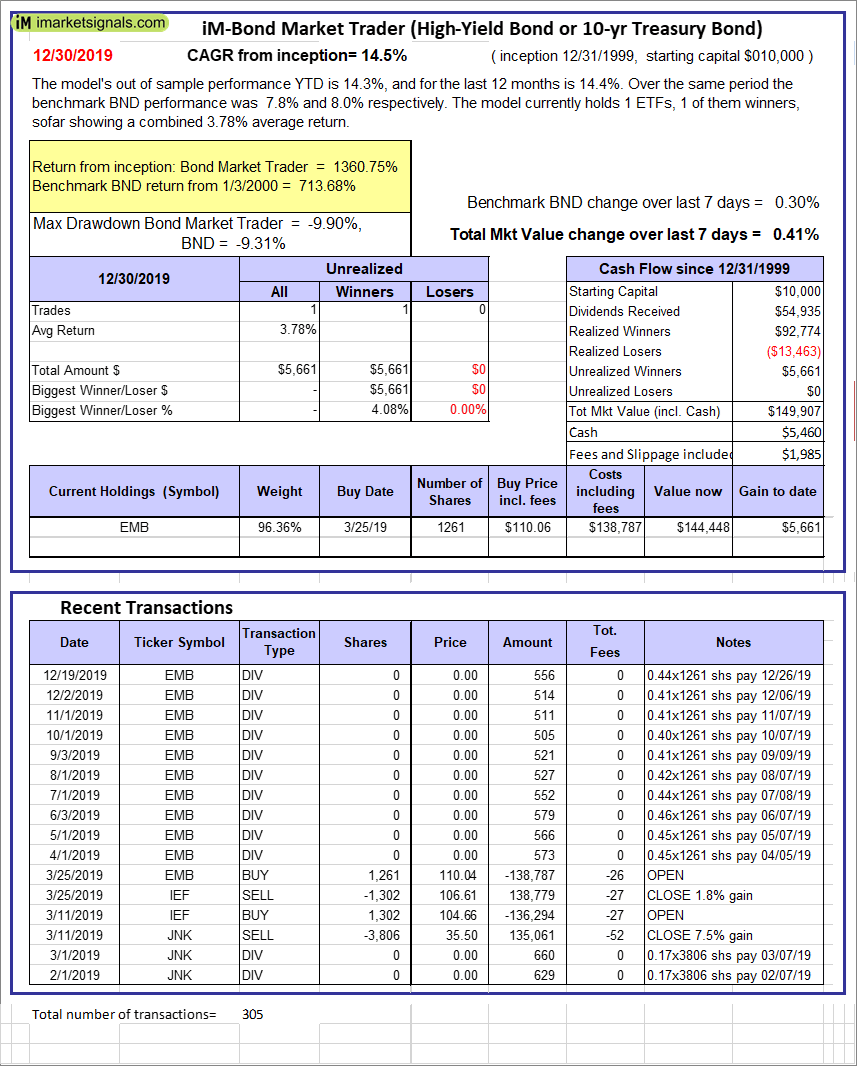 |
iM-Bond Market Trader (High-Yield Bond or 10-yr Treasury Bond): The model’s out of sample performance YTD is 13.3%, and for the last 12 months is 14.3%. Over the same period the benchmark SPY performance was 30.9% and 32.1% respectively. Over the previous week the market value of the iM-Bond Market Trader (High-Yield Bond or 10-yr Treasury Bond) gained 0.41% at a time when BND gained 0.30%. A starting capital of $100,000 at inception on 10/30/2016 would have grown to $149,907 which includes $5,460 cash and excludes $1,985 spent on fees and slippage. |
 |
iM-Best(Short): The model’s out of sample performance YTD is -9.6%, and for the last 12 months is -9.8%. Over the same period the benchmark SPY performance was 30.9% and 32.1% respectively. Over the previous week the market value of iM-Best(Short) gained -0.48% at a time when SPY gained -0.04%. Over the period 1/2/2009 to 12/30/2019 the starting capital of $100,000 would have grown to $80,433 which includes $110,763 cash and excludes $26,977 spent on fees and slippage. |
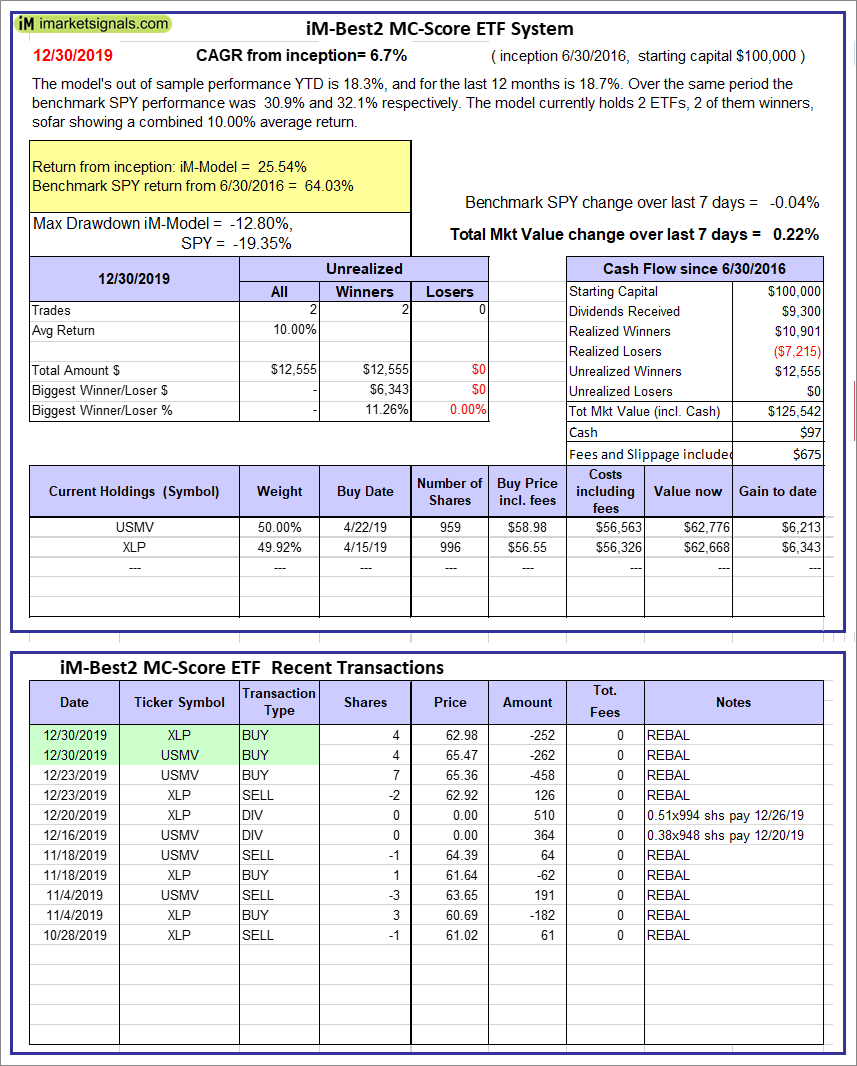 |
iM-Best2 MC-Score ETF System: The model’s out of sample performance YTD is 18.3%, and for the last 12 months is 18.7%. Over the same period the benchmark SPY performance was 30.9% and 32.1% respectively. Over the previous week the market value of the iM-Best2 MC-Score ETF System gained 0.22% at a time when SPY gained -0.04%. A starting capital of $100,000 at inception on 6/30/2016 would have grown to $125,542 which includes $97 cash and excludes $675 spent on fees and slippage. |
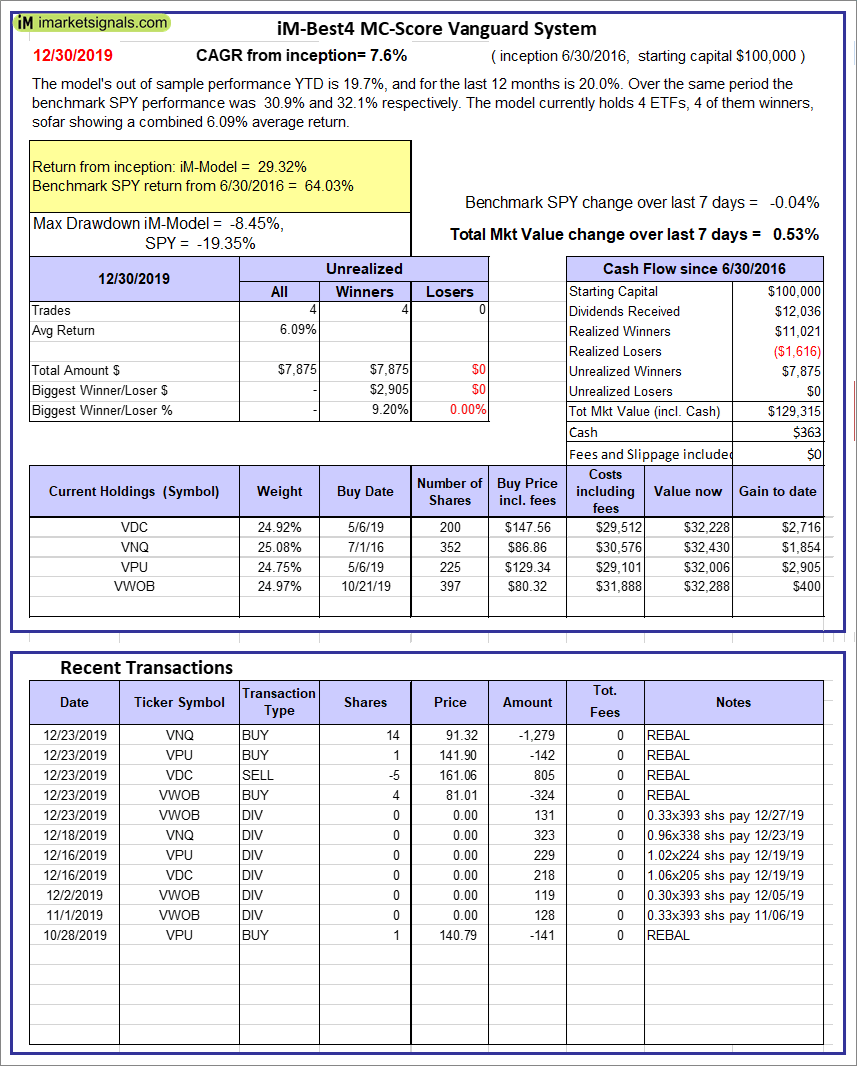 |
iM-Best4 MC-Score Vanguard System: The model’s out of sample performance YTD is 19.7%, and for the last 12 months is 20.0%. Over the same period the benchmark SPY performance was 30.9% and 32.1% respectively. Over the previous week the market value of the iM-Best4 MC-Score Vanguard System gained 0.53% at a time when SPY gained -0.04%. A starting capital of $100,000 at inception on 6/30/2016 would have grown to $129,315 which includes $363 cash and excludes $00 spent on fees and slippage. |
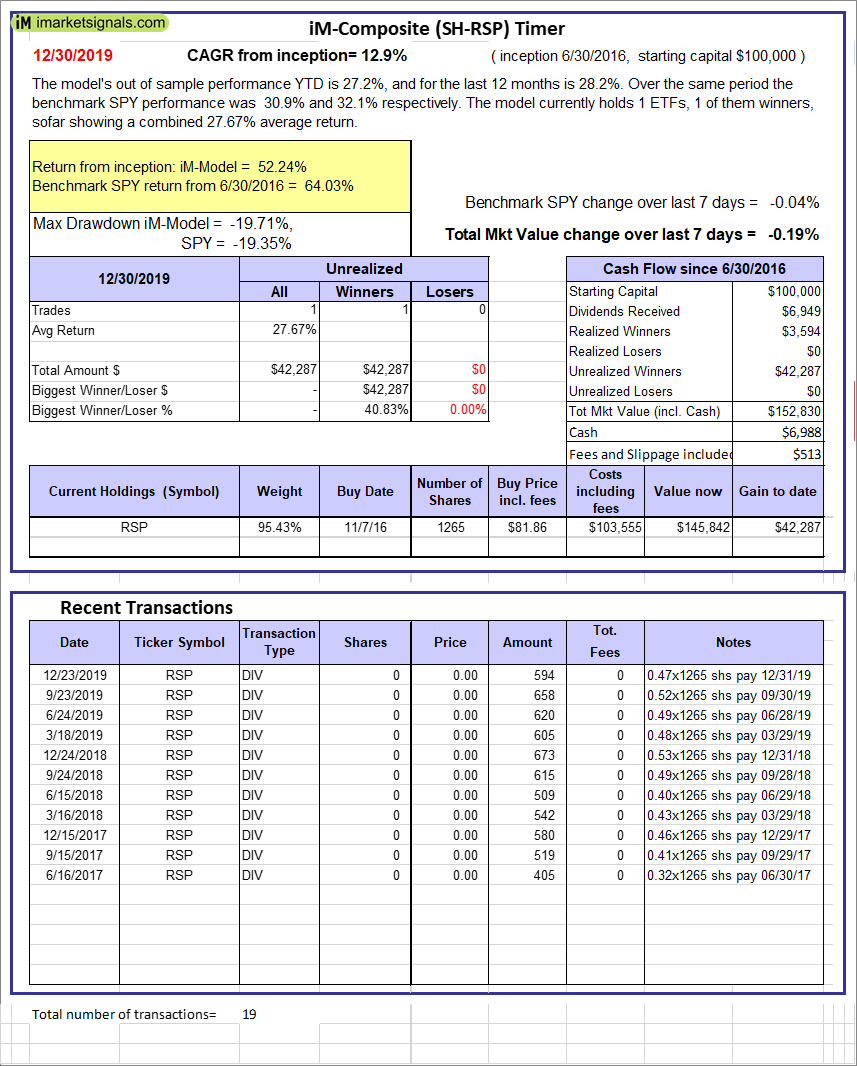 |
iM-Composite (SH-RSP) Timer: The model’s out of sample performance YTD is 27.2%, and for the last 12 months is 28.2%. Over the same period the benchmark SPY performance was 30.9% and 32.1% respectively. Over the previous week the market value of the iM-Composite (SH-RSP) Timer gained -0.19% at a time when SPY gained -0.04%. A starting capital of $100,000 at inception on 6/30/2016 would have grown to $152,830 which includes $6,988 cash and excludes $513 spent on fees and slippage. |
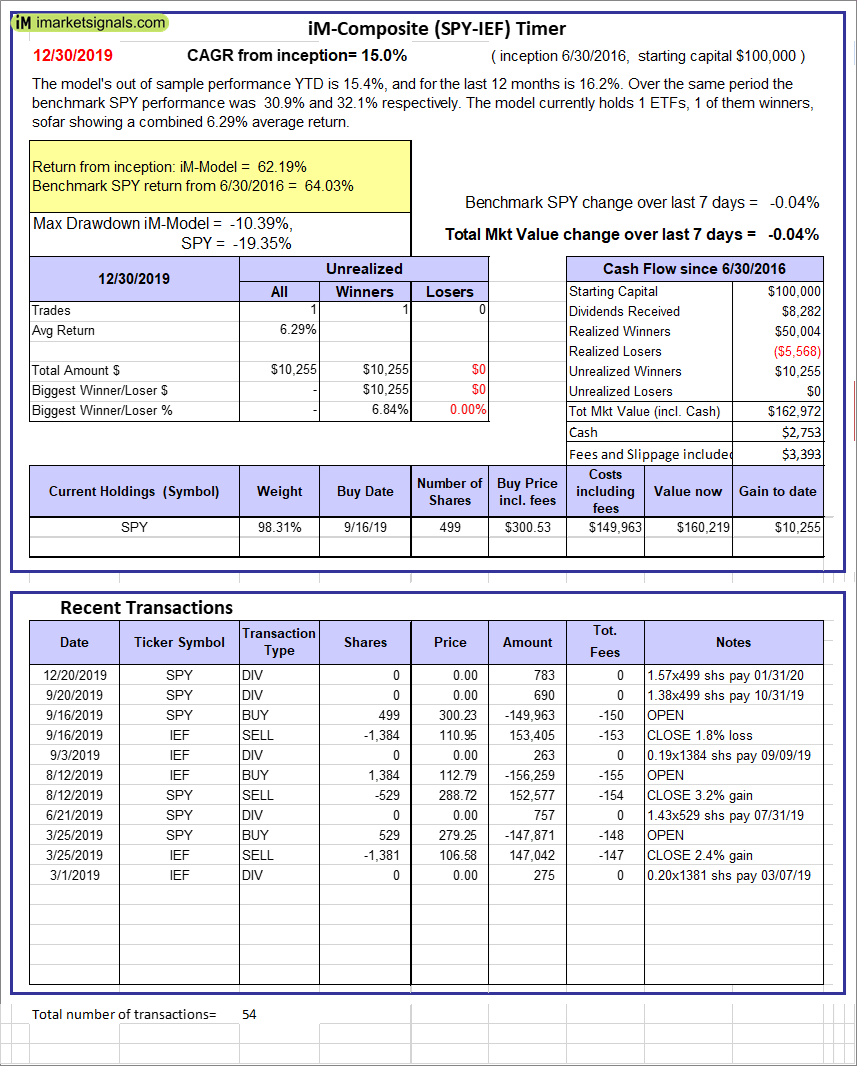 |
iM-Composite (SPY-IEF) Timer: The model’s out of sample performance YTD is 15.4%, and for the last 12 months is 16.2%. Over the same period the benchmark SPY performance was 30.9% and 32.1% respectively. Over the previous week the market value of the iM-Composite (SPY-IEF) Timer gained -0.04% at a time when SPY gained -0.04%. A starting capital of $100,000 at inception on 6/30/2016 would have grown to $162,972 which includes $2,753 cash and excludes $3,393 spent on fees and slippage. |
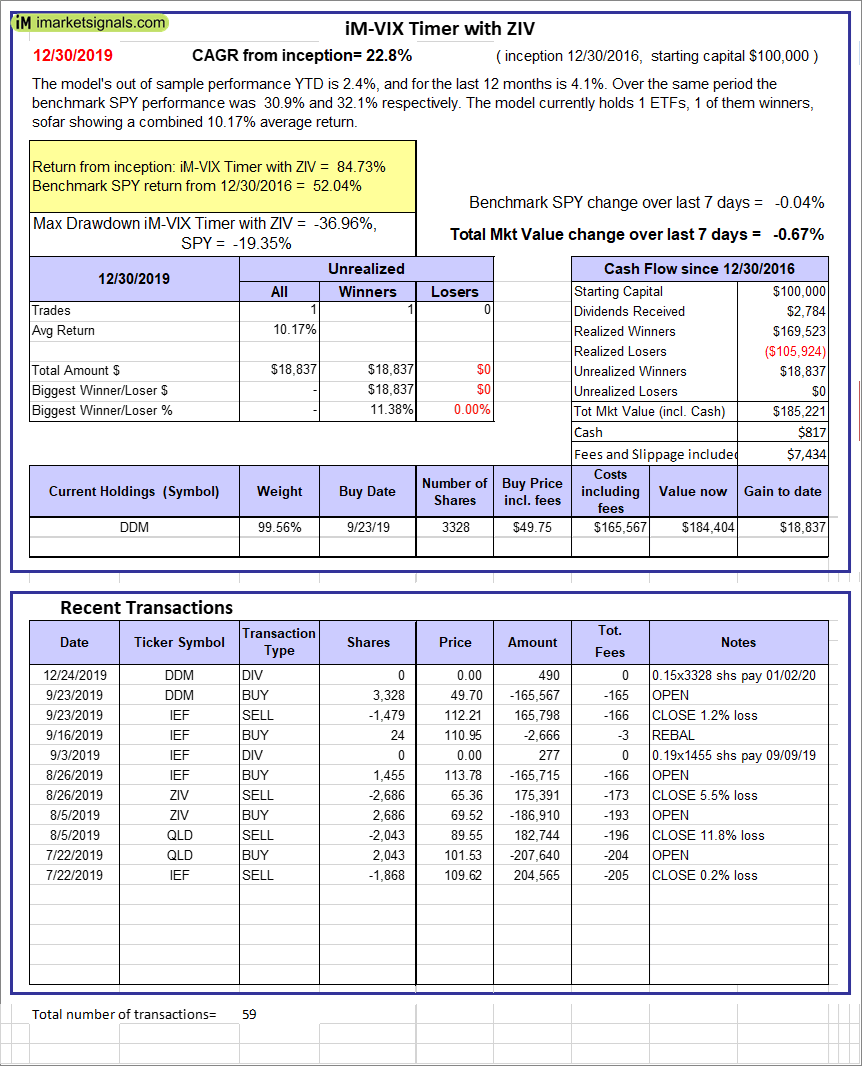 |
iM-VIX Timer with ZIV: The model’s out of sample performance YTD is 2.4%, and for the last 12 months is 4.1%. Over the same period the benchmark SPY performance was 30.9% and 32.1% respectively. Over the previous week the market value of the iM-VIX Timer with ZIV gained -0.67% at a time when SPY gained -0.04%. A starting capital of $100,000 at inception on 6/30/2016 would have grown to $185,221 which includes $817 cash and excludes $7,434 spent on fees and slippage. |
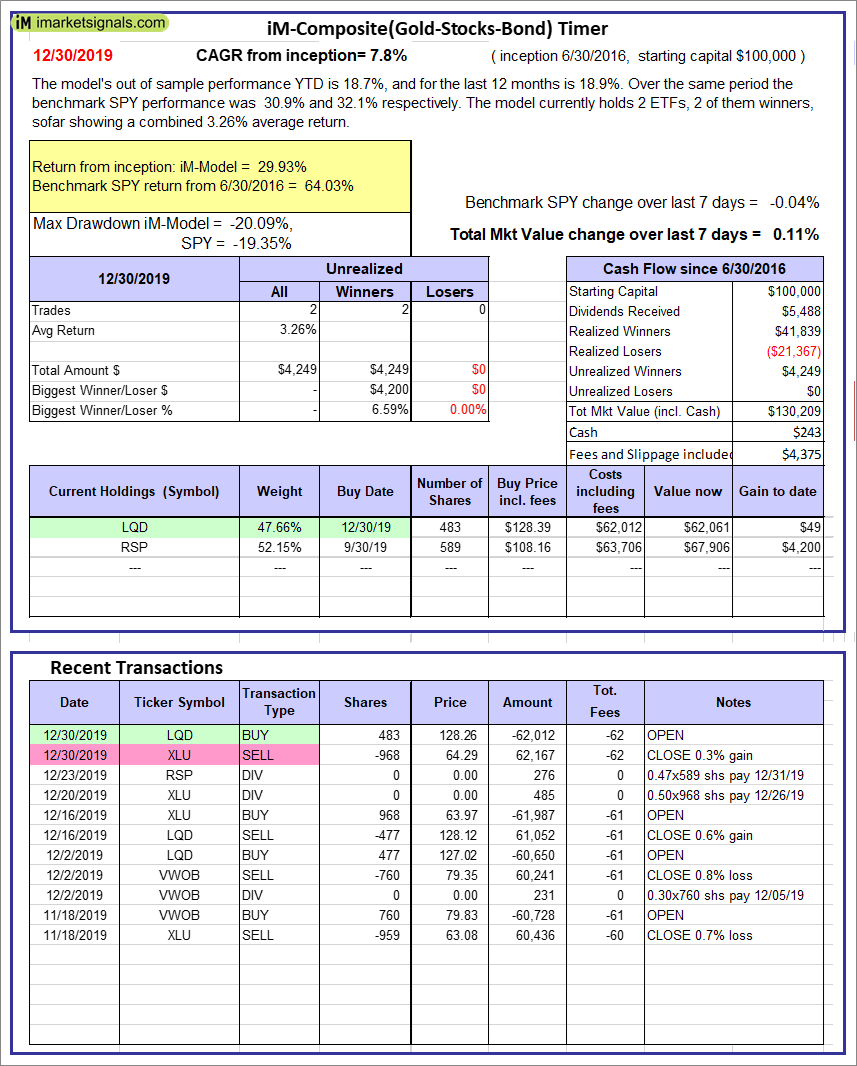 |
iM-Composite(Gold-Stocks-Bond) Timer: The model’s out of sample performance YTD is 18.7%, and for the last 12 months is 18.9%. Over the same period the benchmark SPY performance was 30.9% and 32.1% respectively. Over the previous week the market value of the iM-Composite(Gold-Stocks-Bond) Timer gained 0.11% at a time when SPY gained -0.04%. A starting capital of $100,000 at inception on 6/30/2016 would have grown to $130,209 which includes $243 cash and excludes $4,375 spent on fees and slippage. |
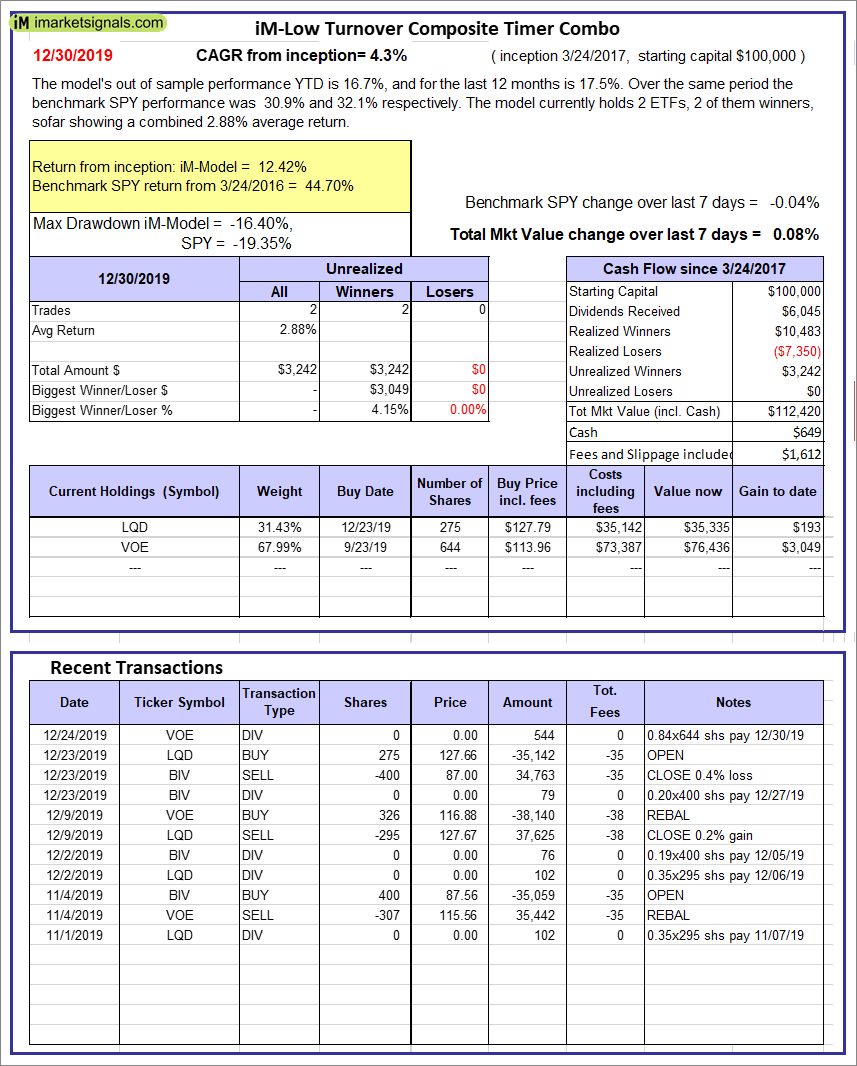 |
iM-Low Turnover Composite Timer Combo: The model’s out of sample performance YTD is 16.7%, and for the last 12 months is 17.5%. Over the same period the benchmark SPY performance was 30.9% and 32.1% respectively. Over the previous week the market value of the iM-Low Turnover Composite Timer Combo gained 0.08% at a time when SPY gained -0.04%. A starting capital of $100,000 at inception on 3/24/27 would have grown to $112,420 which includes $649 cash and excludes $1,612 spent on fees and slippage. |
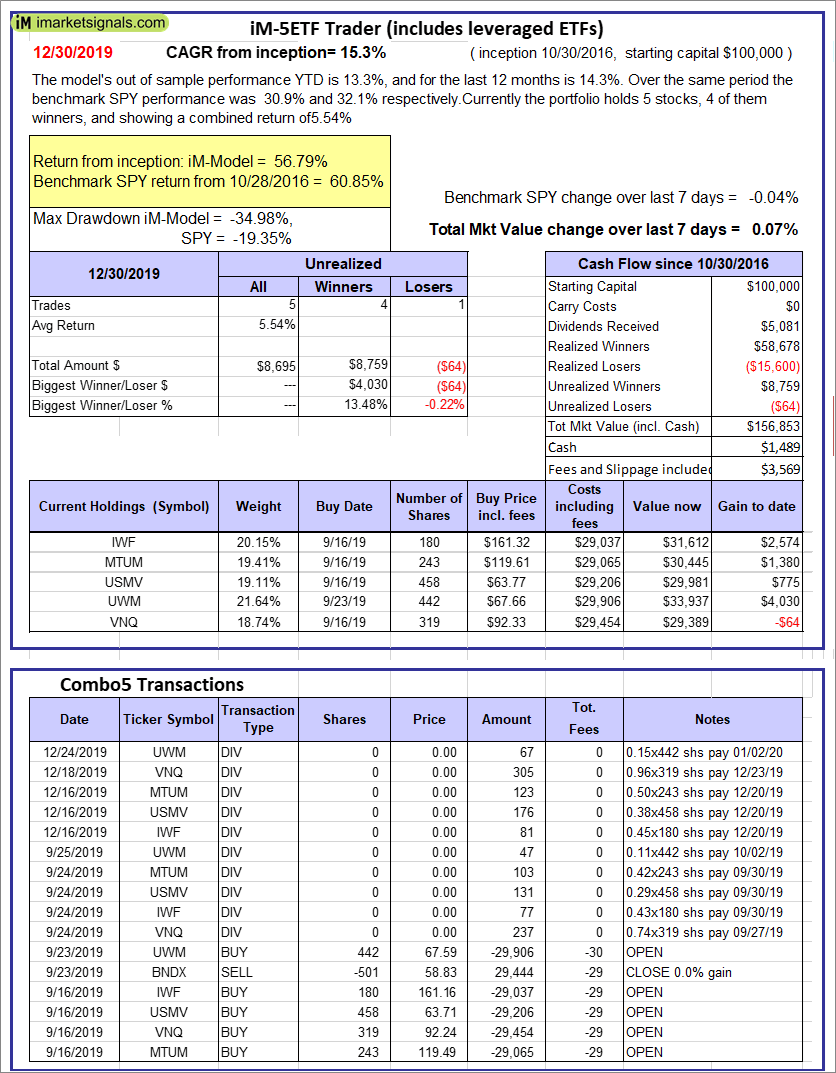 |
iM-5ETF Trader (includes leveraged ETFs): The model’s out of sample performance YTD is 13.3%, and for the last 12 months is 14.3%. Over the same period the benchmark SPY performance was 30.9% and 32.1% respectively. Over the previous week the market value of the iM-5ETF Trader (includes leveraged ETFs) gained 0.07% at a time when SPY gained -0.04%. A starting capital of $100,000 at inception on 10/30/2016 would have grown to $156,853 which includes $1,489 cash and excludes $3,569 spent on fees and slippage. |
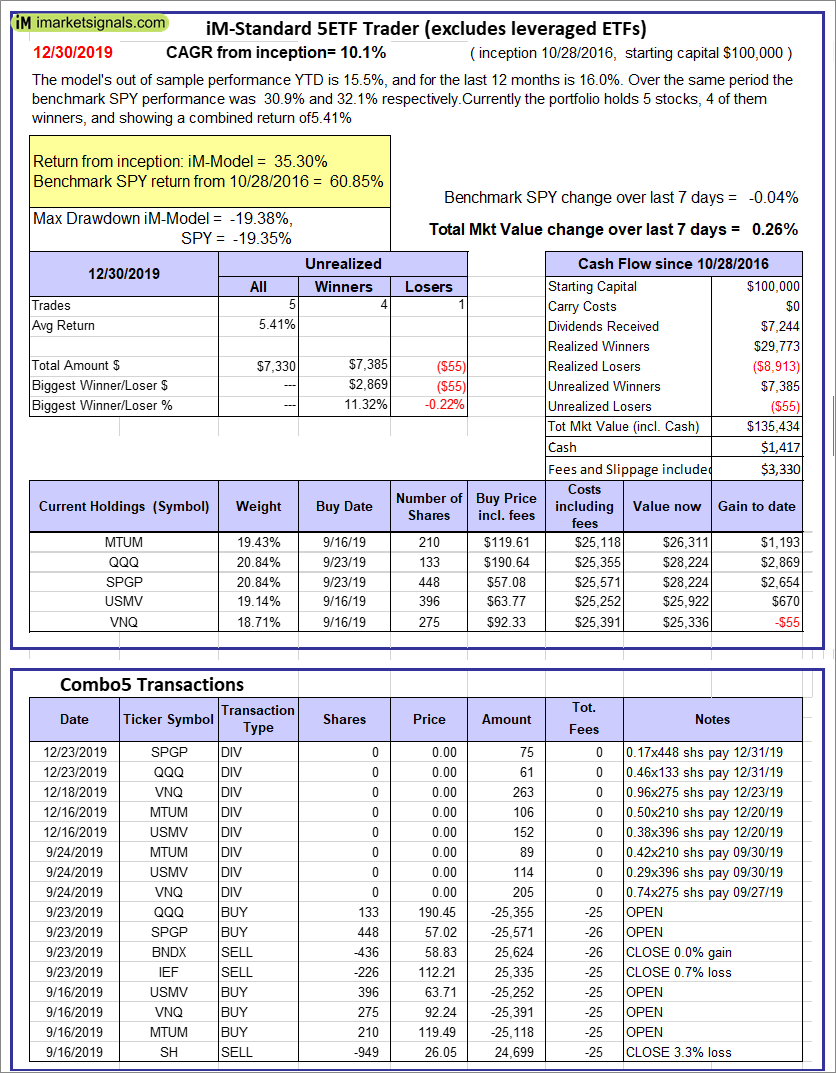 |
iM-Standard 5ETF Trader (excludes leveraged ETFs): The model’s out of sample performance YTD is 15.5%, and for the last 12 months is 16.0%. Over the same period the benchmark SPY performance was 30.9% and 32.1% respectively. Over the previous week the market value of the iM-Standard 5ETF Trader (excludes leveraged ETFs) gained 0.26% at a time when SPY gained -0.04%. A starting capital of $100,000 at inception on 10/30/2016 would have grown to $135,434 which includes $1,417 cash and excludes $3,330 spent on fees and slippage. |
iM-Best Reports – 12/30/2019
Posted in pmp SPY-SH
Leave a Reply
You must be logged in to post a comment.