
  |
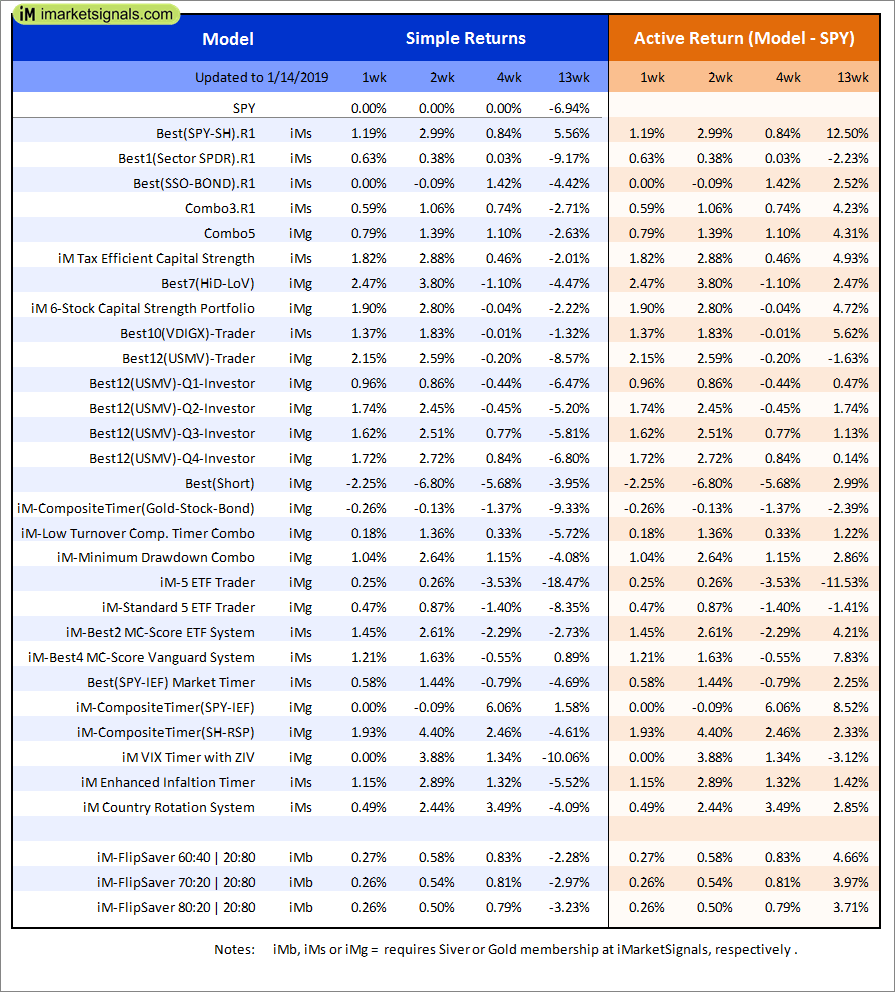
Out of sample performance summary of our models for the past 1, 2, 4 and 13 week periods. The active active return indicates how the models over- or underperformed the benchmark ETF SPY. Also the YTD, and the 1-, 3-, 5- and 10-year annualized returns are shown in the second table |
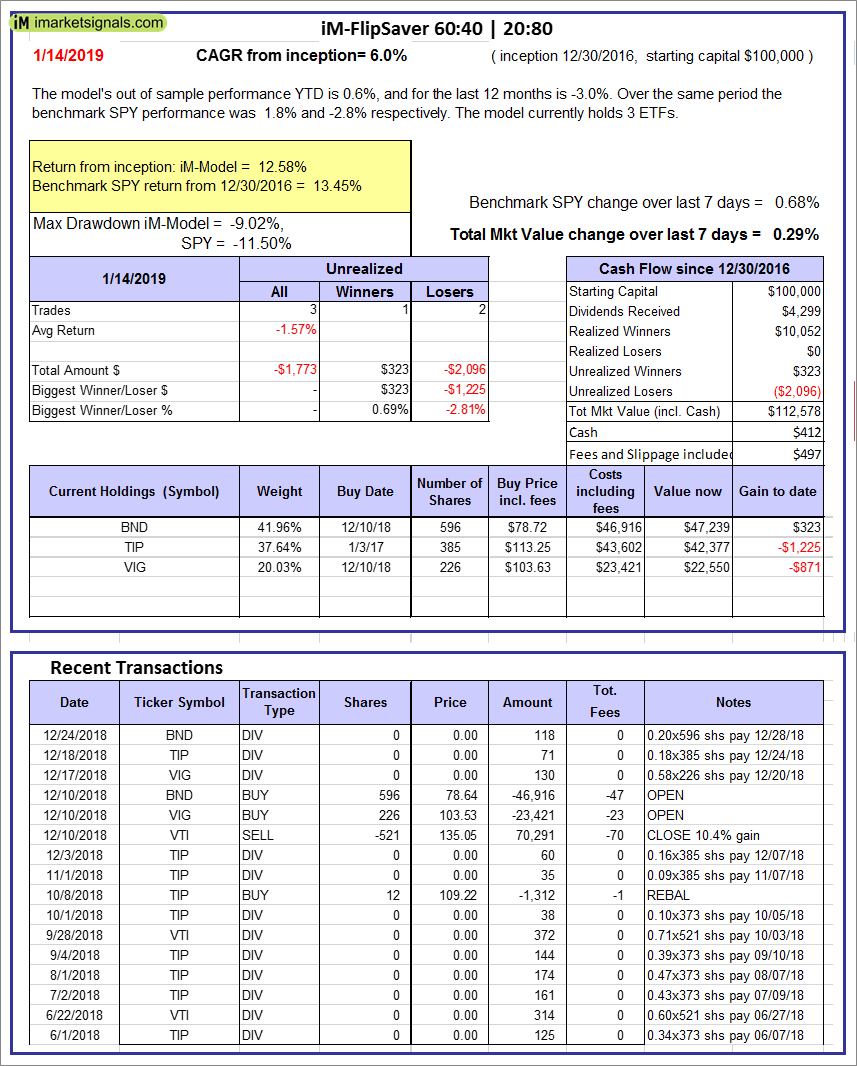 |
iM-FlipSaver 60:40 | 20:80 – 2017: The model’s out of sample performance YTD is 0.6%, and for the last 12 months is -3.0%. Over the same period the benchmark SPY performance was 1.8% and -2.8% respectively. Over the previous week the market value of iM-FlipSaver 80:20 | 20:80 gained 0.29% at a time when SPY gained 0.68%. A starting capital of $100,000 at inception on 7/16/2015 would have grown to $112,578 which includes $412 cash and excludes $497 spent on fees and slippage. |
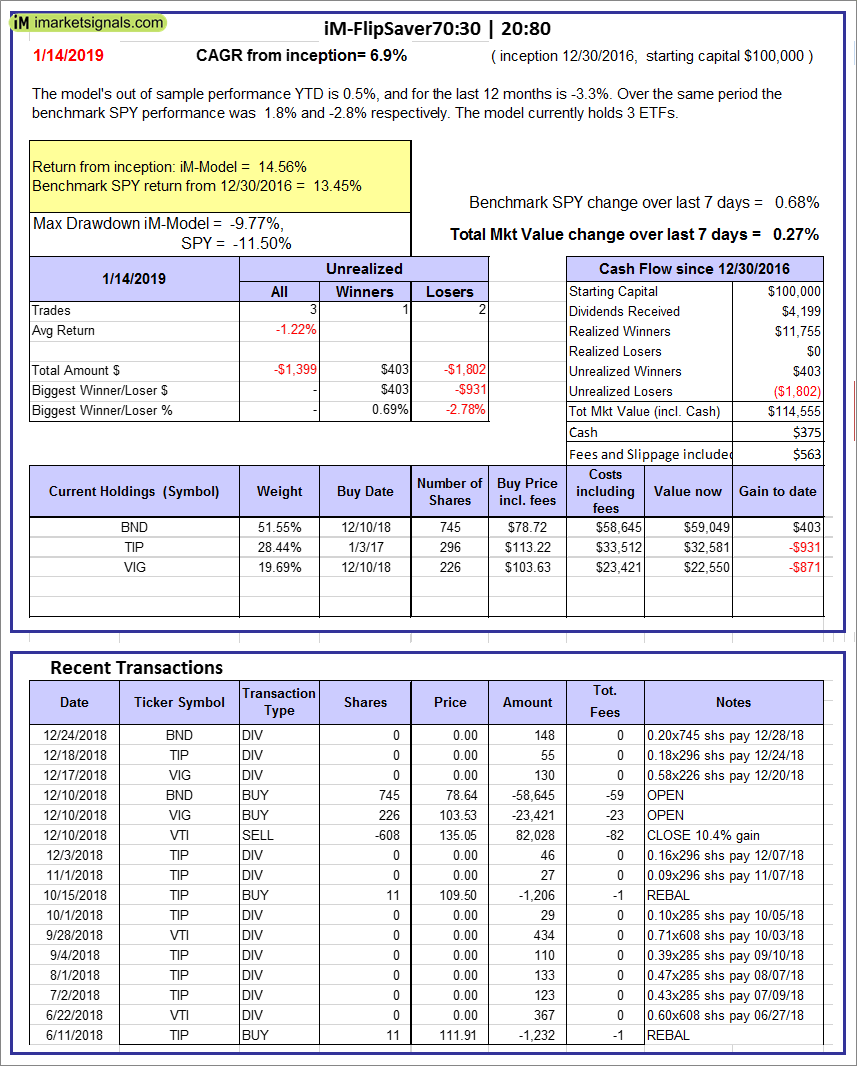 |
iM-FlipSaver 70:30 | 20:80 – 2017: The model’s out of sample performance YTD is 0.5%, and for the last 12 months is -3.3%. Over the same period the benchmark SPY performance was 1.8% and -2.8% respectively. Over the previous week the market value of iM-FlipSaver 70:30 | 20:80 gained 0.27% at a time when SPY gained 0.68%. A starting capital of $100,000 at inception on 7/15/2015 would have grown to $114,555 which includes $375 cash and excludes $563 spent on fees and slippage. |
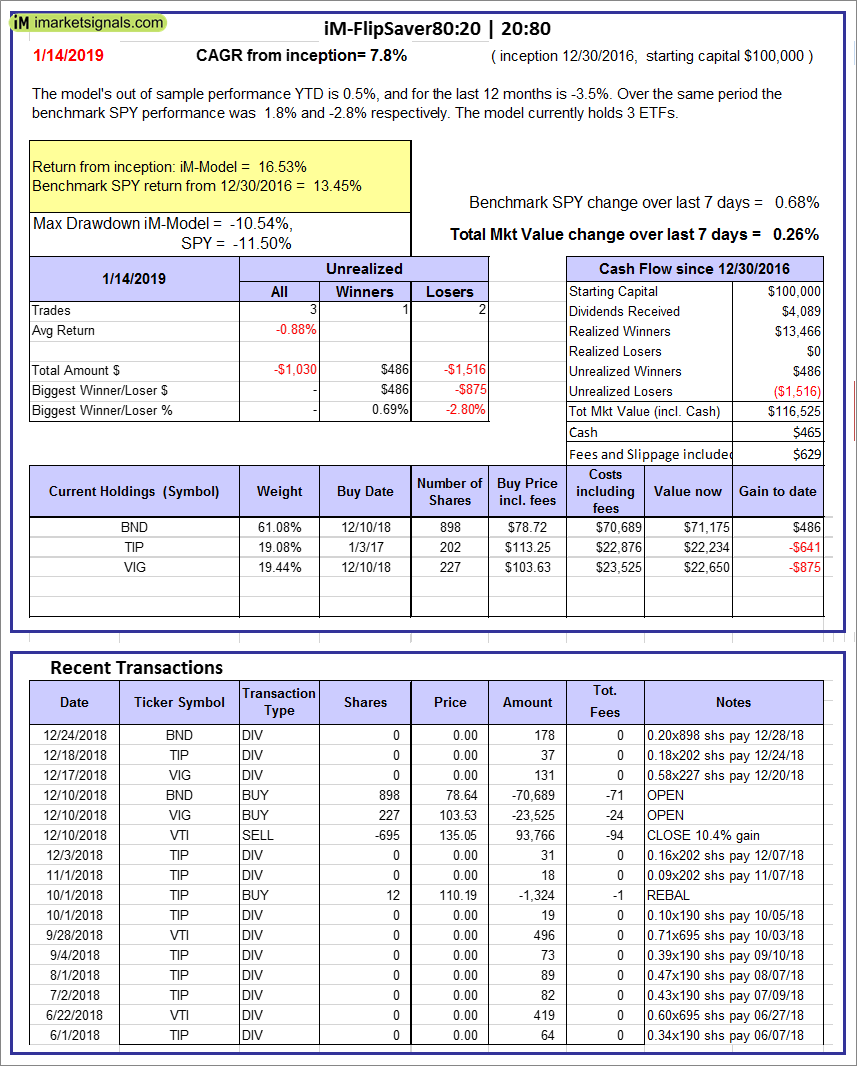 |
iM-FlipSaver 80:20 | 20:80 – 2017: The model’s out of sample performance YTD is 0.5%, and for the last 12 months is -3.5%. Over the same period the benchmark SPY performance was 1.8% and -2.8% respectively. Over the previous week the market value of iM-FlipSaver 80:20 | 20:80 gained 0.26% at a time when SPY gained 0.68%. A starting capital of $100,000 at inception on 1/2/2017 would have grown to $116,525 which includes $465 cash and excludes $629 spent on fees and slippage. |
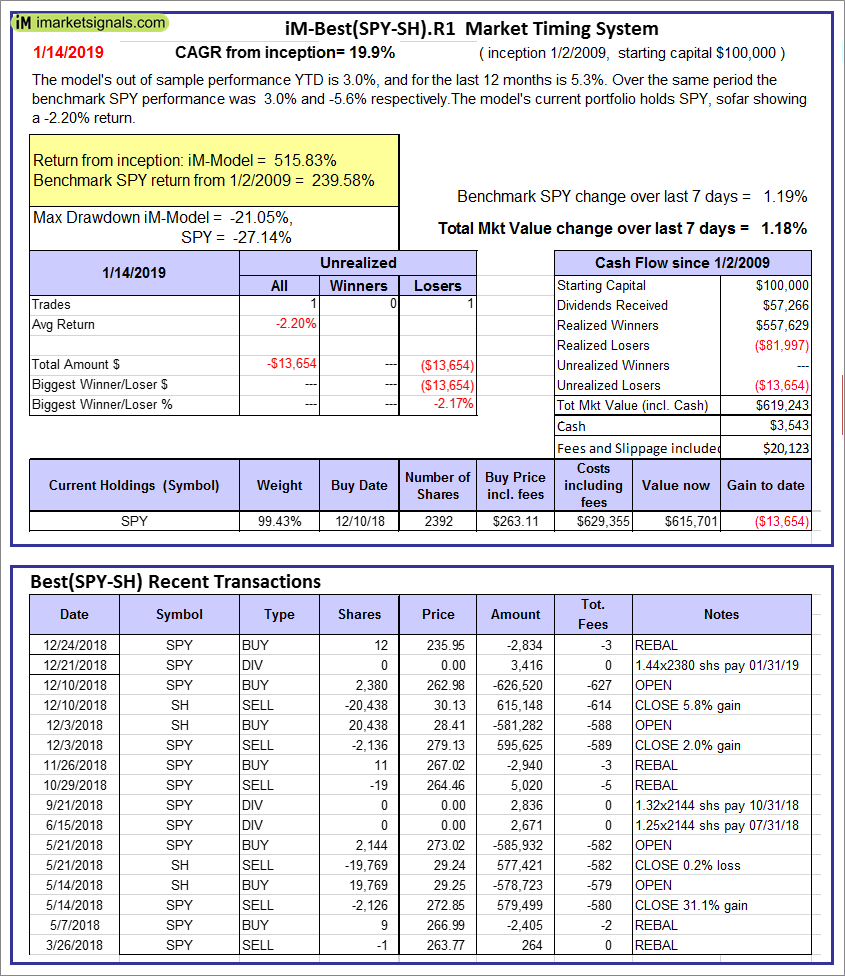 |
iM-Best(SPY-SH).R1: The model’s out of sample performance YTD is 3.0%, and for the last 12 months is 5.3%. Over the same period the benchmark SPY performance was 3.0% and -5.6% respectively. Over the previous week the market value of Best(SPY-SH) gained 1.18% at a time when SPY gained 1.19%. A starting capital of $100,000 at inception on 1/2/2009 would have grown to $619,243 which includes $3,543 cash and excludes $20,123 spent on fees and slippage. |
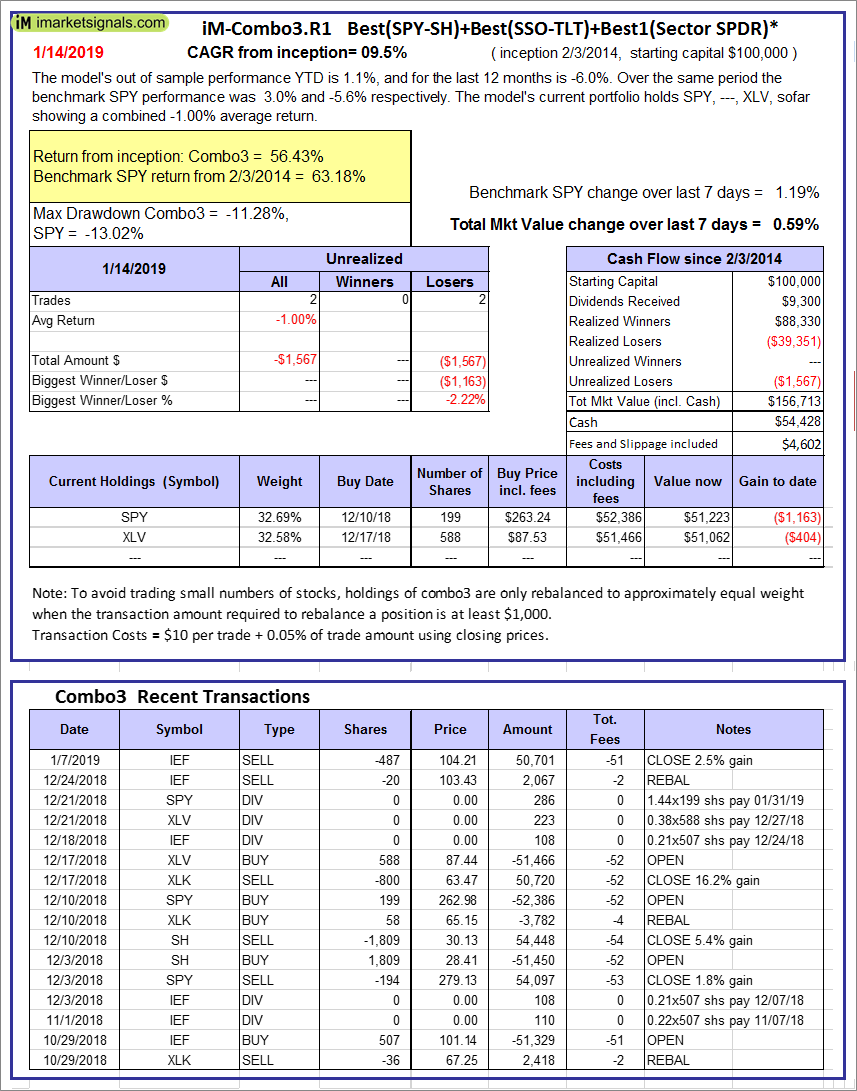 |
iM-Combo3.R1: The model’s out of sample performance YTD is 1.1%, and for the last 12 months is -6.0%. Over the same period the benchmark SPY performance was 3.0% and -5.6% respectively. Over the previous week the market value of iM-Combo3.R1 gained 0.59% at a time when SPY gained 1.19%. A starting capital of $100,000 at inception on 2/3/2014 would have grown to $156,713 which includes $54,428 cash and excludes $4,602 spent on fees and slippage. |
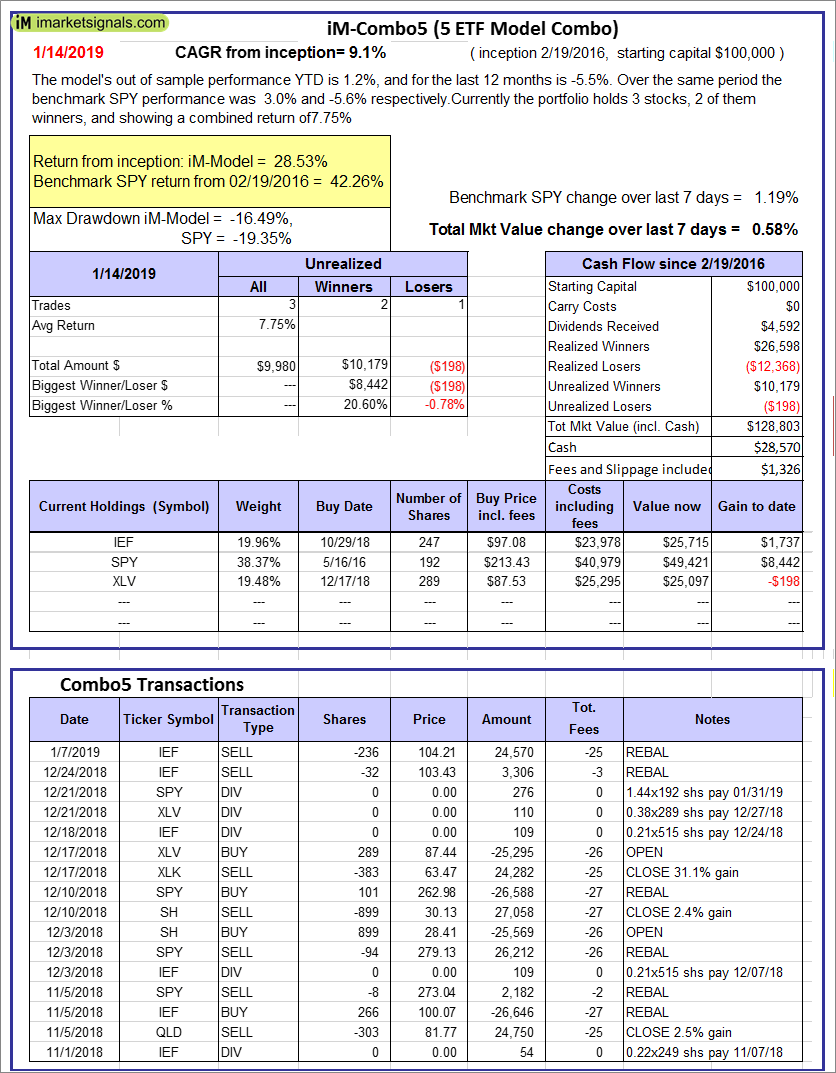 |
iM-Combo5: The model’s out of sample performance YTD is 1.2%, and for the last 12 months is -5.5%. Over the same period the benchmark SPY performance was 3.0% and -5.6% respectively. Over the previous week the market value of iM-Combo5 gained 0.58% at a time when SPY gained 1.19%. A starting capital of $100,000 at inception on 2/22/2016 would have grown to $128,803 which includes $28,570 cash and excludes $1,326 spent on fees and slippage. |
 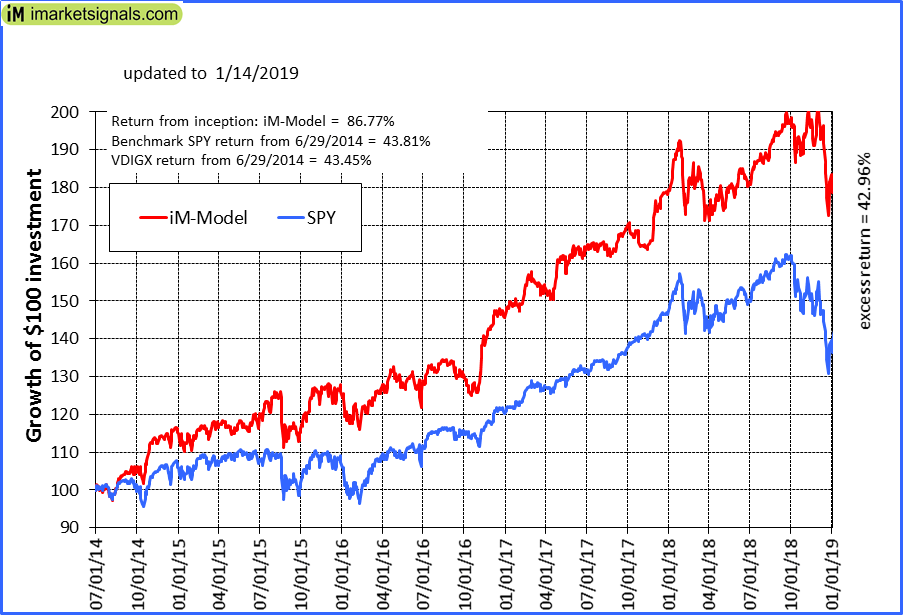 |
iM-Best10(VDIGX)-Trader: The model’s out of sample performance YTD is 1.8%, and for the last 12 months is -0.3%. Over the same period the benchmark SPY performance was 3.0% and -5.6% respectively. Since inception, on 7/1/2014, the model gained 86.77% while the benchmark SPY gained 43.81% and VDIGX gained 43.45% over the same period. Over the previous week the market value of iM-Best10(VDIGX) gained 1.37% at a time when SPY gained 1.19%. A starting capital of $100,000 at inception on 7/1/2014 would have grown to $186,768 which includes $55 cash and excludes $2,421 spent on fees and slippage. |
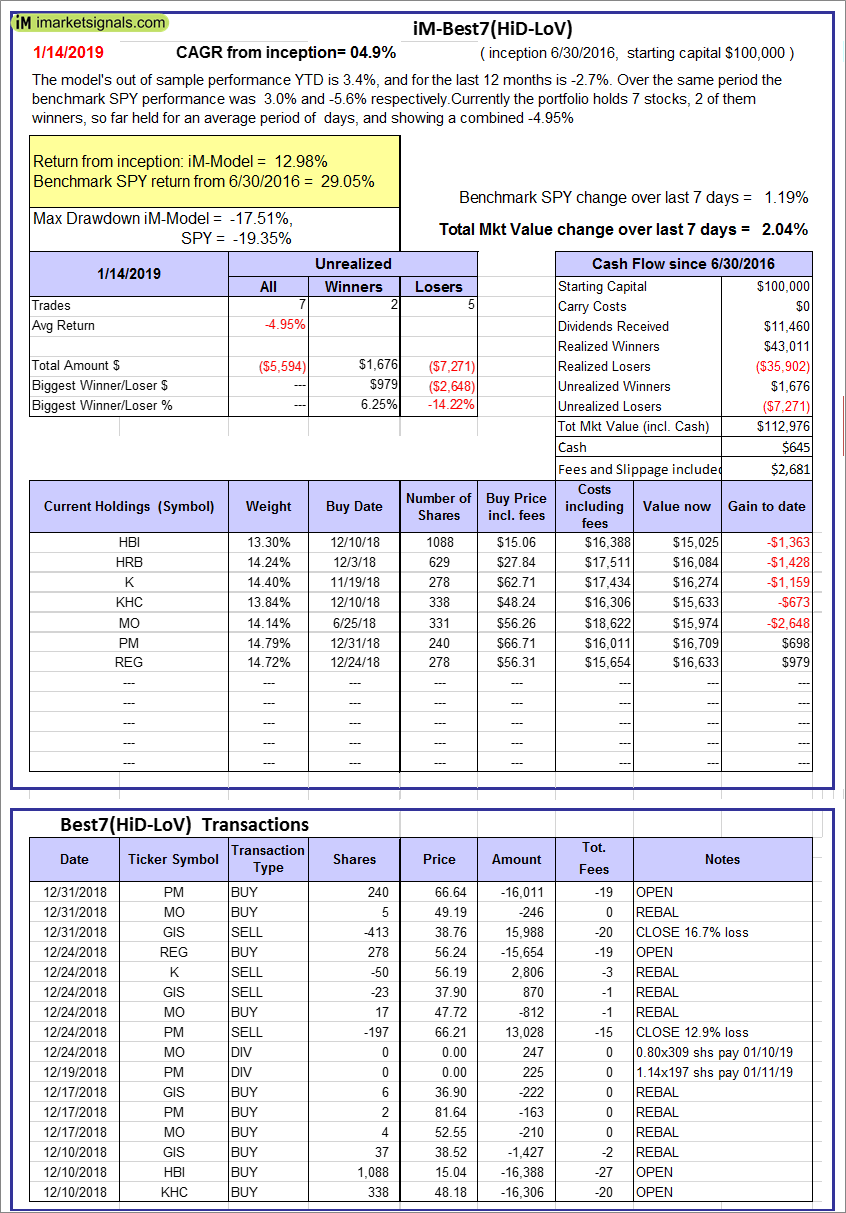 |
iM-Best7(HiD-LoV): The model’s out of sample performance YTD is 3.4%, and for the last 12 months is -2.7%. Over the same period the benchmark SPY performance was 3.0% and -5.6% respectively. Over the previous week the market value of iM-BESTOGA-3 gained 2.04% at a time when SPY gained 1.19%. A starting capital of $100,000 at inception on 6/30/2016 would have grown to $112,976 which includes $645 cash and excludes $2,681 spent on fees and slippage. |
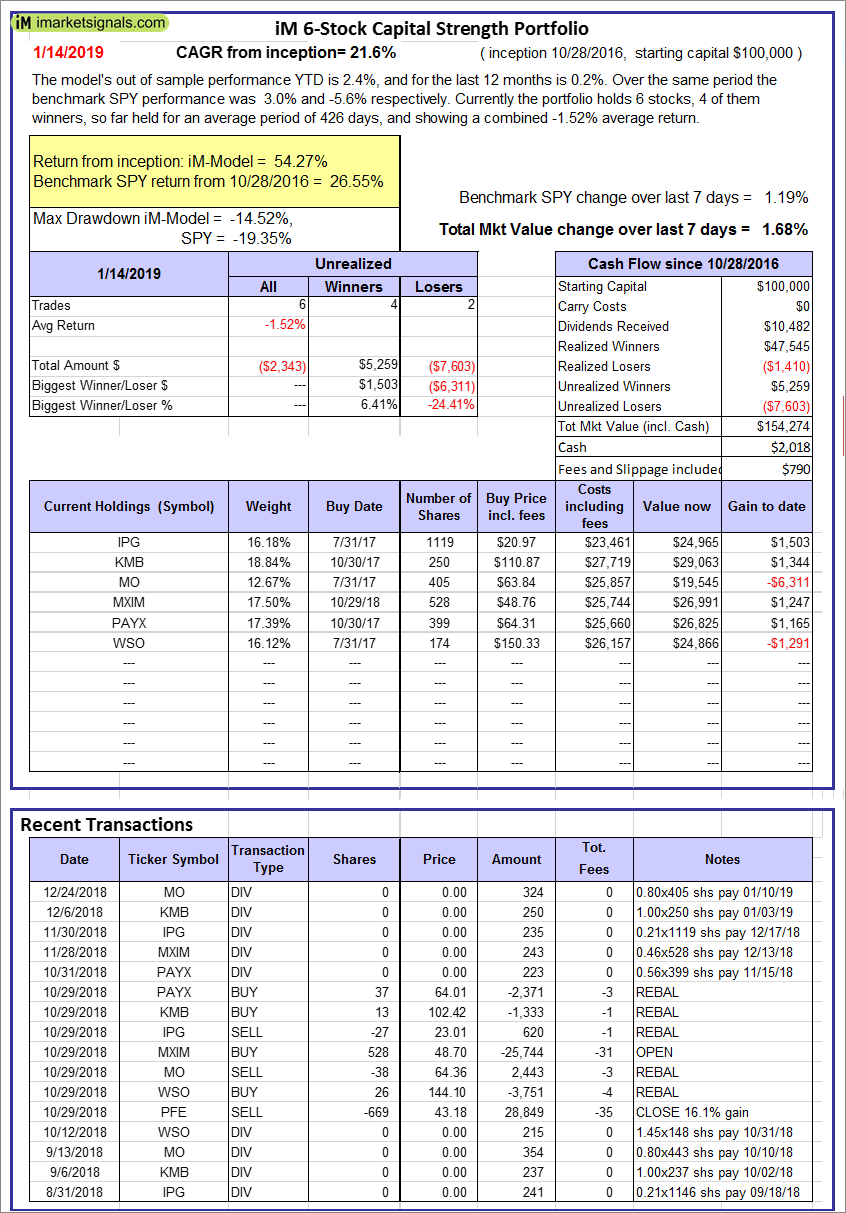 |
iM 6-Stock Capital Strength Portfolio: The model’s out of sample performance YTD is 2.4%, and for the last 12 months is 0.2%. Over the same period the benchmark SPY performance was 3.0% and -5.6% respectively. Over the previous week the market value of the iM 6-Stock Capital Strength Portfolio gained 1.68% at a time when SPY gained 1.19%. A starting capital of $100,000 at inception on 10/28/2016 would have grown to $154,274 which includes $2,018 cash and excludes $790 spent on fees and slippage. |
 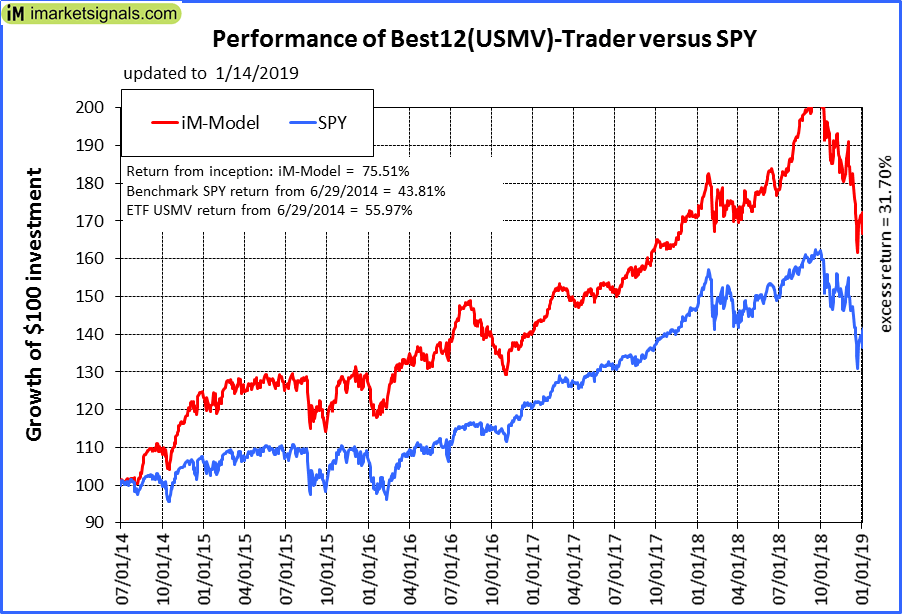 |
iM-Best12(USMV)-Trader: The model’s out of sample performance YTD is 2.4%, and for the last 12 months is -0.4%. Over the same period the benchmark SPY performance was 3.0% and -5.6% respectively. Since inception, on 6/30/2014, the model gained 75.51% while the benchmark SPY gained 43.81% and the ETF USMV gained 55.97% over the same period. Over the previous week the market value of iM-Best12(USMV)-Trader gained 1.84% at a time when SPY gained 1.19%. A starting capital of $100,000 at inception on 6/30/2014 would have grown to $175,510 which includes $206 cash and excludes $4,973 spent on fees and slippage. |
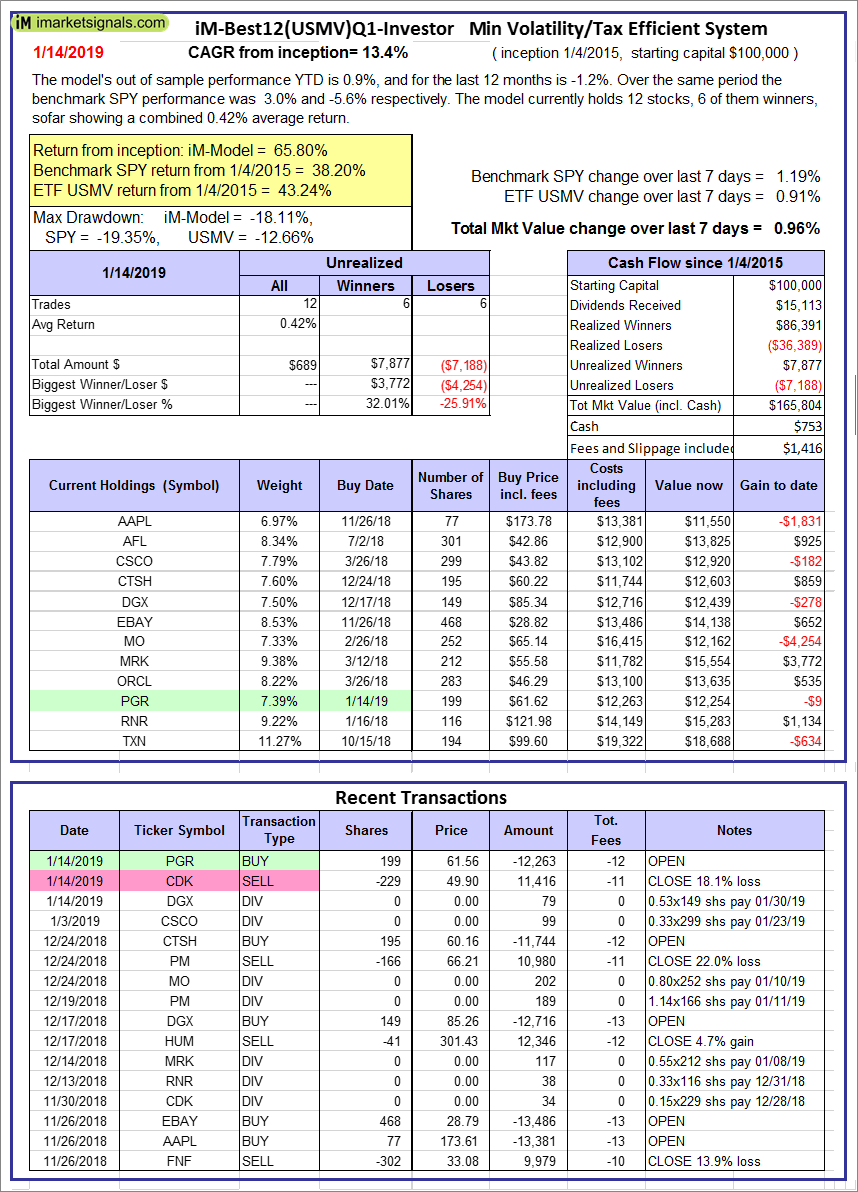 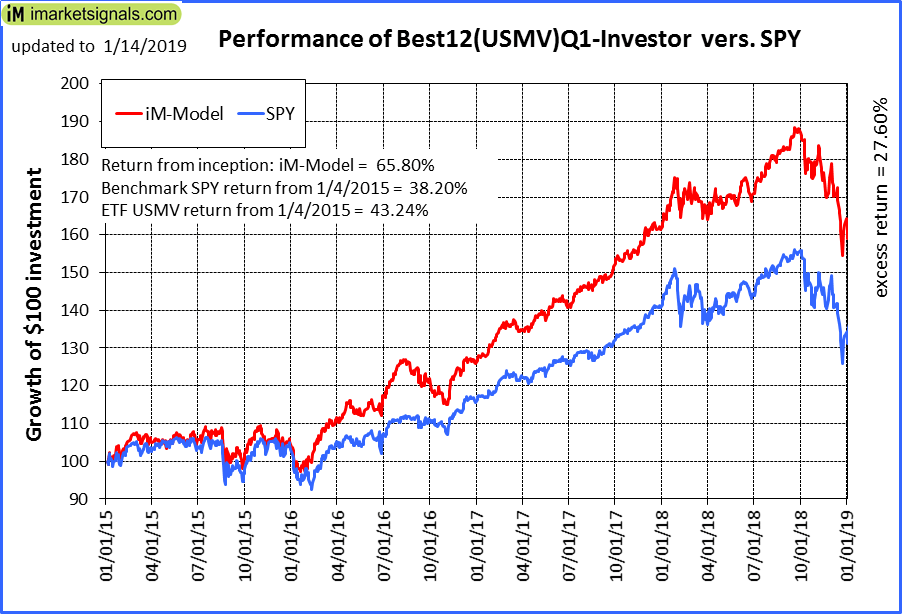 |
iM-Best12(USMV)Q1-Investor: The model’s out of sample performance YTD is 0.9%, and for the last 12 months is -1.2%. Over the same period the benchmark SPY performance was 3.0% and -5.6% respectively. Since inception, on 1/5/2015, the model gained 65.80% while the benchmark SPY gained 38.20% and the ETF USMV gained 43.24% over the same period. Over the previous week the market value of iM-Best12(USMV)Q1 gained 0.96% at a time when SPY gained 1.19%. A starting capital of $100,000 at inception on 1/5/2015 would have grown to $165,804 which includes $753 cash and excludes $1,416 spent on fees and slippage. |
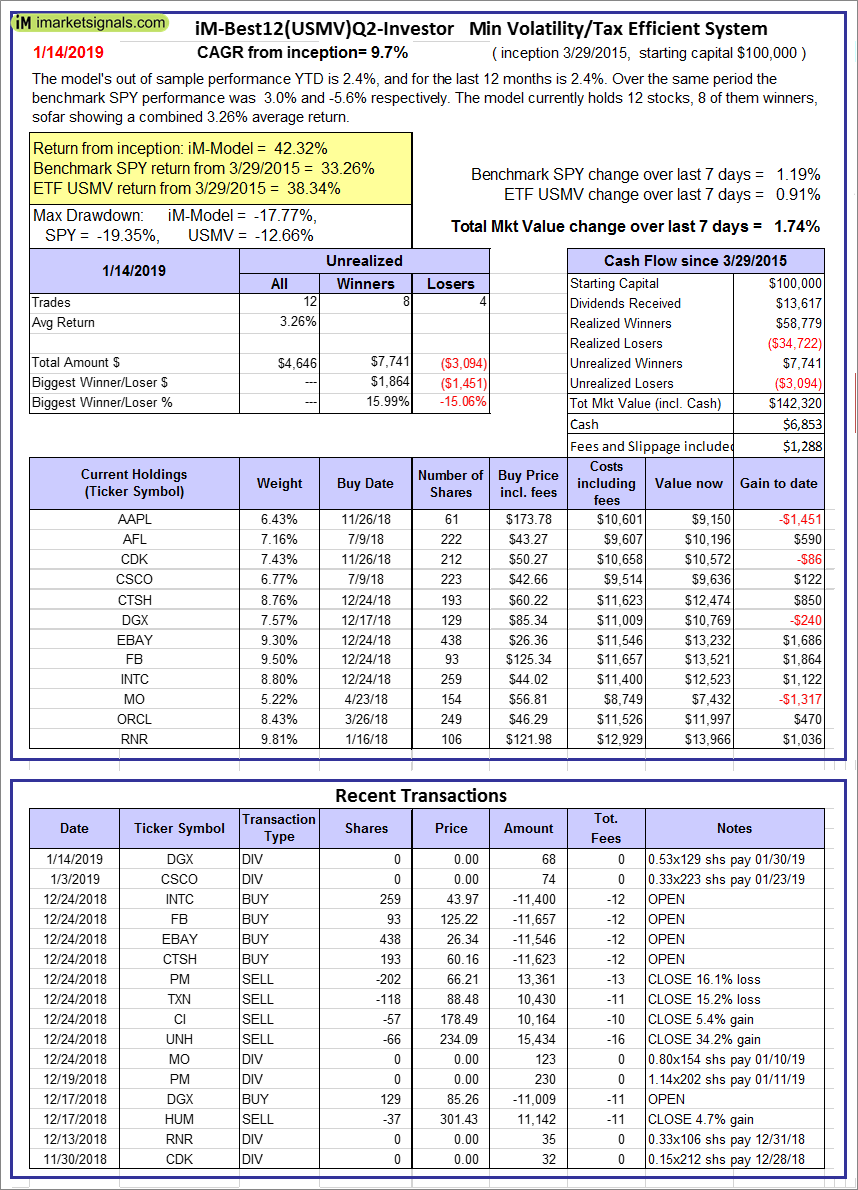 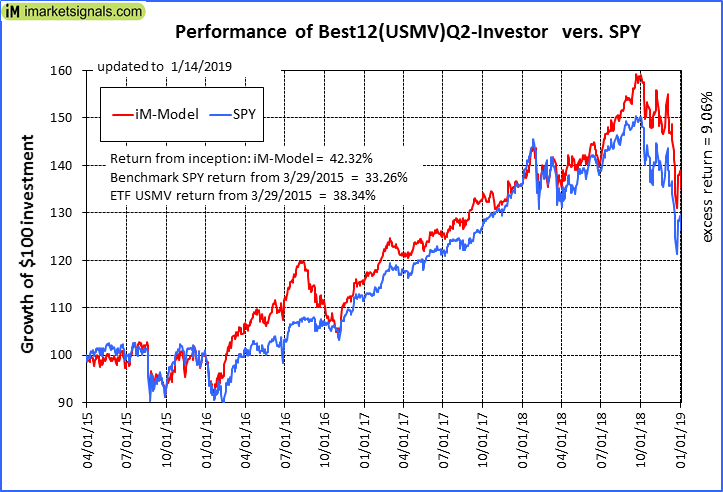 |
iM-Best12(USMV)Q2-Investor: The model’s out of sample performance YTD is 2.4%, and for the last 12 months is 2.4%. Over the same period the benchmark SPY performance was 3.0% and -5.6% respectively. Since inception, on 3/30/2015, the model gained 42.32% while the benchmark SPY gained 33.26% and the ETF USMV gained 38.34% over the same period. Over the previous week the market value of iM-Best12(USMV)Q2 gained 1.74% at a time when SPY gained 1.19%. A starting capital of $100,000 at inception on 3/30/2015 would have grown to $142,320 which includes $6,853 cash and excludes $1,288 spent on fees and slippage. |
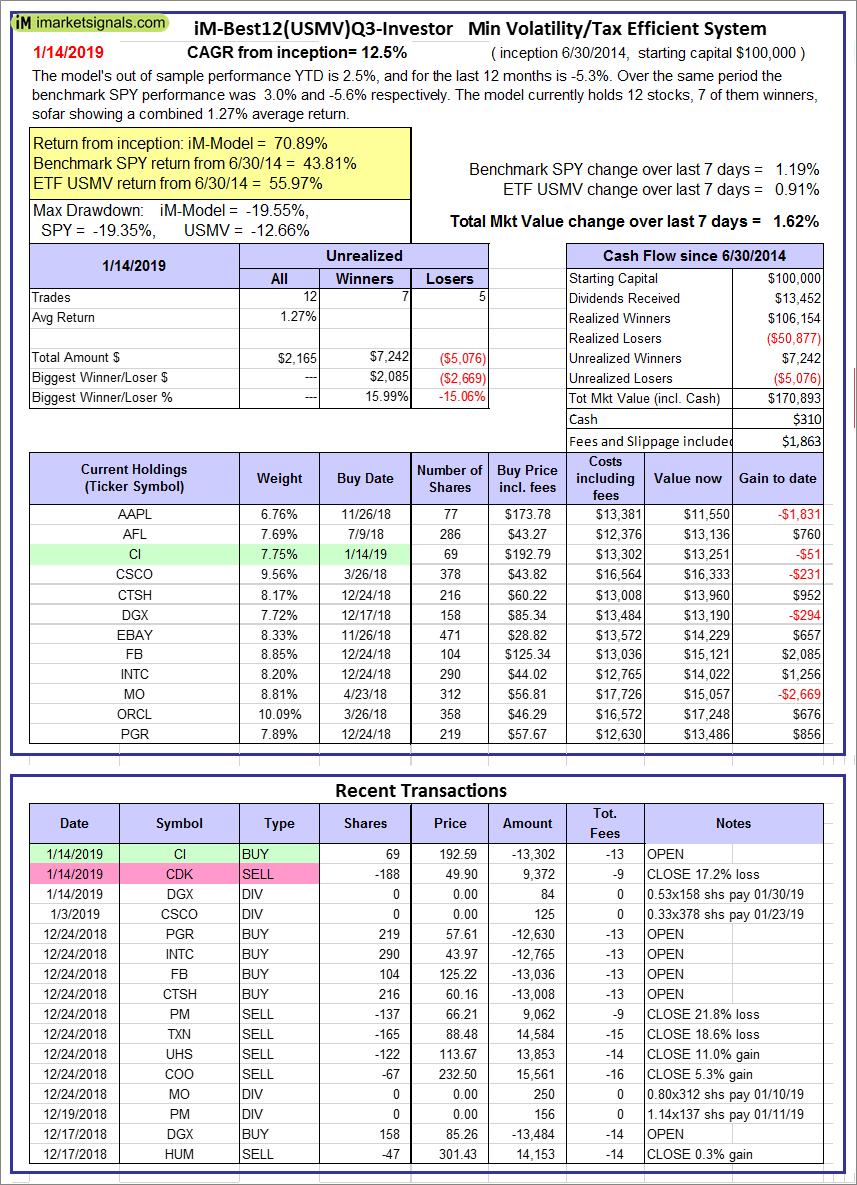  |
iM-Best12(USMV)Q3-Investor: The model’s out of sample performance YTD is 2.5%, and for the last 12 months is -5.3%. Over the same period the benchmark SPY performance was 3.0% and -5.6% respectively. Since inception, on 7/1/2014, the model gained 70.89% while the benchmark SPY gained 43.81% and the ETF USMV gained 55.97% over the same period. Over the previous week the market value of iM-Best12(USMV)Q3 gained 1.62% at a time when SPY gained 1.19%. A starting capital of $100,000 at inception on 7/1/2014 would have grown to $170,893 which includes $310 cash and excludes $1,863 spent on fees and slippage. |
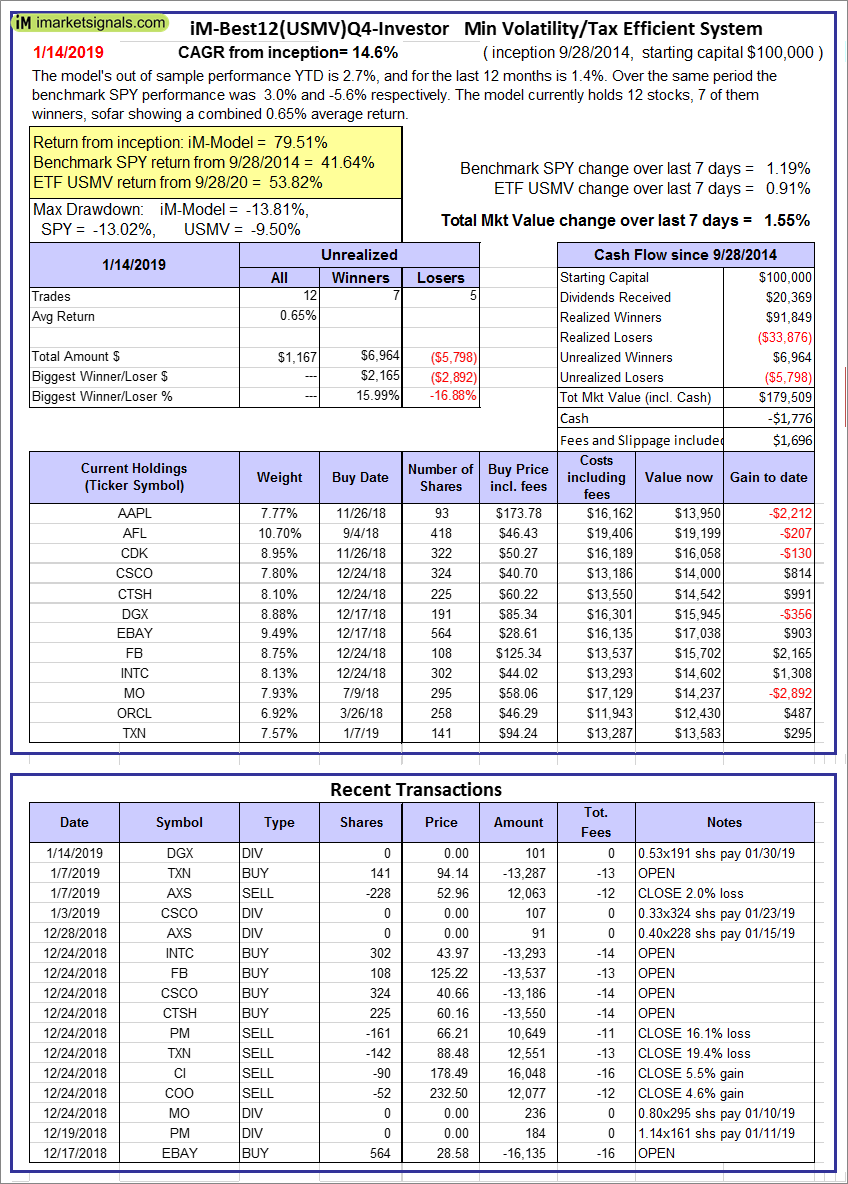  |
iM-Best12(USMV)Q4-Investor: Since inception, on 9/29/2014, the model gained 79.51% while the benchmark SPY gained 41.64% and the ETF USMV gained 53.82% over the same period. Over the previous week the market value of iM-Best12(USMV)Q4 gained 1.55% at a time when SPY gained 1.19%. A starting capital of $100,000 at inception on 9/29/2014 would have grown to $179,509 which includes -$1,776 cash and excludes $1,696 spent on fees and slippage. |
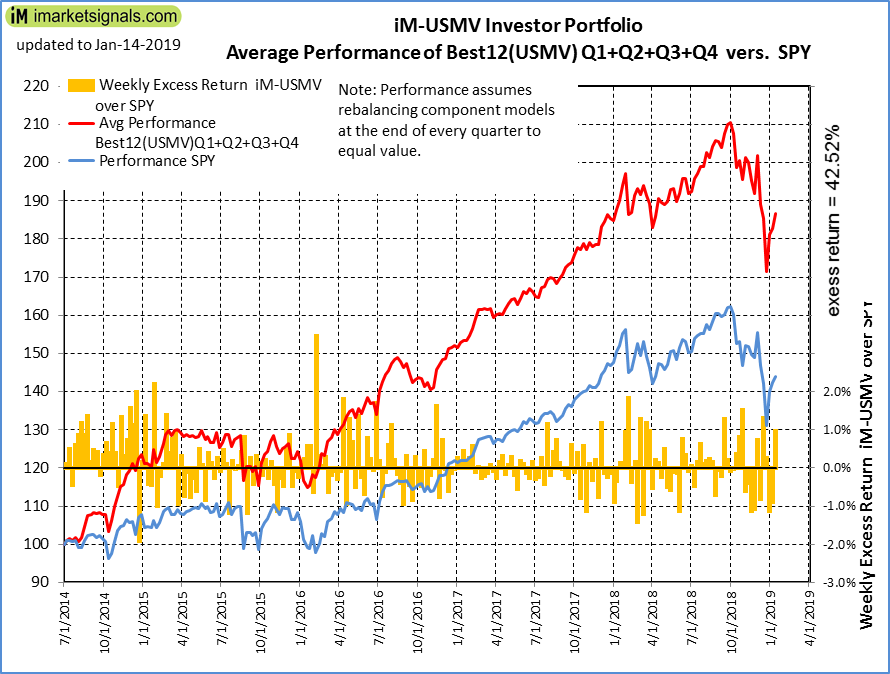 |
Average Performance of iM-Best12(USMV)Q1+Q2+Q3+Q4-Investor resulted in an excess return of 42.52% over SPY. (see iM-USMV Investor Portfolio) |
 |
iM-Best(Short): The model’s out of sample performance YTD is -6.8%, and for the last 12 months is -8.9%. Over the same period the benchmark SPY performance was 3.0% and -5.6% respectively. Over the previous week the market value of iM-Best(Short) gained -2.25% at a time when SPY gained 1.19%. Over the period 1/2/2009 to 1/14/2019 the starting capital of $100,000 would have grown to $82,957 which includes $82,957 cash and excludes $25,204 spent on fees and slippage. |
 |
iM-Best2 MC-Score ETF System: The model’s out of sample performance YTD is 2.6%, and for the last 12 months is -3.6%. Over the same period the benchmark SPY performance was 3.0% and -5.6% respectively. Over the previous week the market value of the iM-Best2 MC-Score ETF System gained 1.45% at a time when SPY gained 1.19%. A starting capital of $100,000 at inception on 6/30/2016 would have grown to $108,848 which includes -$218 cash and excludes $446 spent on fees and slippage. |
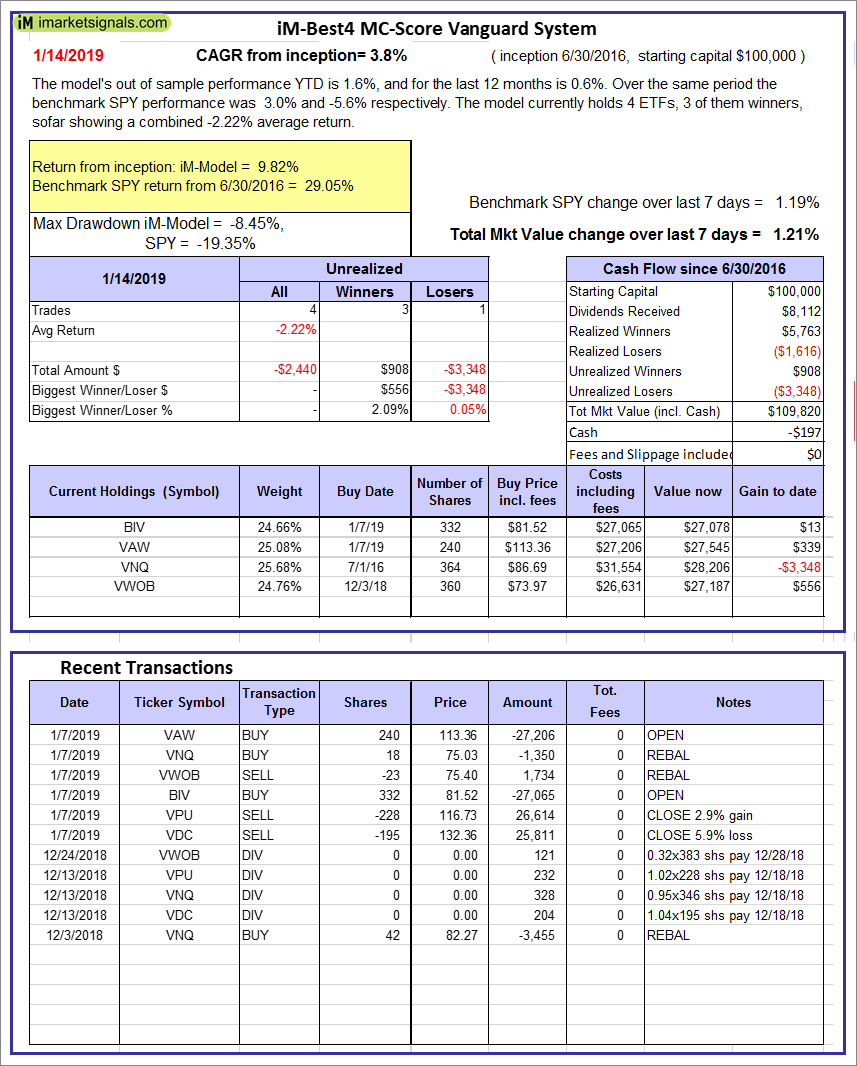 |
iM-Best4 MC-Score Vanguard System: The model’s out of sample performance YTD is 1.6%, and for the last 12 months is 0.6%. Over the same period the benchmark SPY performance was 3.0% and -5.6% respectively. Over the previous week the market value of the iM-Best4 MC-Score Vanguard System gained 1.21% at a time when SPY gained 1.19%. A starting capital of $100,000 at inception on 6/30/2016 would have grown to $109,820 which includes -$197 cash and excludes $00 spent on fees and slippage. |
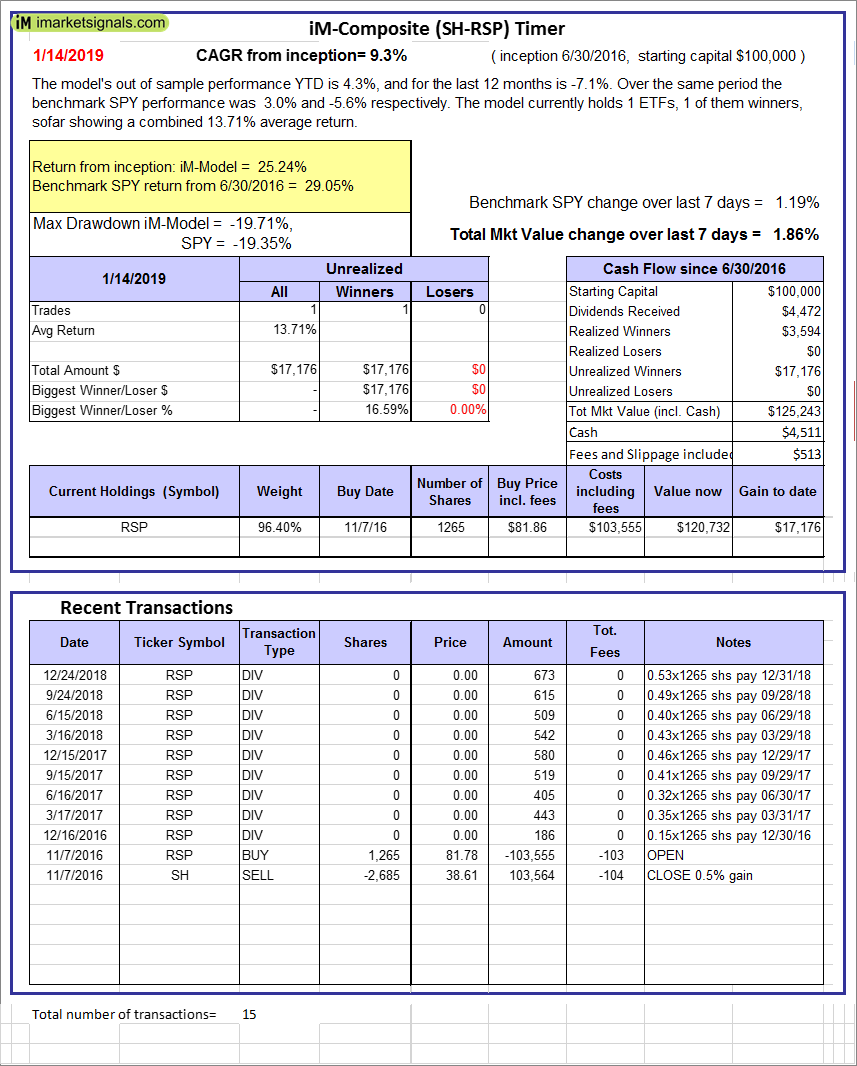 |
iM-Composite (SH-RSP) Timer: The model’s out of sample performance YTD is 4.3%, and for the last 12 months is -7.1%. Over the same period the benchmark SPY performance was 3.0% and -5.6% respectively. Over the previous week the market value of the iM-Composite (SH-RSP) Timer gained 1.86% at a time when SPY gained 1.19%. A starting capital of $100,000 at inception on 6/30/2016 would have grown to $125,243 which includes $4,511 cash and excludes $513 spent on fees and slippage. |
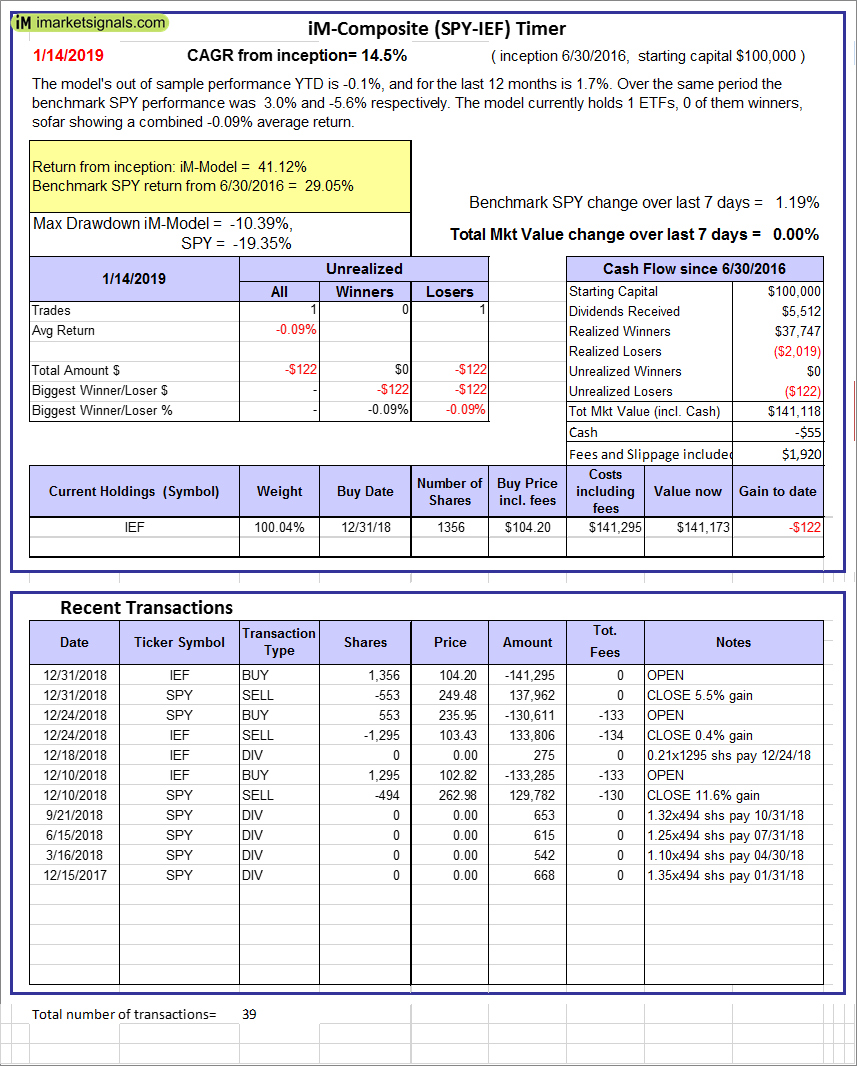 |
iM-Composite (SPY-IEF) Timer: The model’s out of sample performance YTD is -0.1%, and for the last 12 months is 1.7%. Over the same period the benchmark SPY performance was 3.0% and -5.6% respectively. Over the previous week the market value of the iM-Composite (SPY-IEF) Timer gained 0.00% at a time when SPY gained 1.19%. A starting capital of $100,000 at inception on 6/30/2016 would have grown to $141,118 which includes -$55 cash and excludes $1,920 spent on fees and slippage. |
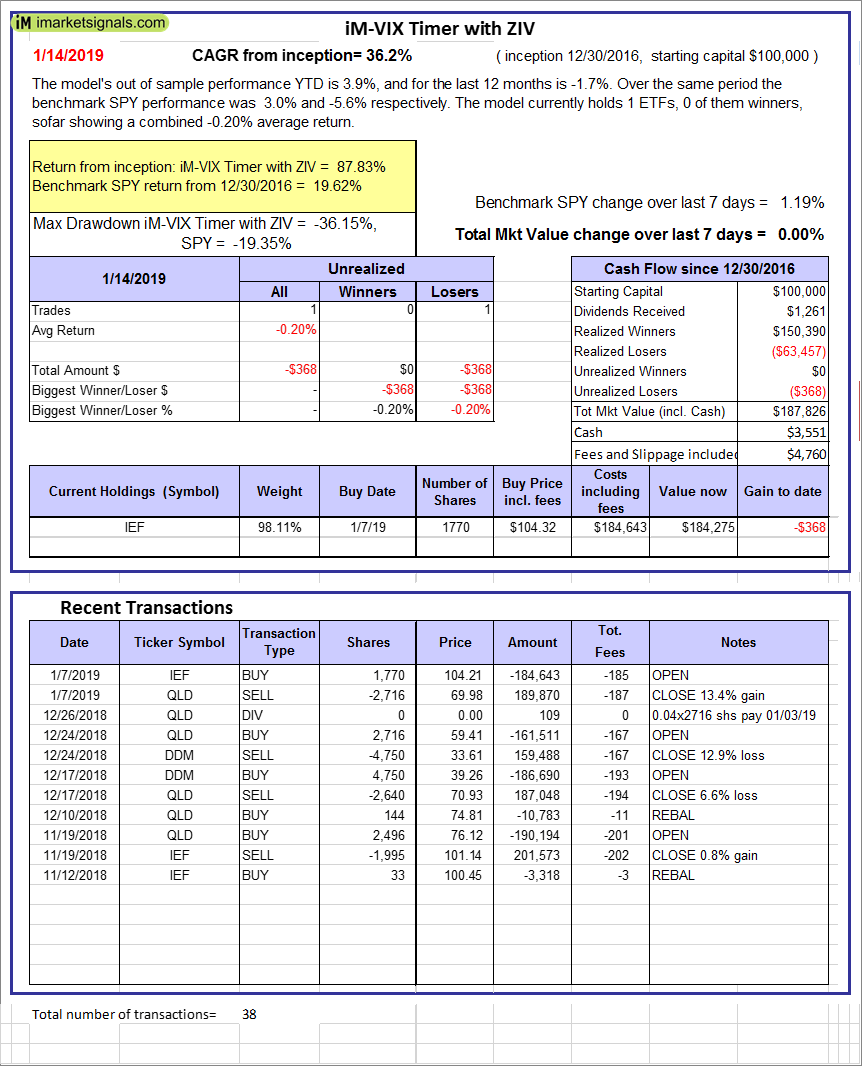 |
iM-VIX Timer with ZIV: The model’s out of sample performance YTD is 3.9%, and for the last 12 months is -1.7%. Over the same period the benchmark SPY performance was 3.0% and -5.6% respectively. Over the previous week the market value of the iM-VIX Timer with ZIV gained 0.00% at a time when SPY gained 1.19%. A starting capital of $100,000 at inception on 6/30/2016 would have grown to $187,826 which includes $3,551 cash and excludes $4,760 spent on fees and slippage. |
 |
iM-Composite(Gold-Stocks-Bond) Timer: The model’s out of sample performance YTD is -0.1%, and for the last 12 months is -17.2%. Over the same period the benchmark SPY performance was 3.0% and -5.6% respectively. Over the previous week the market value of the iM-Composite(Gold-Stocks-Bond) Timer gained -0.26% at a time when SPY gained 1.19%. A starting capital of $100,000 at inception on 6/30/2016 would have grown to $109,558 which includes -$760 cash and excludes $2,428 spent on fees and slippage. |
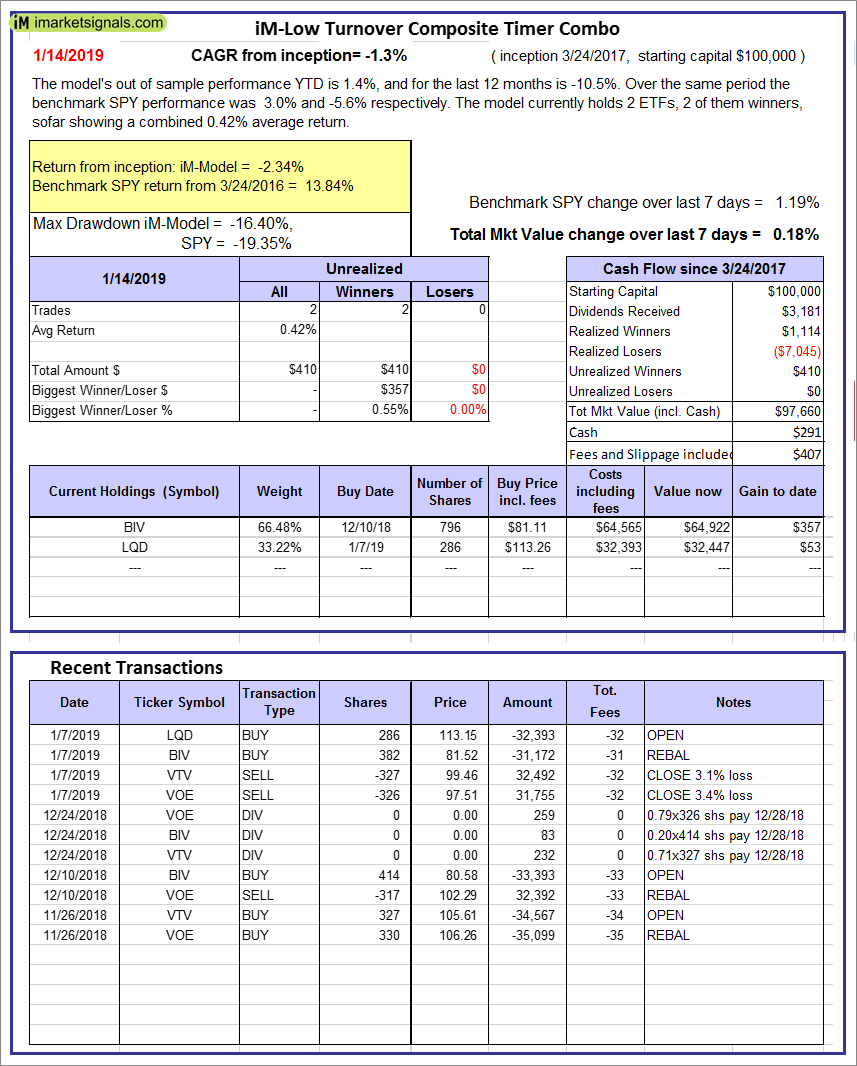 |
iM-Low Turnover Composite Timer Combo: The model’s out of sample performance YTD is 1.4%, and for the last 12 months is -10.5%. Over the same period the benchmark SPY performance was 3.0% and -5.6% respectively. Over the previous week the market value of the iM-Low Turnover Composite Timer Combo gained 0.18% at a time when SPY gained 1.19%. A starting capital of $100,000 at inception on 3/24/27 would have grown to $97,660 which includes $291 cash and excludes $407 spent on fees and slippage. |
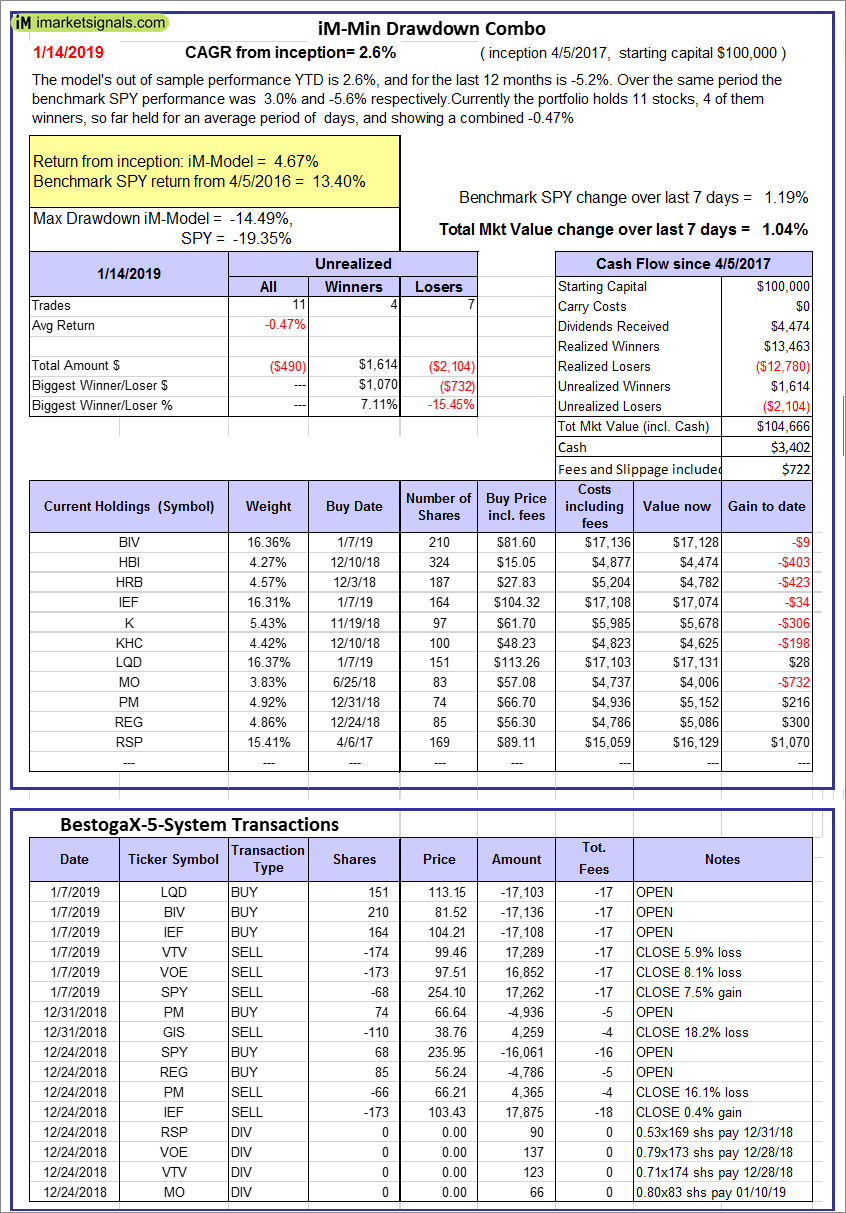 |
iM-Min Drawdown Combo: The model’s out of sample performance YTD is 2.6%, and for the last 12 months is -5.2%. Over the same period the benchmark SPY performance was 3.0% and -5.6% respectively. Over the previous week the market value of the iM-Min Drawdown Combo gained 1.04% at a time when SPY gained 1.19%. A starting capital of $100,000 at inception on 4/5/2017 would have grown to $104,666 which includes $3,402 cash and excludes $722 spent on fees and slippage. |
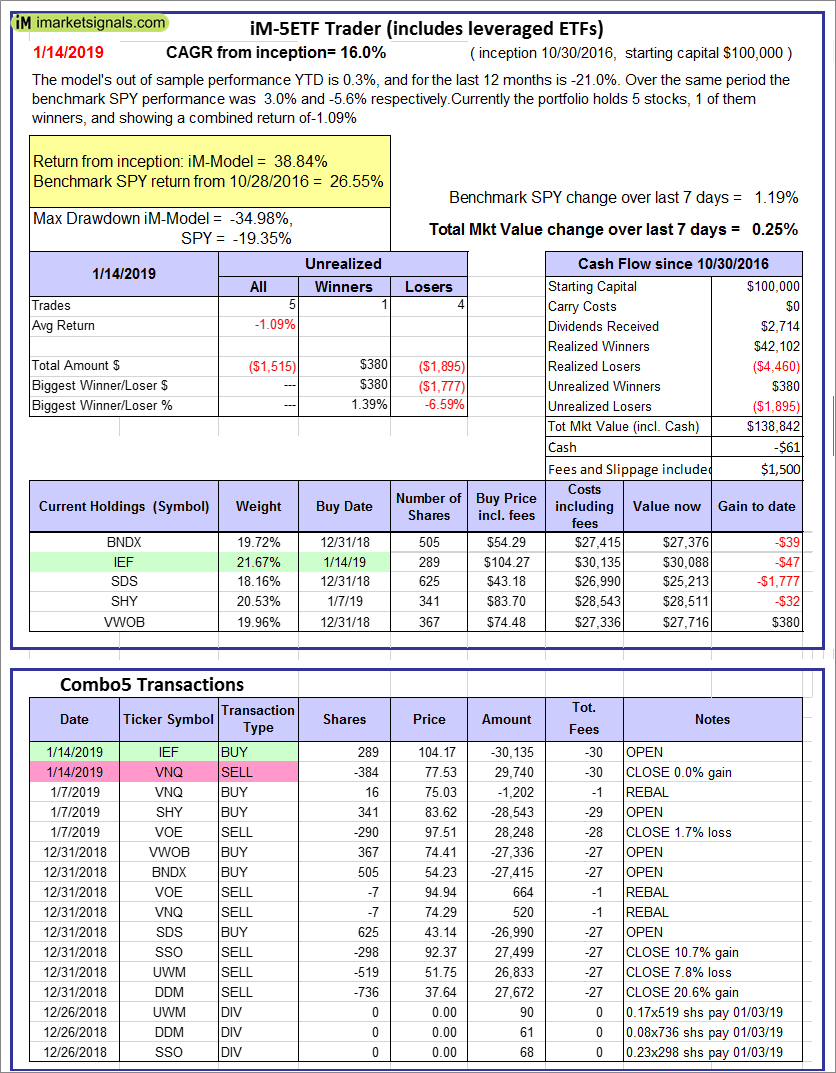 |
iM-5ETF Trader (includes leveraged ETFs): The model’s out of sample performance YTD is 0.3%, and for the last 12 months is -21.0%. Over the same period the benchmark SPY performance was 3.0% and -5.6% respectively. Over the previous week the market value of the iM-5ETF Trader (includes leveraged ETFs) gained 0.25% at a time when SPY gained 1.19%. A starting capital of $100,000 at inception on 10/30/2016 would have grown to $138,842 which includes -$61 cash and excludes $1,500 spent on fees and slippage. |
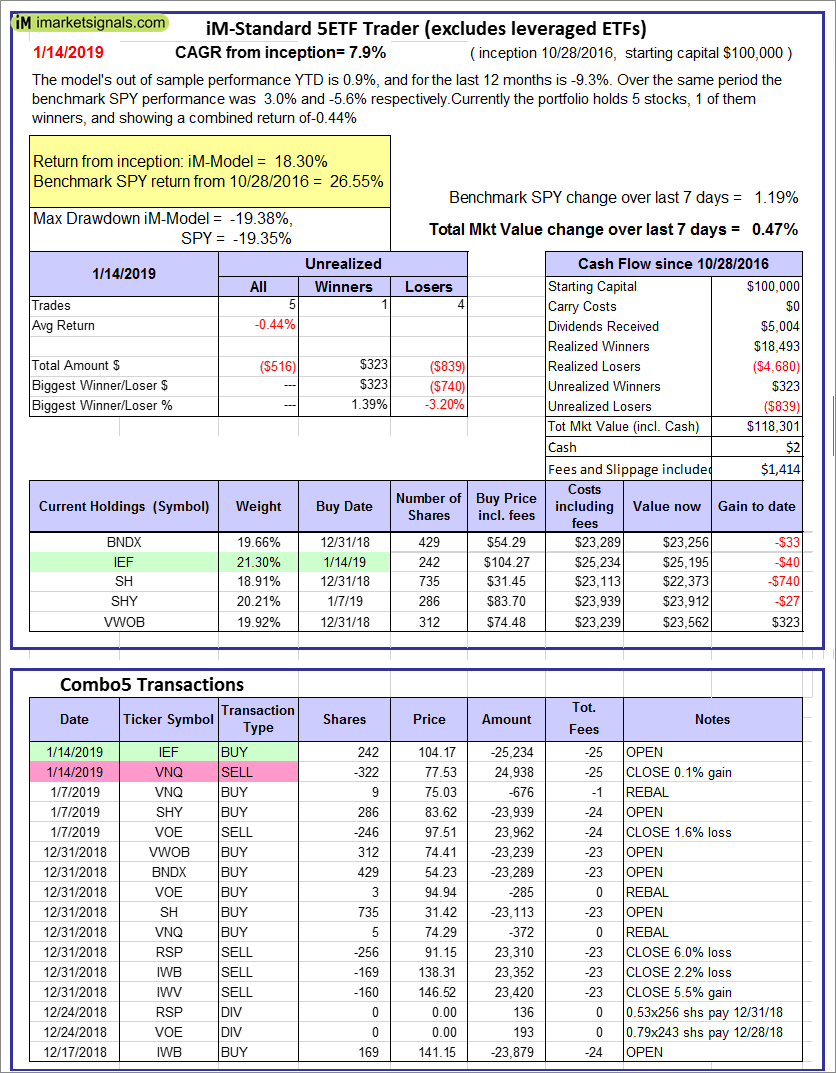 |
iM-Standard 5ETF Trader (excludes leveraged ETFs): The model’s out of sample performance YTD is 0.9%, and for the last 12 months is -9.3%. Over the same period the benchmark SPY performance was 3.0% and -5.6% respectively. Over the previous week the market value of the iM-Standard 5ETF Trader (excludes leveraged ETFs) gained 0.47% at a time when SPY gained 1.19%. A starting capital of $100,000 at inception on 10/30/2016 would have grown to $118,301 which includes $2 cash and excludes $1,414 spent on fees and slippage. |
iM-Best Reports – 1/14/2019
Posted in pmp SPY-SH
Leave a Reply
You must be logged in to post a comment.