
  |
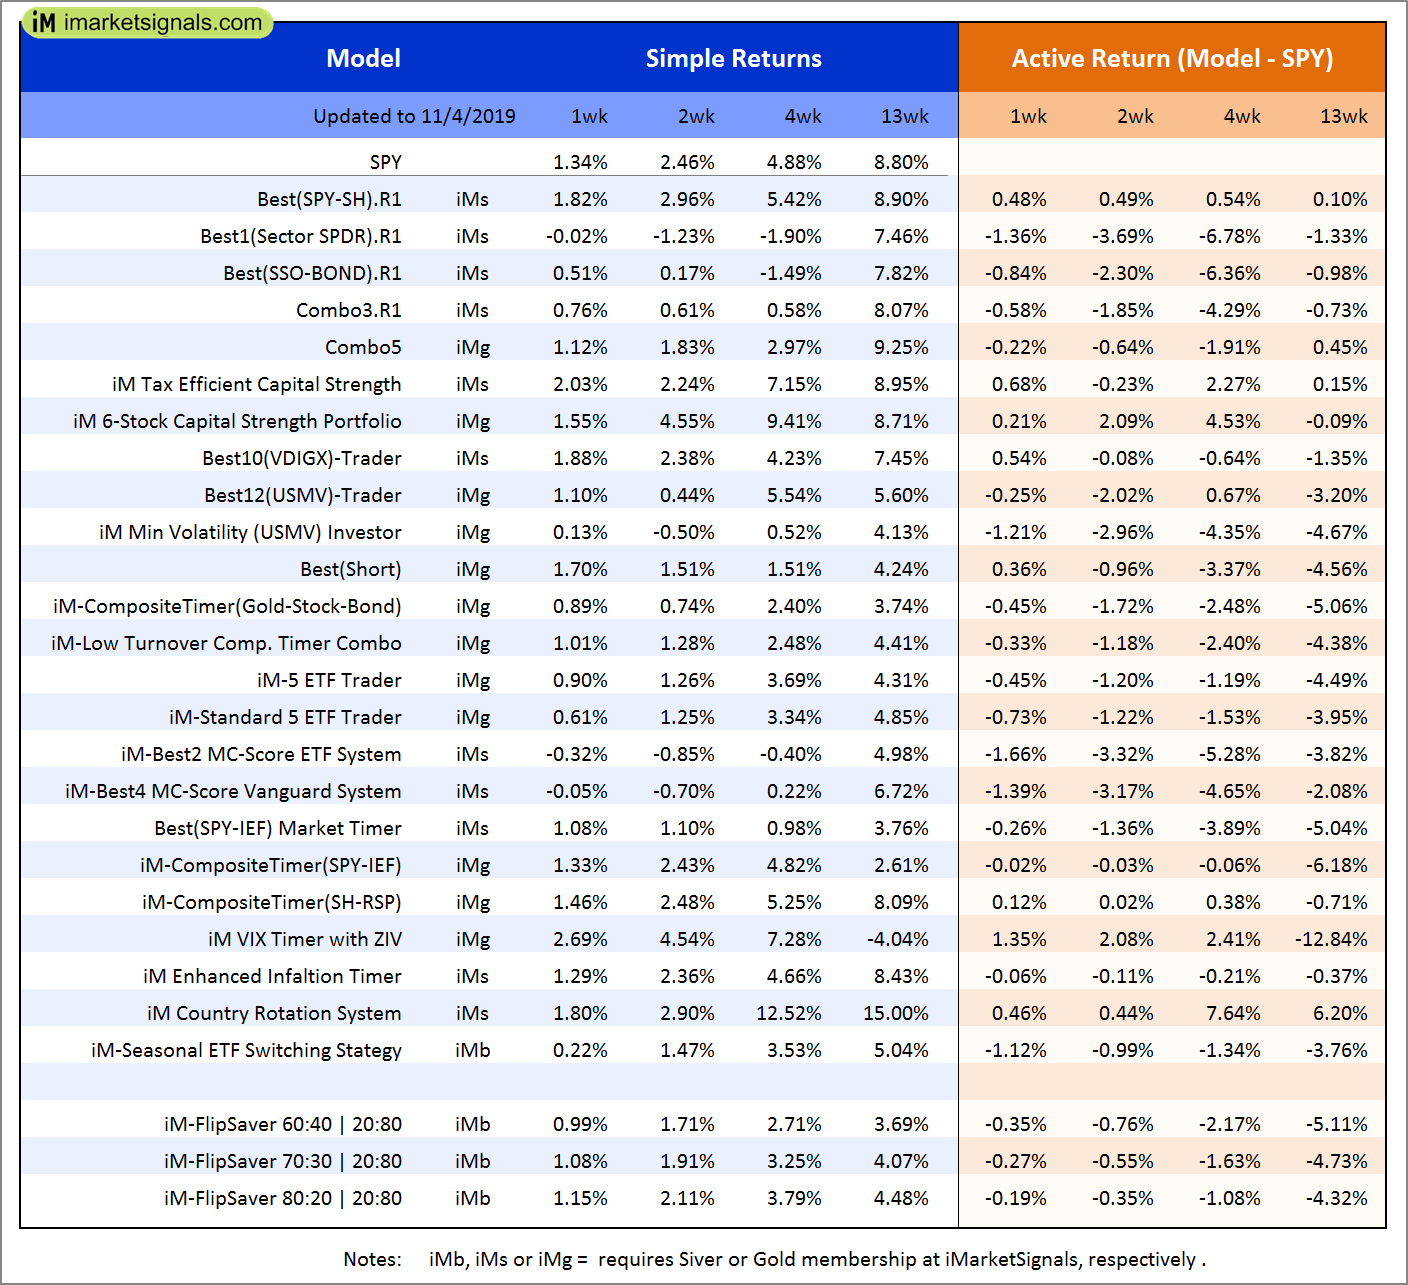
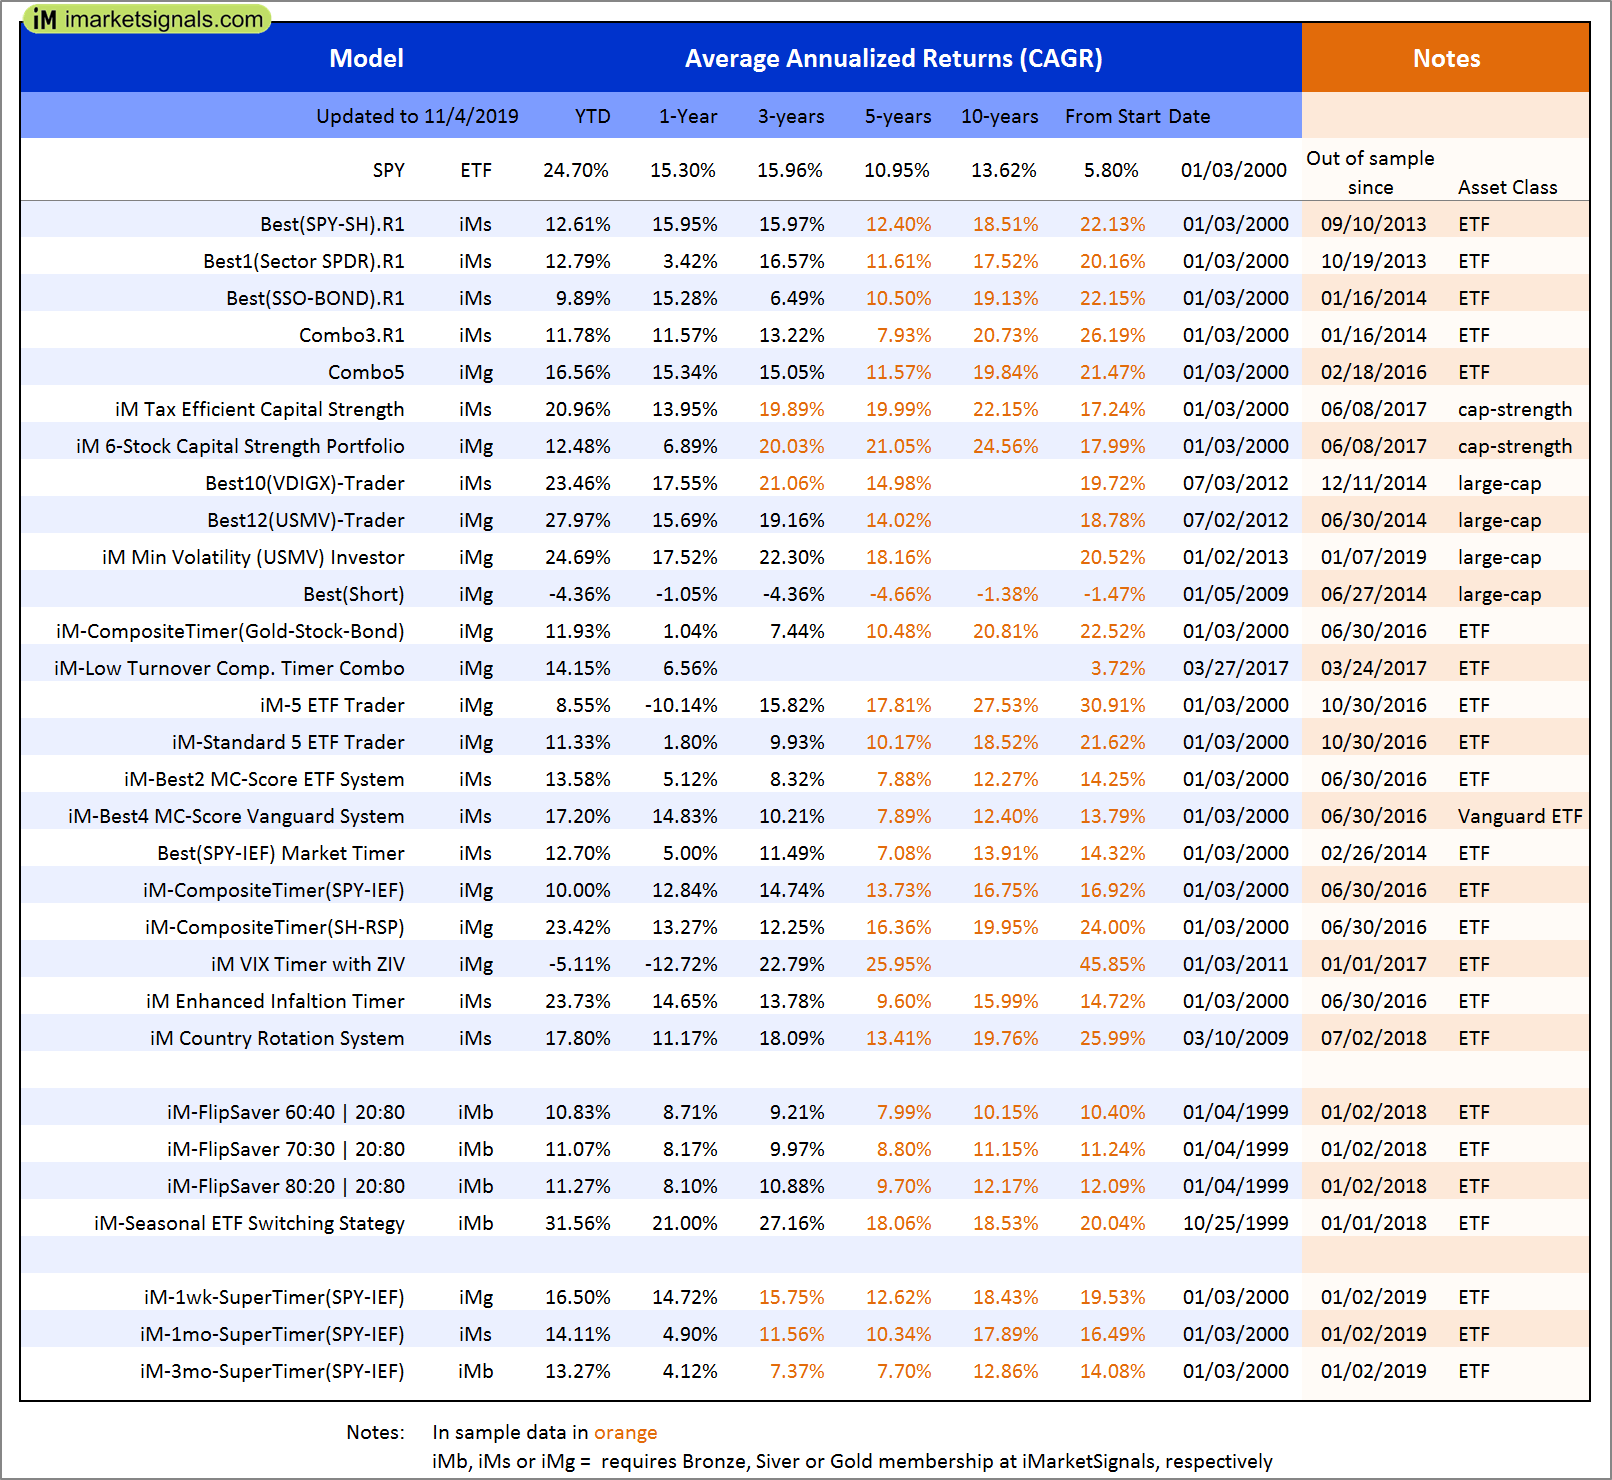
Out of sample performance summary of our models for the past 1, 2, 4 and 13 week periods. The active active return indicates how the models over- or underperformed the benchmark ETF SPY. Also the YTD, and the 1-, 3-, 5- and 10-year annualized returns are shown in the second table |
 |
iM-FlipSaver 60:40 | 20:80 – 2017: The model’s out of sample performance YTD is 11.9%, and for the last 12 months is 9.4%. Over the same period the benchmark E60B40 performance was 18.3% and 14.2% respectively. Over the previous week the market value of iM-FlipSaver 80:20 | 20:80 gained 1.00% at a time when SPY gained 0.98%. A starting capital of $100,000 at inception on 7/16/2015 would have grown to $125,244 which includes $30 cash and excludes $1,278 spent on fees and slippage. |
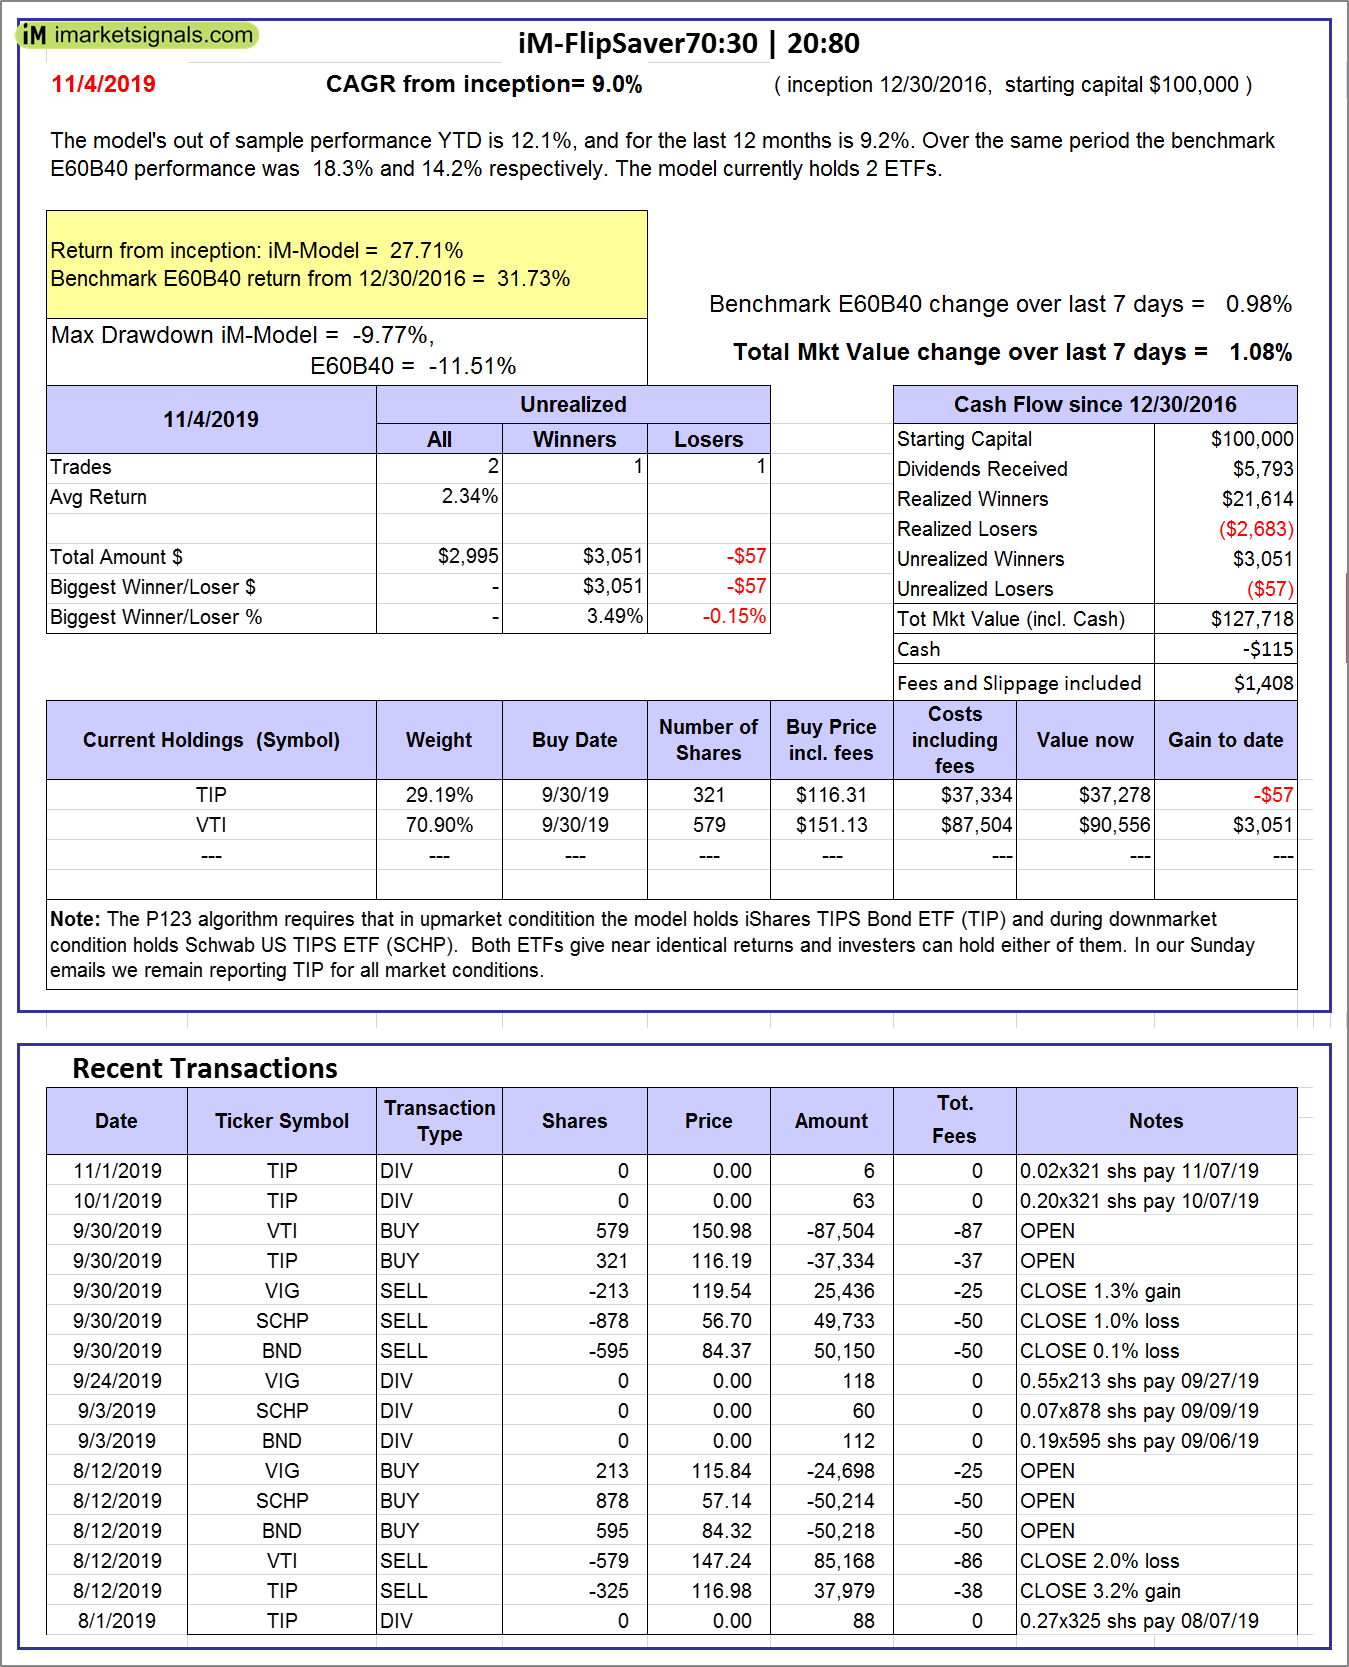 |
iM-FlipSaver 70:30 | 20:80 – 2017: The model’s out of sample performance YTD is 12.1%, and for the last 12 months is 9.2%. Over the same period the benchmark E60B40 performance was 18.3% and 14.2% respectively. Over the previous week the market value of iM-FlipSaver 70:30 | 20:80 gained 1.08% at a time when SPY gained 0.98%. A starting capital of $100,000 at inception on 7/15/2015 would have grown to $127,718 which includes -$115 cash and excludes $1,408 spent on fees and slippage. |
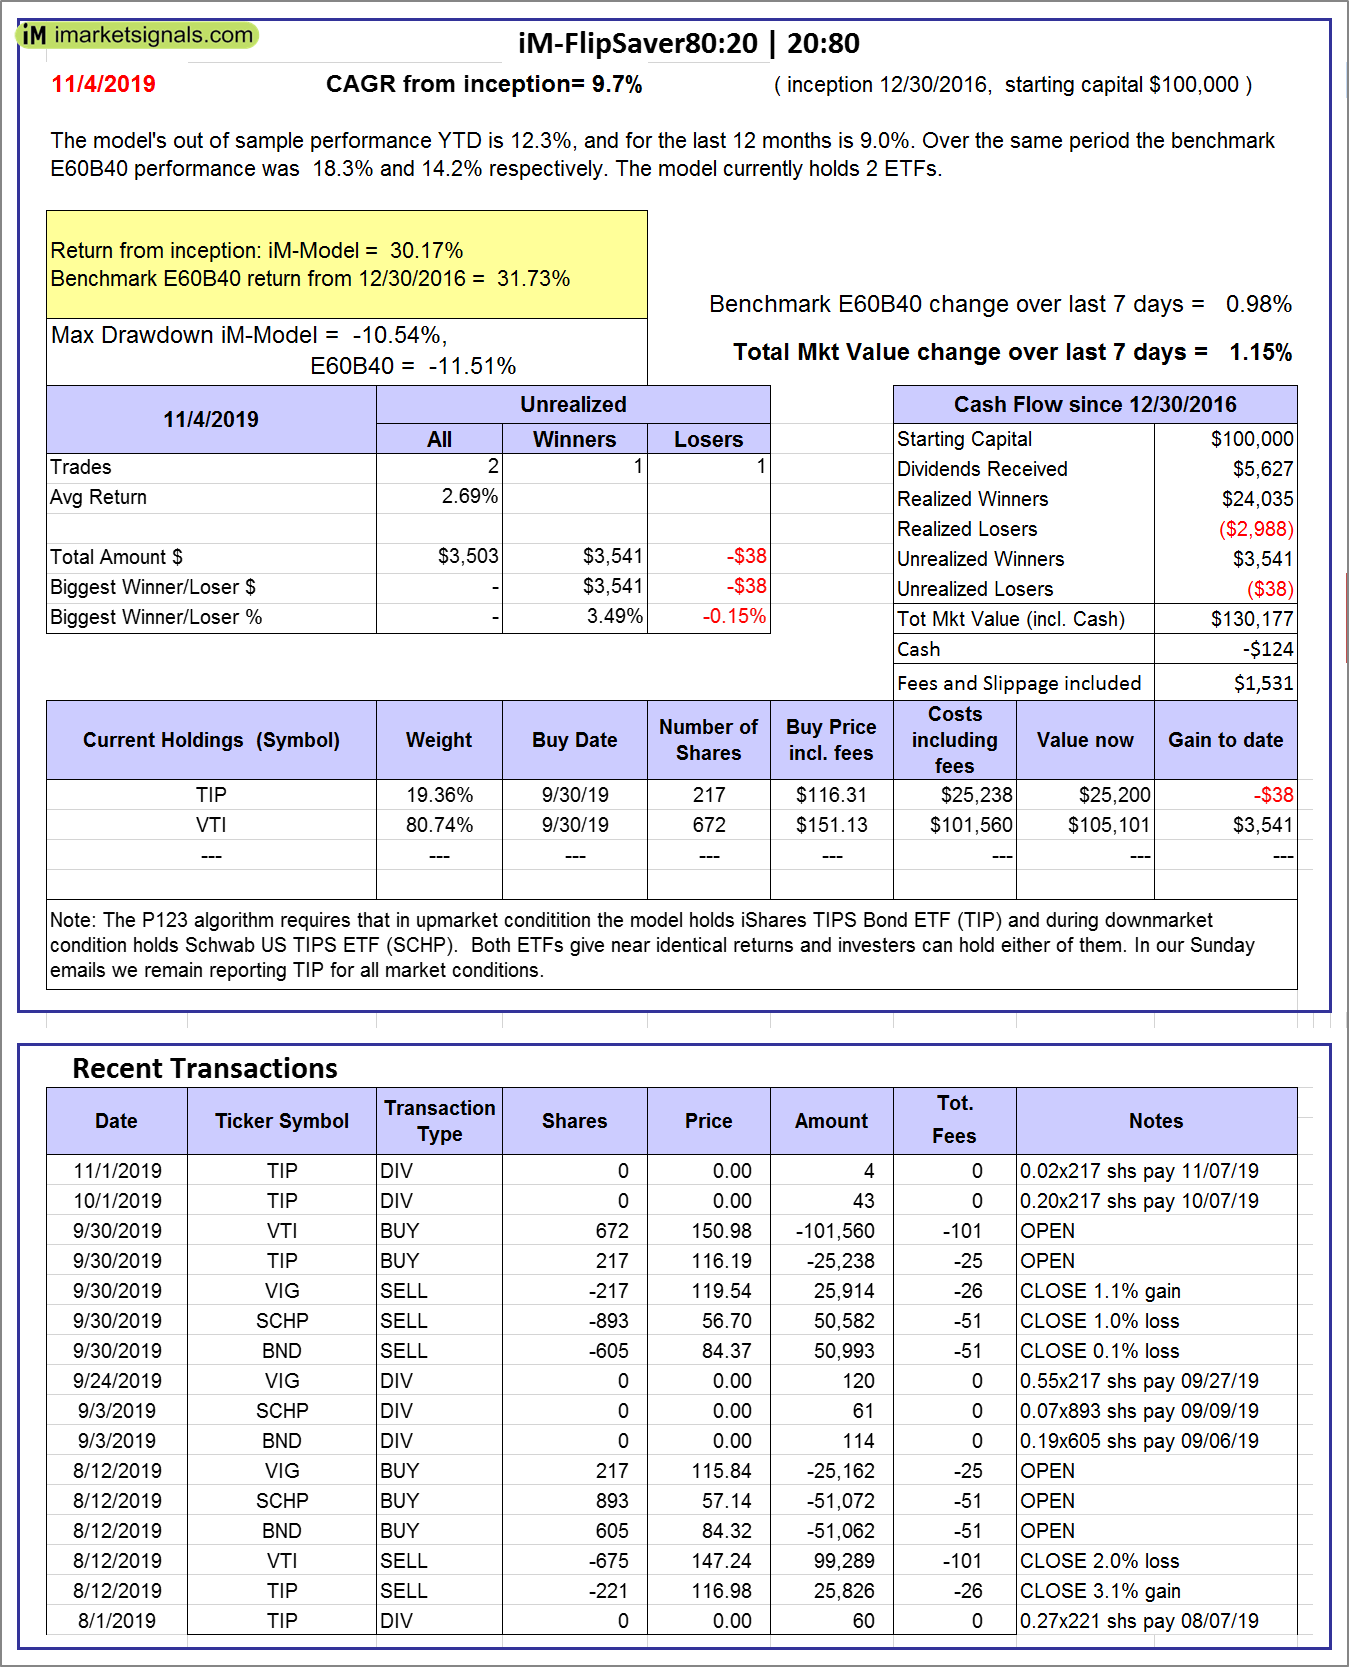 |
iM-FlipSaver 80:20 | 20:80 – 2017: The model’s out of sample performance YTD is 12.3%, and for the last 12 months is 9.0%. Over the same period the benchmark E60B40 performance was 18.3% and 14.2% respectively. Over the previous week the market value of iM-FlipSaver 80:20 | 20:80 gained 1.15% at a time when SPY gained 0.98%. A starting capital of $100,000 at inception on 1/2/2017 would have grown to $130,177 which includes -$124 cash and excludes $1,531 spent on fees and slippage. |
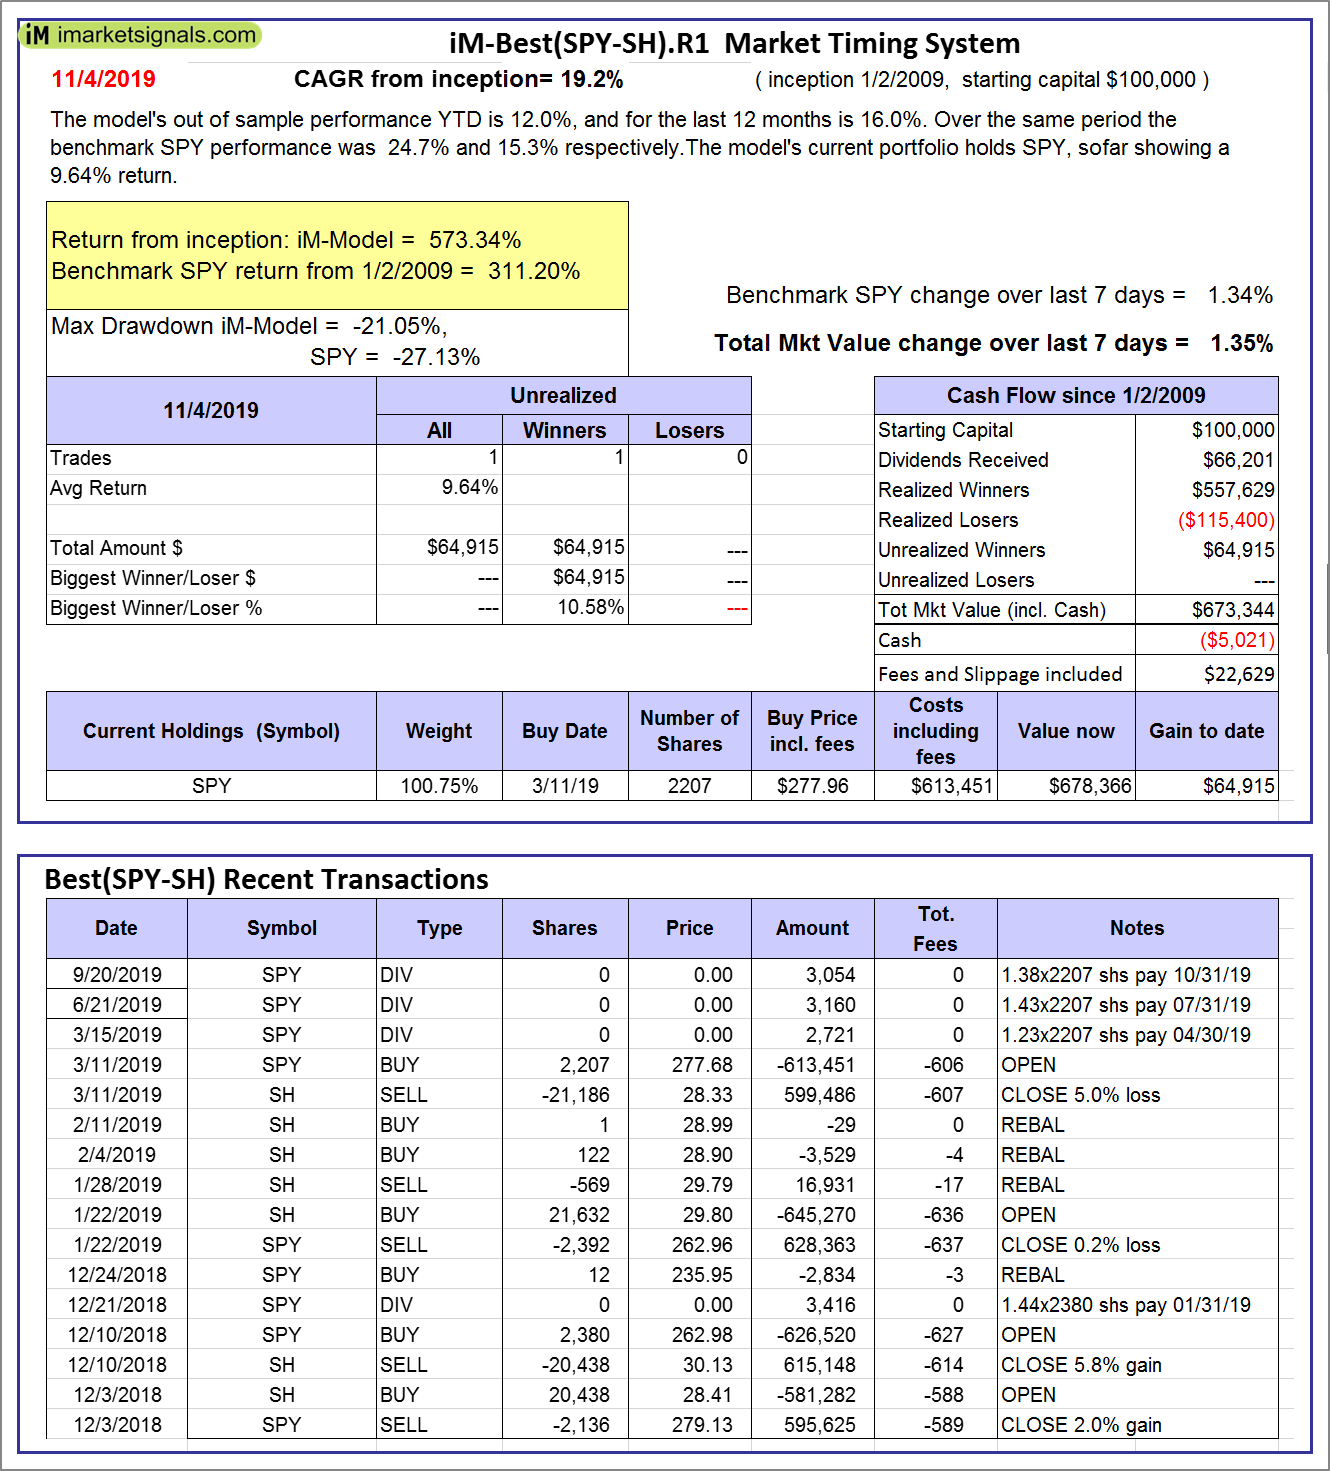 |
iM-Best(SPY-SH).R1: The model’s out of sample performance YTD is 12.0%, and for the last 12 months is 16.0%. Over the same period the benchmark SPY performance was 24.7% and 15.3% respectively. Over the previous week the market value of Best(SPY-SH) gained 1.35% at a time when SPY gained 1.34%. A starting capital of $100,000 at inception on 1/2/2009 would have grown to $673,344 which includes -$5,021 cash and excludes $22,629 spent on fees and slippage. |
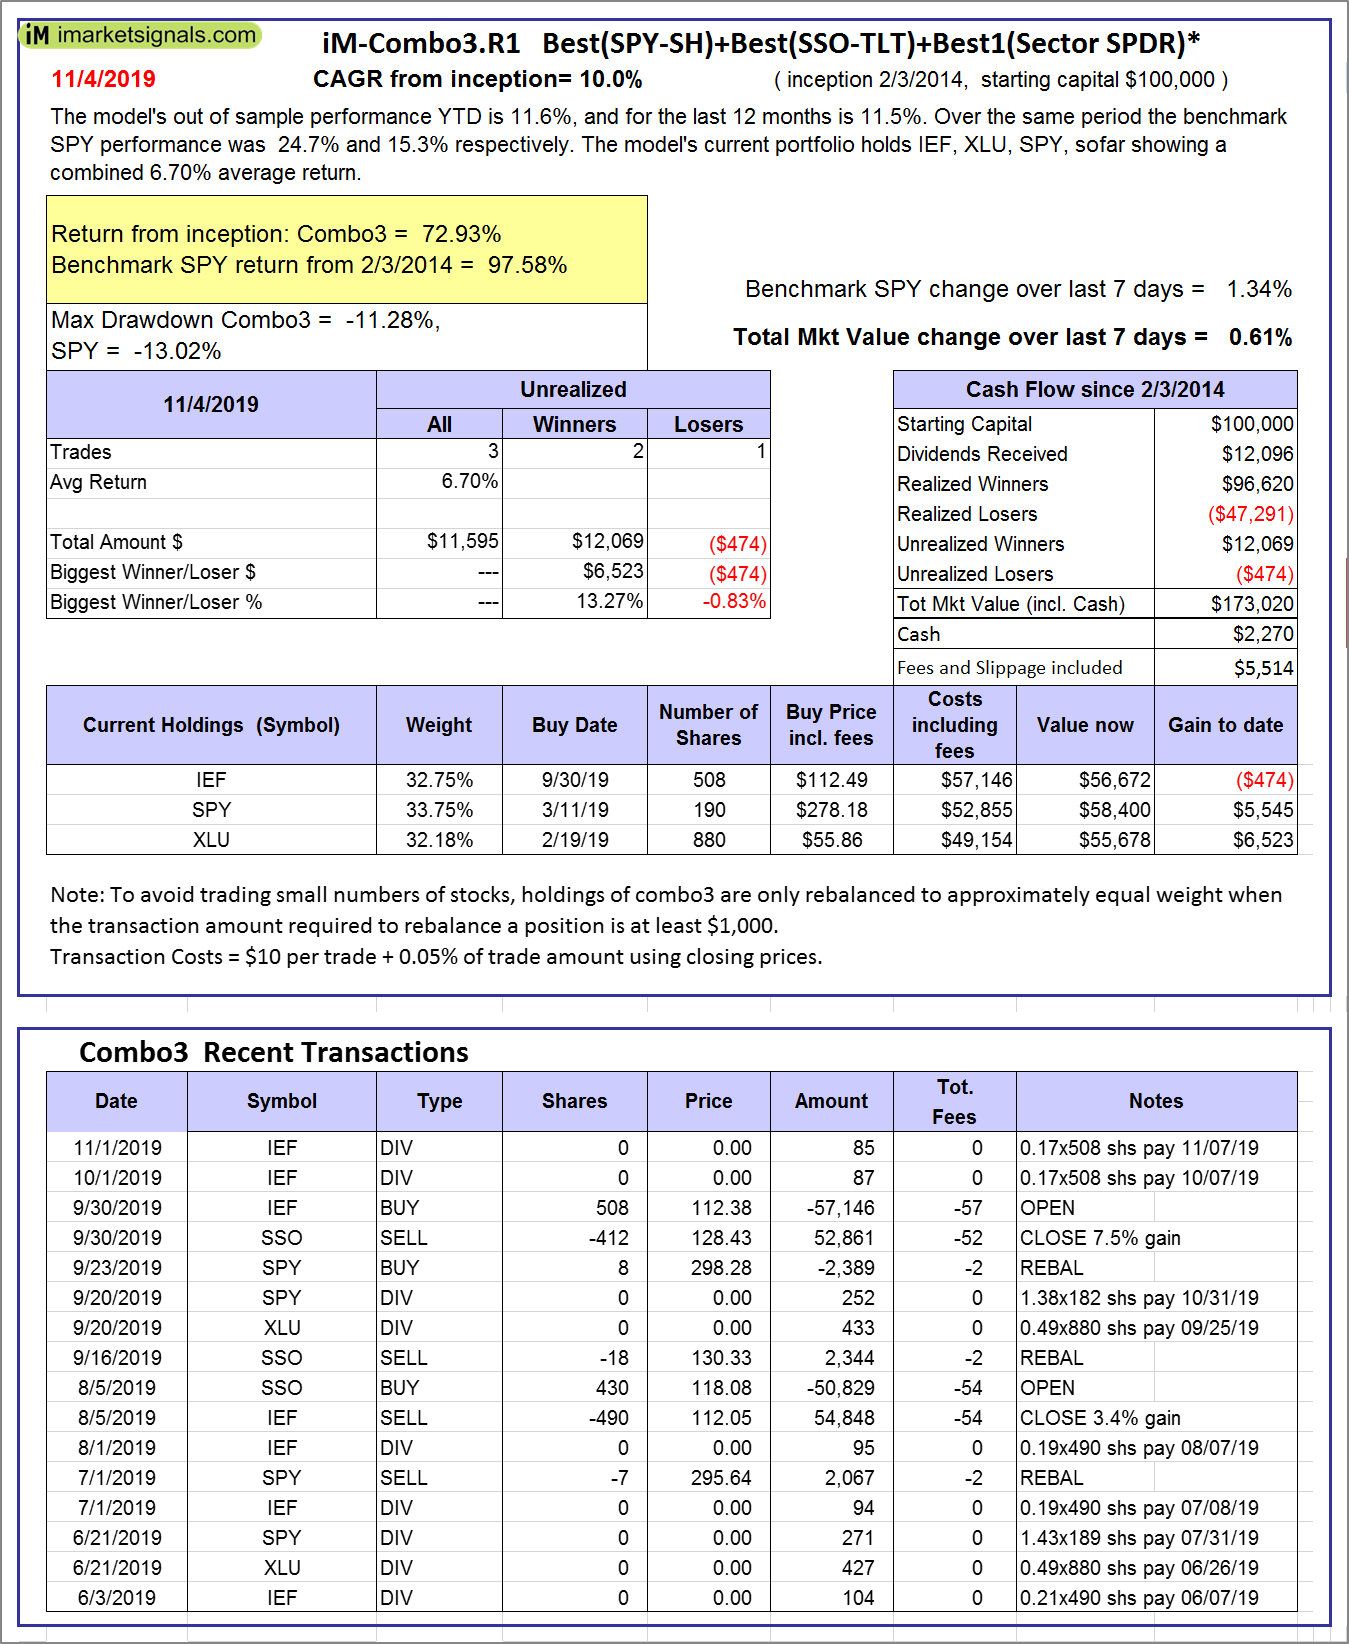 |
iM-Combo3.R1: The model’s out of sample performance YTD is 11.6%, and for the last 12 months is 11.5%. Over the same period the benchmark SPY performance was 24.7% and 15.3% respectively. Over the previous week the market value of iM-Combo3.R1 gained 0.61% at a time when SPY gained 1.34%. A starting capital of $100,000 at inception on 2/3/2014 would have grown to $173,020 which includes $2,270 cash and excludes $5,514 spent on fees and slippage. |
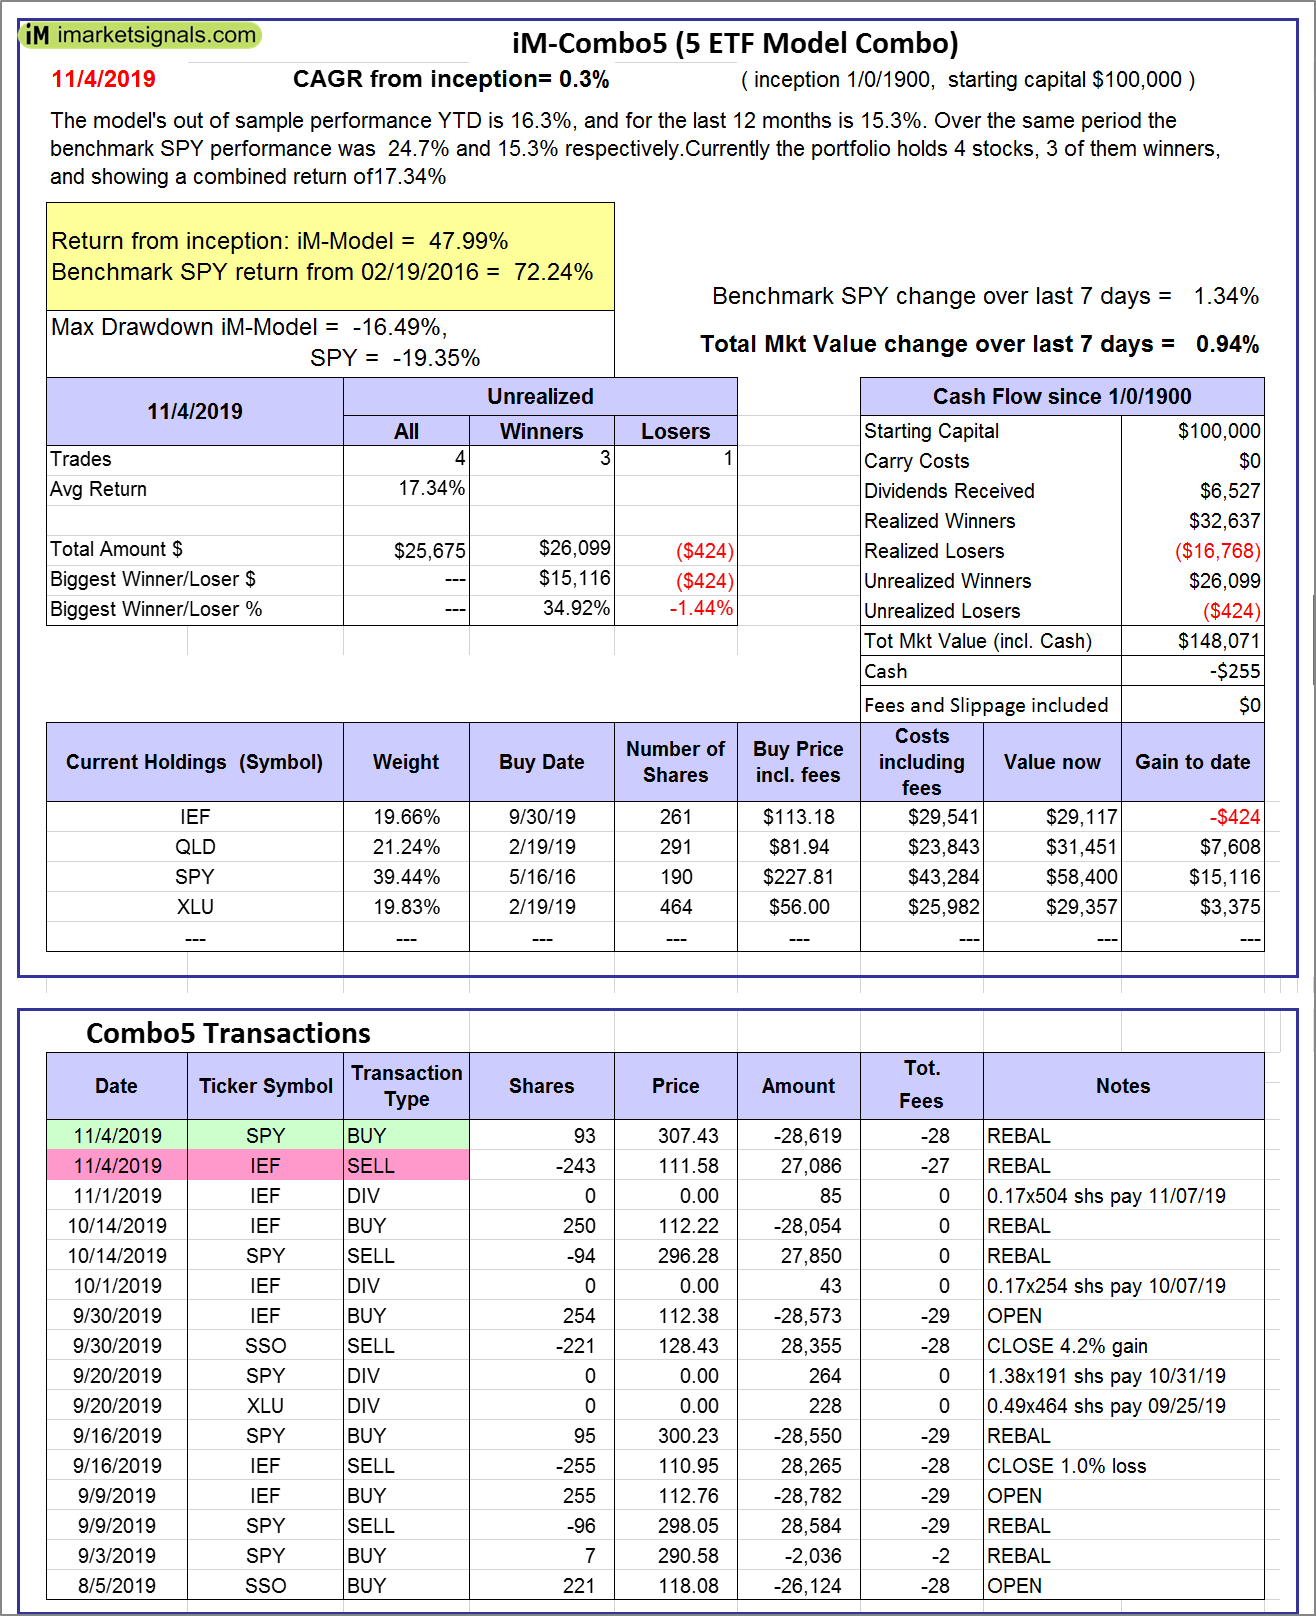 |
iM-Combo5: The model’s out of sample performance YTD is 16.3%, and for the last 12 months is 15.3%. Over the same period the benchmark SPY performance was 24.7% and 15.3% respectively. Over the previous week the market value of iM-Combo5 gained 0.94% at a time when SPY gained 1.34%. A starting capital of $100,000 at inception on 2/22/2016 would have grown to $148,071 which includes -$255 cash and excludes $0 spent on fees and slippage. |
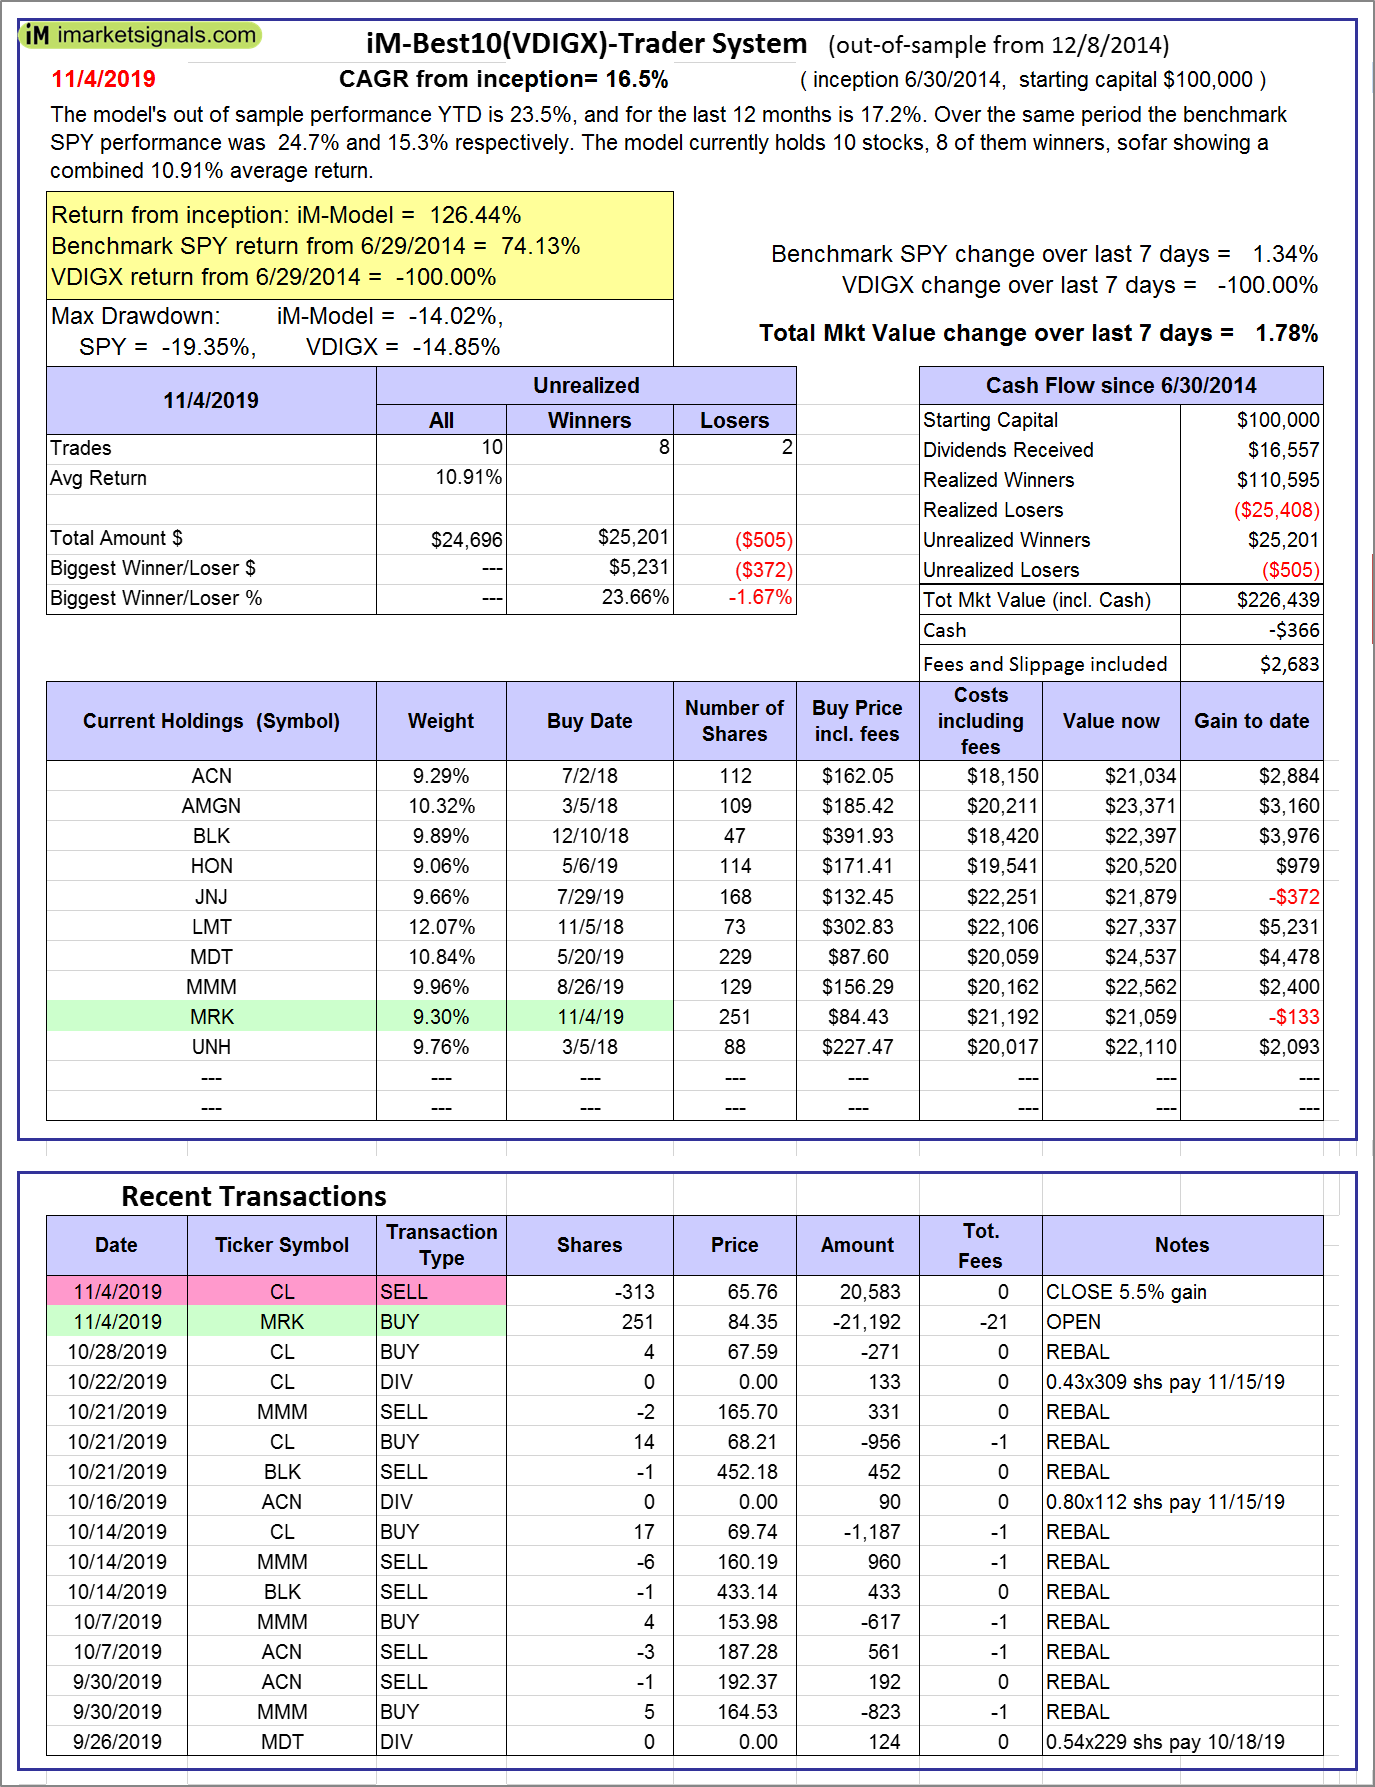 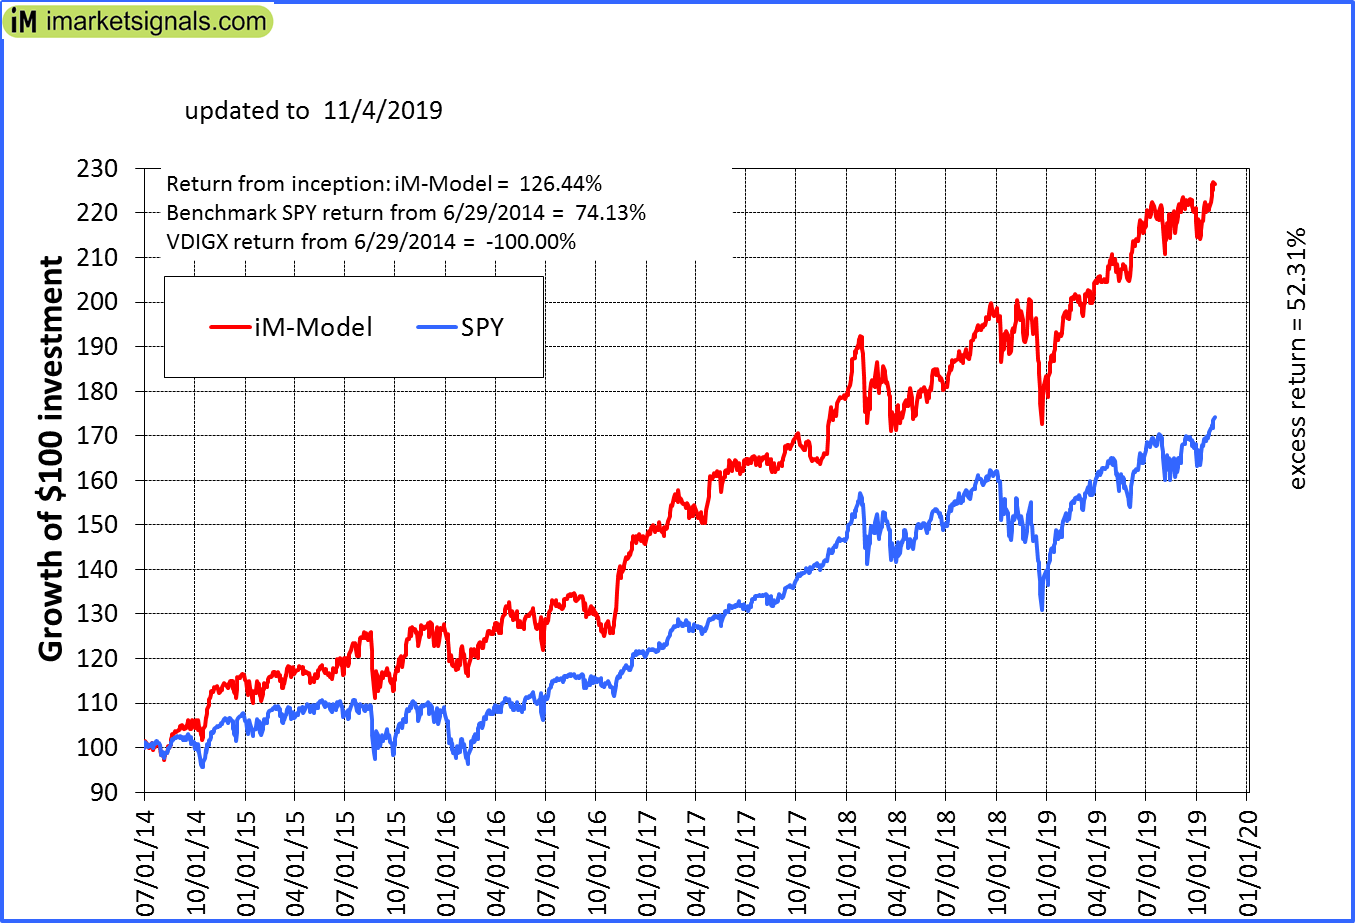 |
iM-Best10(VDIGX)-Trader: The model’s out of sample performance YTD is 23.5%, and for the last 12 months is 17.2%. Over the same period the benchmark SPY performance was 24.7% and 15.3% respectively. Since inception, on 7/1/2014, the model gained 126.44% while the benchmark SPY gained 74.13% and VDIGX gained -100.00% over the same period. Over the previous week the market value of iM-Best10(VDIGX) gained 1.78% at a time when SPY gained 1.34%. A starting capital of $100,000 at inception on 7/1/2014 would have grown to $226,439 which includes -$366 cash and excludes $2,683 spent on fees and slippage. |
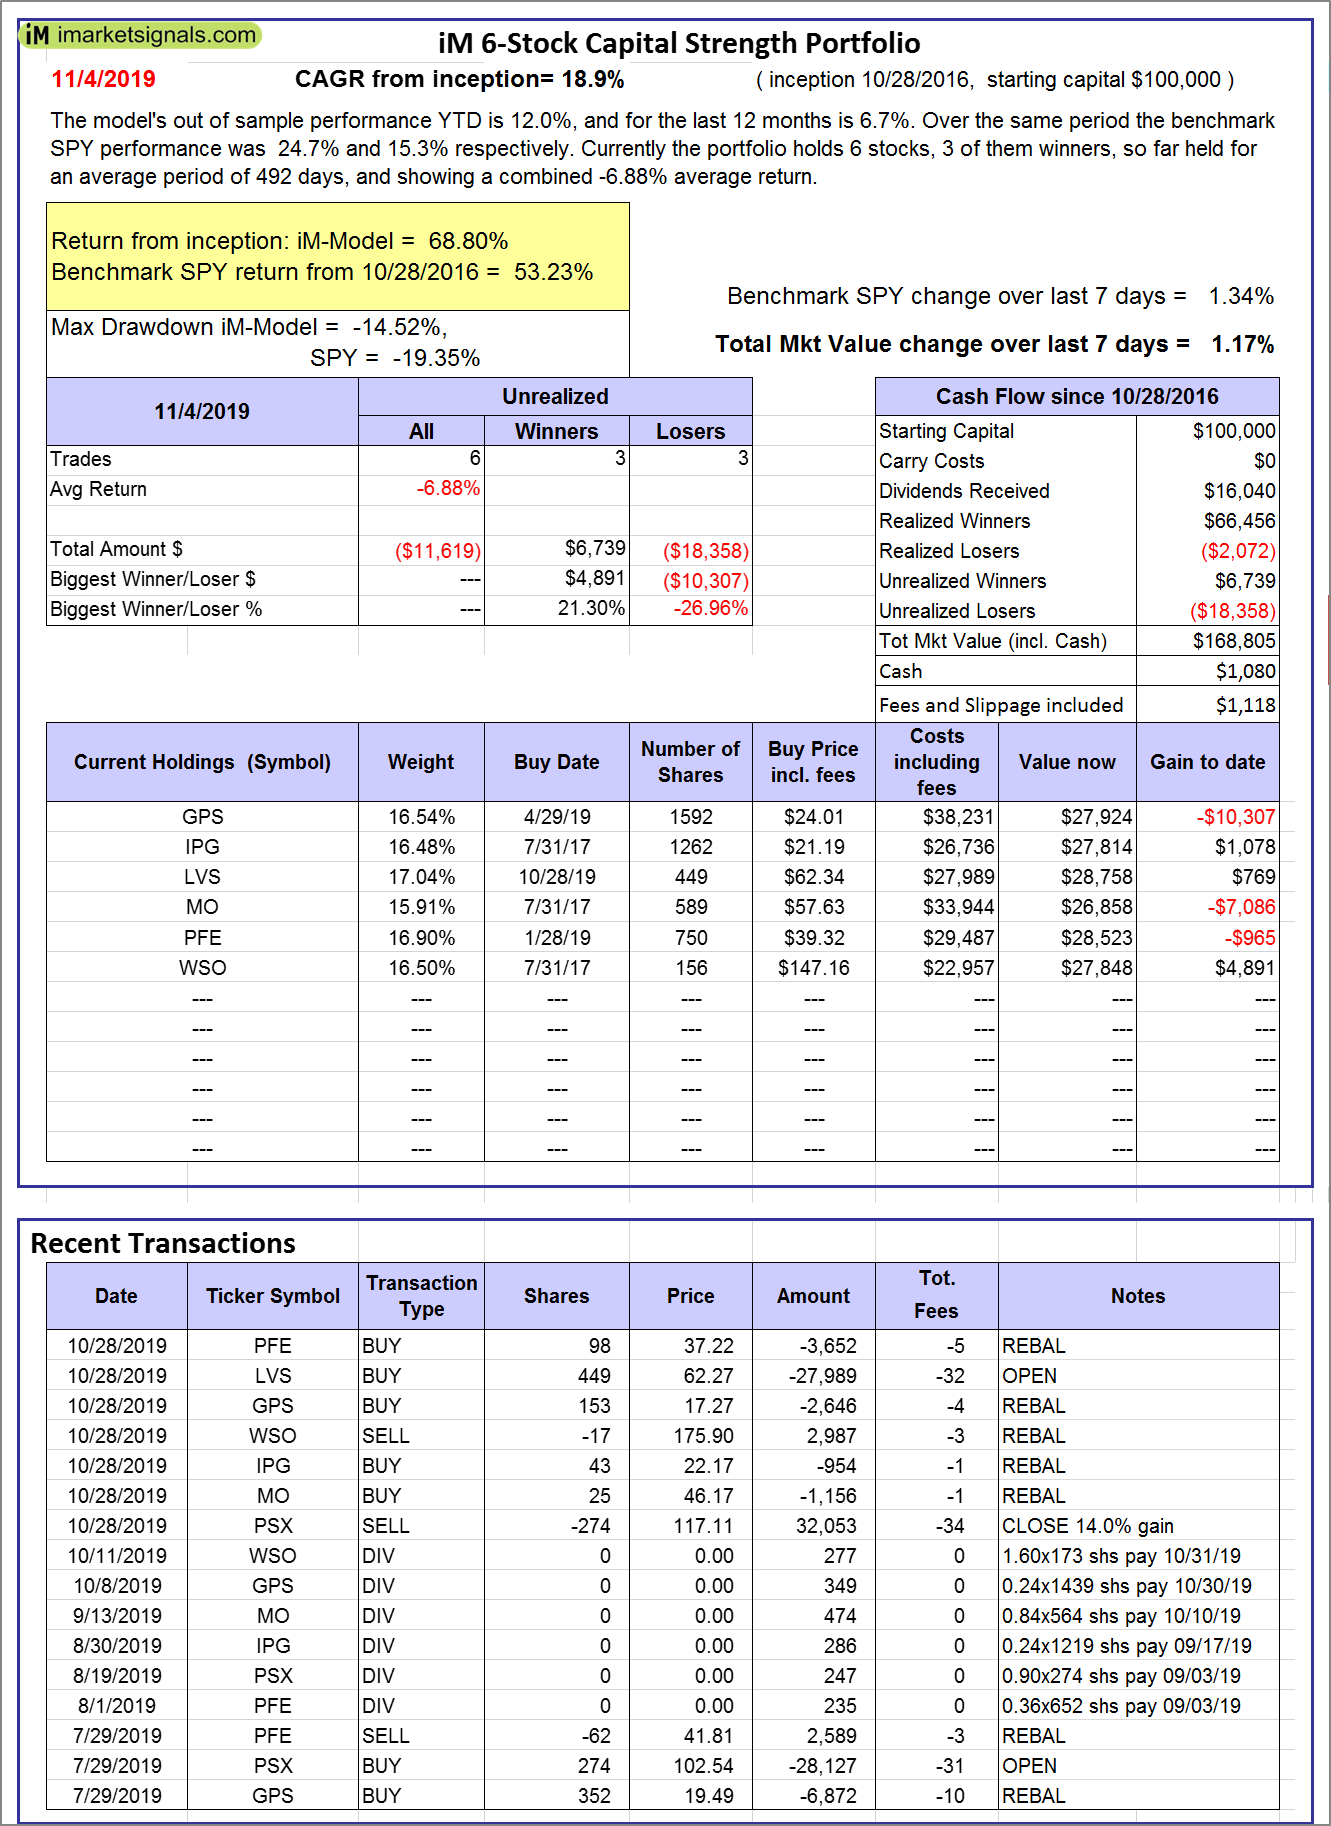 |
iM 6-Stock Capital Strength Portfolio: The model’s out of sample performance YTD is 12.0%, and for the last 12 months is 6.7%. Over the same period the benchmark SPY performance was 24.7% and 15.3% respectively. Over the previous week the market value of the iM 6-Stock Capital Strength Portfolio gained 1.17% at a time when SPY gained 1.34%. A starting capital of $100,000 at inception on 10/28/2016 would have grown to $168,805 which includes $1,080 cash and excludes $1,118 spent on fees and slippage. |
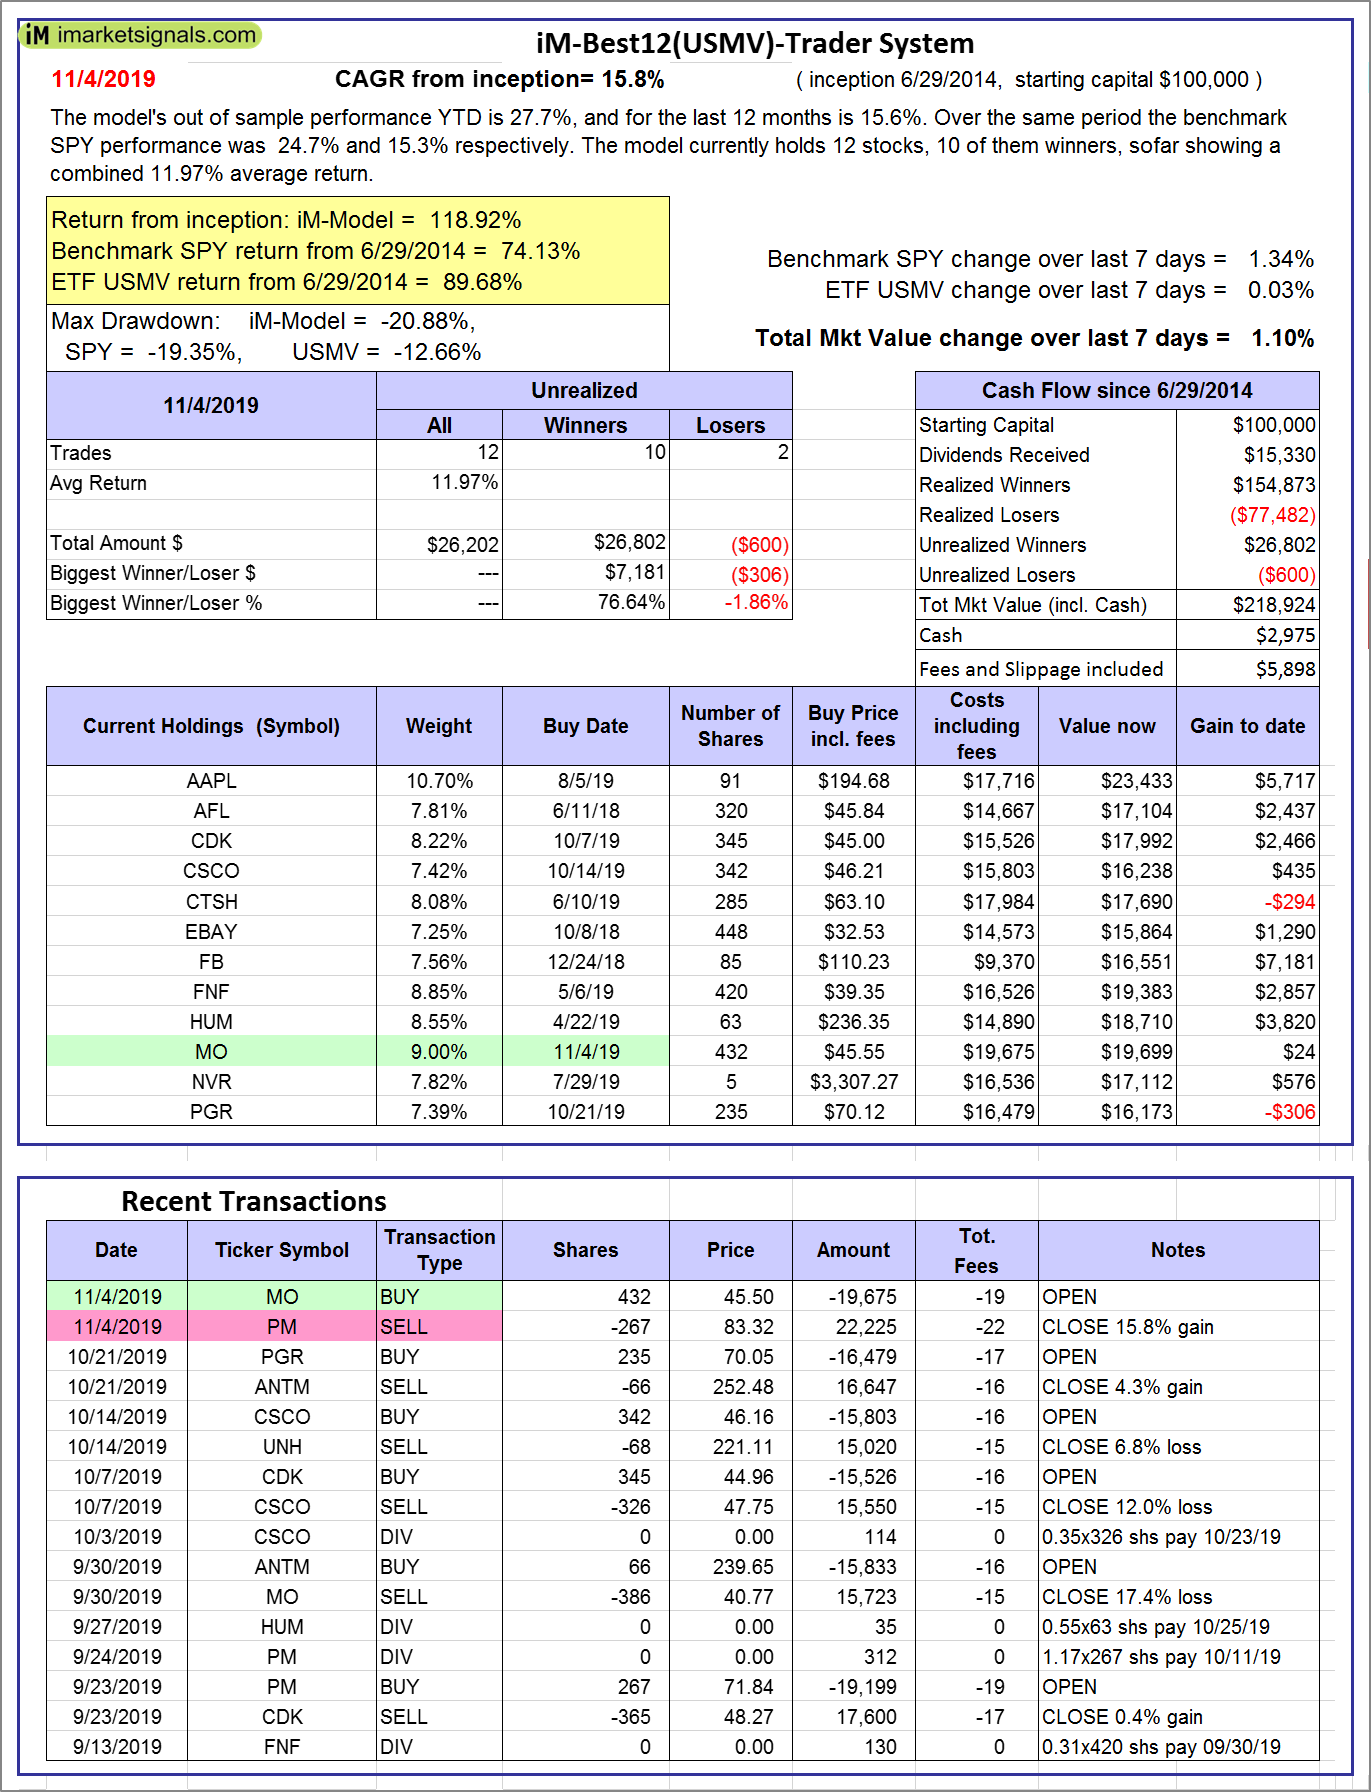 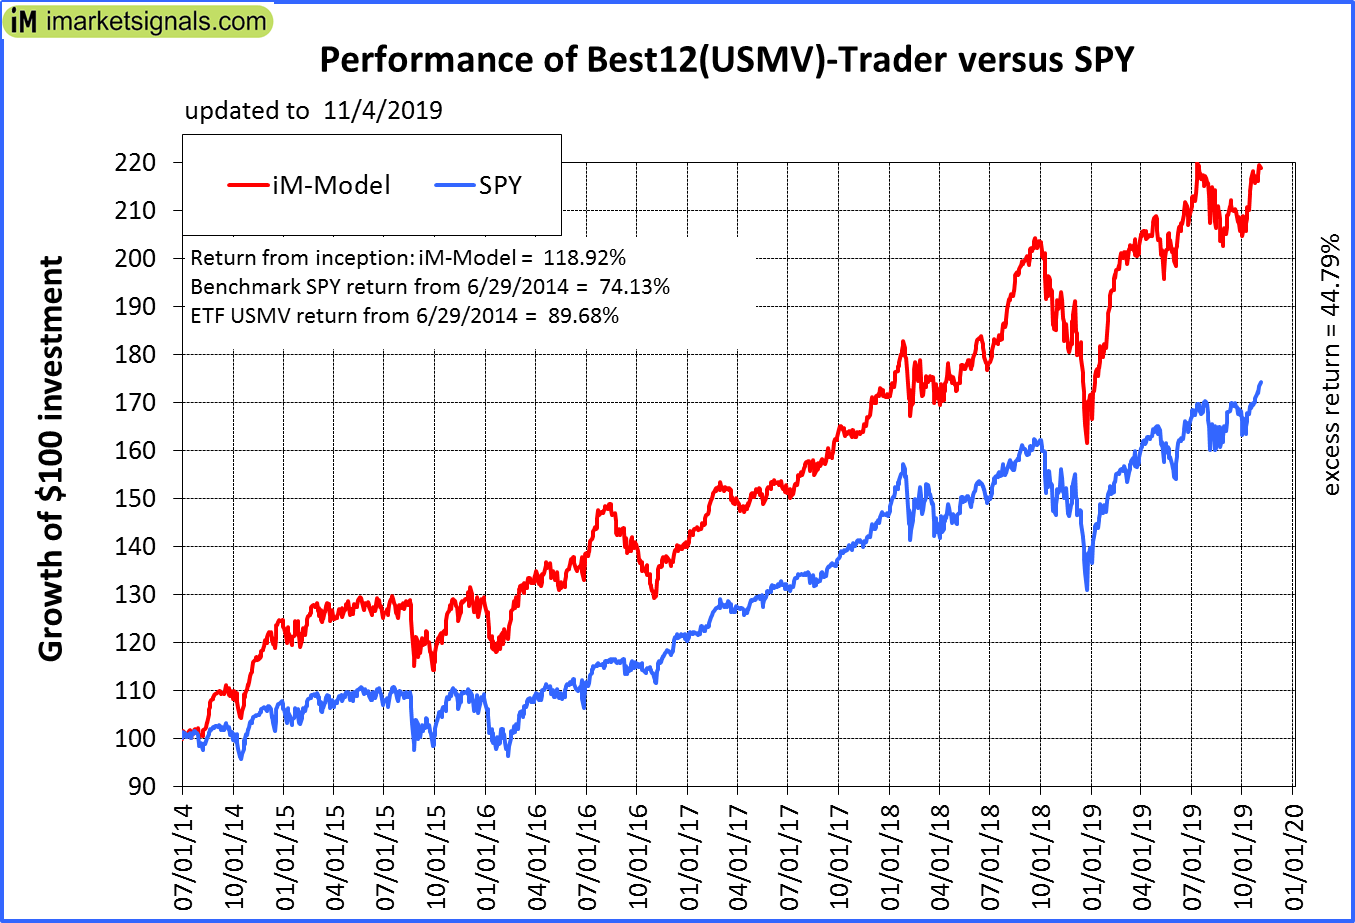 |
iM-Best12(USMV)-Trader: The model’s out of sample performance YTD is 27.7%, and for the last 12 months is 15.6%. Over the same period the benchmark SPY performance was 24.7% and 15.3% respectively. Since inception, on 6/30/2014, the model gained 118.92% while the benchmark SPY gained 74.13% and the ETF USMV gained 89.68% over the same period. Over the previous week the market value of iM-Best12(USMV)-Trader gained 1.10% at a time when SPY gained 1.34%. A starting capital of $100,000 at inception on 6/30/2014 would have grown to $218,924 which includes $2,975 cash and excludes $5,898 spent on fees and slippage. |
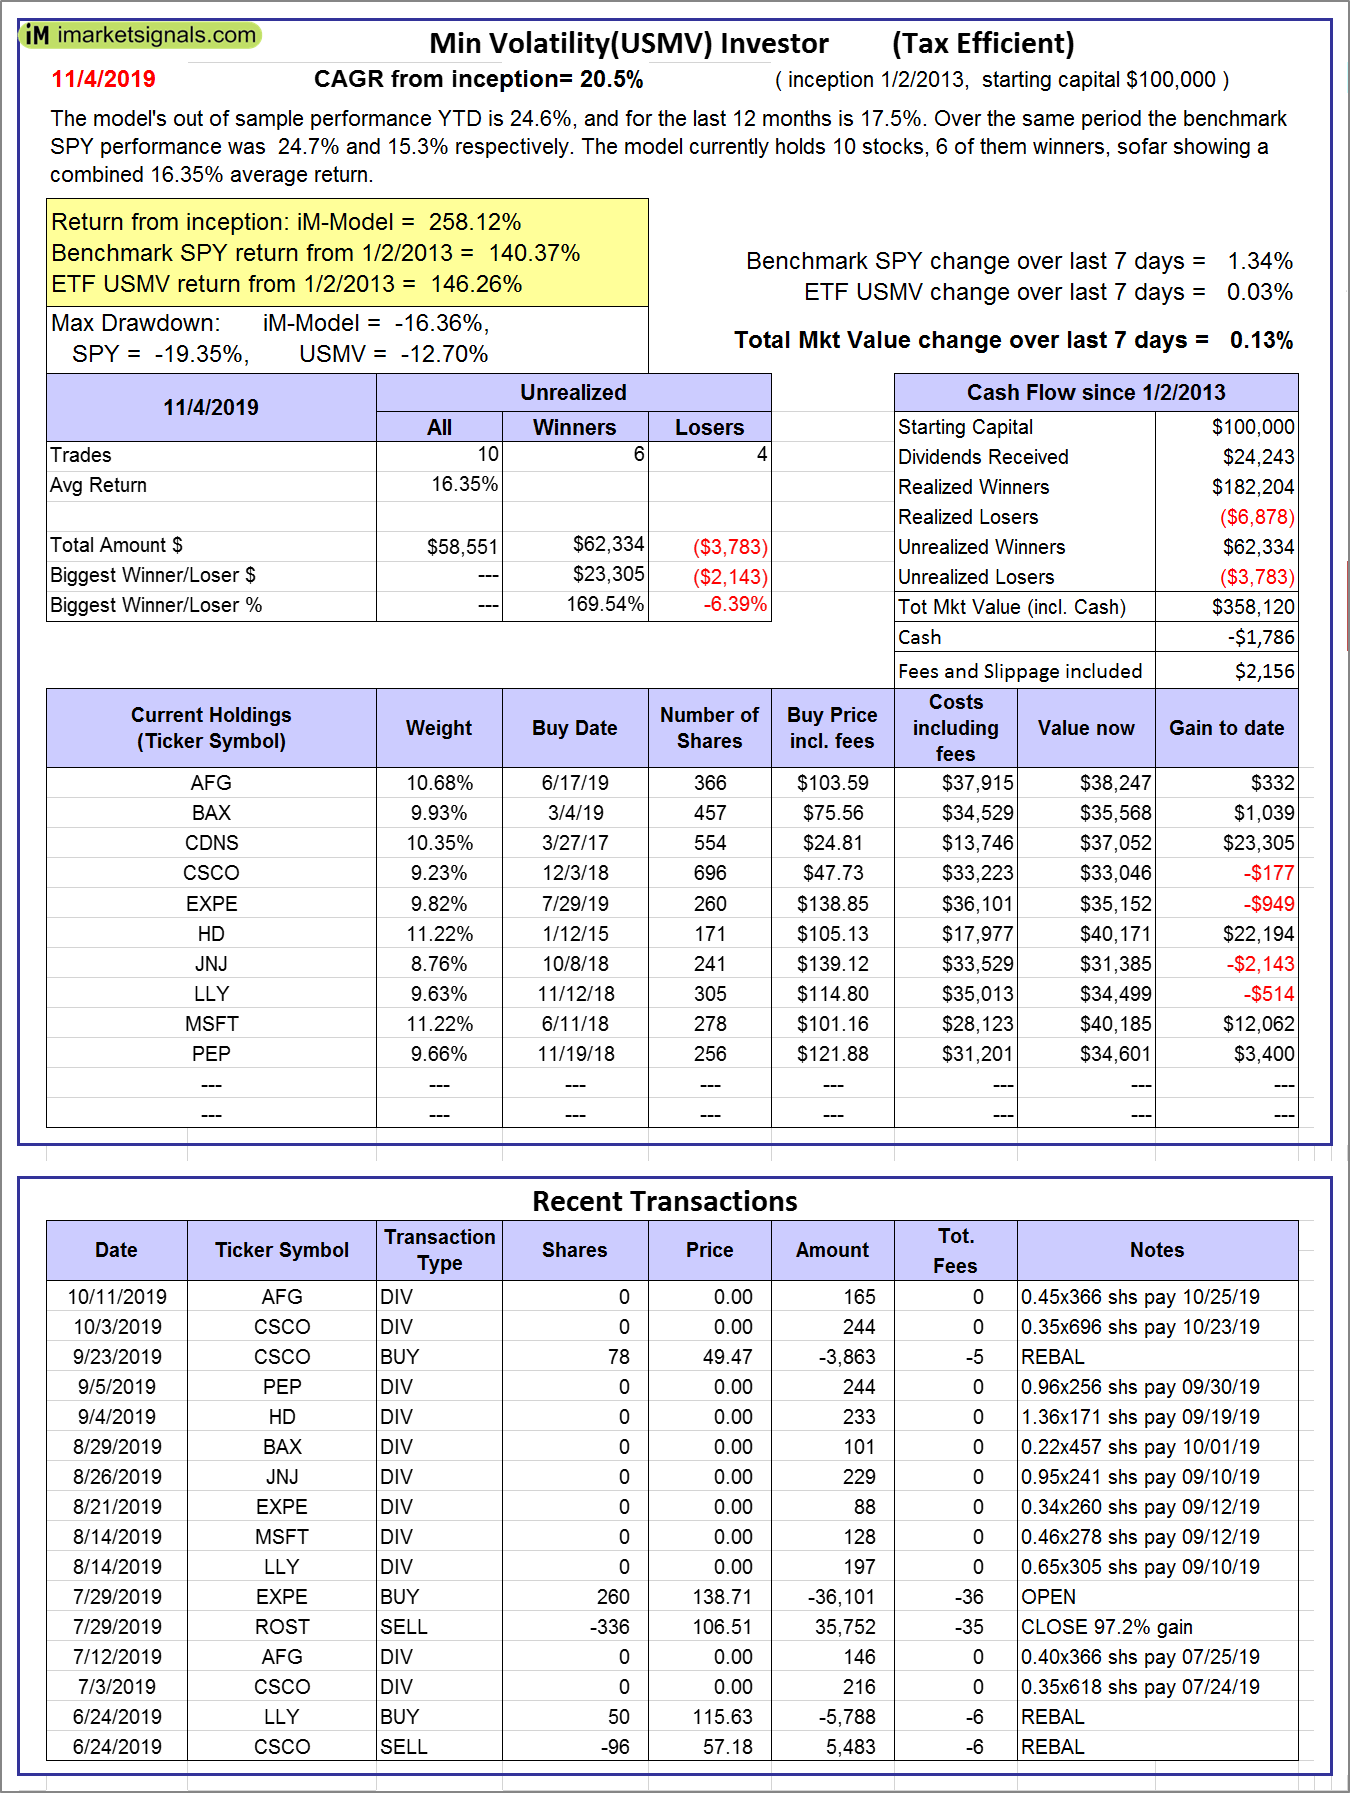 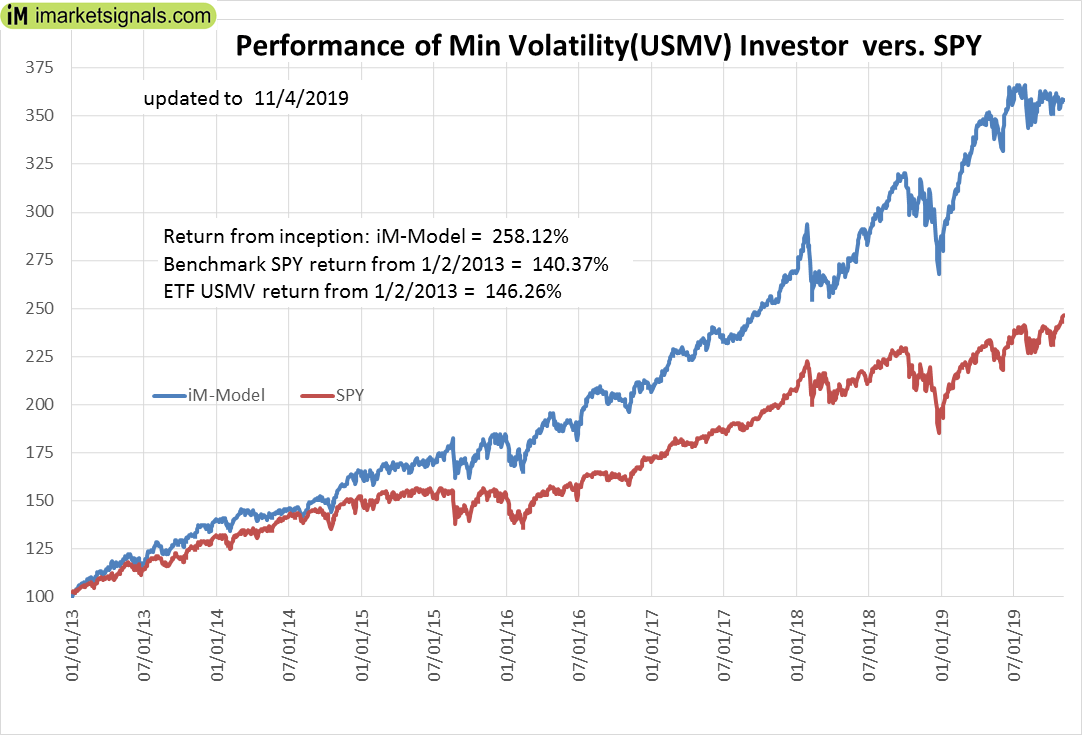 |
iM-Min Volatility(USMV) Investor (Tax Efficient): The model’s out of sample performance YTD is 24.6%, and for the last 12 months is 17.5%. Over the same period the benchmark SPY performance was 24.7% and 15.3% respectively. Since inception, on 1/3/2013, the model gained 258.12% while the benchmark SPY gained 140.37% and the ETF USMV gained 146.26% over the same period. Over the previous week the market value of iM-Best12(USMV)Q1 gained 0.13% at a time when SPY gained 1.34%. A starting capital of $100,000 at inception on 1/3/2013 would have grown to $358,120 which includes -$1,786 cash and excludes $2,156 spent on fees and slippage. |
|
|
iM Min Volatility (USMV) Investor: The model’s out of sample performance YTD is 24.6%, and for the last 12 months is 17.5%. Over the same period the benchmark SPY performance was 24.7% and 15.3% respectively. Since inception, on 1/3/2013, the model gained 258.12% while the benchmark SPY gained 140.37% and the ETF USMV gained 146.26% over the same period. Over the previous week the market value of iM Min Volatility (USMV) Investor gained 0.13% at a time when SPY gained 1.34%. A starting capital of $100,000 at inception on 1/3/2013 would have grown to $358,120 which includes -$1,786 cash and excludes $2,156 spent on fees and slippage. |
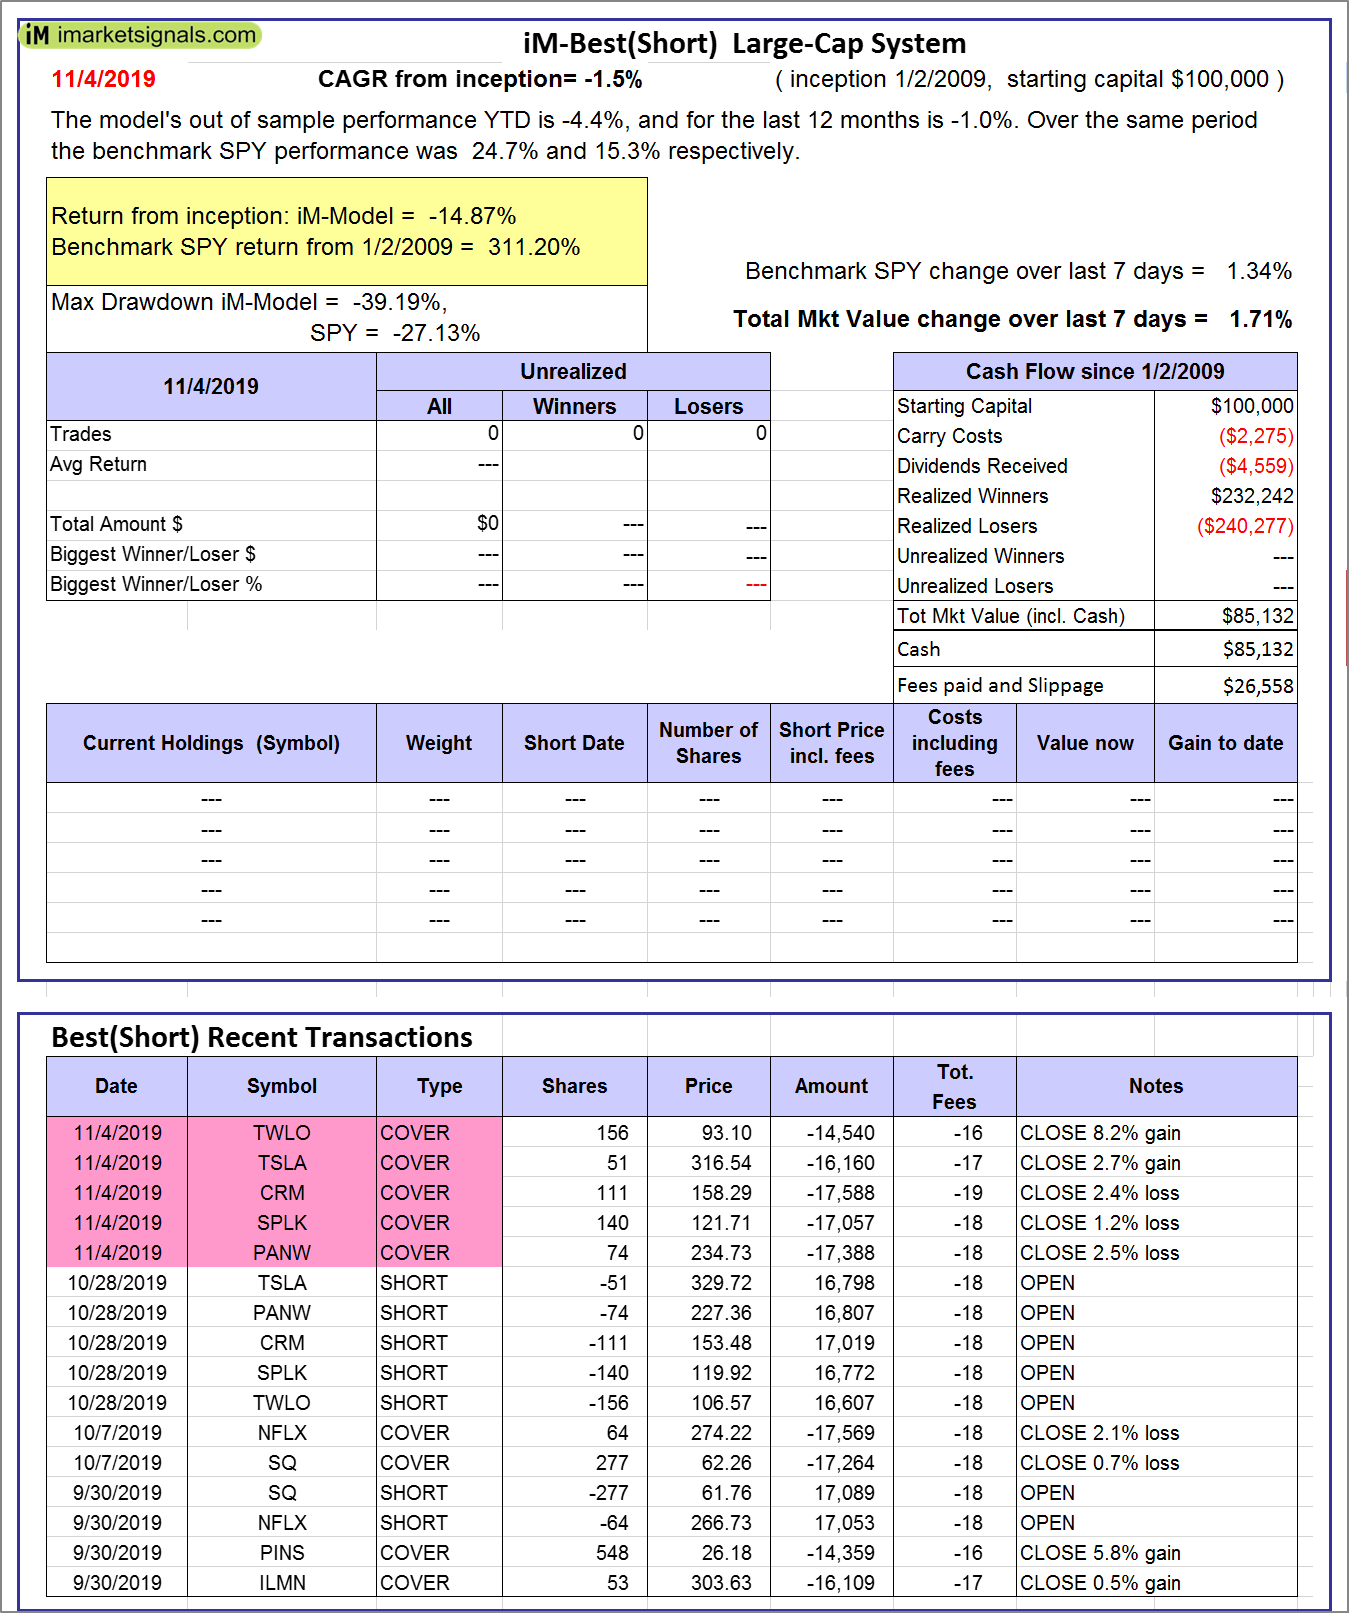 |
iM-Best(Short): The model’s out of sample performance YTD is -4.4%, and for the last 12 months is -1.0%. Over the same period the benchmark SPY performance was 24.7% and 15.3% respectively. Over the previous week the market value of iM-Best(Short) gained 1.71% at a time when SPY gained 1.34%. Over the period 1/2/2009 to 11/4/2019 the starting capital of $100,000 would have grown to $85,132 which includes $85,132 cash and excludes $26,558 spent on fees and slippage. |
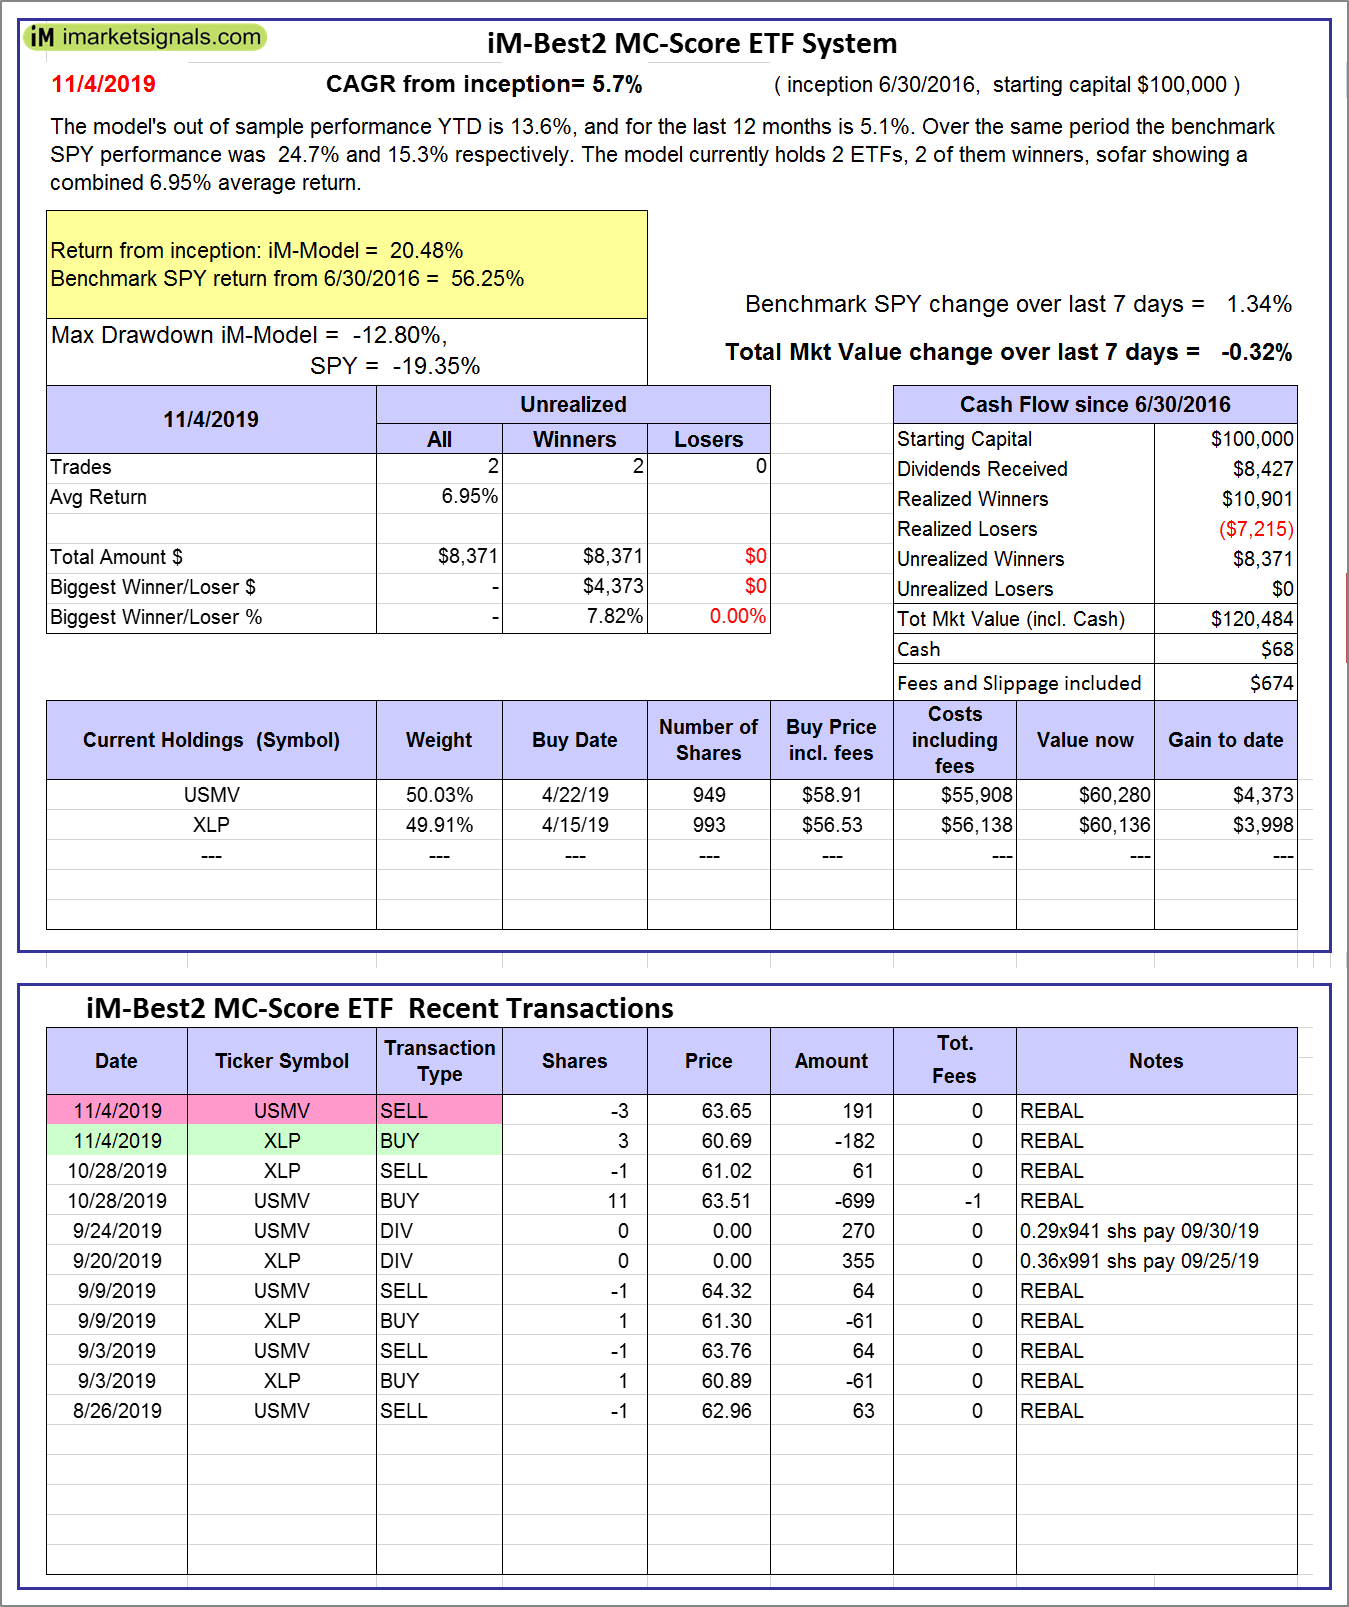 |
iM-Best2 MC-Score ETF System: The model’s out of sample performance YTD is 13.6%, and for the last 12 months is 5.1%. Over the same period the benchmark SPY performance was 24.7% and 15.3% respectively. Over the previous week the market value of the iM-Best2 MC-Score ETF System gained -0.32% at a time when SPY gained 1.34%. A starting capital of $100,000 at inception on 6/30/2016 would have grown to $120,484 which includes $68 cash and excludes $674 spent on fees and slippage. |
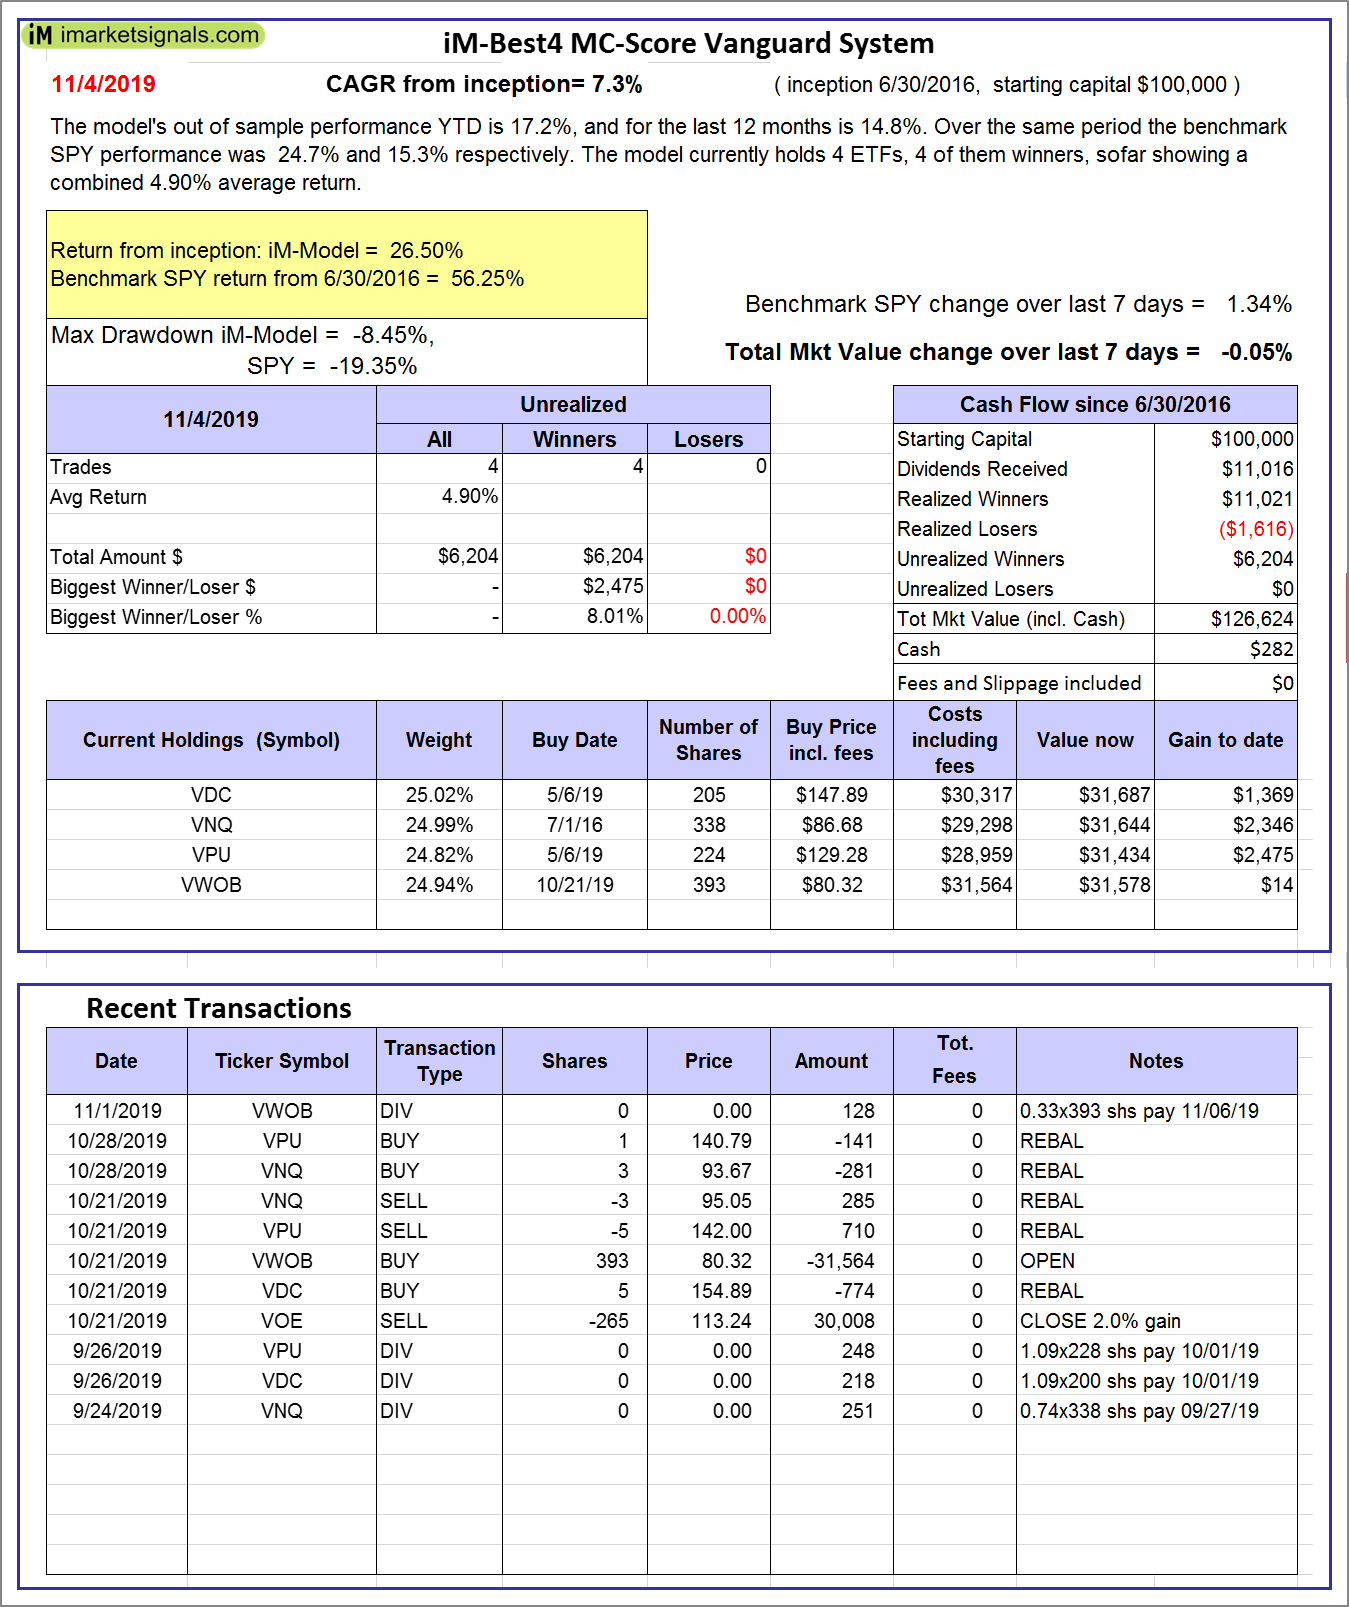 |
iM-Best4 MC-Score Vanguard System: The model’s out of sample performance YTD is 17.2%, and for the last 12 months is 14.8%. Over the same period the benchmark SPY performance was 24.7% and 15.3% respectively. Over the previous week the market value of the iM-Best4 MC-Score Vanguard System gained -0.05% at a time when SPY gained 1.34%. A starting capital of $100,000 at inception on 6/30/2016 would have grown to $126,624 which includes $282 cash and excludes $00 spent on fees and slippage. |
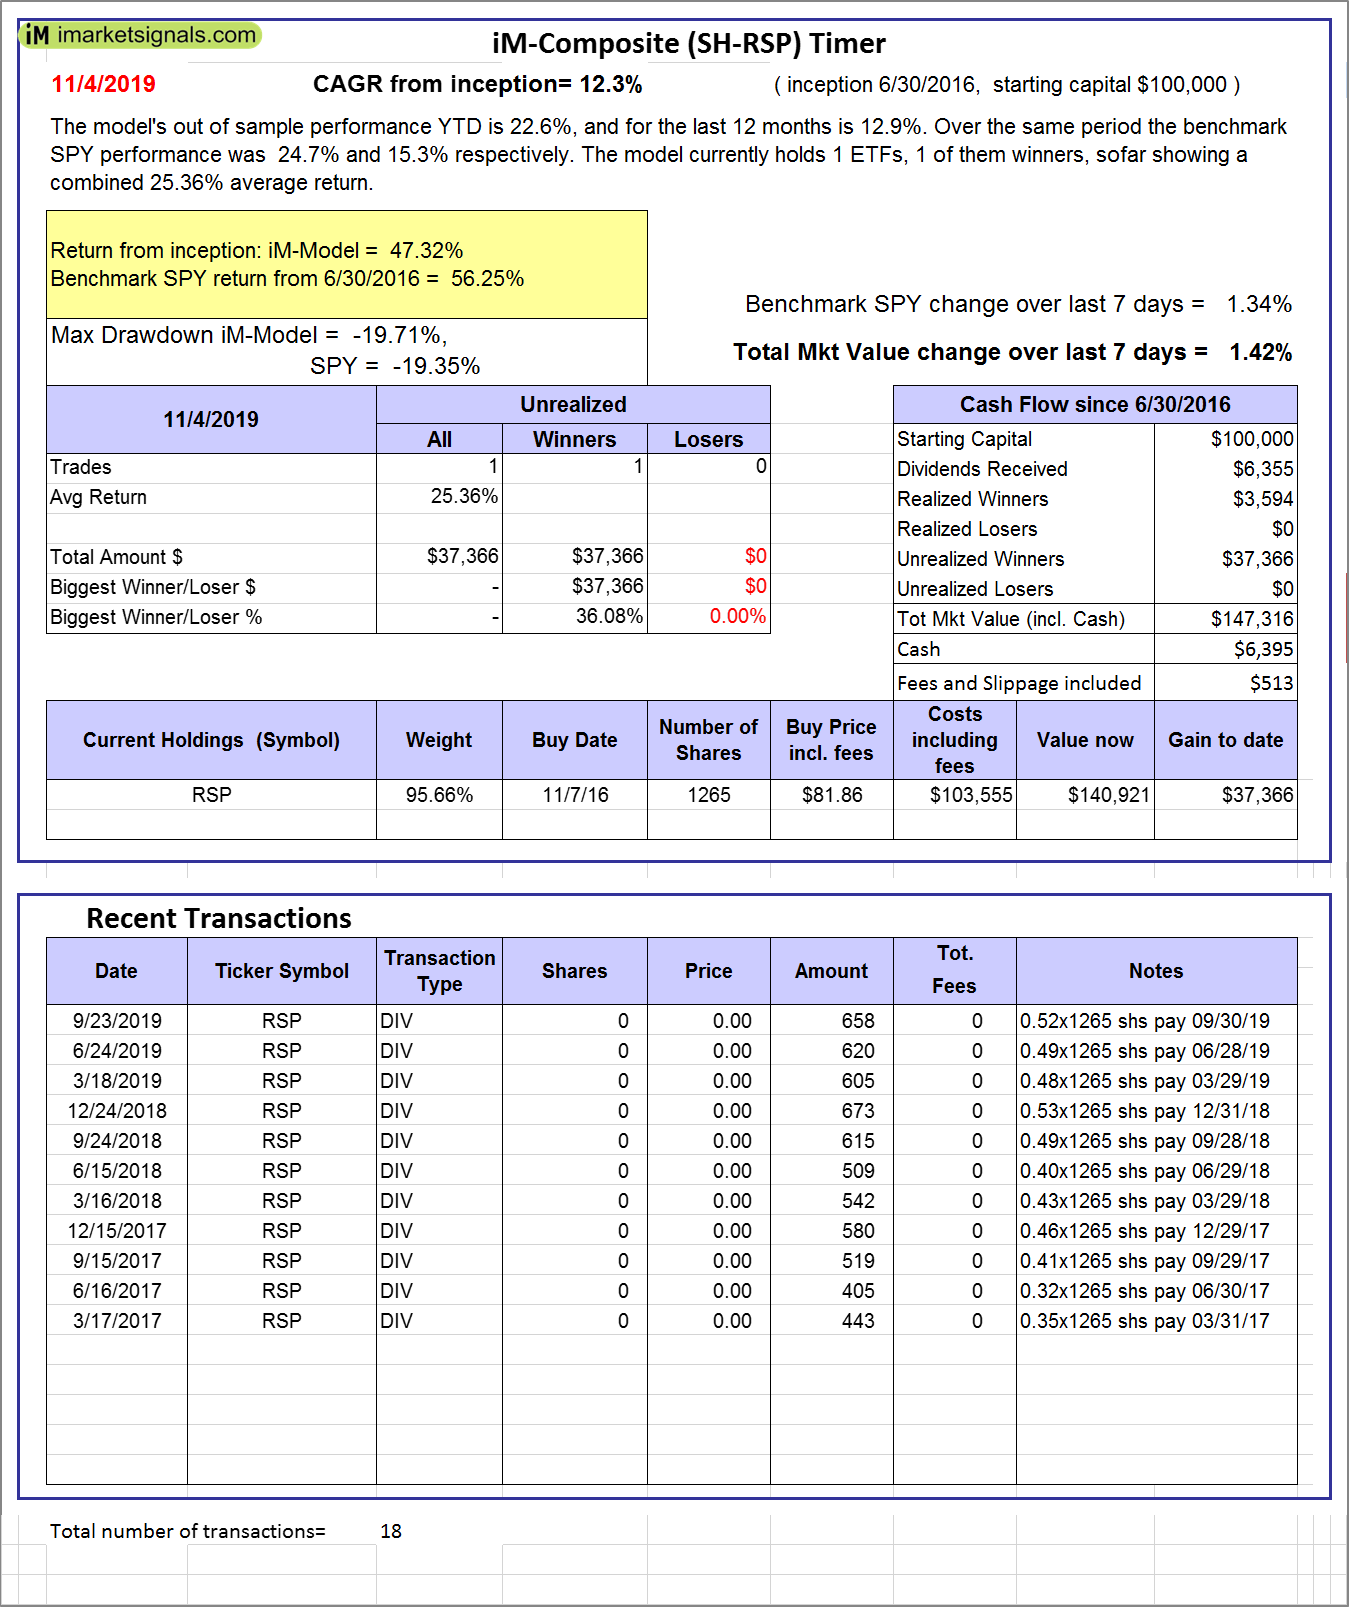 |
iM-Composite (SH-RSP) Timer: The model’s out of sample performance YTD is 22.6%, and for the last 12 months is 12.9%. Over the same period the benchmark SPY performance was 24.7% and 15.3% respectively. Over the previous week the market value of the iM-Composite (SH-RSP) Timer gained 1.42% at a time when SPY gained 1.34%. A starting capital of $100,000 at inception on 6/30/2016 would have grown to $147,316 which includes $6,395 cash and excludes $513 spent on fees and slippage. |
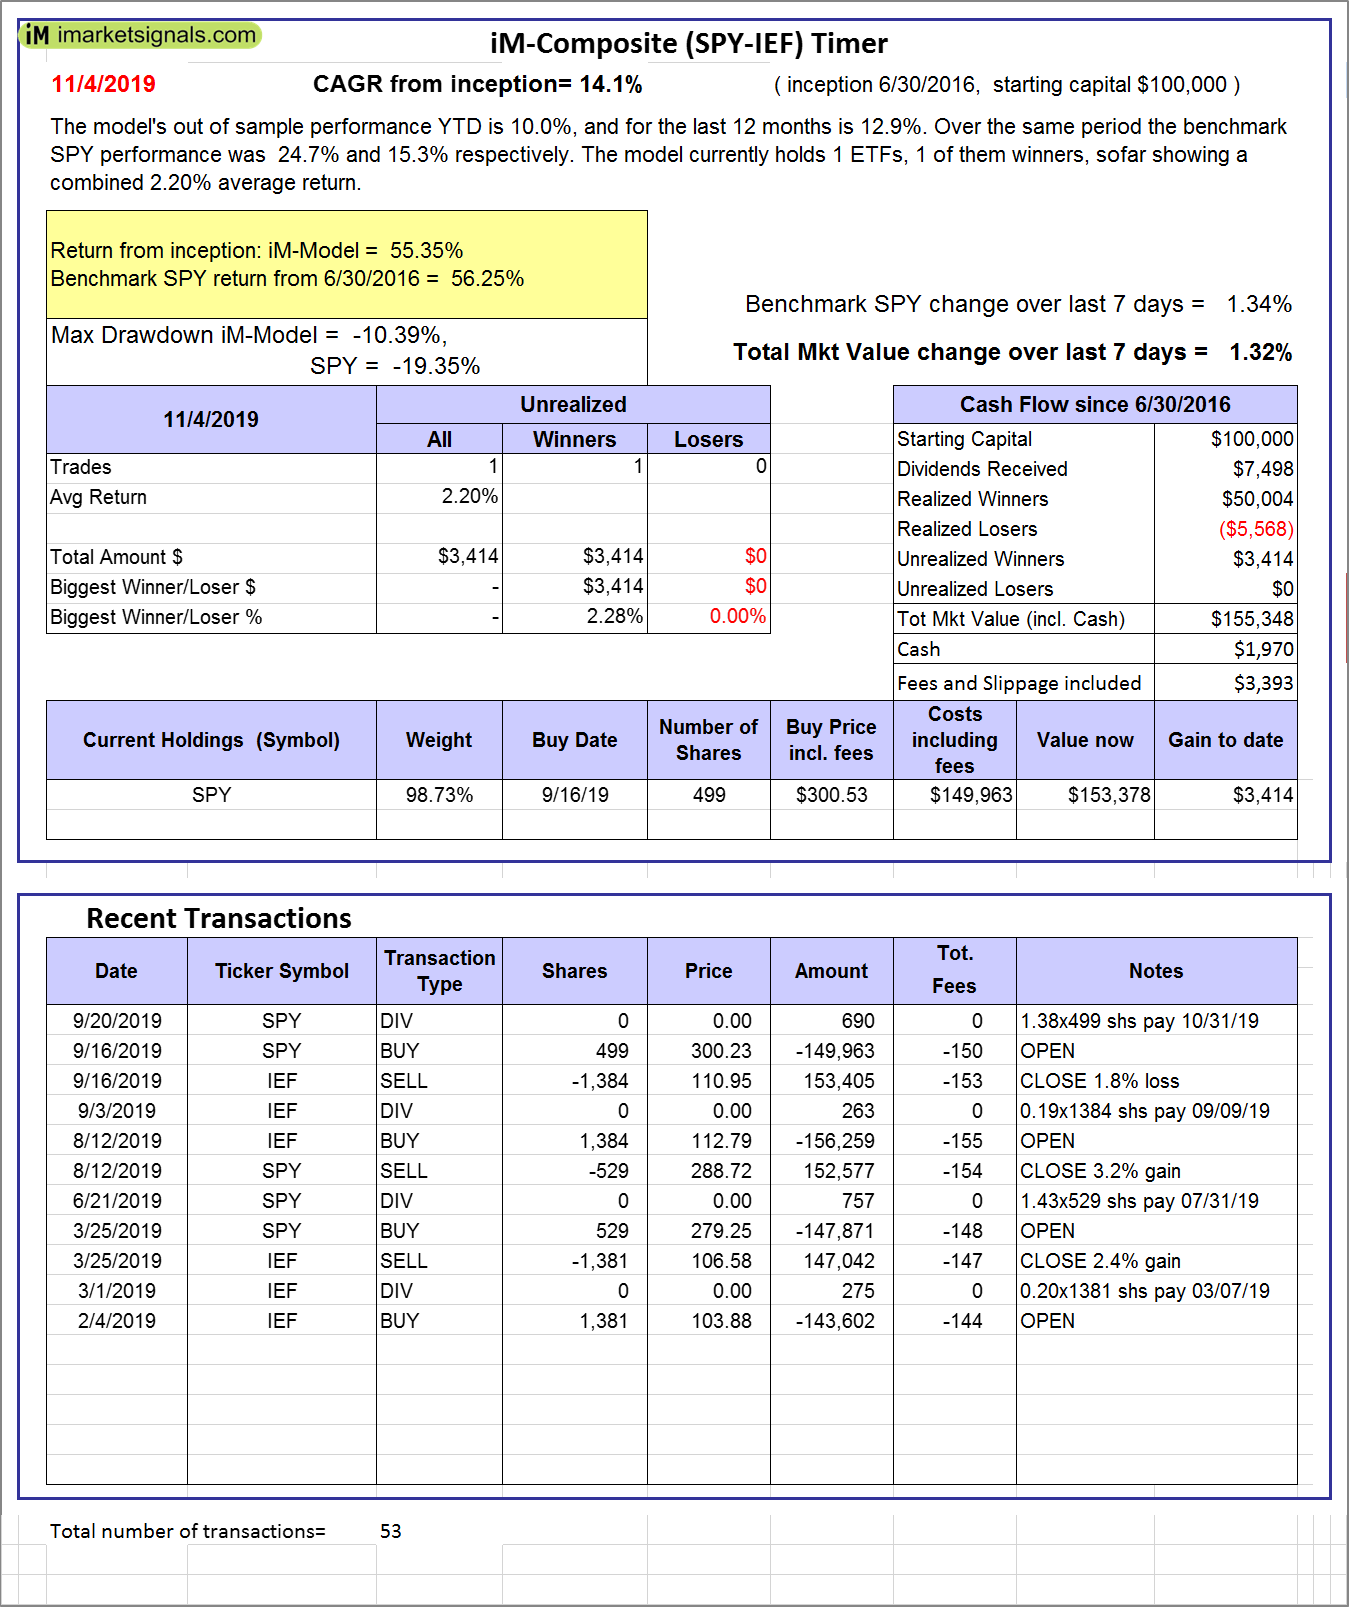 |
iM-Composite (SPY-IEF) Timer: The model’s out of sample performance YTD is 10.0%, and for the last 12 months is 12.9%. Over the same period the benchmark SPY performance was 24.7% and 15.3% respectively. Over the previous week the market value of the iM-Composite (SPY-IEF) Timer gained 1.32% at a time when SPY gained 1.34%. A starting capital of $100,000 at inception on 6/30/2016 would have grown to $155,348 which includes $1,970 cash and excludes $3,393 spent on fees and slippage. |
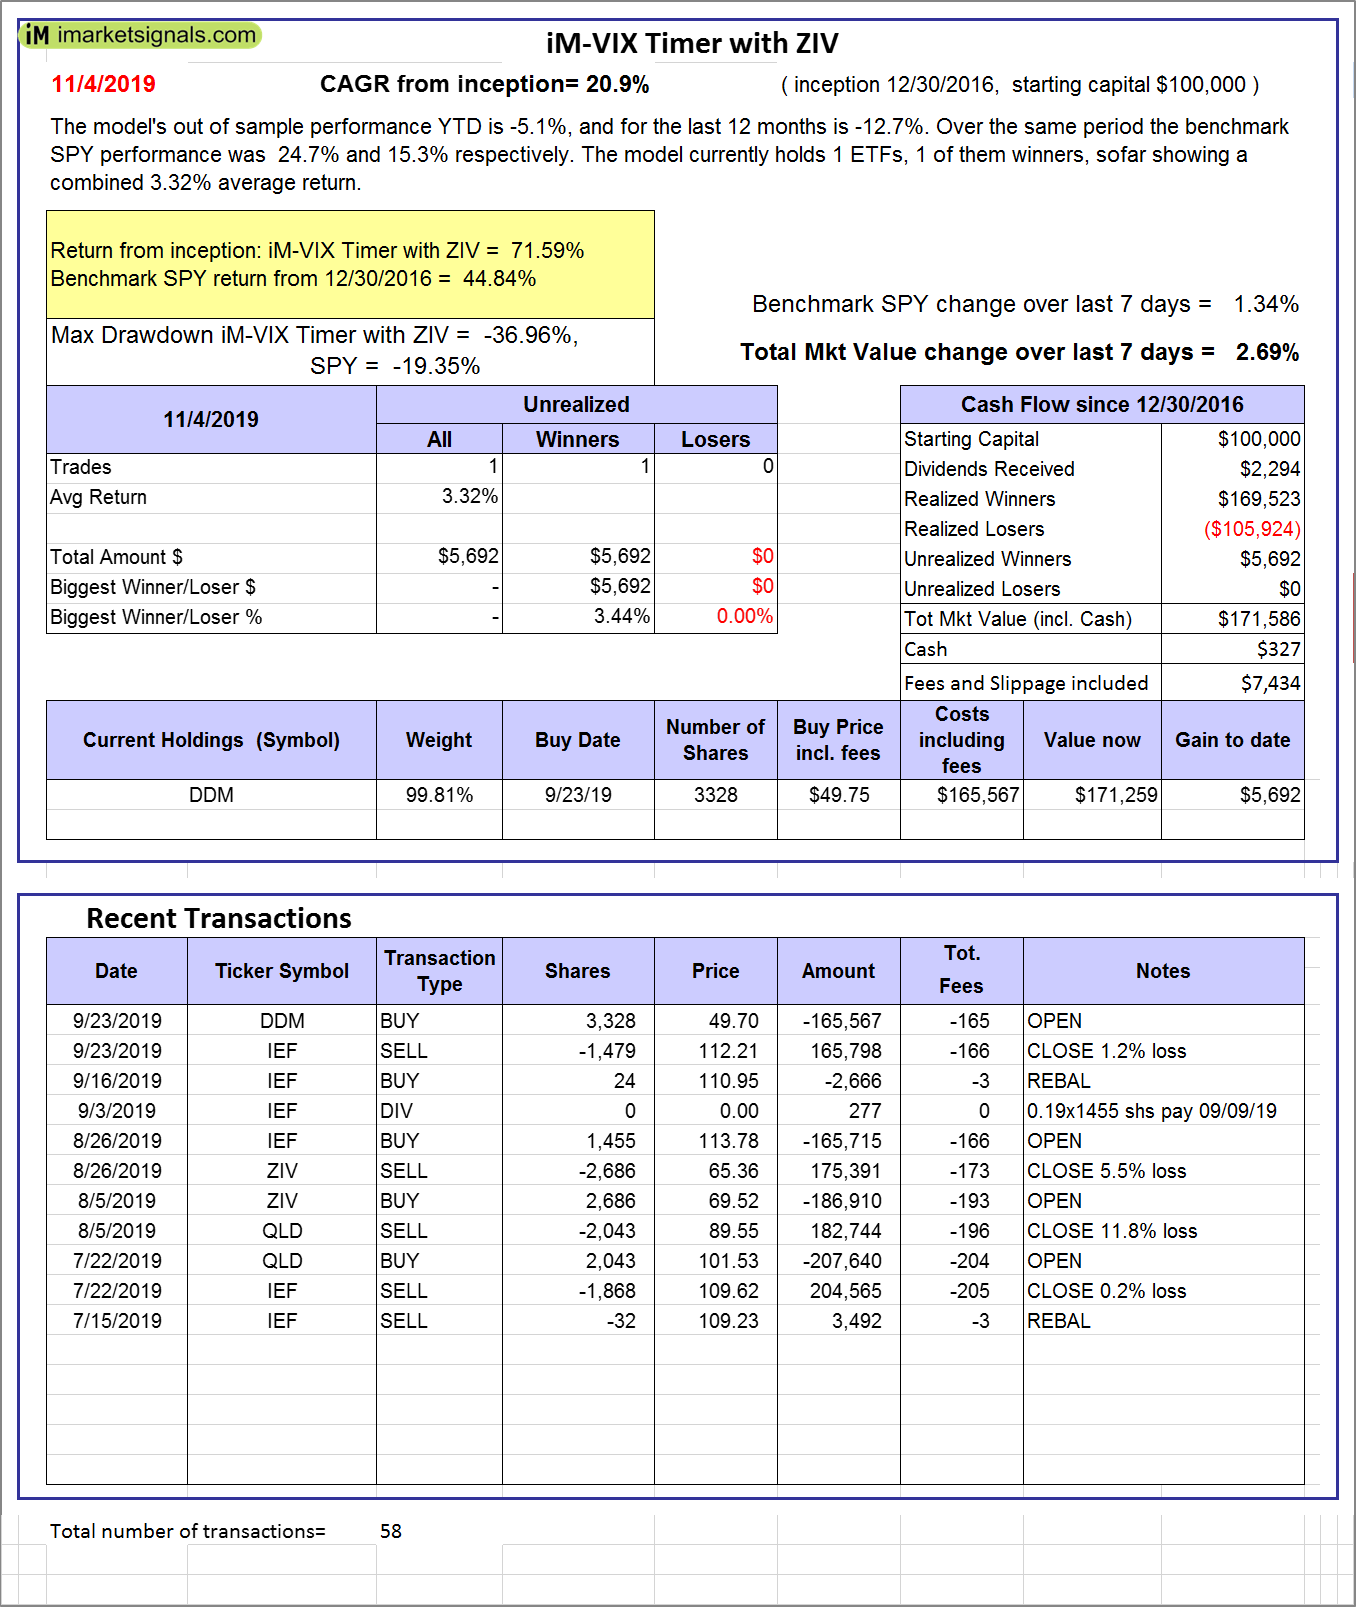 |
iM-VIX Timer with ZIV: The model’s out of sample performance YTD is -5.1%, and for the last 12 months is -12.7%. Over the same period the benchmark SPY performance was 24.7% and 15.3% respectively. Over the previous week the market value of the iM-VIX Timer with ZIV gained 2.69% at a time when SPY gained 1.34%. A starting capital of $100,000 at inception on 6/30/2016 would have grown to $171,586 which includes $327 cash and excludes $7,434 spent on fees and slippage. |
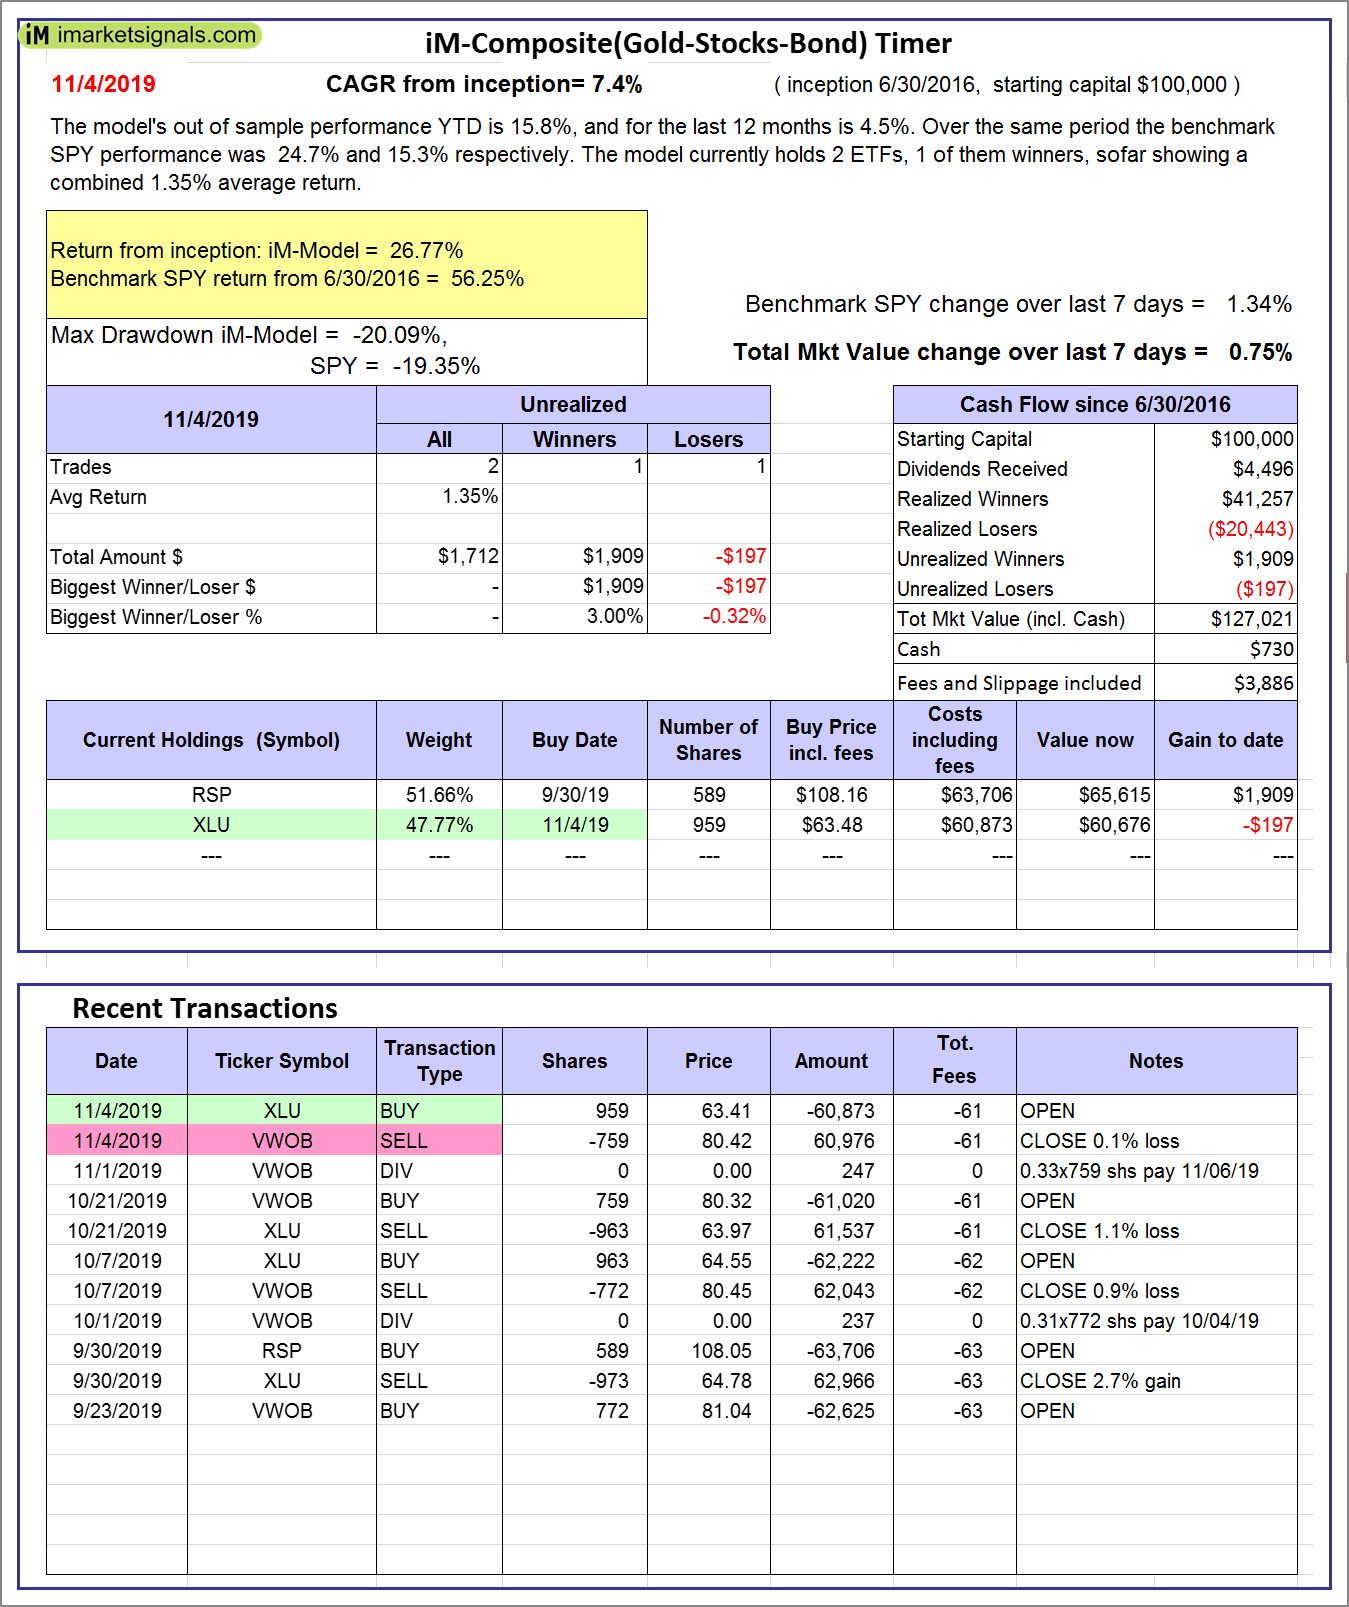 |
iM-Composite(Gold-Stocks-Bond) Timer: The model’s out of sample performance YTD is 15.8%, and for the last 12 months is 4.5%. Over the same period the benchmark SPY performance was 24.7% and 15.3% respectively. Over the previous week the market value of the iM-Composite(Gold-Stocks-Bond) Timer gained 0.75% at a time when SPY gained 1.34%. A starting capital of $100,000 at inception on 6/30/2016 would have grown to $127,021 which includes $730 cash and excludes $3,886 spent on fees and slippage. |
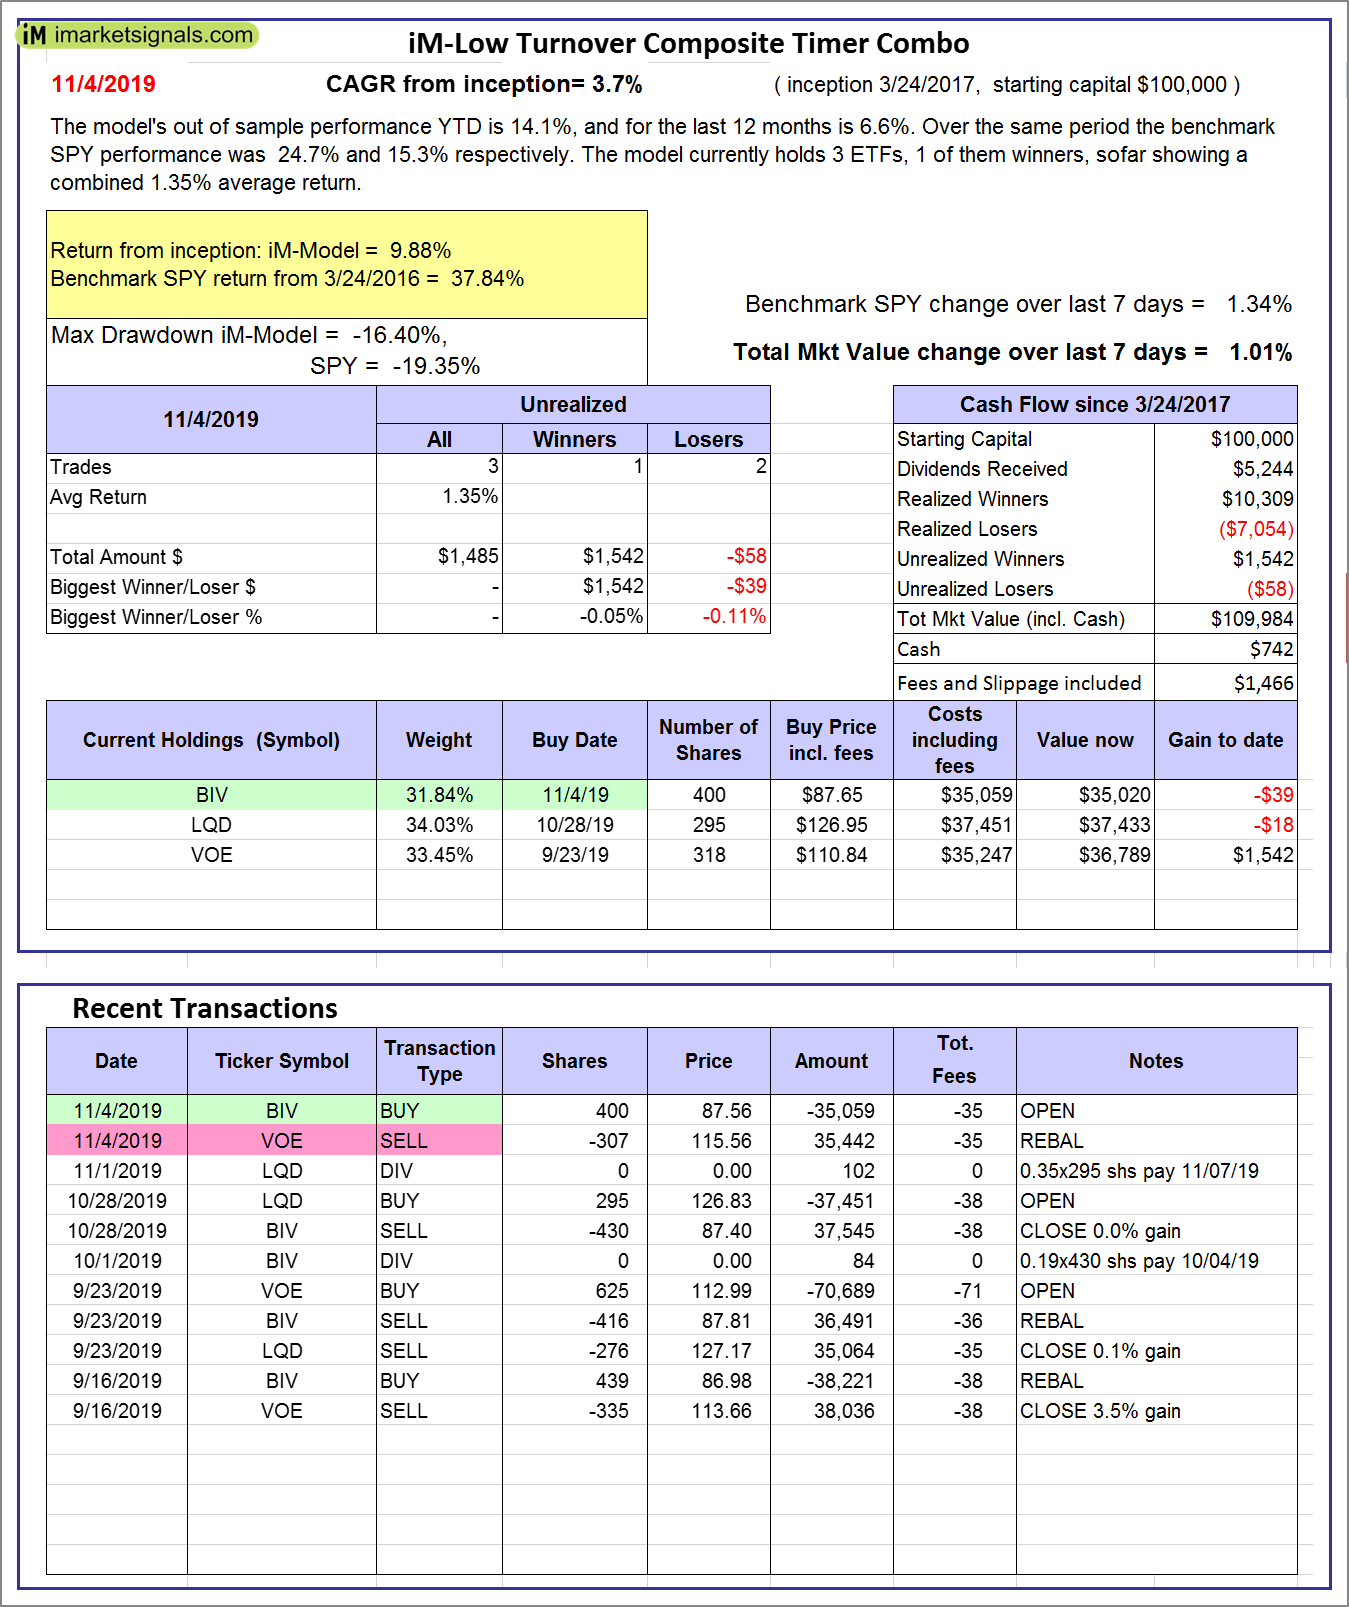 |
iM-Low Turnover Composite Timer Combo: The model’s out of sample performance YTD is 14.1%, and for the last 12 months is 6.6%. Over the same period the benchmark SPY performance was 24.7% and 15.3% respectively. Over the previous week the market value of the iM-Low Turnover Composite Timer Combo gained 1.01% at a time when SPY gained 1.34%. A starting capital of $100,000 at inception on 3/24/27 would have grown to $109,984 which includes $742 cash and excludes $1,466 spent on fees and slippage. |
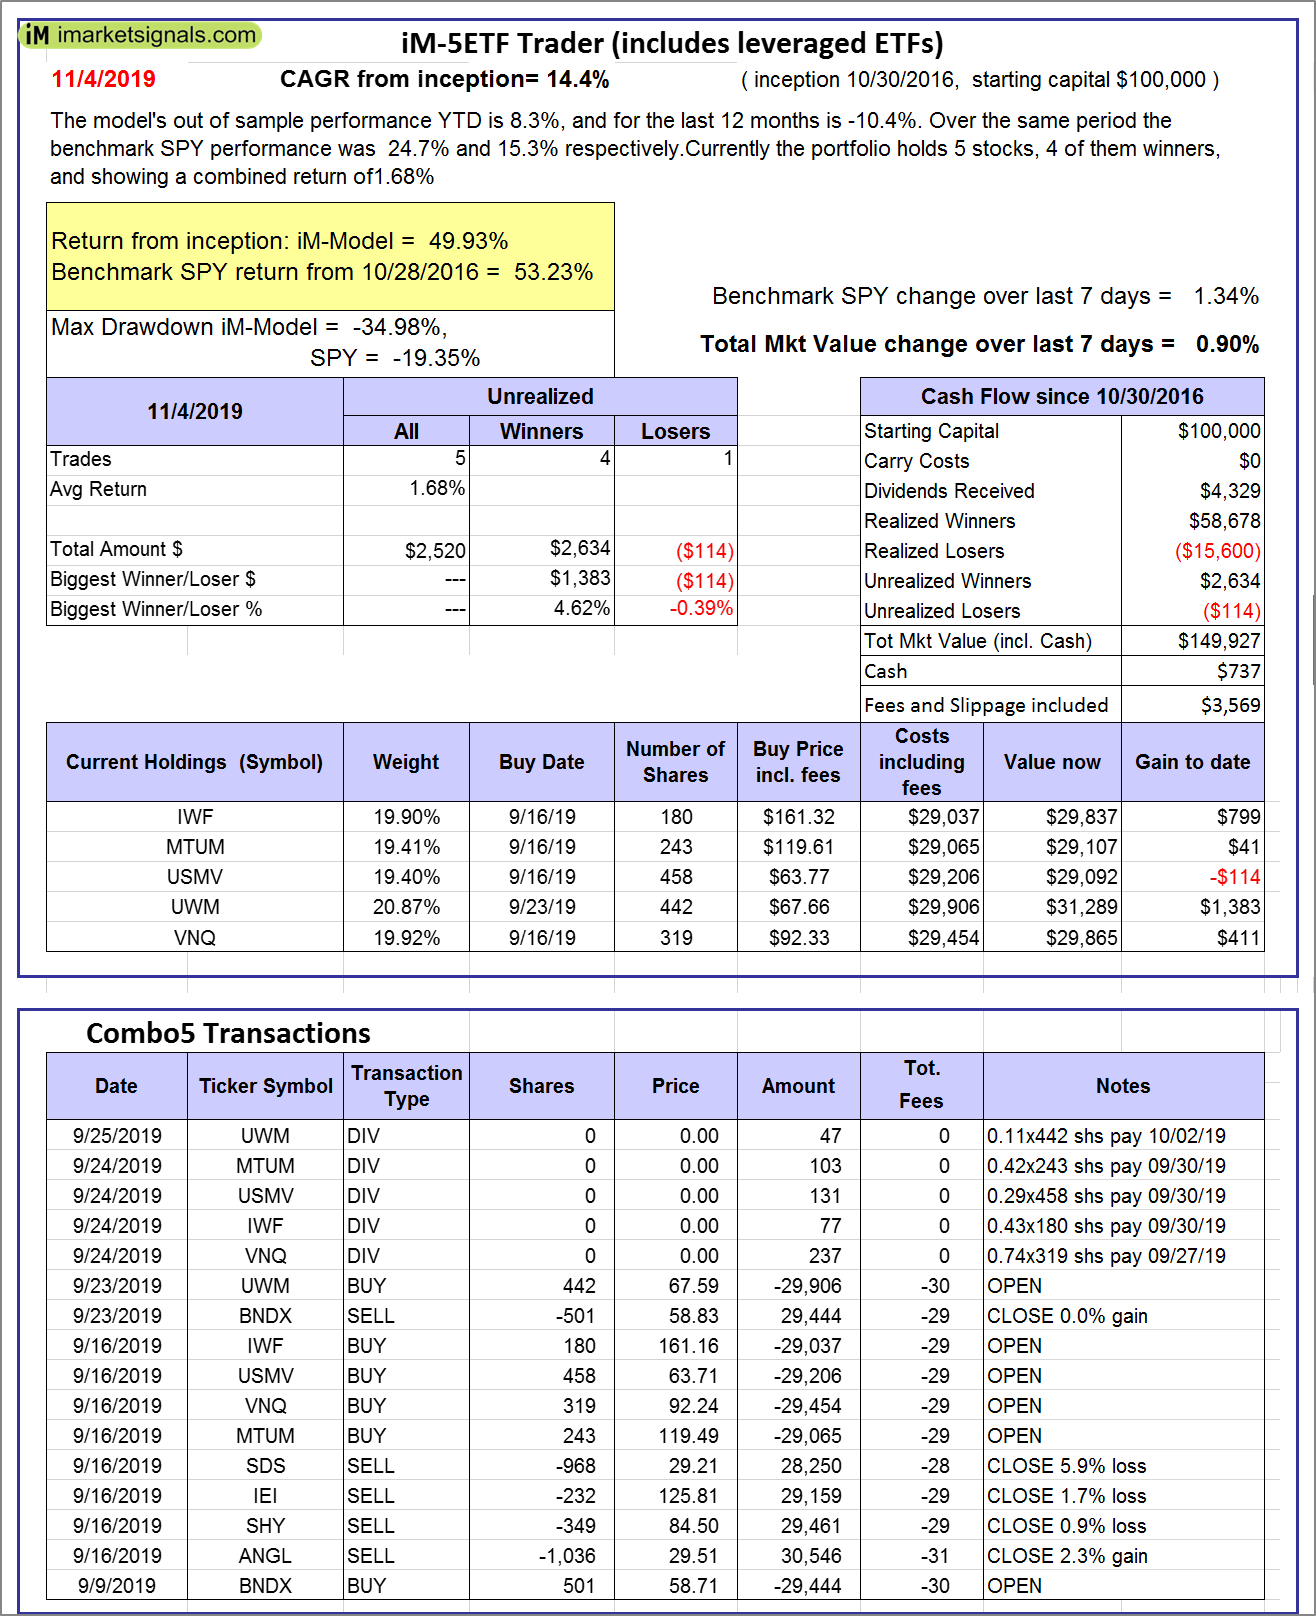 |
iM-5ETF Trader (includes leveraged ETFs): The model’s out of sample performance YTD is 8.3%, and for the last 12 months is -10.4%. Over the same period the benchmark SPY performance was 24.7% and 15.3% respectively. Over the previous week the market value of the iM-5ETF Trader (includes leveraged ETFs) gained 0.90% at a time when SPY gained 1.34%. A starting capital of $100,000 at inception on 10/30/2016 would have grown to $149,927 which includes $737 cash and excludes $3,569 spent on fees and slippage. |
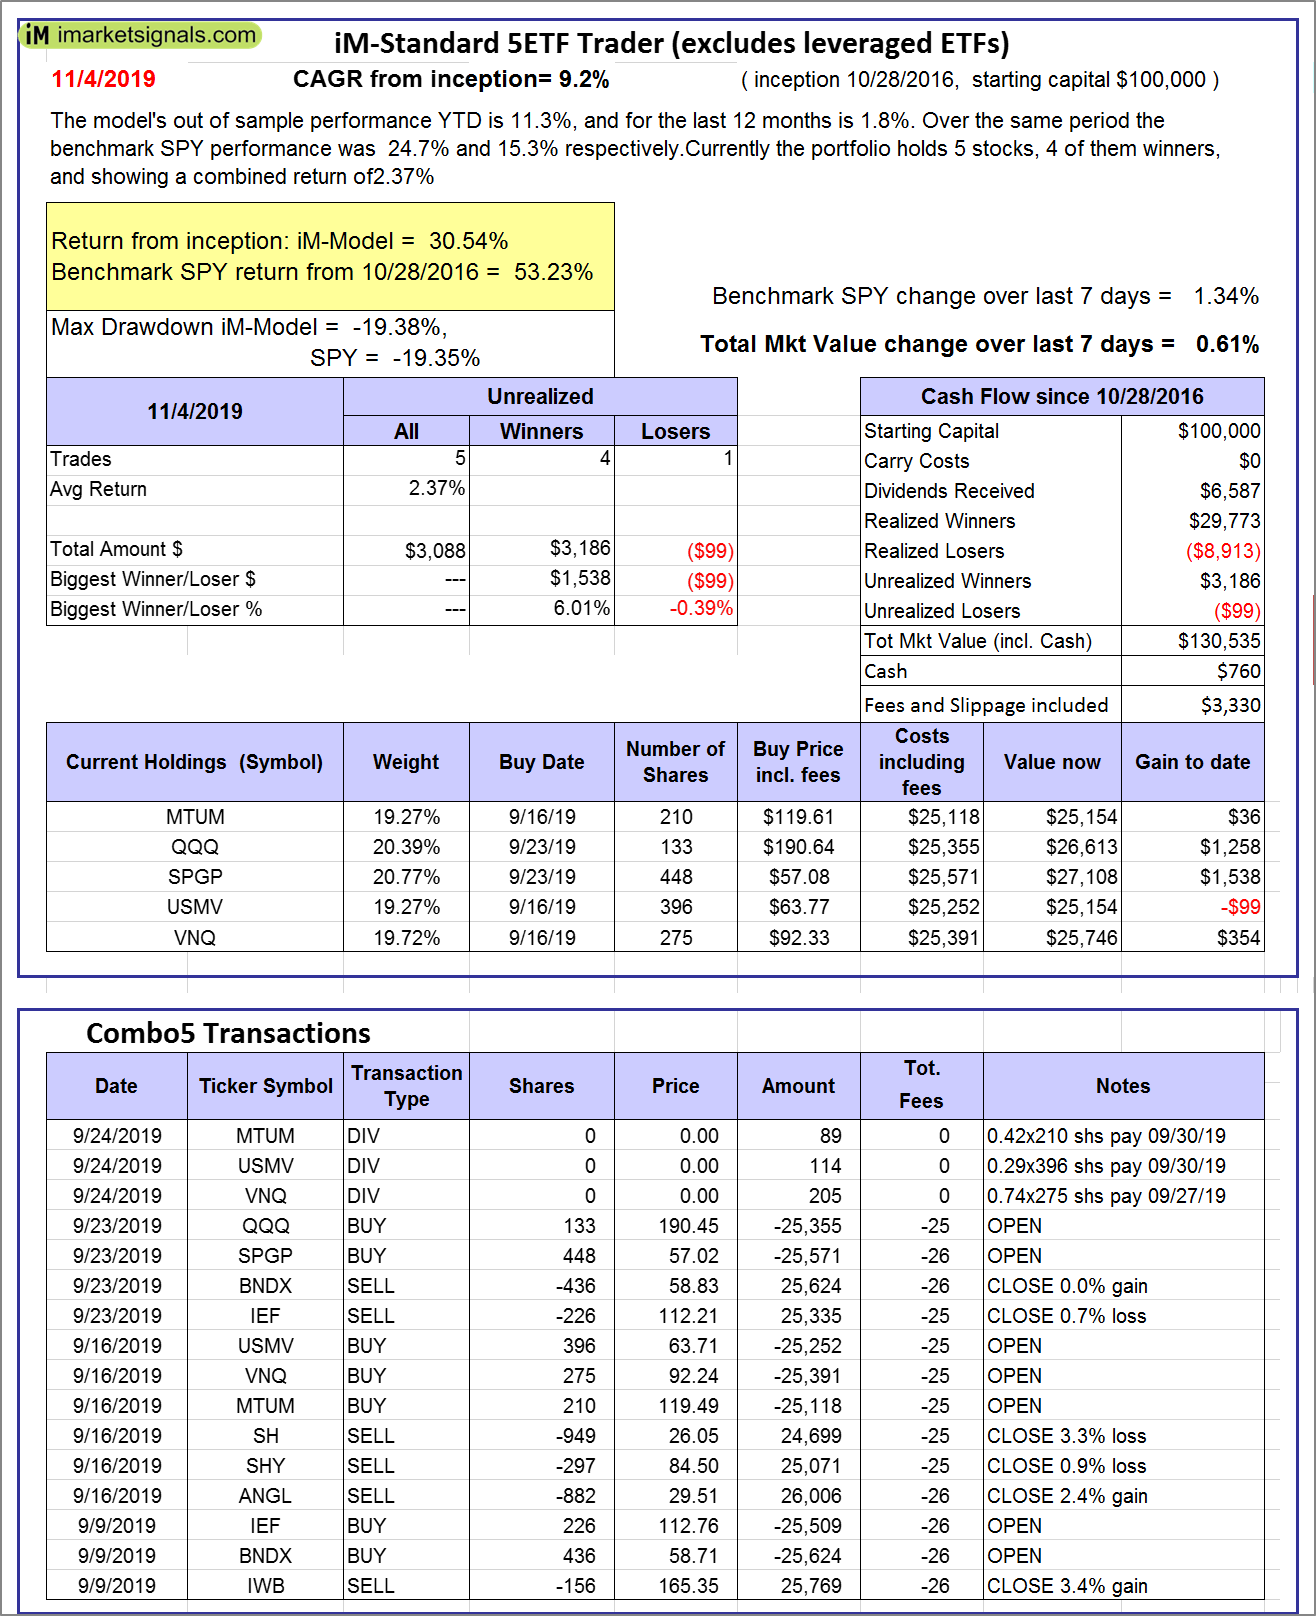 |
iM-Standard 5ETF Trader (excludes leveraged ETFs): The model’s out of sample performance YTD is 11.3%, and for the last 12 months is 1.8%. Over the same period the benchmark SPY performance was 24.7% and 15.3% respectively. Over the previous week the market value of the iM-Standard 5ETF Trader (excludes leveraged ETFs) gained 0.61% at a time when SPY gained 1.34%. A starting capital of $100,000 at inception on 10/30/2016 would have grown to $130,535 which includes $760 cash and excludes $3,330 spent on fees and slippage. |
iM-Best Reports – 11/4/2019
Posted in pmp SPY-SH
Leave a Reply
You must be logged in to post a comment.