
  |
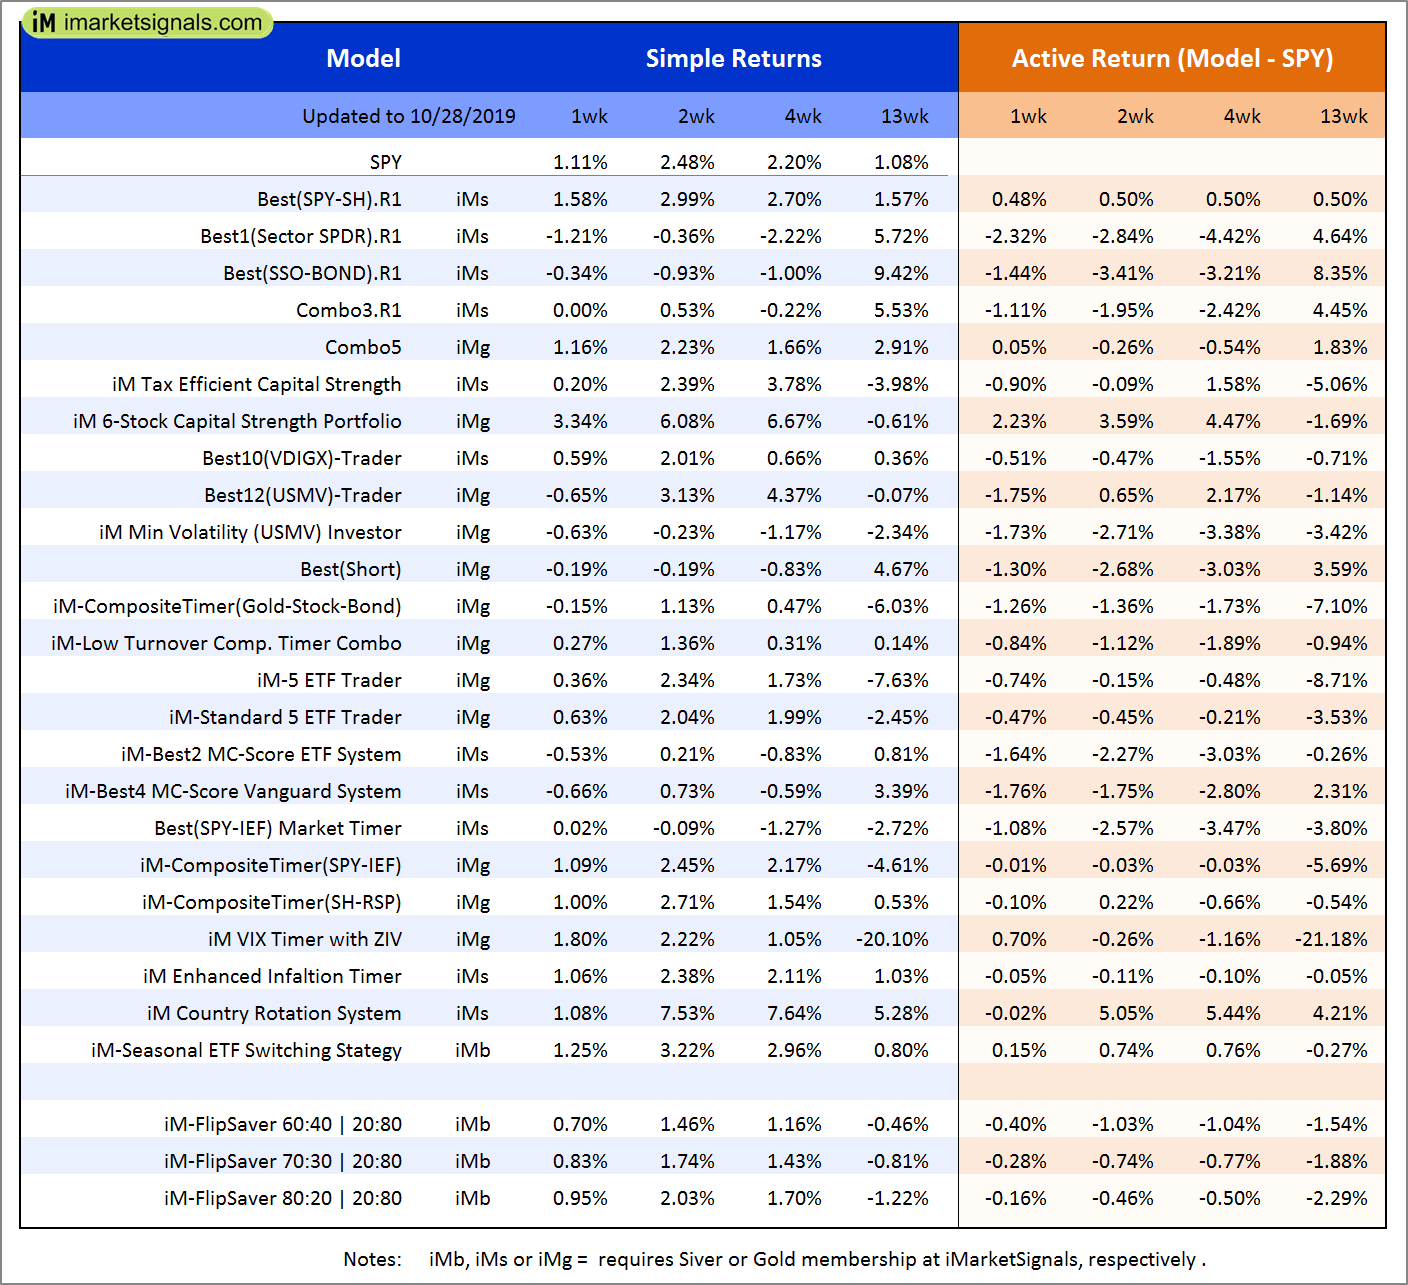
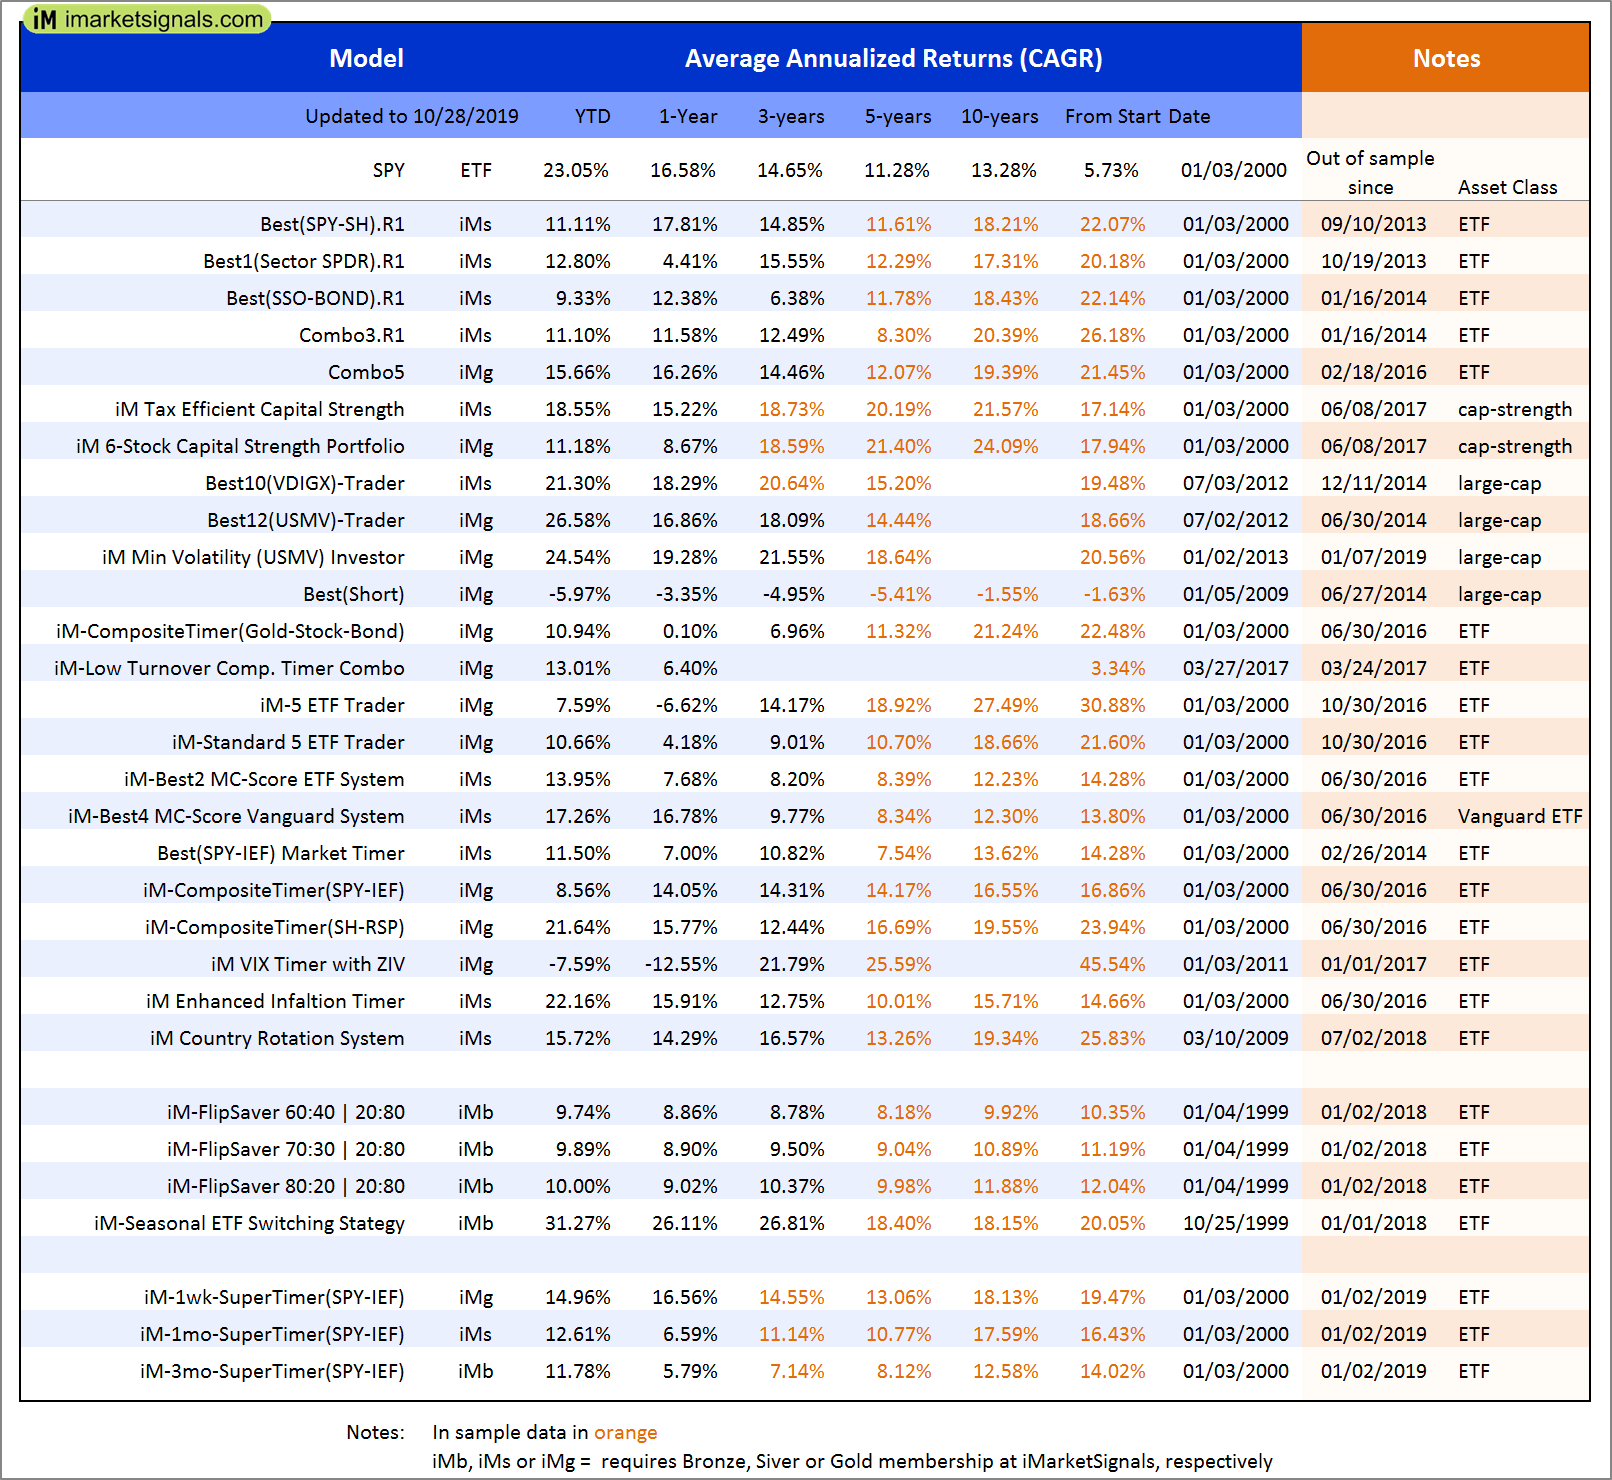
Out of sample performance summary of our models for the past 1, 2, 4 and 13 week periods. The active active return indicates how the models over- or underperformed the benchmark ETF SPY. Also the YTD, and the 1-, 3-, 5- and 10-year annualized returns are shown in the second table |
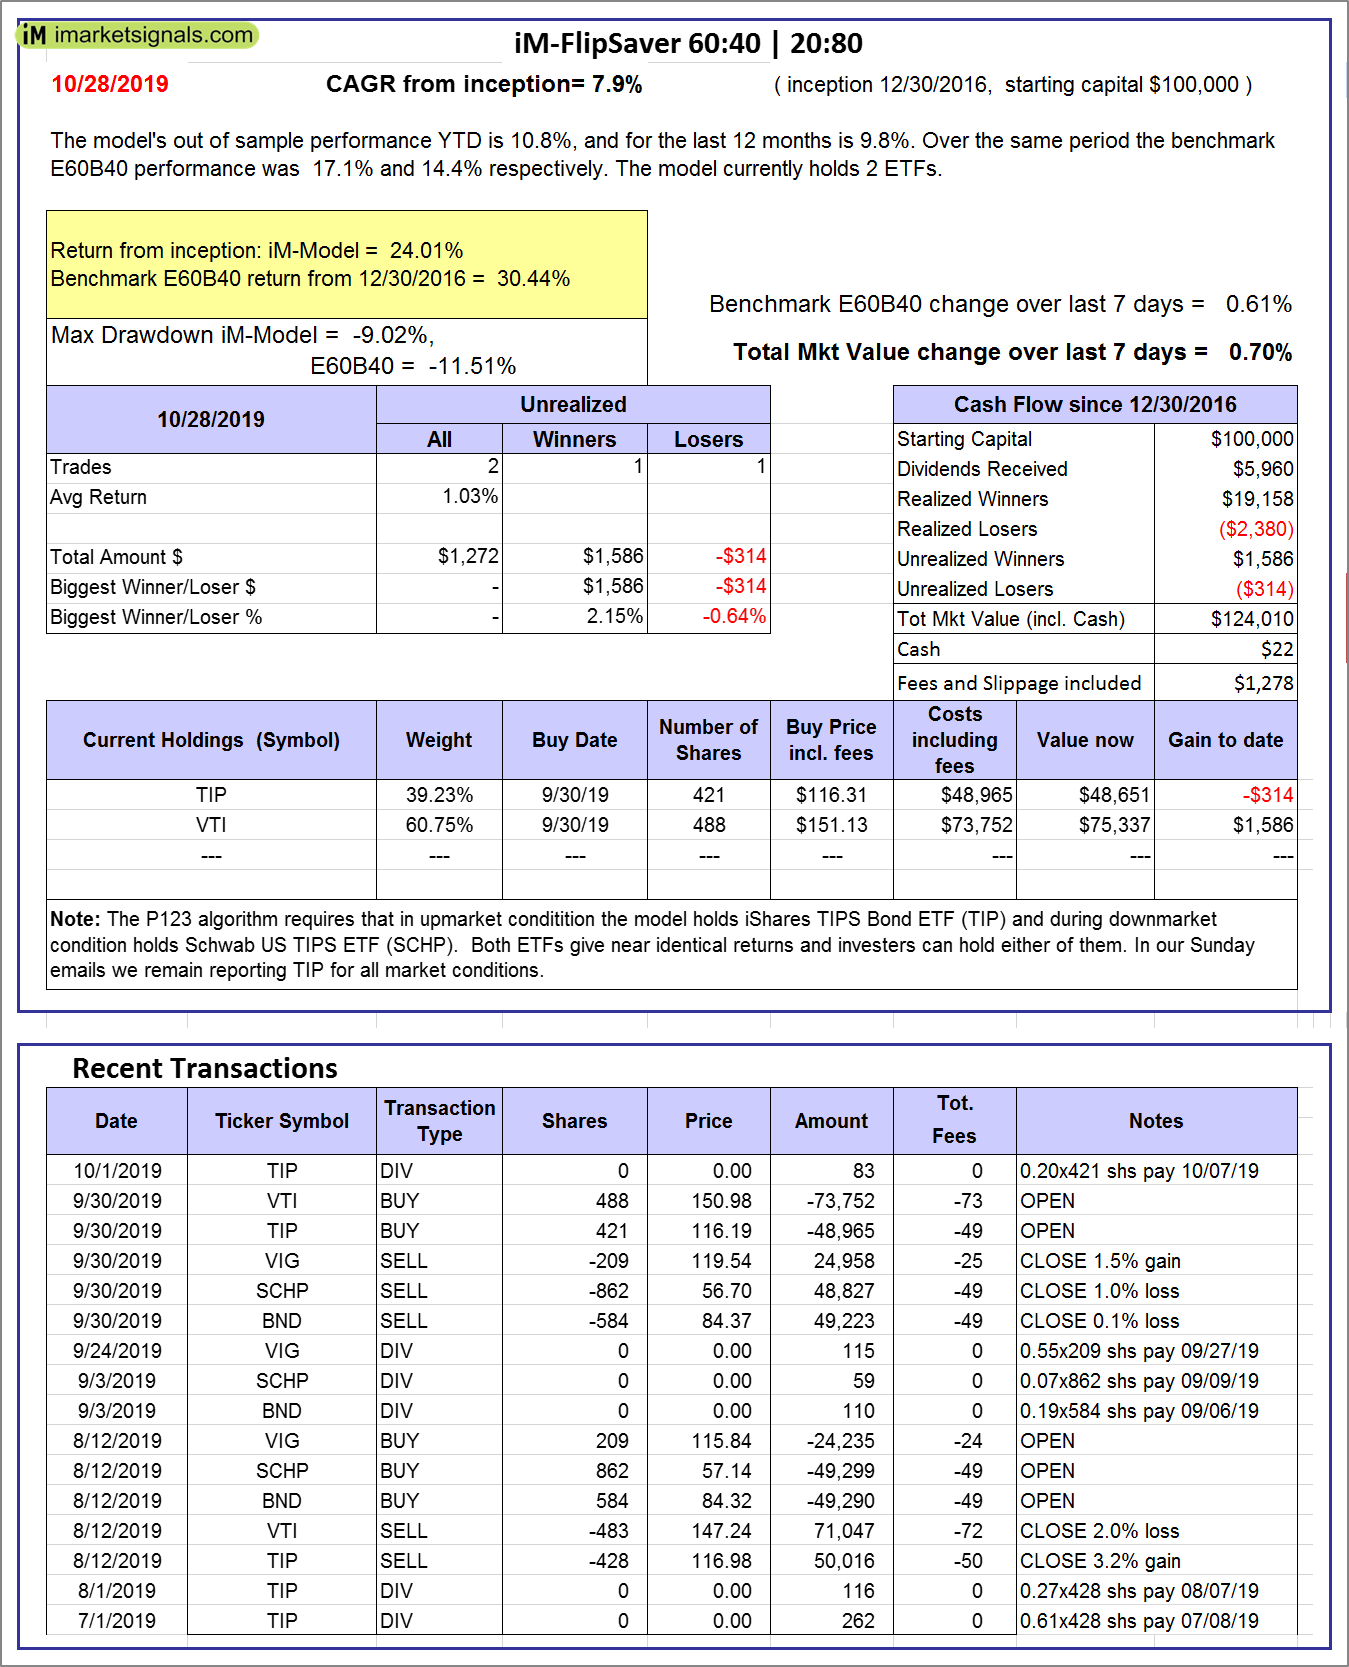 |
iM-FlipSaver 60:40 | 20:80 – 2017: The model’s out of sample performance YTD is 10.8%, and for the last 12 months is 9.8%. Over the same period the benchmark E60B40 performance was 17.1% and 14.4% respectively. Over the previous week the market value of iM-FlipSaver 80:20 | 20:80 gained 0.70% at a time when SPY gained 0.61%. A starting capital of $100,000 at inception on 7/16/2015 would have grown to $124,010 which includes $22 cash and excludes $1,278 spent on fees and slippage. |
 |
iM-FlipSaver 70:30 | 20:80 – 2017: The model’s out of sample performance YTD is 10.9%, and for the last 12 months is 9.9%. Over the same period the benchmark E60B40 performance was 17.1% and 14.4% respectively. Over the previous week the market value of iM-FlipSaver 70:30 | 20:80 gained 0.83% at a time when SPY gained 0.61%. A starting capital of $100,000 at inception on 7/15/2015 would have grown to $126,359 which includes -$122 cash and excludes $1,408 spent on fees and slippage. |
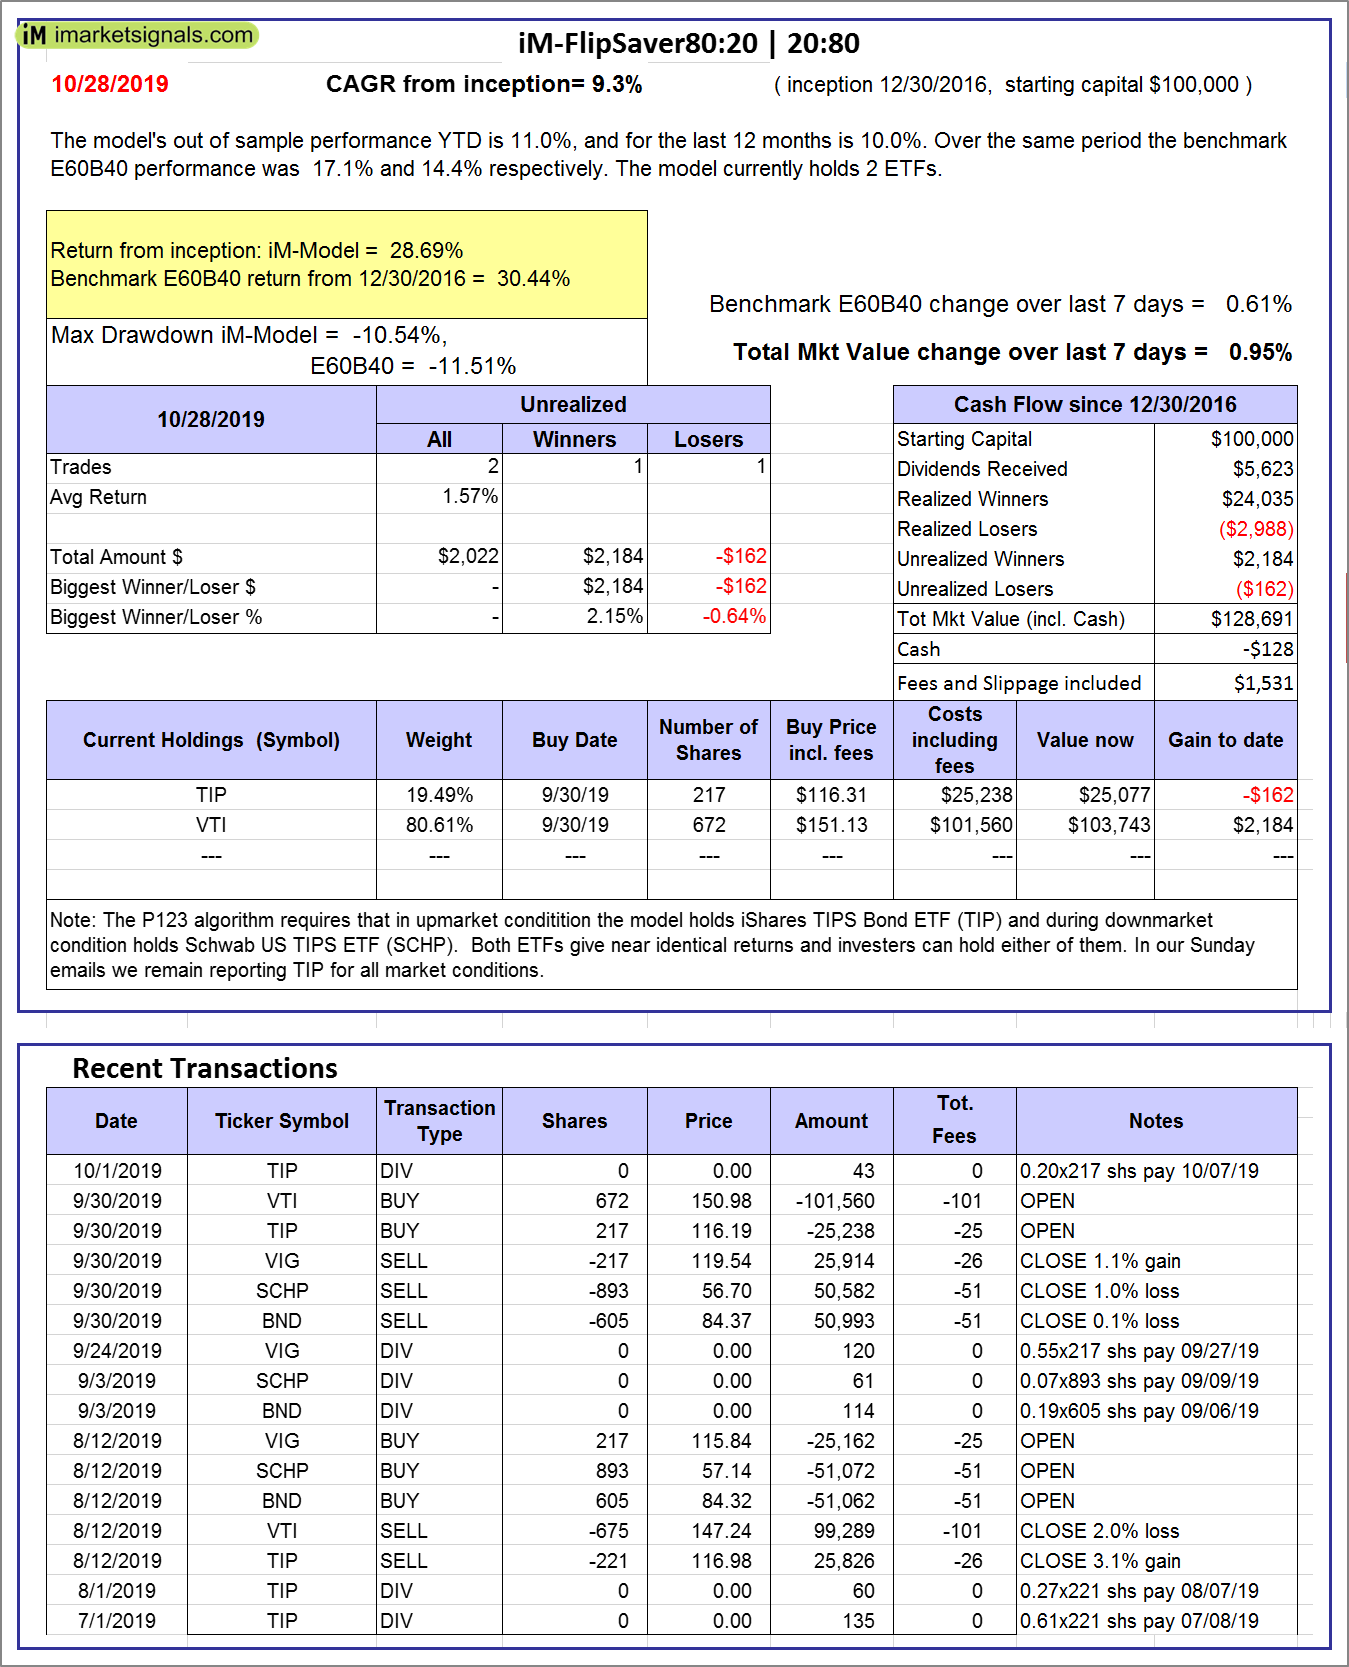 |
iM-FlipSaver 80:20 | 20:80 – 2017: The model’s out of sample performance YTD is 11.0%, and for the last 12 months is 10.0%. Over the same period the benchmark E60B40 performance was 17.1% and 14.4% respectively. Over the previous week the market value of iM-FlipSaver 80:20 | 20:80 gained 0.95% at a time when SPY gained 0.61%. A starting capital of $100,000 at inception on 1/2/2017 would have grown to $128,691 which includes -$128 cash and excludes $1,531 spent on fees and slippage. |
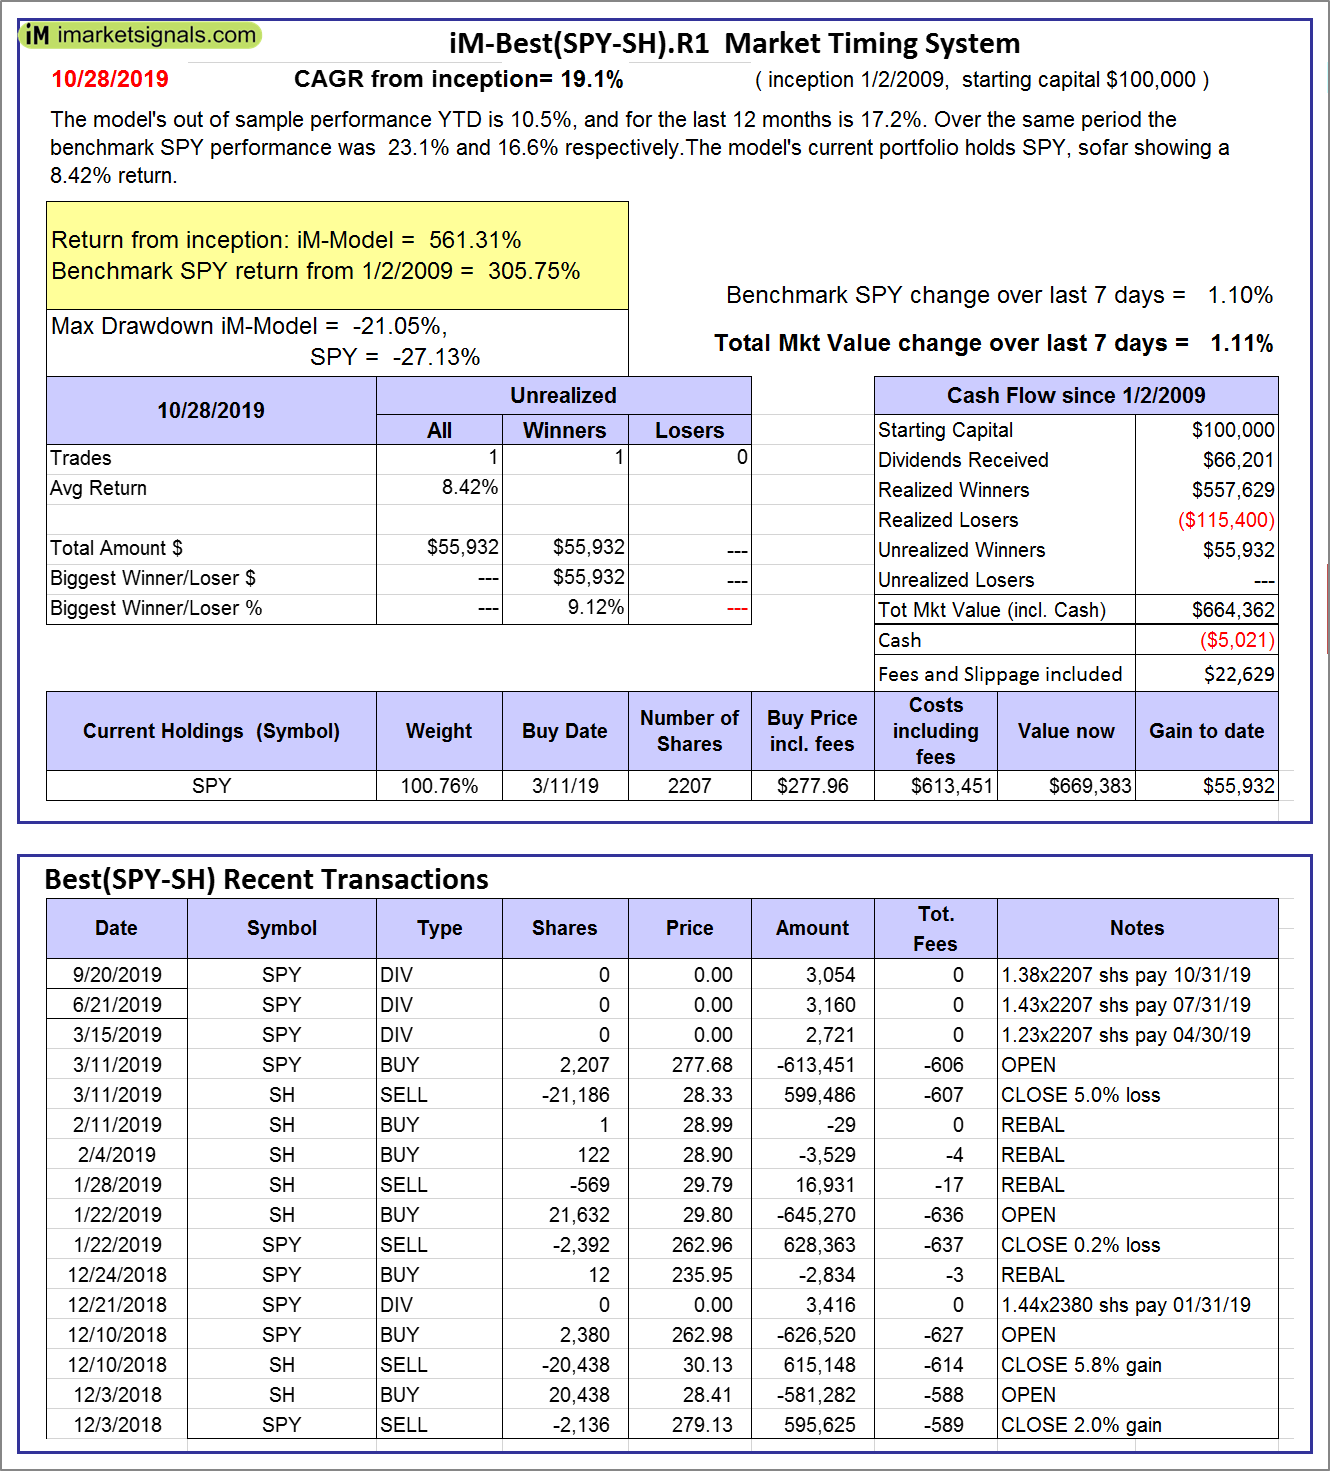 |
iM-Best(SPY-SH).R1: The model’s out of sample performance YTD is 10.5%, and for the last 12 months is 17.2%. Over the same period the benchmark SPY performance was 23.1% and 16.6% respectively. Over the previous week the market value of Best(SPY-SH) gained 1.11% at a time when SPY gained 1.10%. A starting capital of $100,000 at inception on 1/2/2009 would have grown to $664,362 which includes -$5,021 cash and excludes $22,629 spent on fees and slippage. |
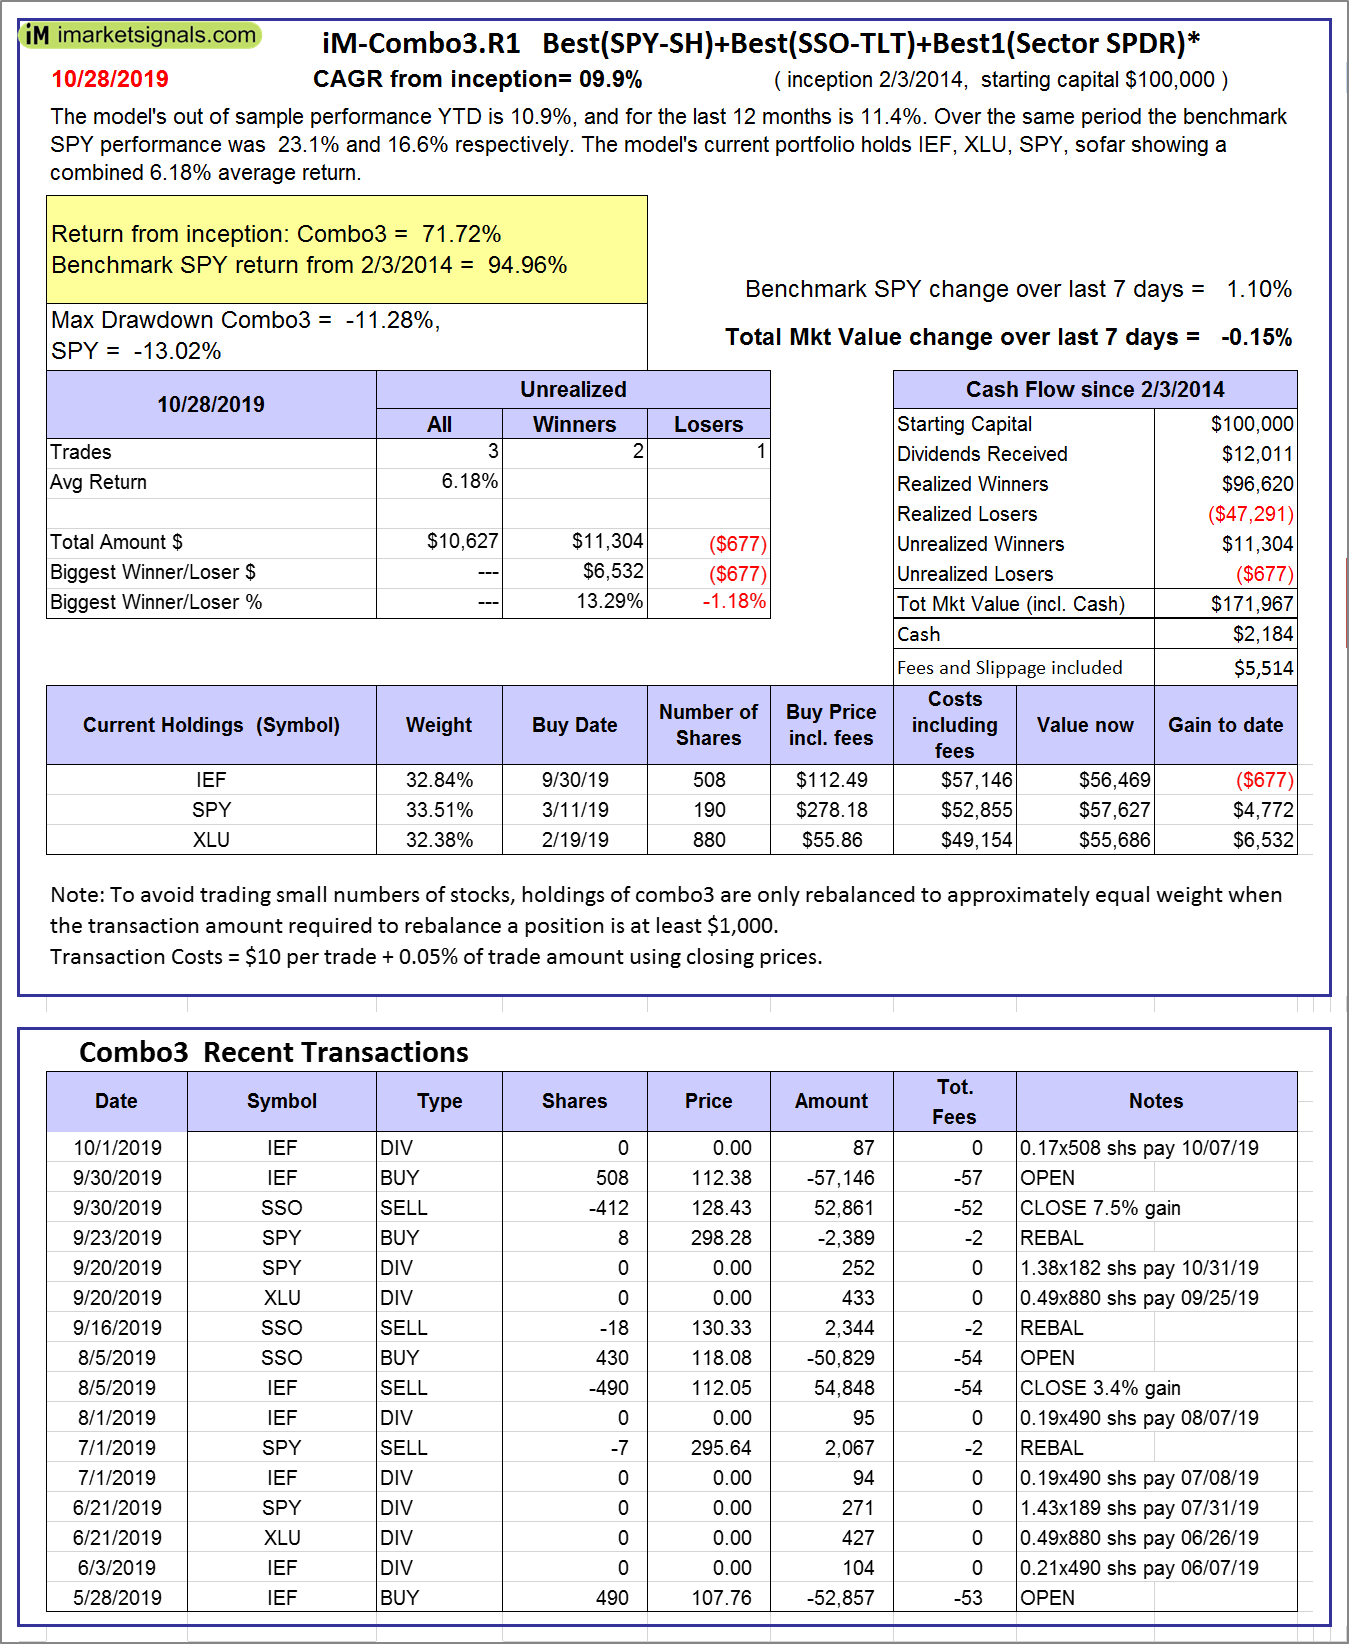 |
iM-Combo3.R1: The model’s out of sample performance YTD is 10.9%, and for the last 12 months is 11.4%. Over the same period the benchmark SPY performance was 23.1% and 16.6% respectively. Over the previous week the market value of iM-Combo3.R1 gained -0.15% at a time when SPY gained 1.10%. A starting capital of $100,000 at inception on 2/3/2014 would have grown to $171,967 which includes $2,184 cash and excludes $5,514 spent on fees and slippage. |
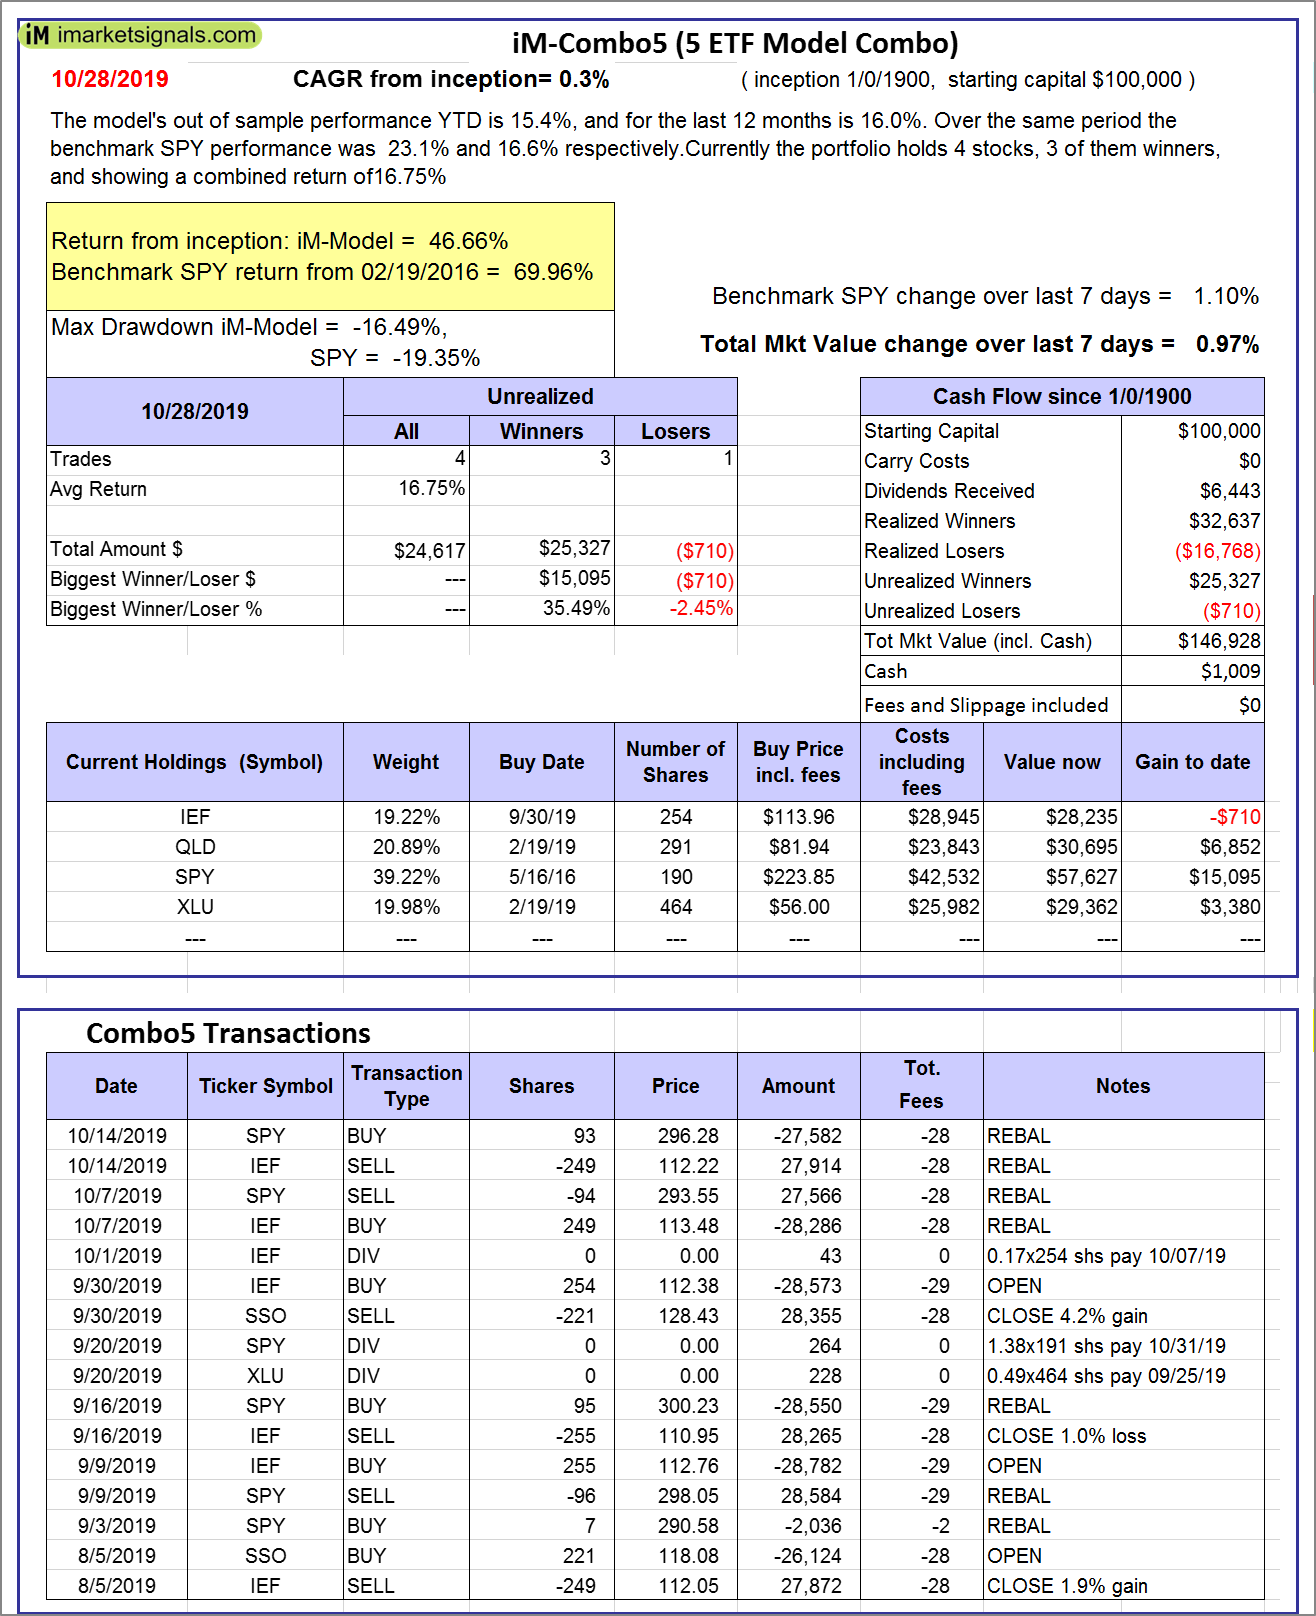 |
iM-Combo5: The model’s out of sample performance YTD is 15.4%, and for the last 12 months is 16.0%. Over the same period the benchmark SPY performance was 23.1% and 16.6% respectively. Over the previous week the market value of iM-Combo5 gained 0.97% at a time when SPY gained 1.10%. A starting capital of $100,000 at inception on 2/22/2016 would have grown to $146,928 which includes $1,009 cash and excludes $0 spent on fees and slippage. |
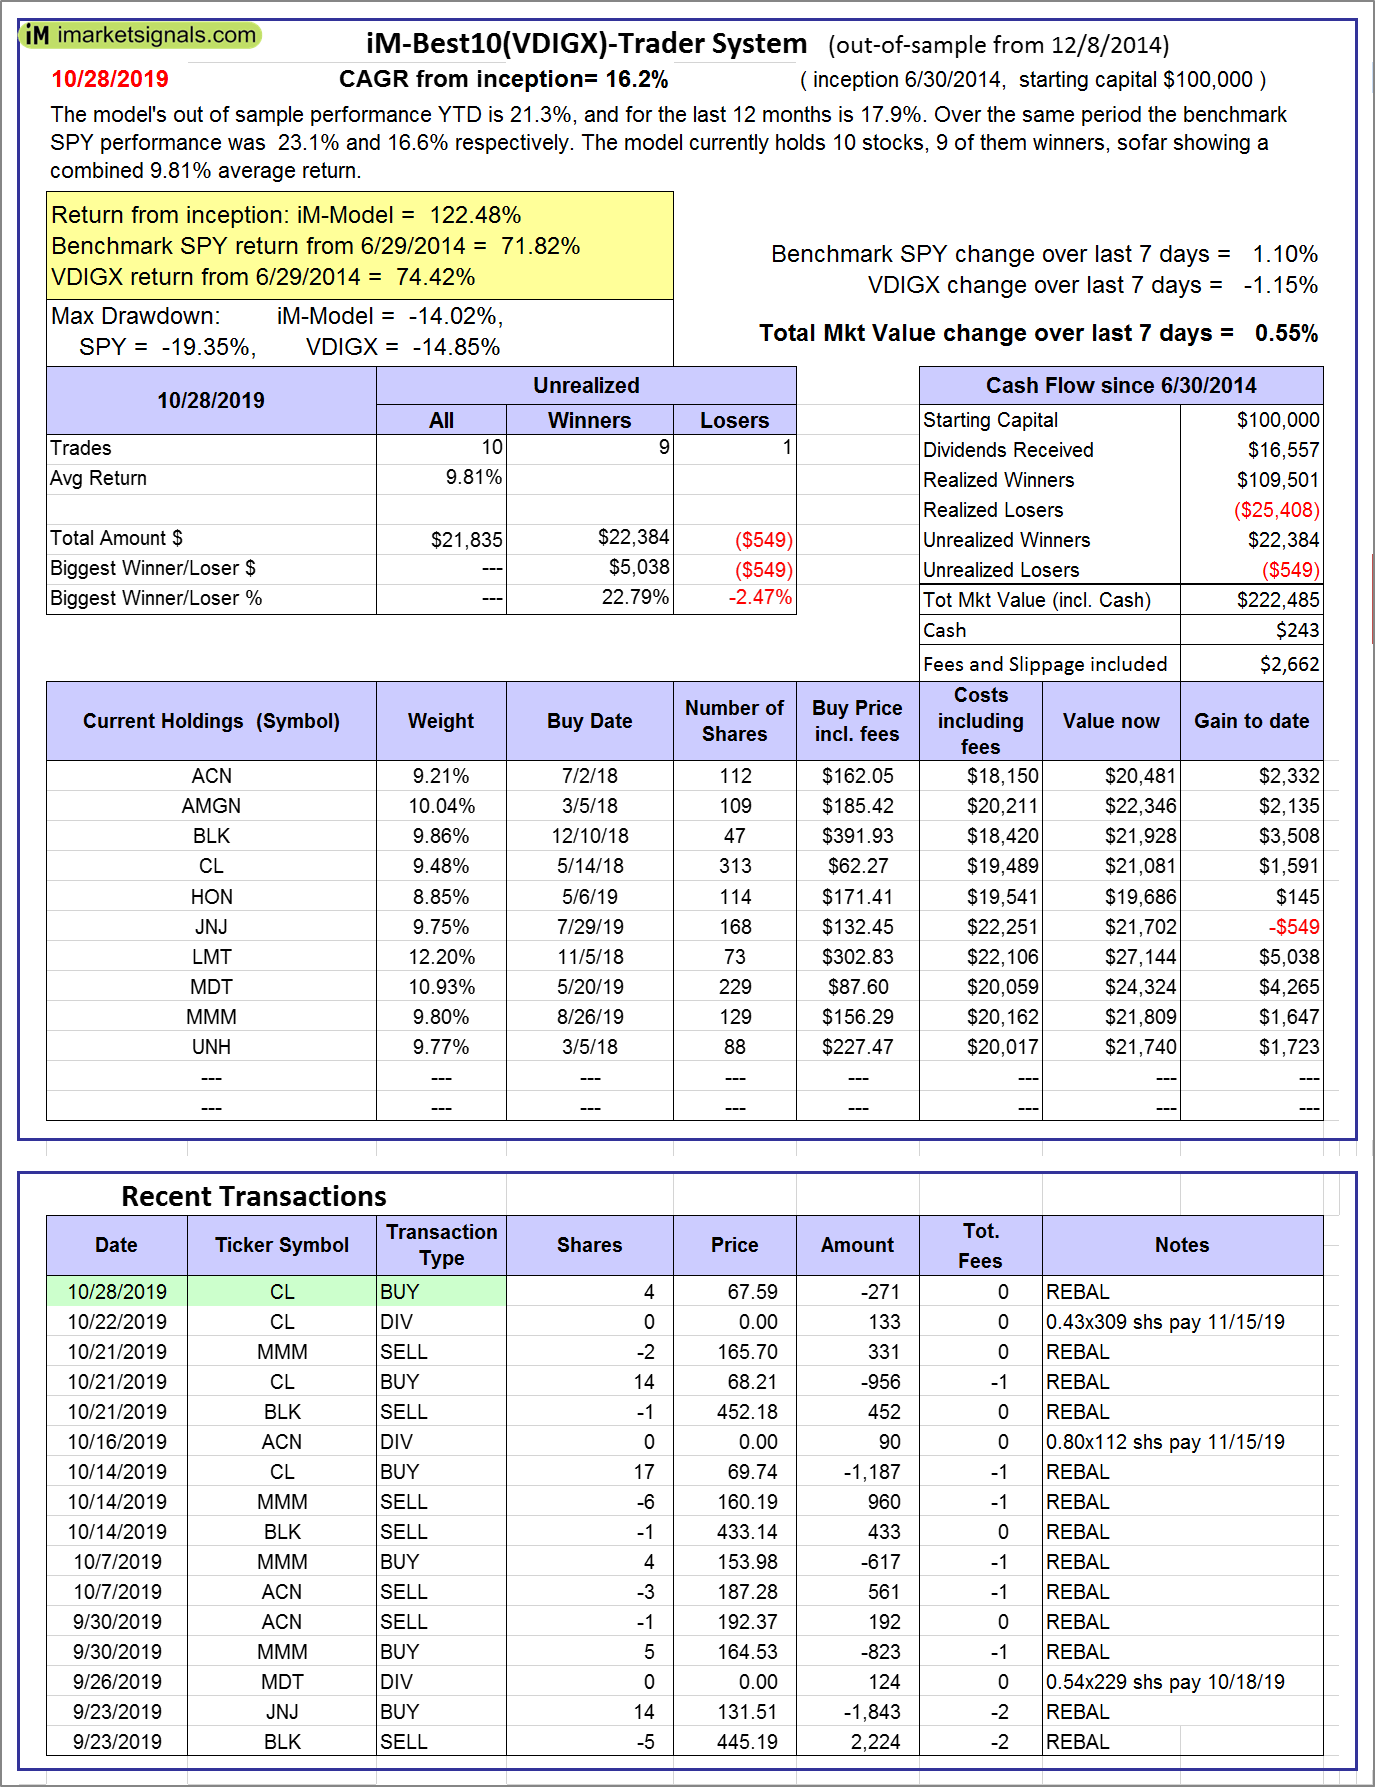 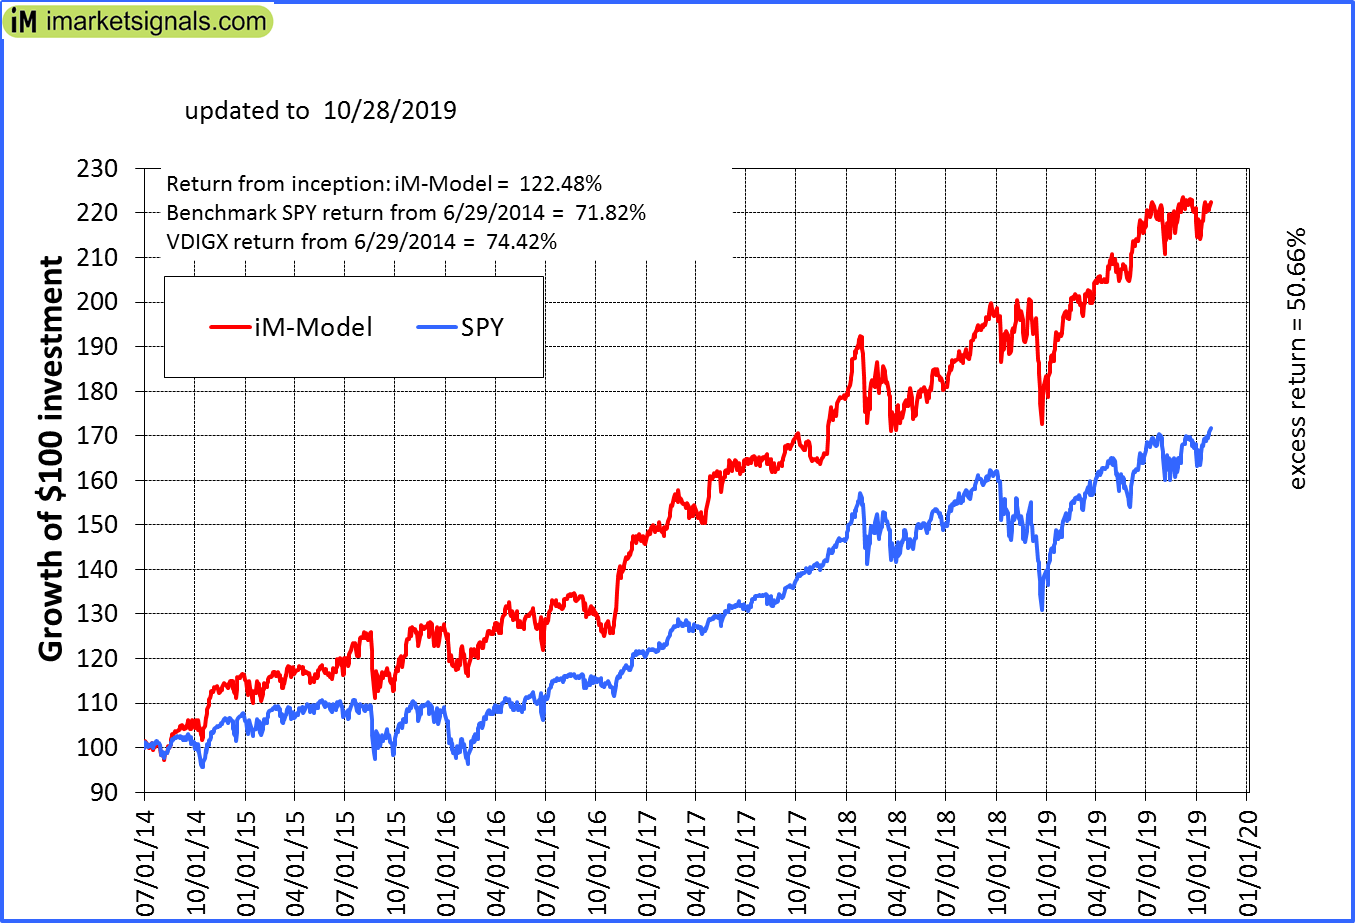 |
iM-Best10(VDIGX)-Trader: The model’s out of sample performance YTD is 21.3%, and for the last 12 months is 17.9%. Over the same period the benchmark SPY performance was 23.1% and 16.6% respectively. Since inception, on 7/1/2014, the model gained 122.48% while the benchmark SPY gained 71.82% and VDIGX gained 74.42% over the same period. Over the previous week the market value of iM-Best10(VDIGX) gained 0.55% at a time when SPY gained 1.10%. A starting capital of $100,000 at inception on 7/1/2014 would have grown to $222,485 which includes $243 cash and excludes $2,662 spent on fees and slippage. |
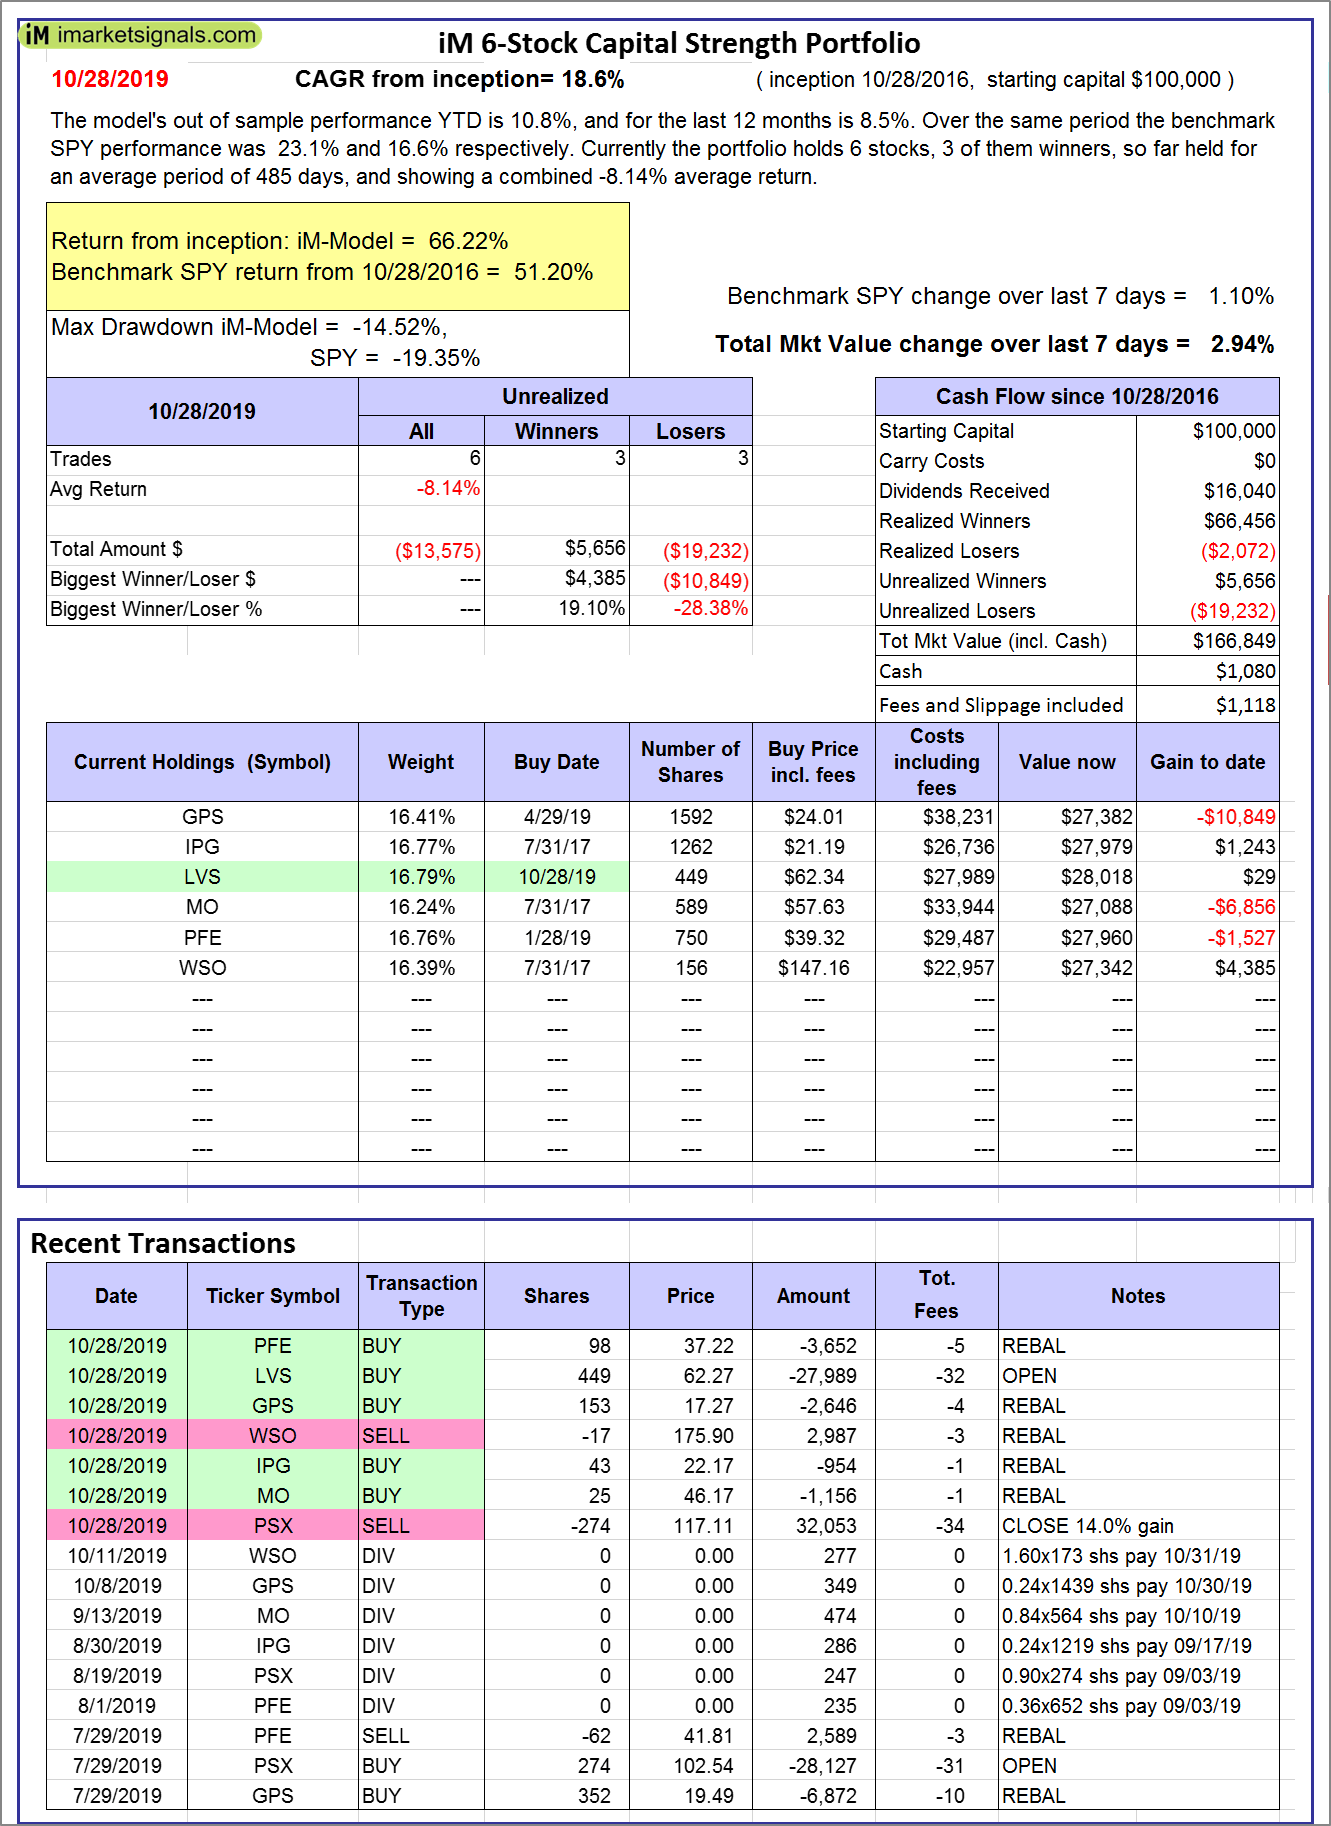 |
iM 6-Stock Capital Strength Portfolio: The model’s out of sample performance YTD is 10.8%, and for the last 12 months is 8.5%. Over the same period the benchmark SPY performance was 23.1% and 16.6% respectively. Over the previous week the market value of the iM 6-Stock Capital Strength Portfolio gained 2.94% at a time when SPY gained 1.10%. A starting capital of $100,000 at inception on 10/28/2016 would have grown to $166,849 which includes $1,080 cash and excludes $1,118 spent on fees and slippage. |
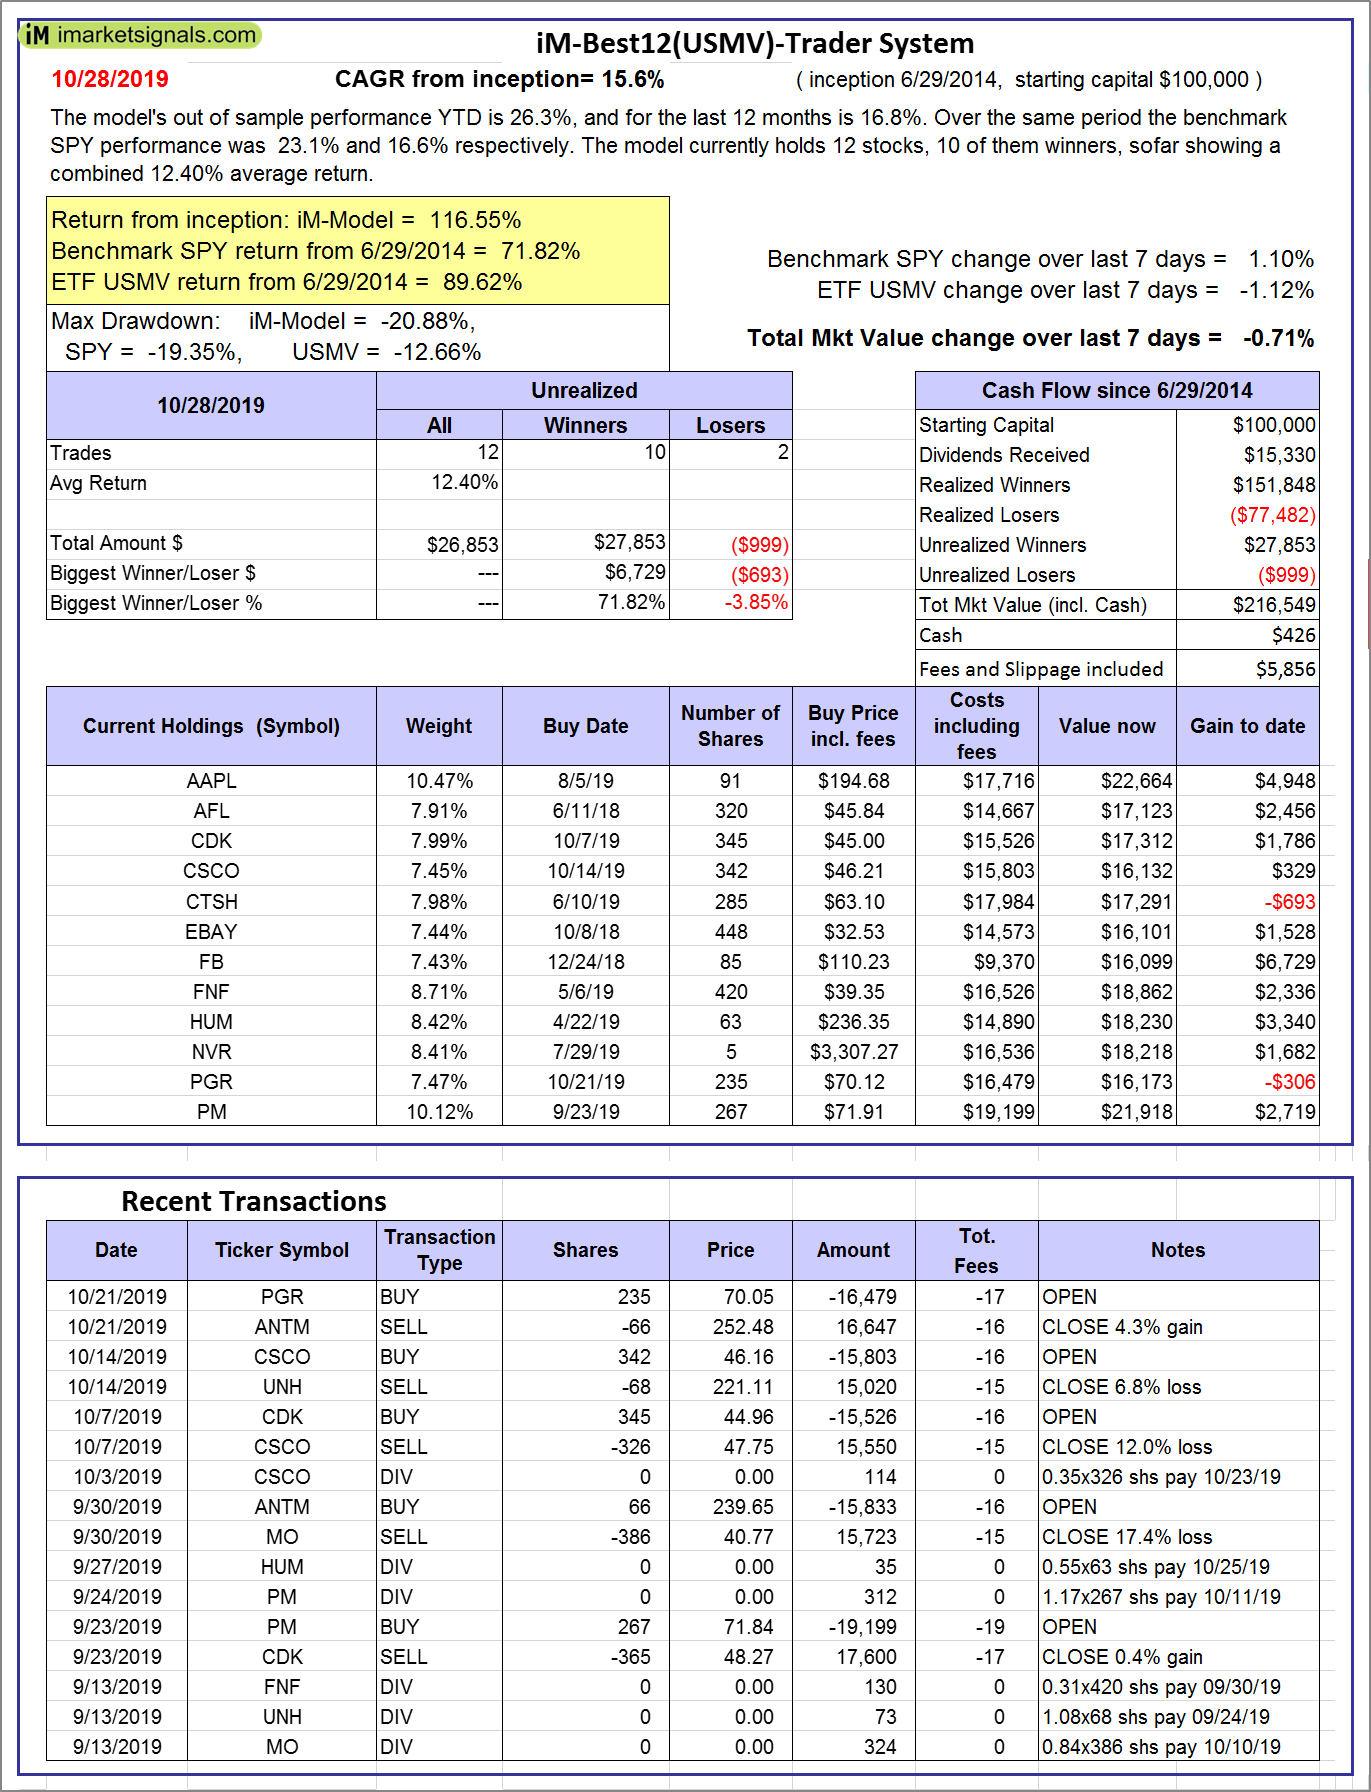 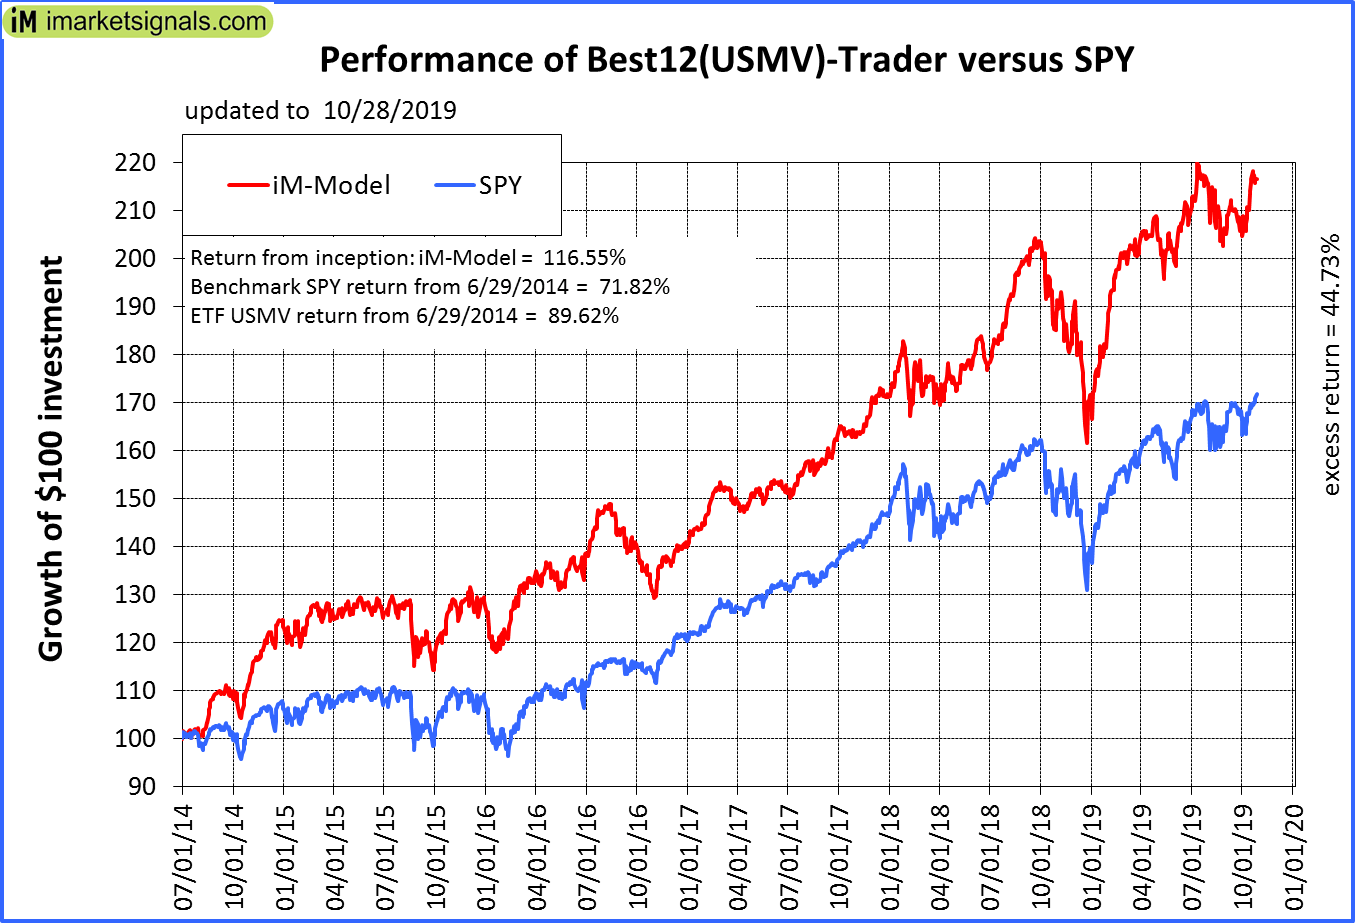 |
iM-Best12(USMV)-Trader: The model’s out of sample performance YTD is 26.3%, and for the last 12 months is 16.8%. Over the same period the benchmark SPY performance was 23.1% and 16.6% respectively. Since inception, on 6/30/2014, the model gained 116.55% while the benchmark SPY gained 71.82% and the ETF USMV gained 89.62% over the same period. Over the previous week the market value of iM-Best12(USMV)-Trader gained -0.71% at a time when SPY gained 1.10%. A starting capital of $100,000 at inception on 6/30/2014 would have grown to $216,549 which includes $426 cash and excludes $5,856 spent on fees and slippage. |
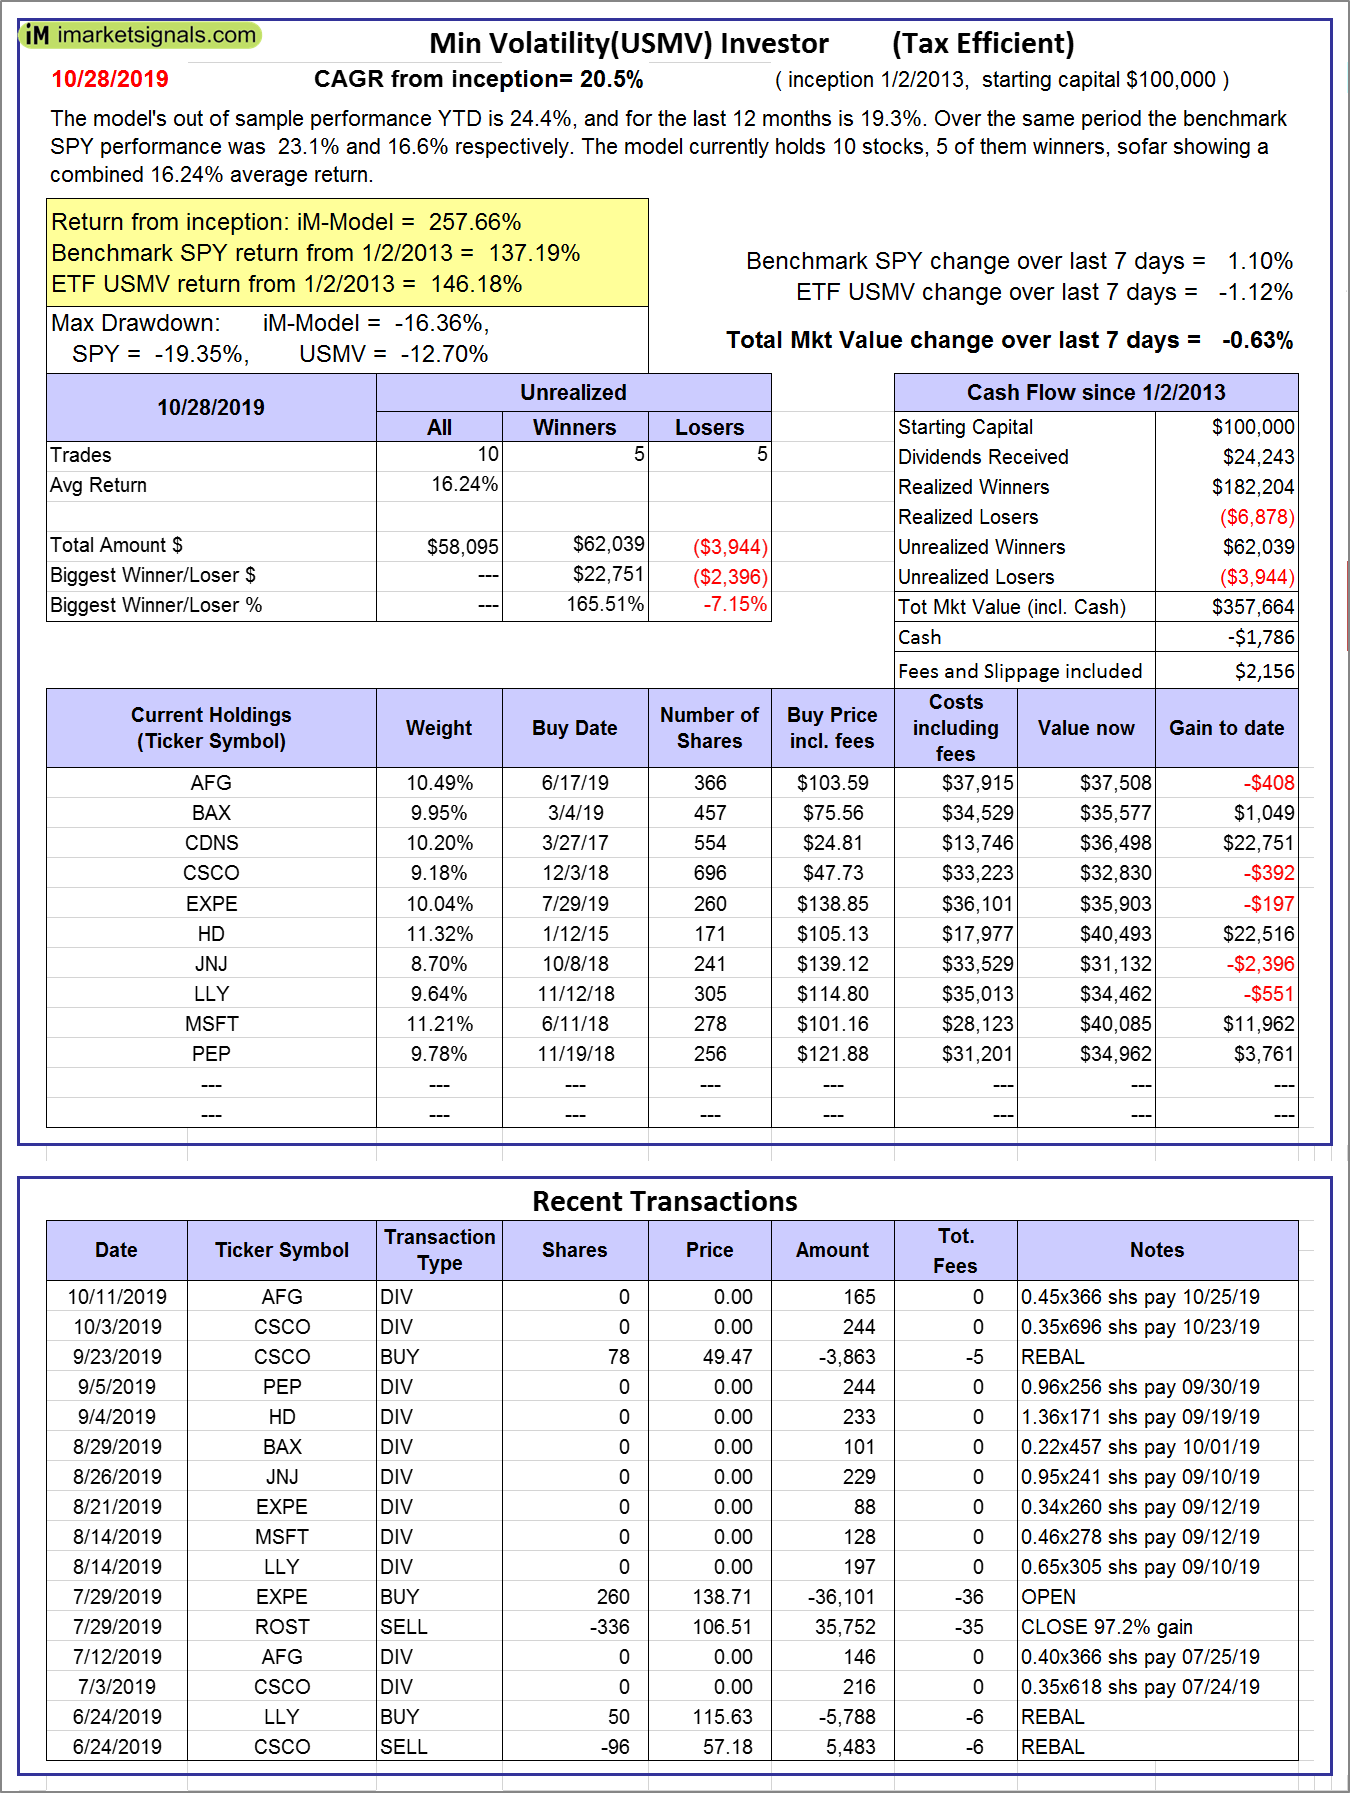 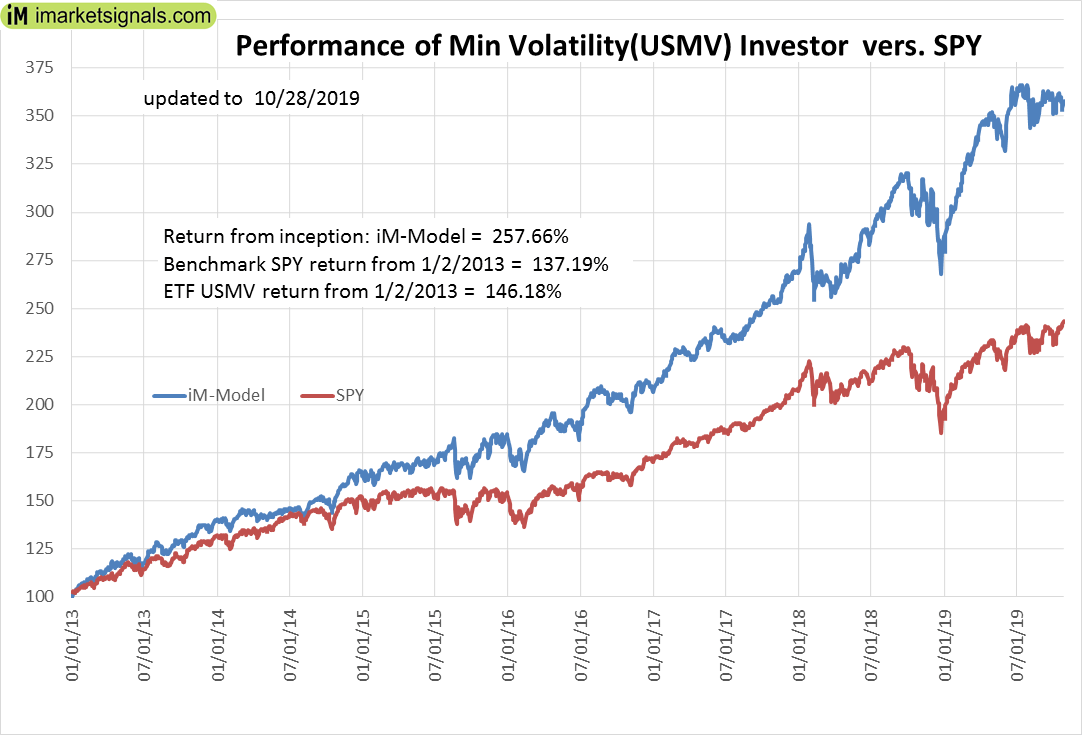 |
iM-Min Volatility(USMV) Investor (Tax Efficient): The model’s out of sample performance YTD is 24.4%, and for the last 12 months is 19.3%. Over the same period the benchmark SPY performance was 23.1% and 16.6% respectively. Since inception, on 1/3/2013, the model gained 257.66% while the benchmark SPY gained 137.19% and the ETF USMV gained 146.18% over the same period. Over the previous week the market value of iM-Best12(USMV)Q1 gained -0.63% at a time when SPY gained 1.10%. A starting capital of $100,000 at inception on 1/3/2013 would have grown to $357,664 which includes -$1,786 cash and excludes $2,156 spent on fees and slippage. |
|
|
iM Min Volatility (USMV) Investor: The model’s out of sample performance YTD is 24.4%, and for the last 12 months is 19.3%. Over the same period the benchmark SPY performance was 23.1% and 16.6% respectively. Since inception, on 1/3/2013, the model gained 257.66% while the benchmark SPY gained 137.19% and the ETF USMV gained 146.18% over the same period. Over the previous week the market value of iM Min Volatility (USMV) Investor gained -0.63% at a time when SPY gained 1.10%. A starting capital of $100,000 at inception on 1/3/2013 would have grown to $357,664 which includes -$1,786 cash and excludes $2,156 spent on fees and slippage. |
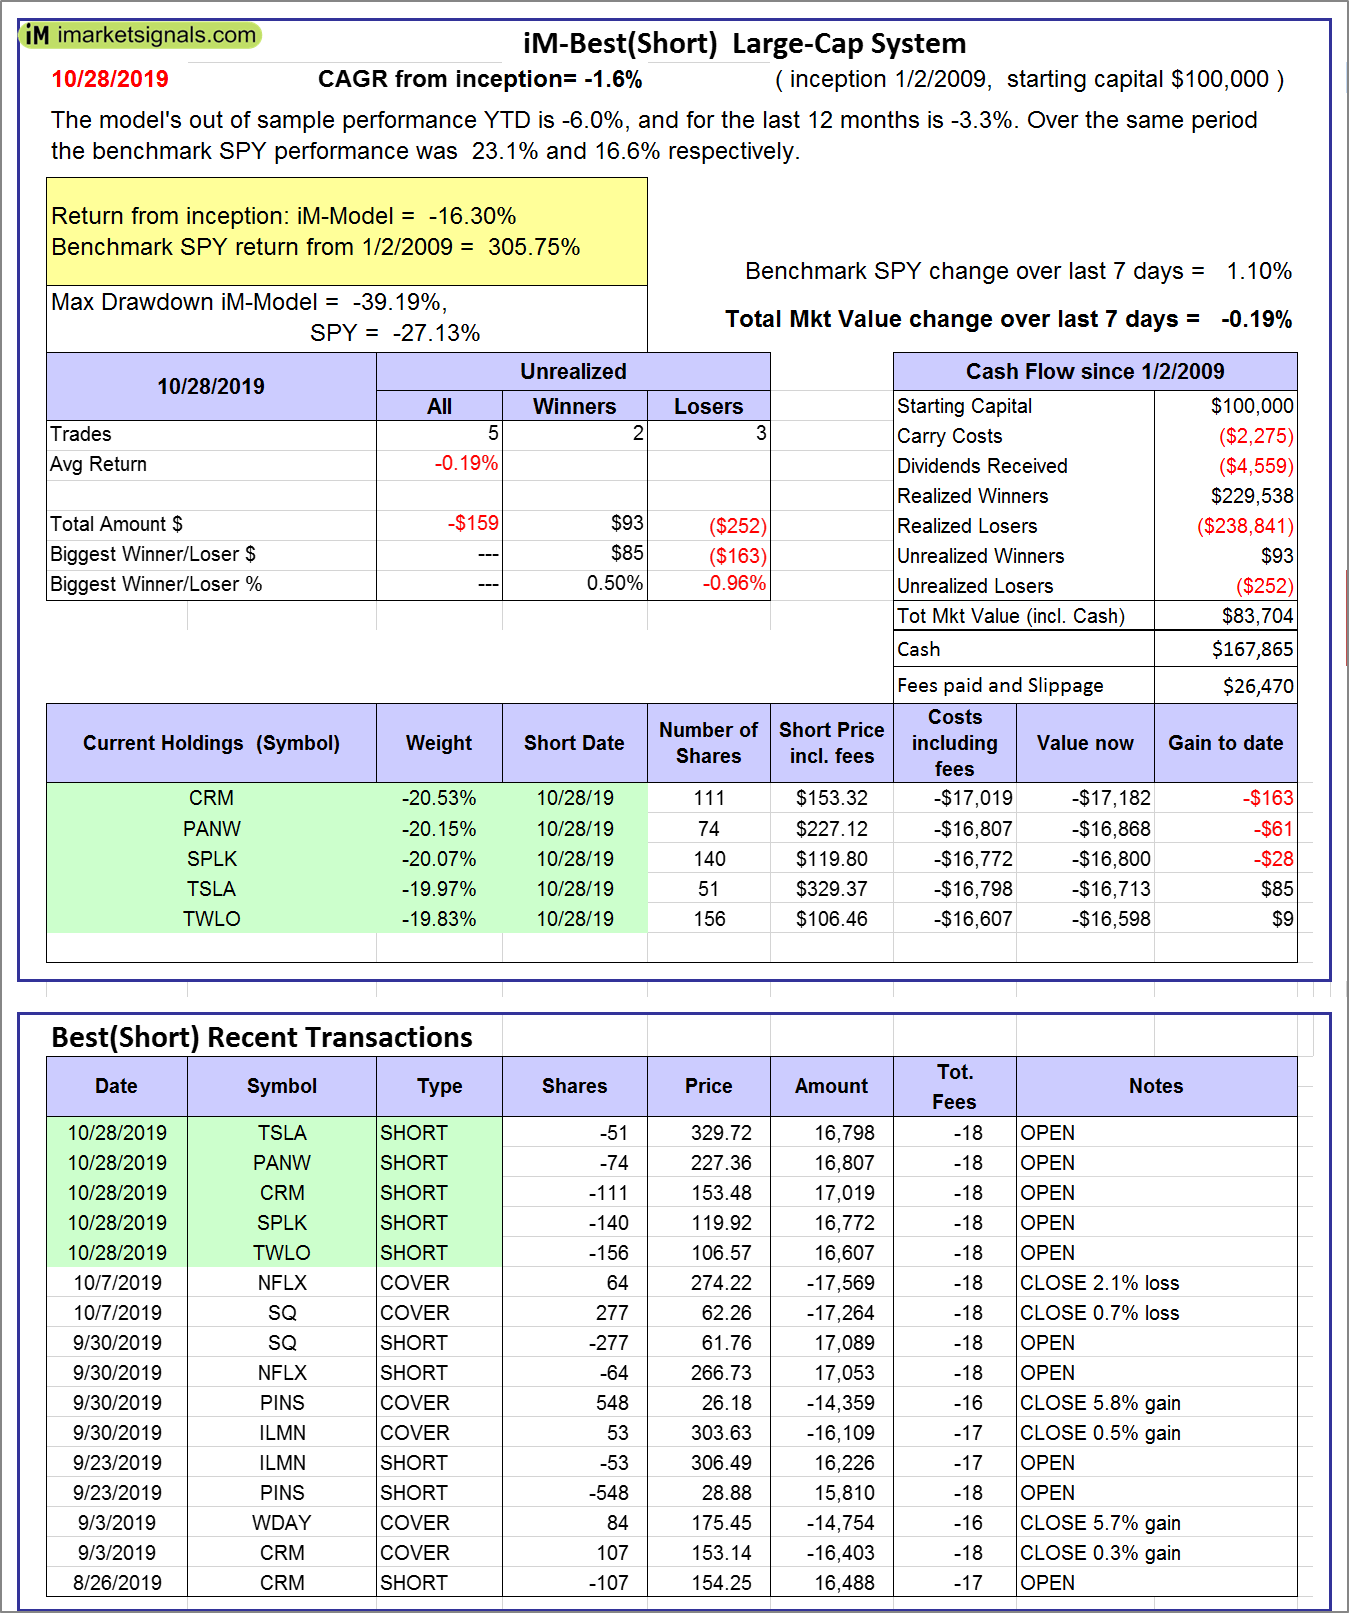 |
iM-Best(Short): The model’s out of sample performance YTD is -6.0%, and for the last 12 months is -3.3%. Over the same period the benchmark SPY performance was 23.1% and 16.6% respectively. Over the previous week the market value of iM-Best(Short) gained -0.19% at a time when SPY gained 1.10%. Over the period 1/2/2009 to 10/28/2019 the starting capital of $100,000 would have grown to $83,704 which includes $167,865 cash and excludes $26,470 spent on fees and slippage. |
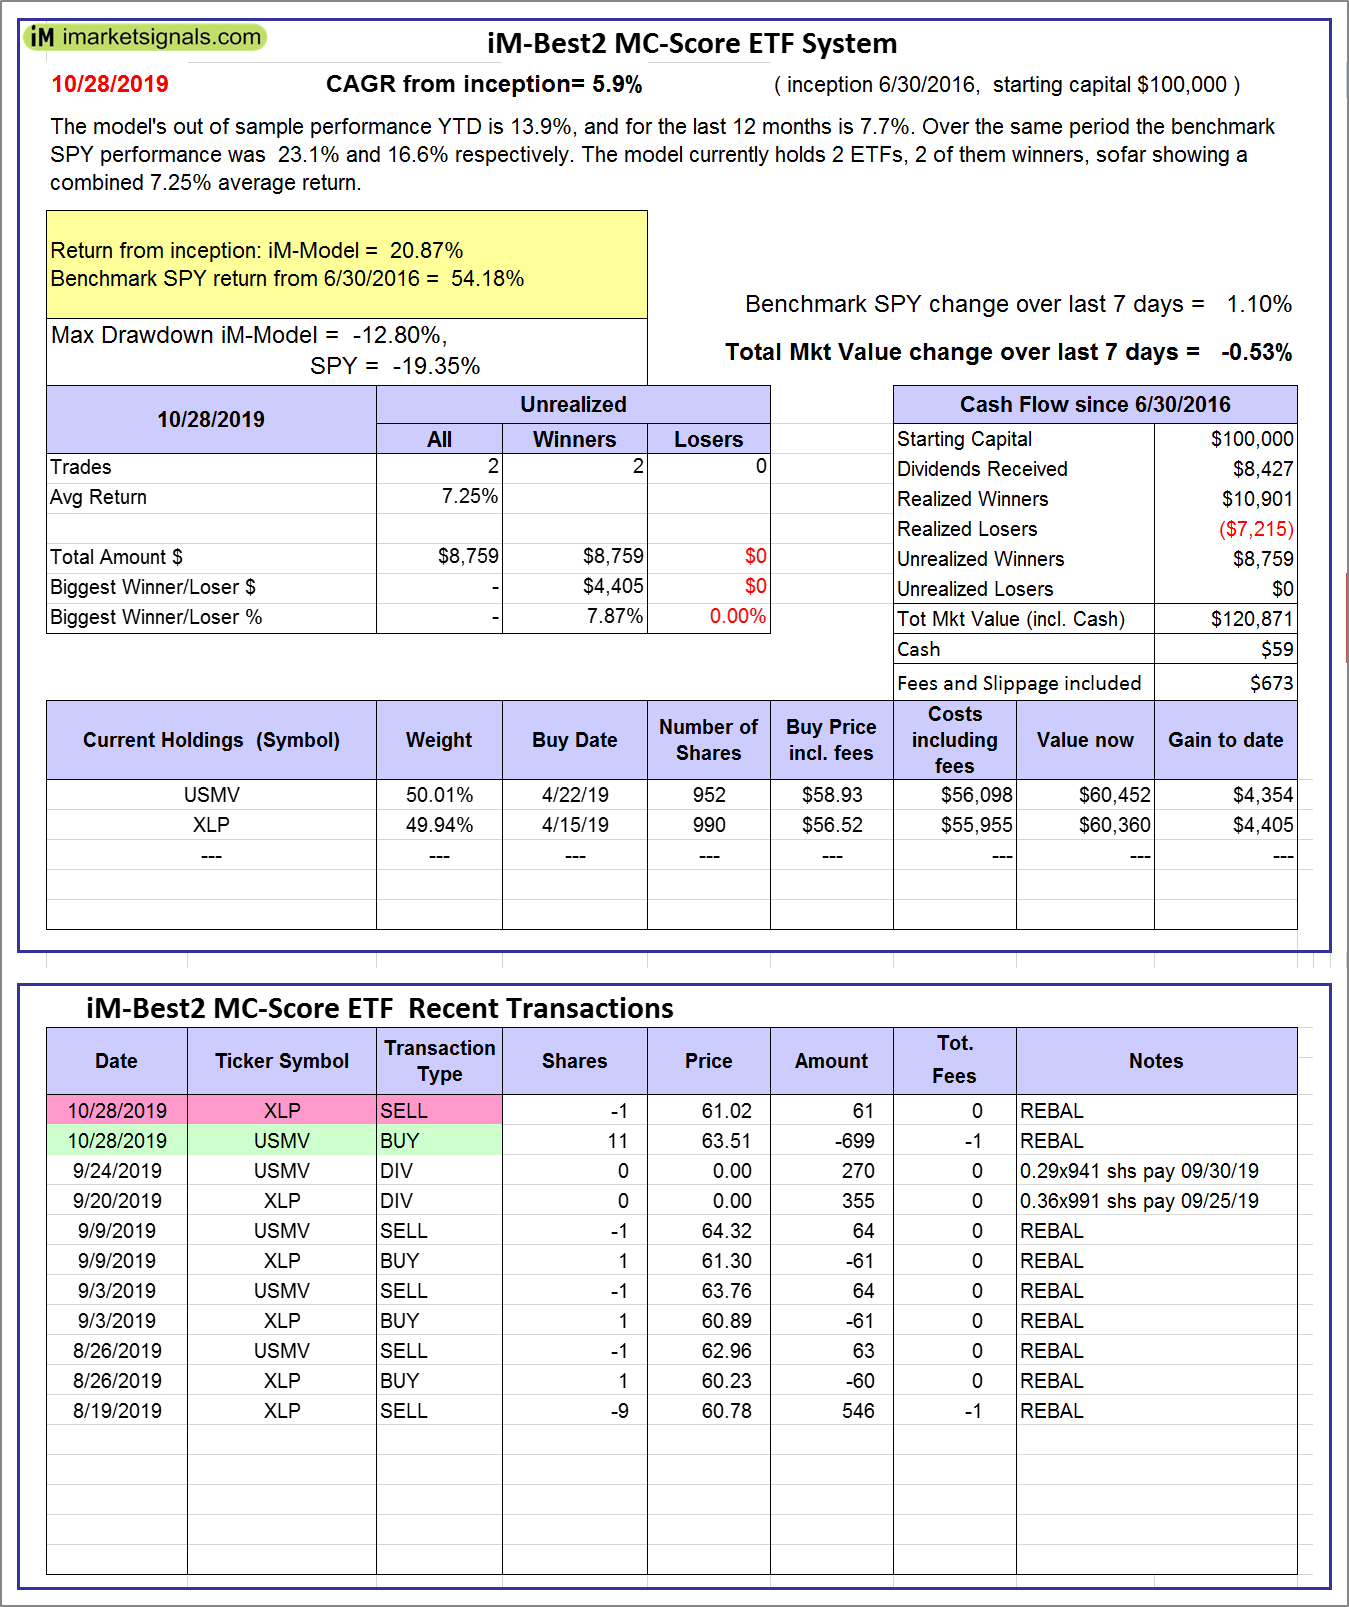 |
iM-Best2 MC-Score ETF System: The model’s out of sample performance YTD is 13.9%, and for the last 12 months is 7.7%. Over the same period the benchmark SPY performance was 23.1% and 16.6% respectively. Over the previous week the market value of the iM-Best2 MC-Score ETF System gained -0.53% at a time when SPY gained 1.10%. A starting capital of $100,000 at inception on 6/30/2016 would have grown to $120,871 which includes $59 cash and excludes $673 spent on fees and slippage. |
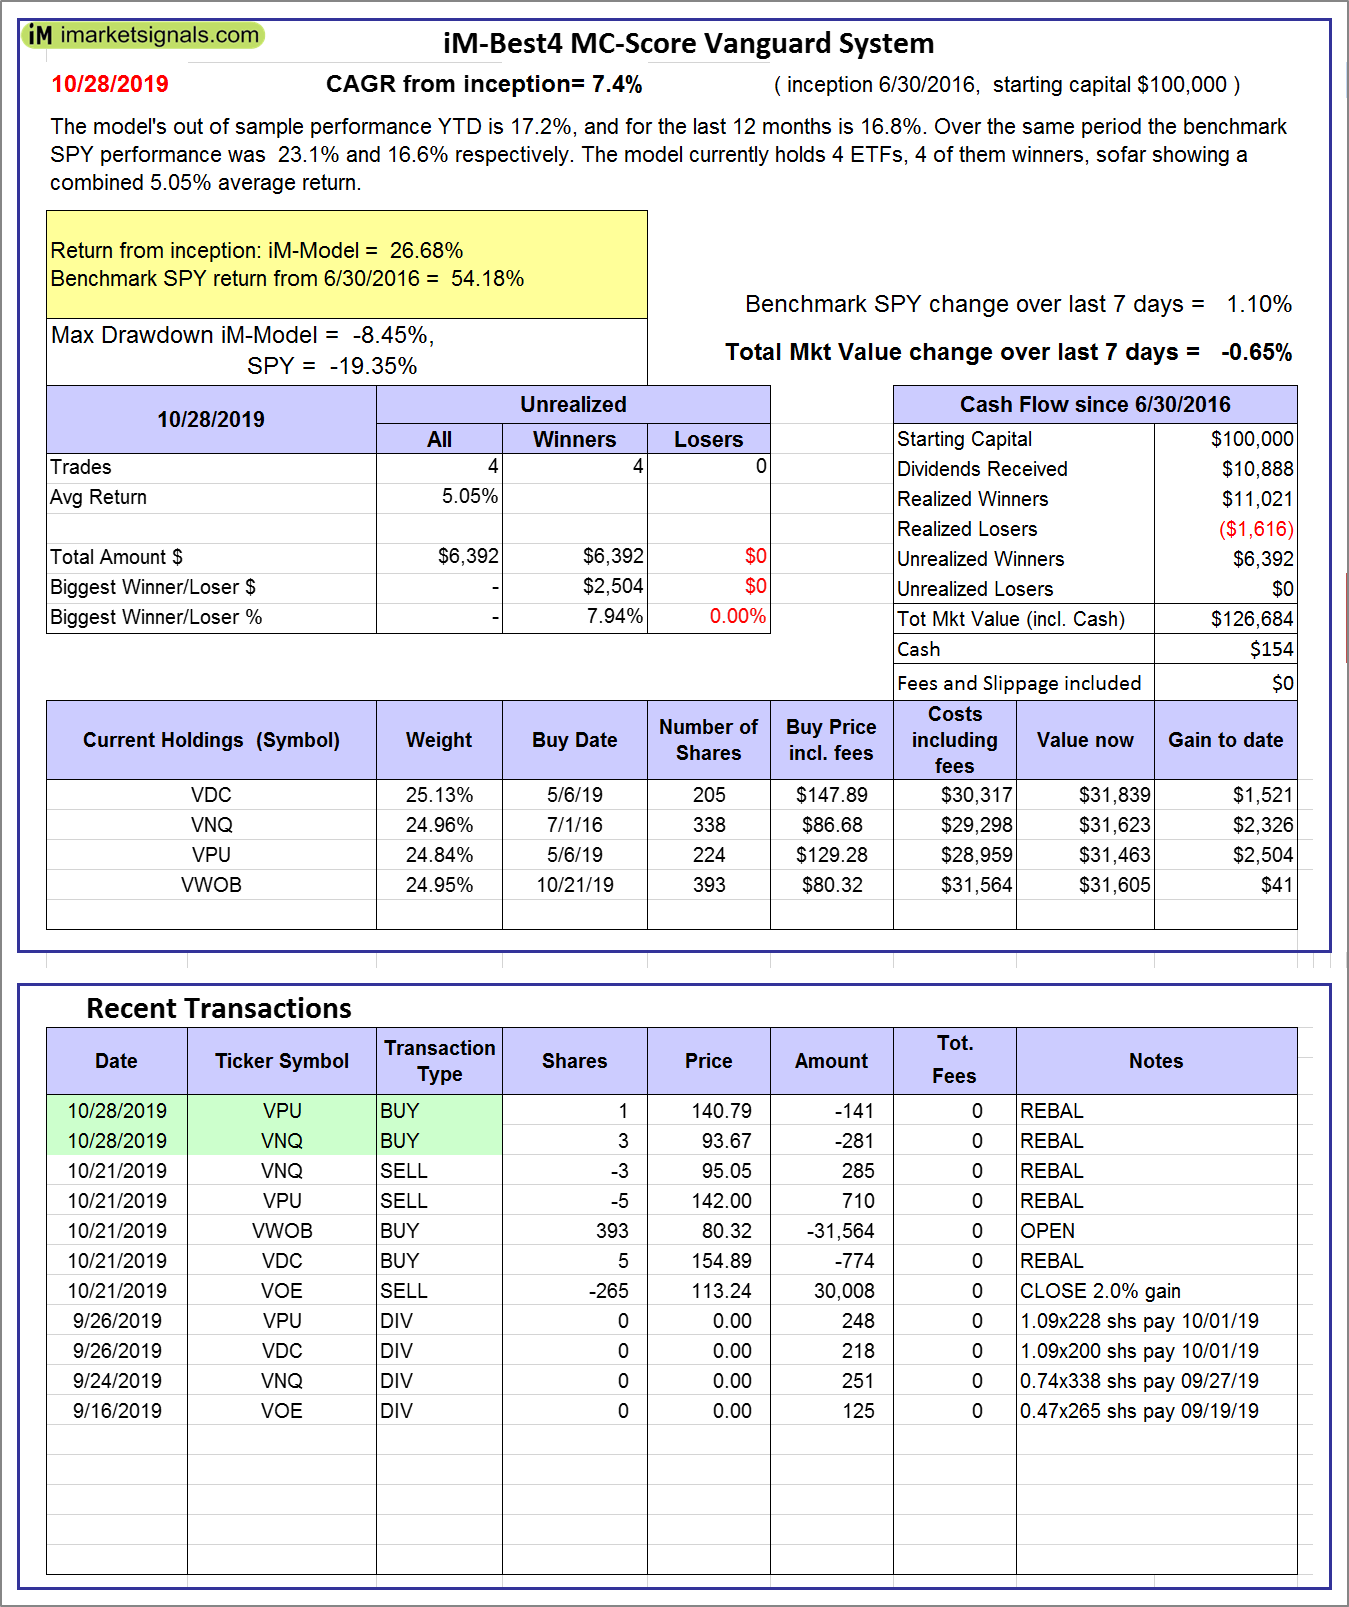 |
iM-Best4 MC-Score Vanguard System: The model’s out of sample performance YTD is 17.2%, and for the last 12 months is 16.8%. Over the same period the benchmark SPY performance was 23.1% and 16.6% respectively. Over the previous week the market value of the iM-Best4 MC-Score Vanguard System gained -0.65% at a time when SPY gained 1.10%. A starting capital of $100,000 at inception on 6/30/2016 would have grown to $126,684 which includes $154 cash and excludes $00 spent on fees and slippage. |
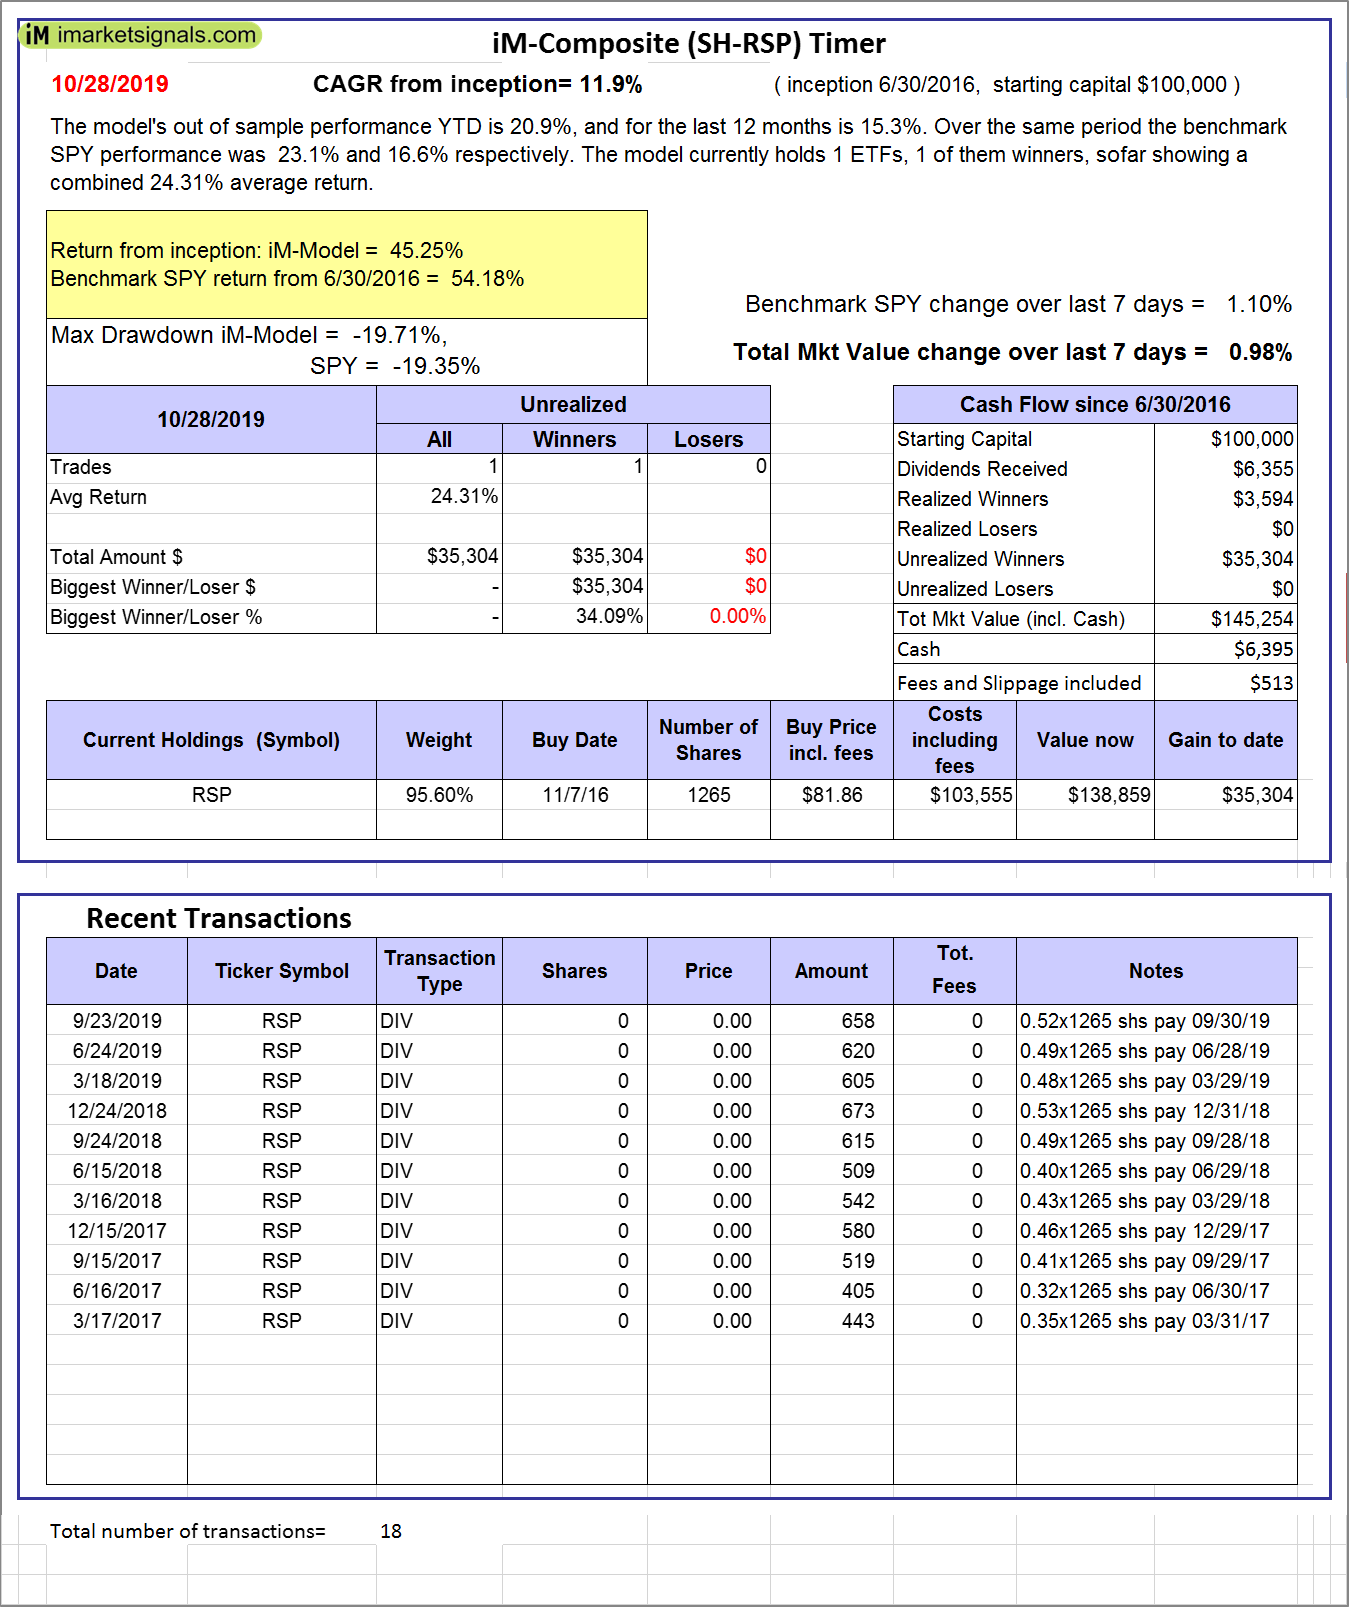 |
iM-Composite (SH-RSP) Timer: The model’s out of sample performance YTD is 20.9%, and for the last 12 months is 15.3%. Over the same period the benchmark SPY performance was 23.1% and 16.6% respectively. Over the previous week the market value of the iM-Composite (SH-RSP) Timer gained 0.98% at a time when SPY gained 1.10%. A starting capital of $100,000 at inception on 6/30/2016 would have grown to $145,254 which includes $6,395 cash and excludes $513 spent on fees and slippage. |
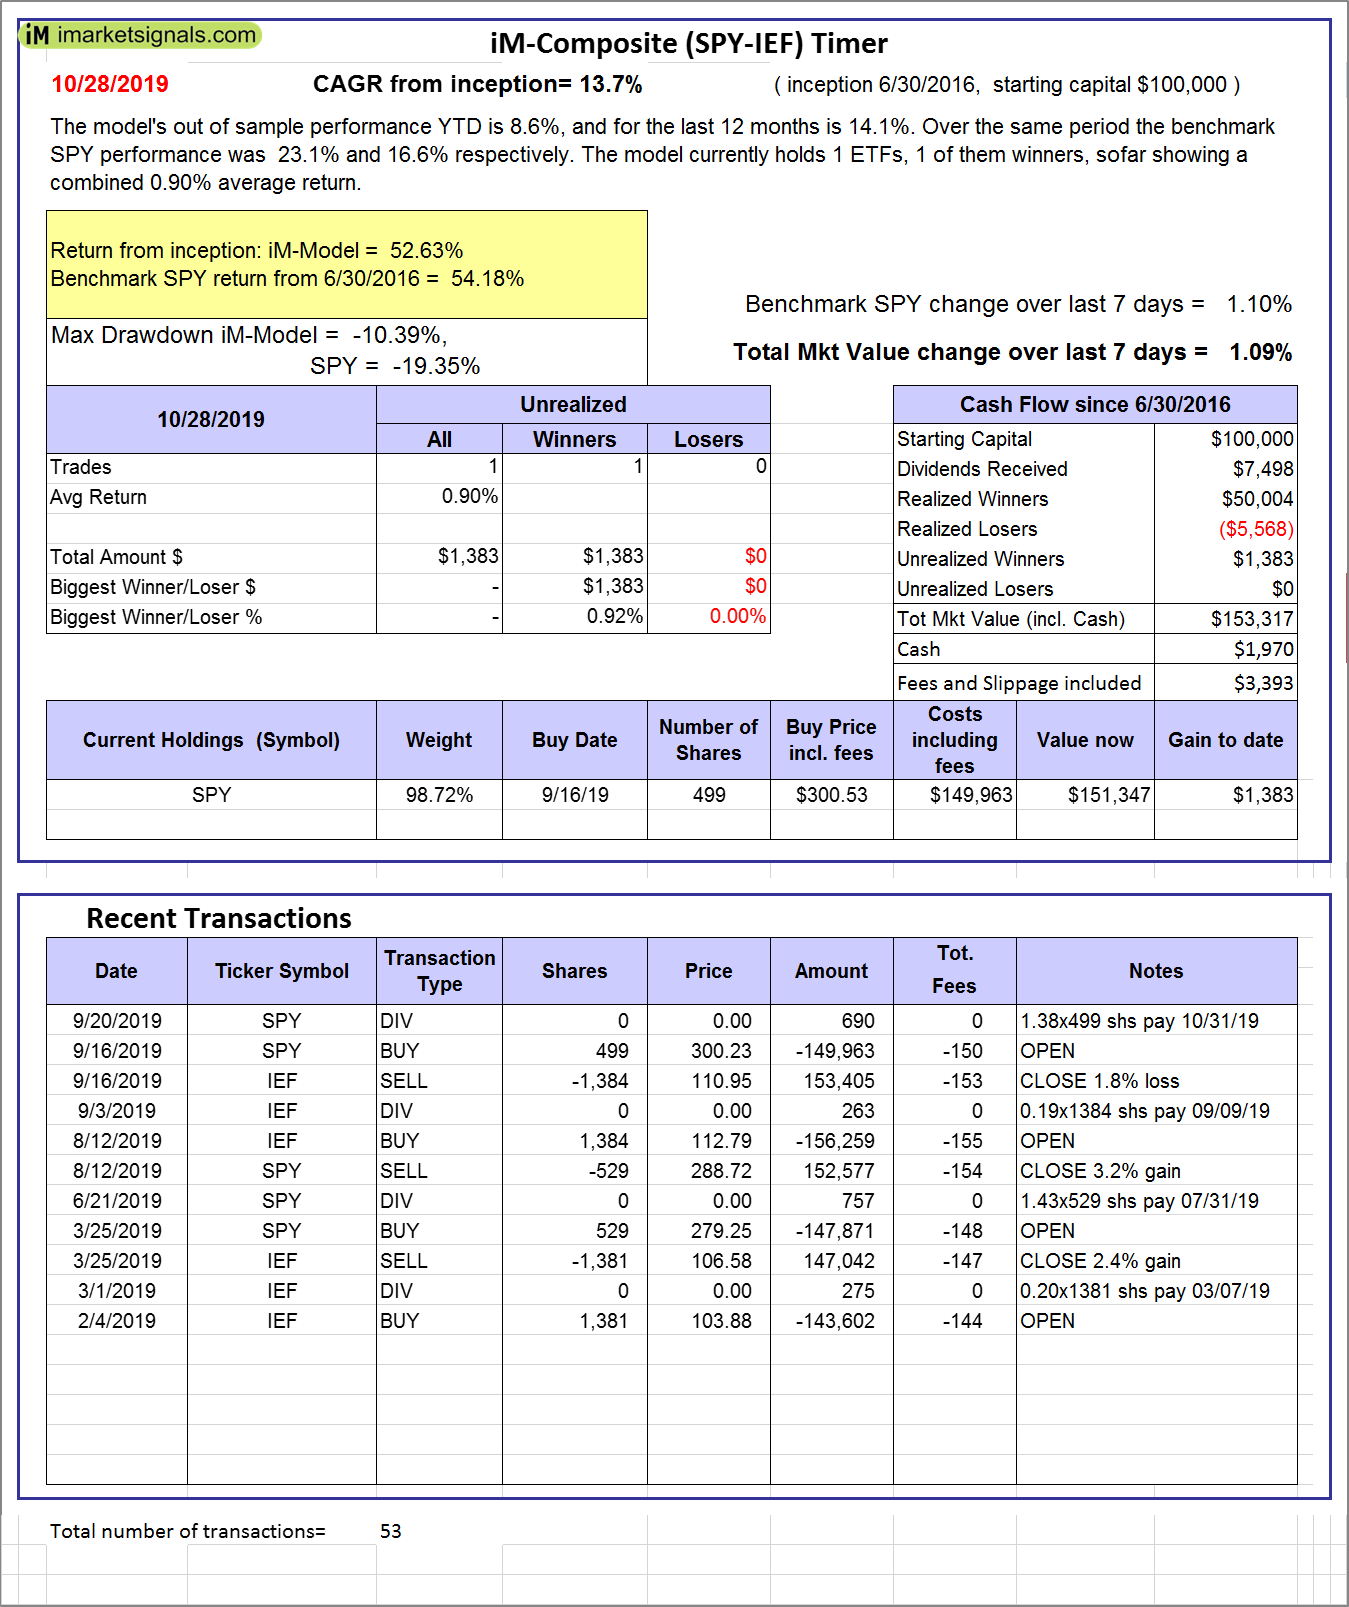 |
iM-Composite (SPY-IEF) Timer: The model’s out of sample performance YTD is 8.6%, and for the last 12 months is 14.1%. Over the same period the benchmark SPY performance was 23.1% and 16.6% respectively. Over the previous week the market value of the iM-Composite (SPY-IEF) Timer gained 1.09% at a time when SPY gained 1.10%. A starting capital of $100,000 at inception on 6/30/2016 would have grown to $153,317 which includes $1,970 cash and excludes $3,393 spent on fees and slippage. |
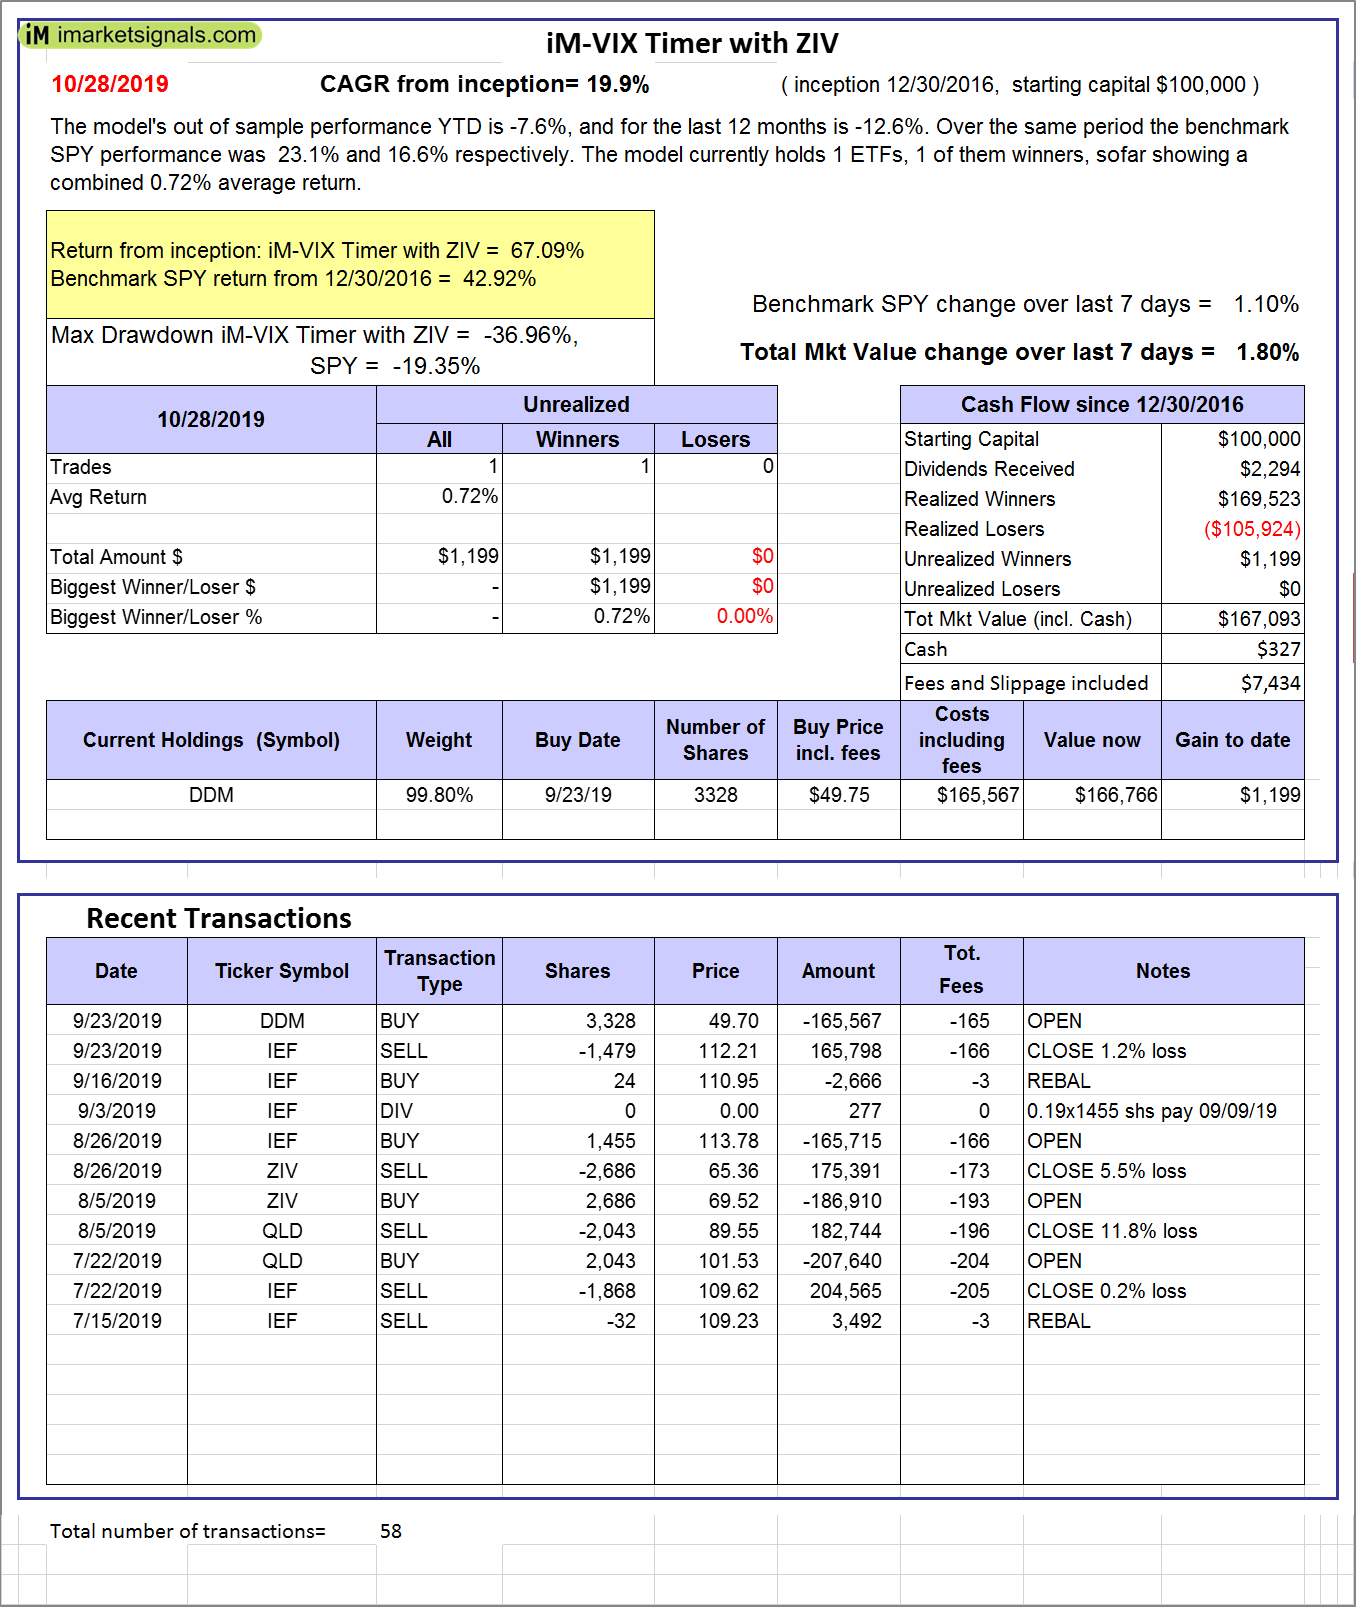 |
iM-VIX Timer with ZIV: The model’s out of sample performance YTD is -7.6%, and for the last 12 months is -12.6%. Over the same period the benchmark SPY performance was 23.1% and 16.6% respectively. Over the previous week the market value of the iM-VIX Timer with ZIV gained 1.80% at a time when SPY gained 1.10%. A starting capital of $100,000 at inception on 6/30/2016 would have grown to $167,093 which includes $327 cash and excludes $7,434 spent on fees and slippage. |
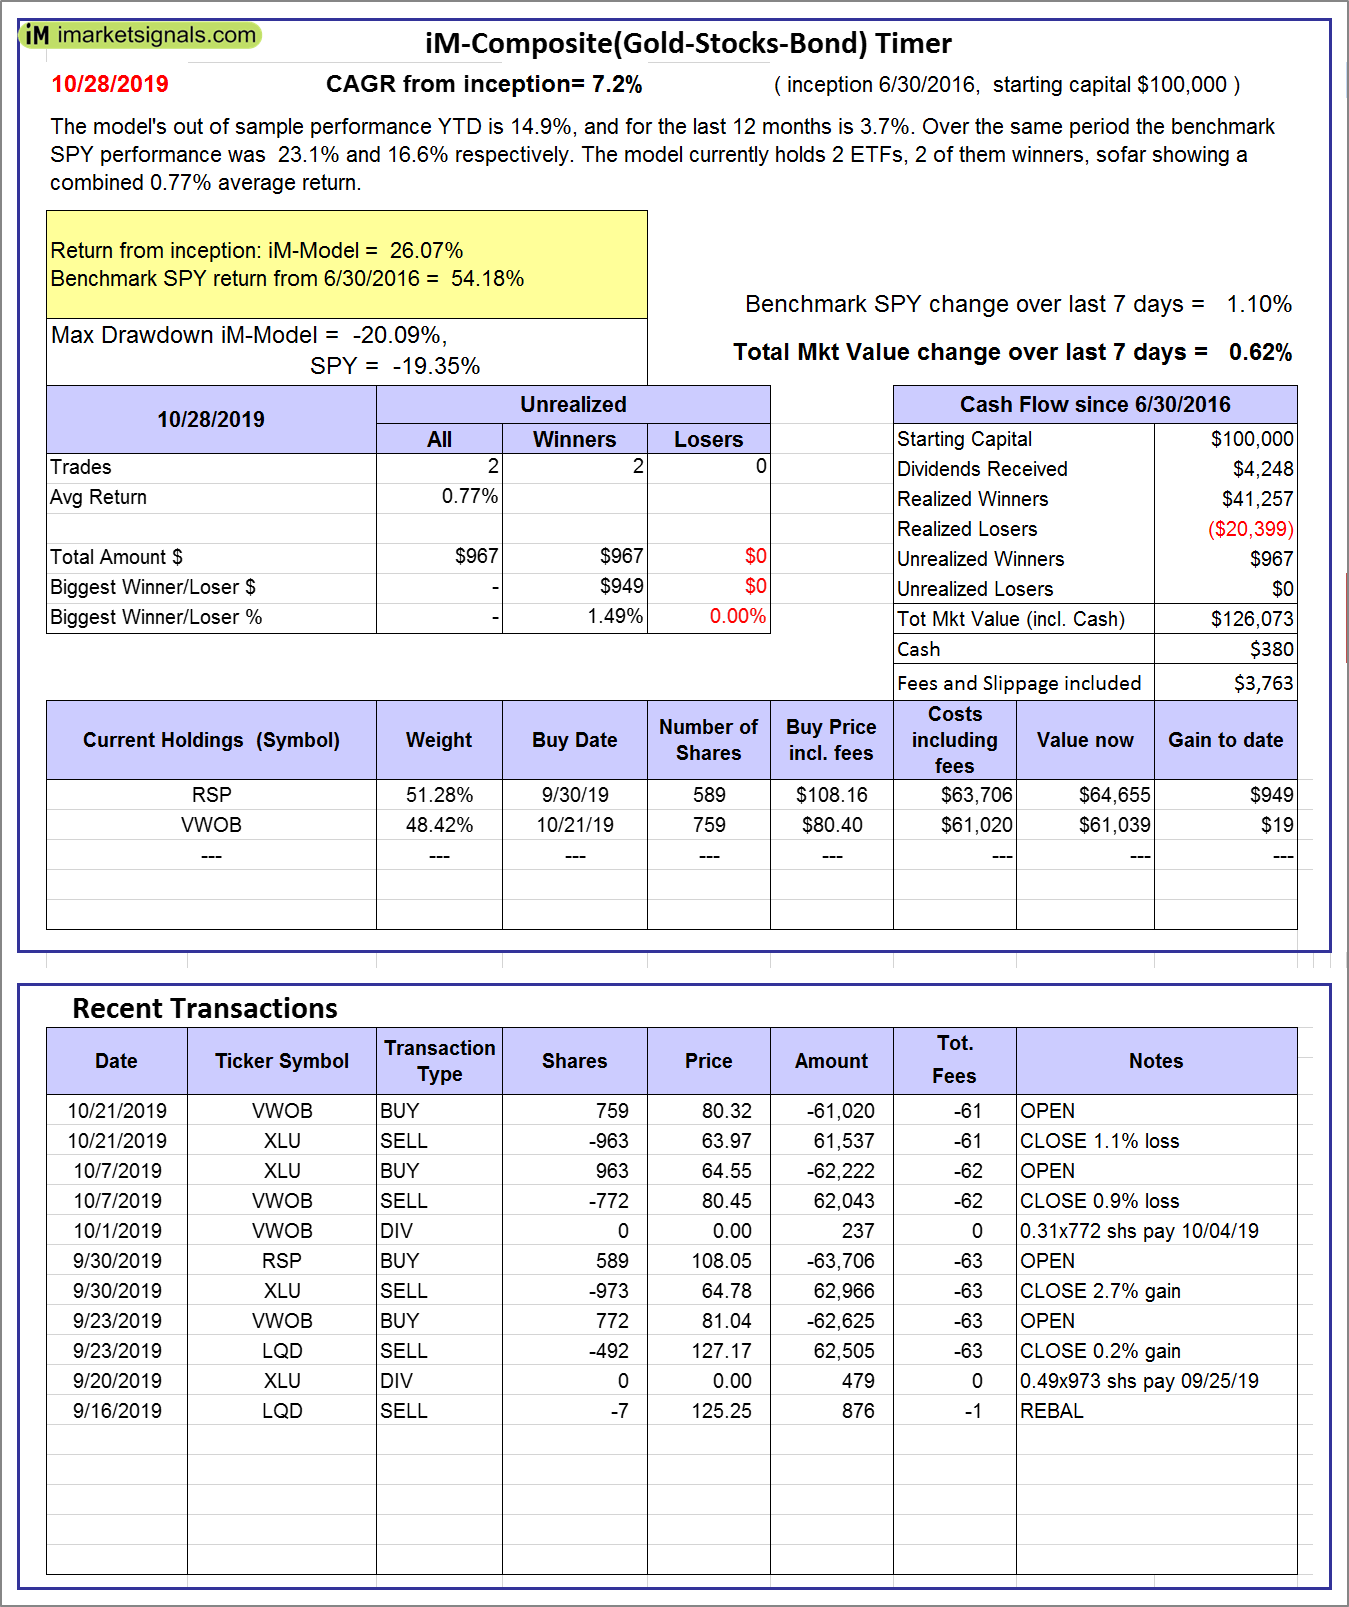 |
iM-Composite(Gold-Stocks-Bond) Timer: The model’s out of sample performance YTD is 14.9%, and for the last 12 months is 3.7%. Over the same period the benchmark SPY performance was 23.1% and 16.6% respectively. Over the previous week the market value of the iM-Composite(Gold-Stocks-Bond) Timer gained 0.62% at a time when SPY gained 1.10%. A starting capital of $100,000 at inception on 6/30/2016 would have grown to $126,073 which includes $380 cash and excludes $3,763 spent on fees and slippage. |
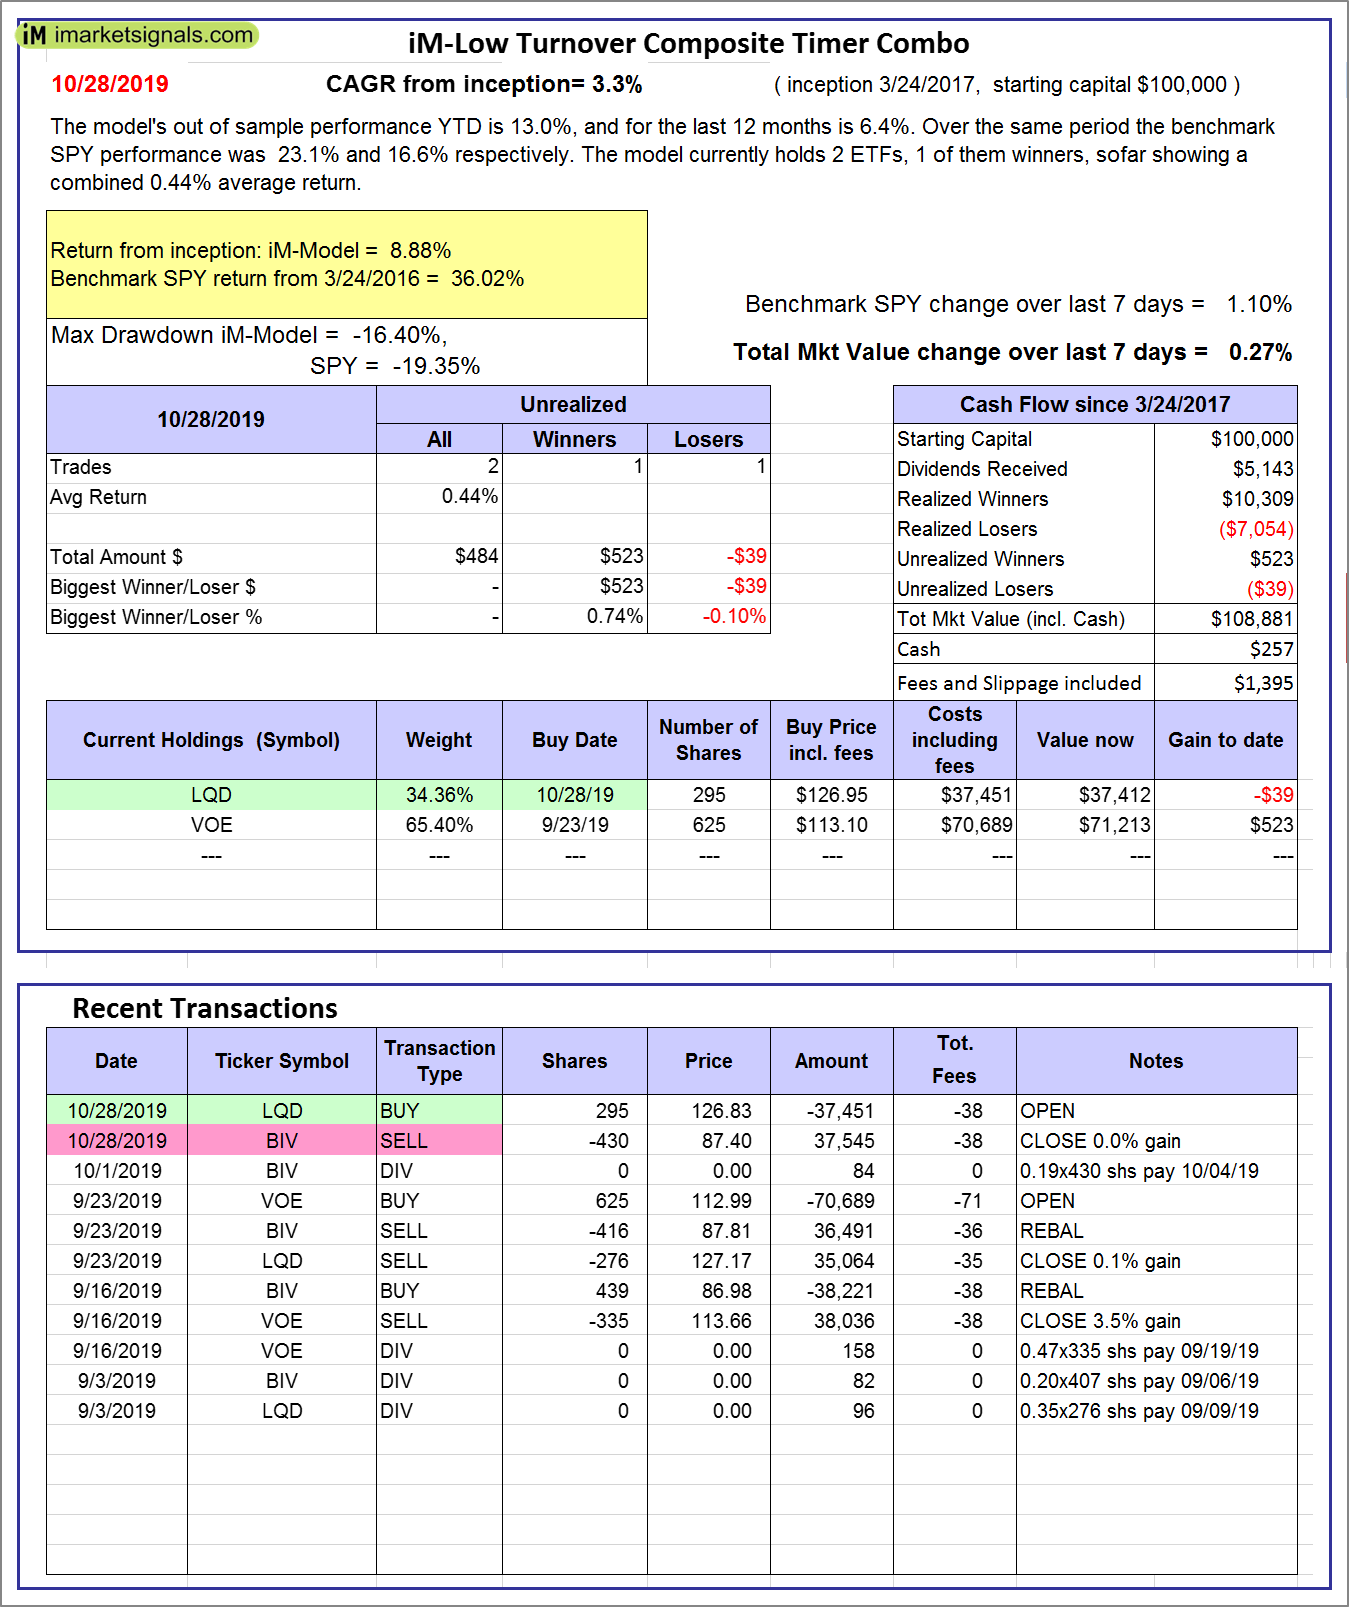 |
iM-Low Turnover Composite Timer Combo: The model’s out of sample performance YTD is 13.0%, and for the last 12 months is 6.4%. Over the same period the benchmark SPY performance was 23.1% and 16.6% respectively. Over the previous week the market value of the iM-Low Turnover Composite Timer Combo gained 0.27% at a time when SPY gained 1.10%. A starting capital of $100,000 at inception on 3/24/27 would have grown to $108,881 which includes $257 cash and excludes $1,395 spent on fees and slippage. |
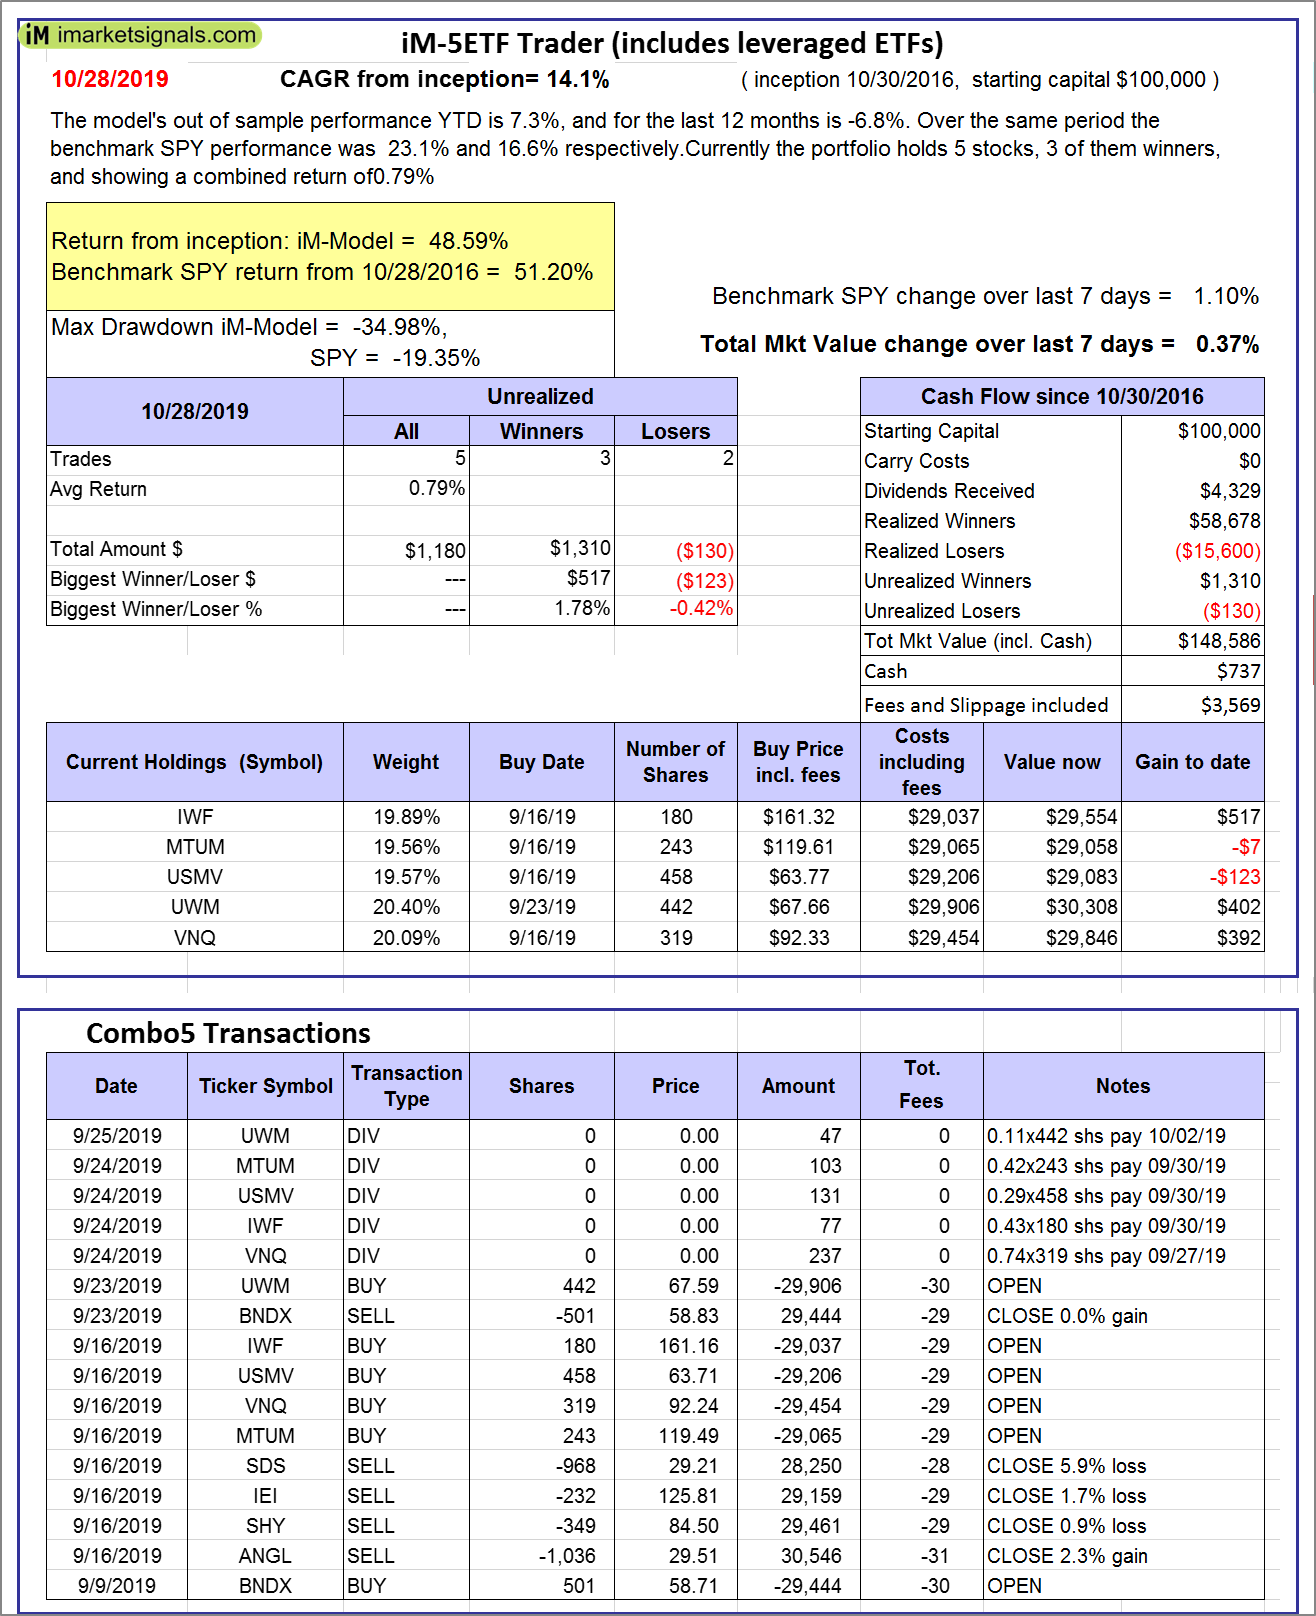 |
iM-5ETF Trader (includes leveraged ETFs): The model’s out of sample performance YTD is 7.3%, and for the last 12 months is -6.8%. Over the same period the benchmark SPY performance was 23.1% and 16.6% respectively. Over the previous week the market value of the iM-5ETF Trader (includes leveraged ETFs) gained 0.37% at a time when SPY gained 1.10%. A starting capital of $100,000 at inception on 10/30/2016 would have grown to $148,586 which includes $737 cash and excludes $3,569 spent on fees and slippage. |
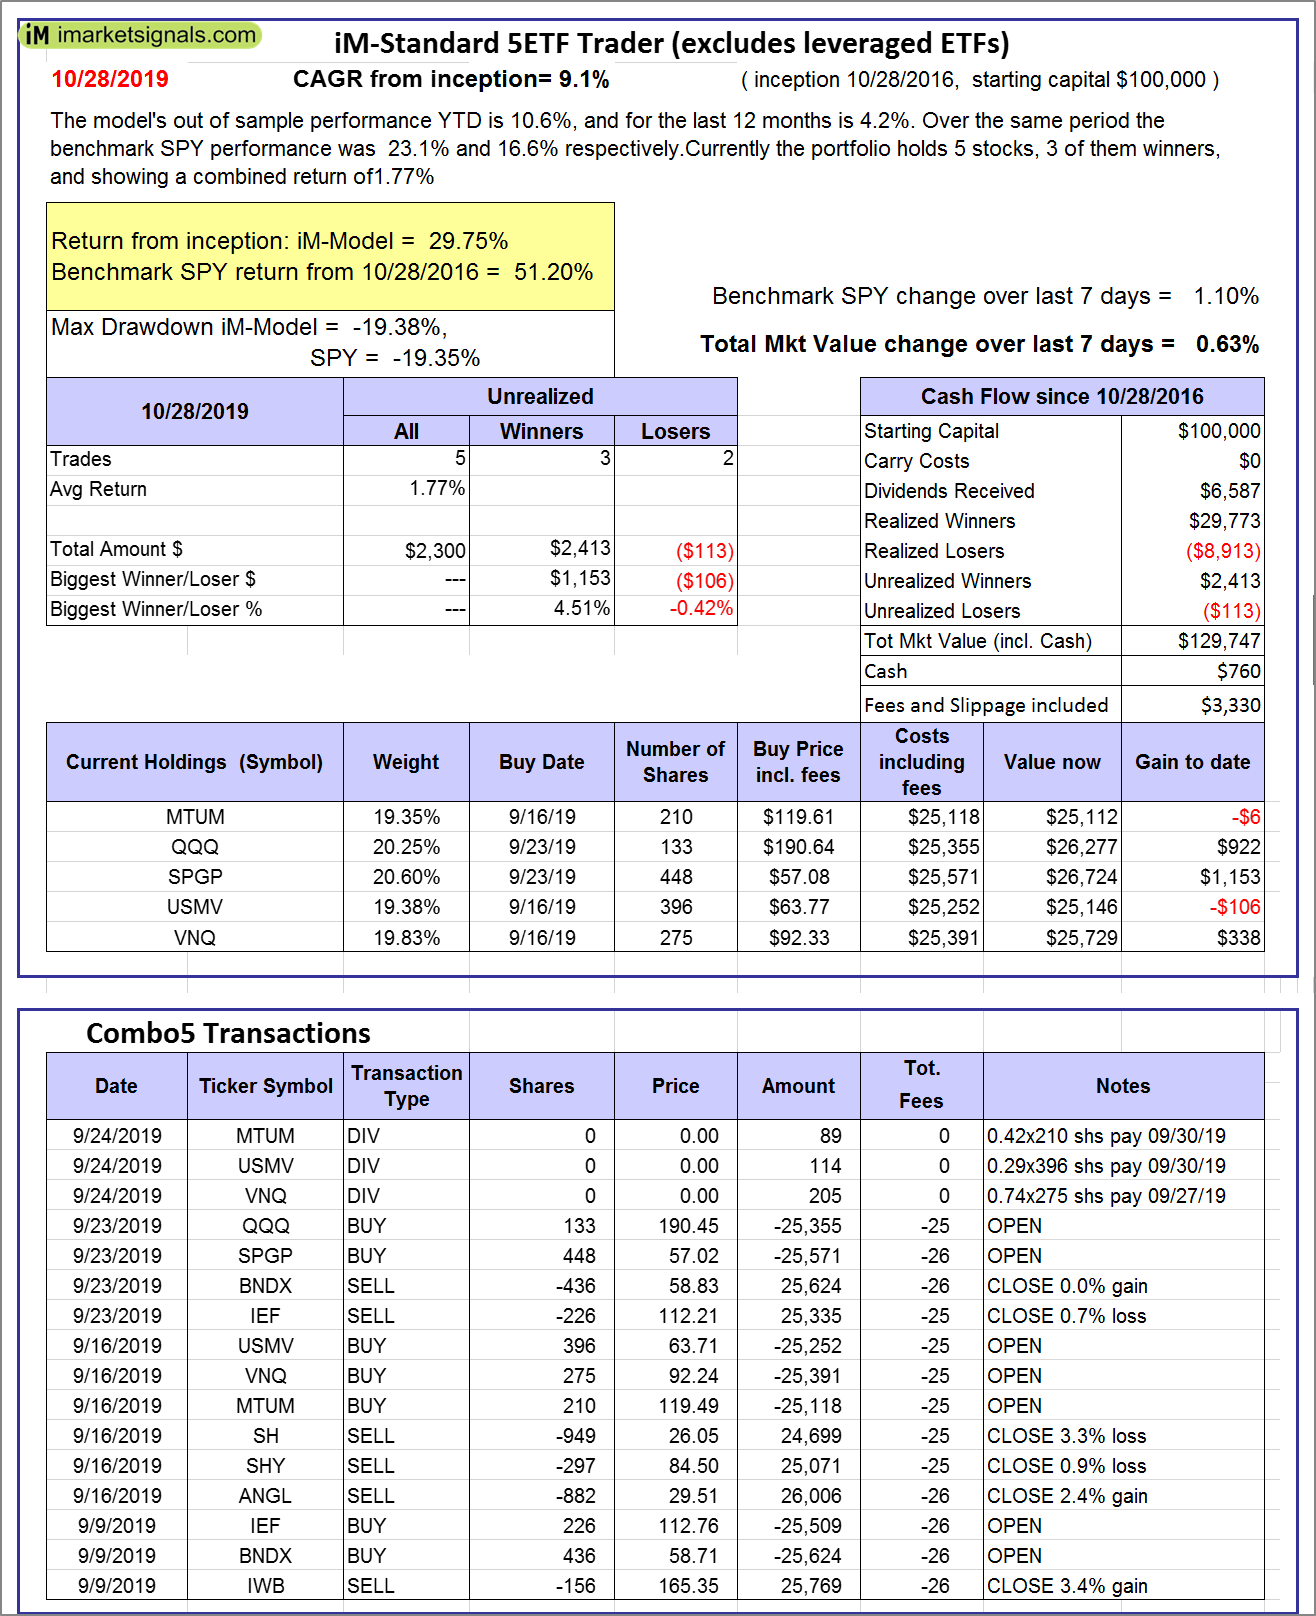 |
iM-Standard 5ETF Trader (excludes leveraged ETFs): The model’s out of sample performance YTD is 10.6%, and for the last 12 months is 4.2%. Over the same period the benchmark SPY performance was 23.1% and 16.6% respectively. Over the previous week the market value of the iM-Standard 5ETF Trader (excludes leveraged ETFs) gained 0.63% at a time when SPY gained 1.10%. A starting capital of $100,000 at inception on 10/30/2016 would have grown to $129,747 which includes $760 cash and excludes $3,330 spent on fees and slippage. |
iM-Best Reports – 10/28/2019
Posted in pmp SPY-SH
Leave a Reply
You must be logged in to post a comment.