
  |
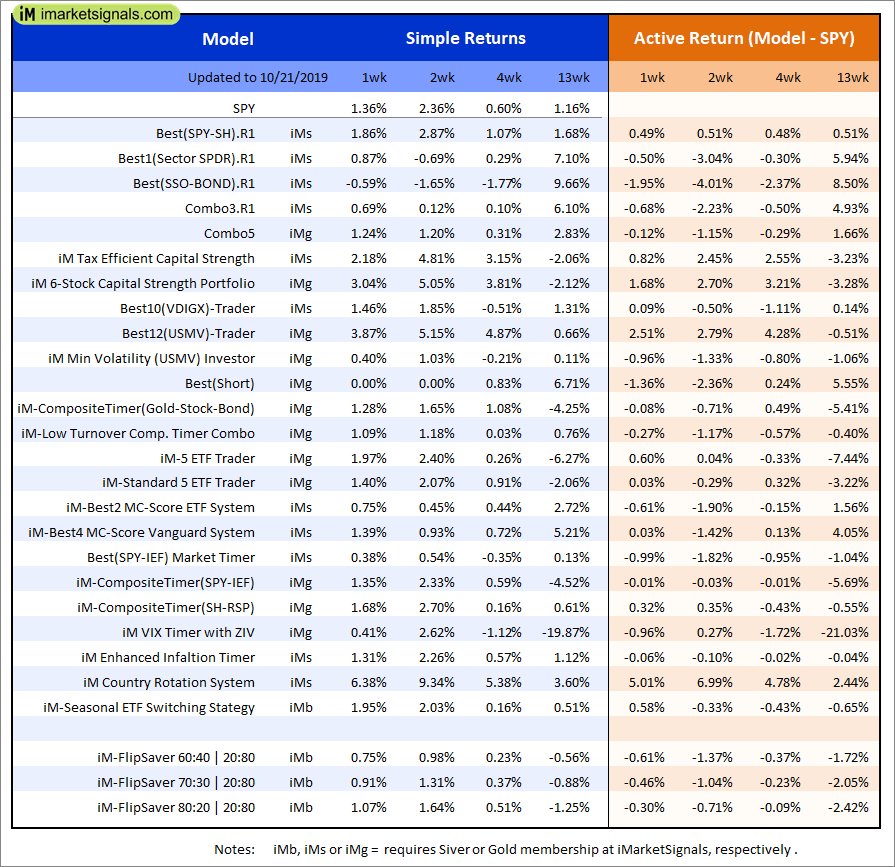
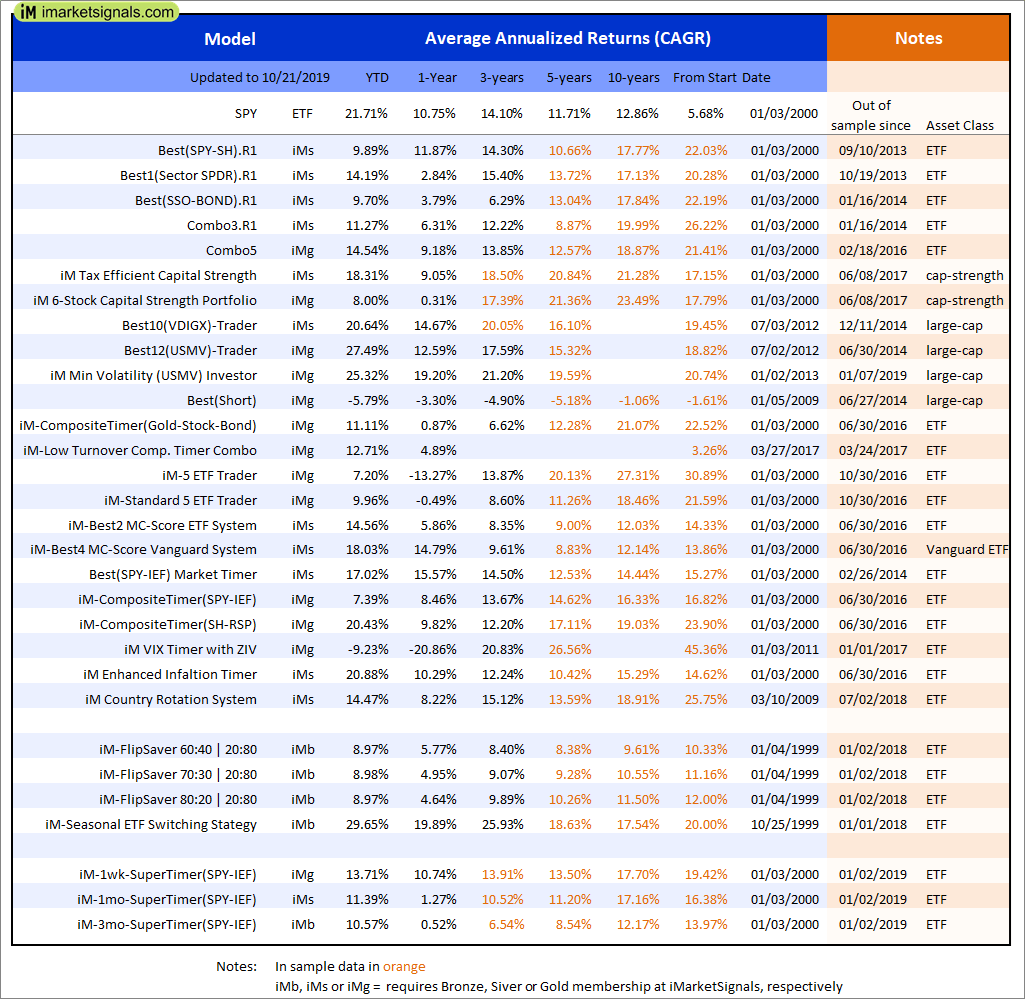
Out of sample performance summary of our models for the past 1, 2, 4 and 13 week periods. The active active return indicates how the models over- or underperformed the benchmark ETF SPY. Also the YTD, and the 1-, 3-, 5- and 10-year annualized returns are shown in the second table |
 |
iM-FlipSaver 60:40 | 20:80 – 2017: The model’s out of sample performance YTD is 10.0%, and for the last 12 months is 6.4%. Over the same period the benchmark E60B40 performance was 16.4% and 11.3% respectively. Over the previous week the market value of iM-FlipSaver 80:20 | 20:80 gained 0.75% at a time when SPY gained 0.68%. A starting capital of $100,000 at inception on 7/16/2015 would have grown to $123,144 which includes $22 cash and excludes $1,278 spent on fees and slippage. |
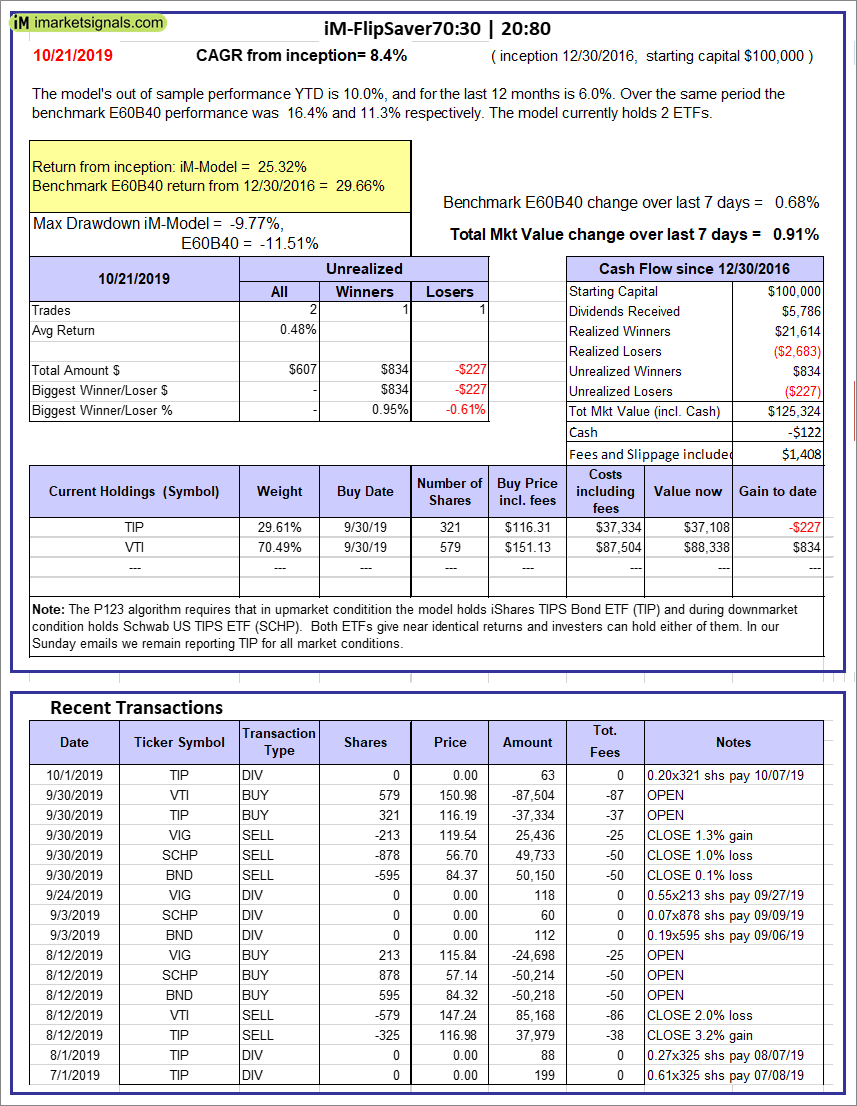 |
iM-FlipSaver 70:30 | 20:80 – 2017: The model’s out of sample performance YTD is 10.0%, and for the last 12 months is 6.0%. Over the same period the benchmark E60B40 performance was 16.4% and 11.3% respectively. Over the previous week the market value of iM-FlipSaver 70:30 | 20:80 gained 0.91% at a time when SPY gained 0.68%. A starting capital of $100,000 at inception on 7/15/2015 would have grown to $125,324 which includes -$122 cash and excludes $1,408 spent on fees and slippage. |
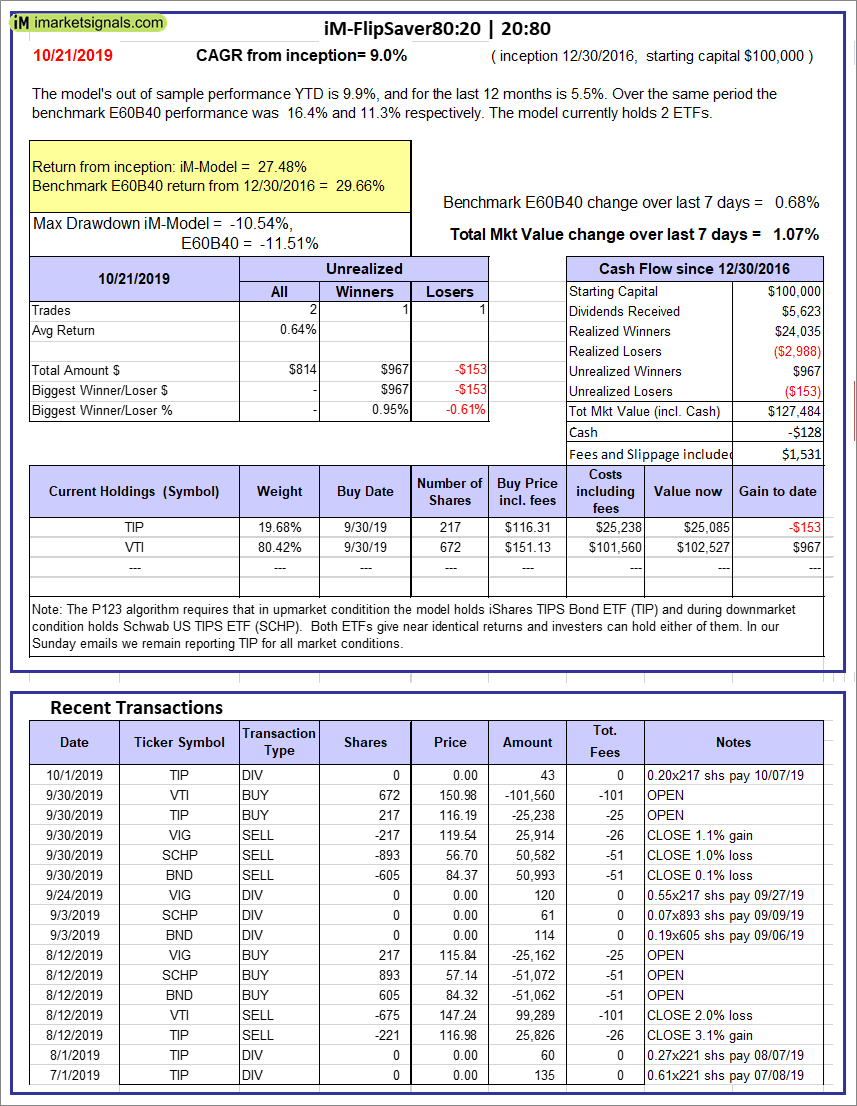 |
iM-FlipSaver 80:20 | 20:80 – 2017: The model’s out of sample performance YTD is 9.9%, and for the last 12 months is 5.5%. Over the same period the benchmark E60B40 performance was 16.4% and 11.3% respectively. Over the previous week the market value of iM-FlipSaver 80:20 | 20:80 gained 1.07% at a time when SPY gained 0.68%. A starting capital of $100,000 at inception on 1/2/2017 would have grown to $127,484 which includes -$128 cash and excludes $1,531 spent on fees and slippage. |
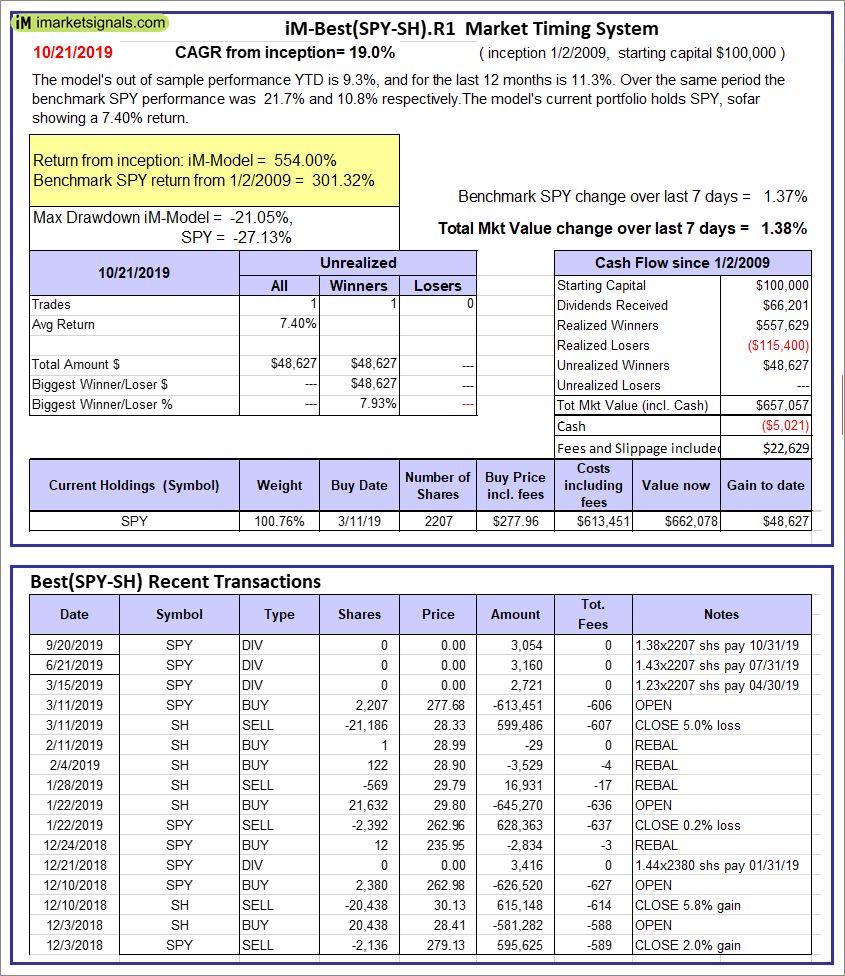 |
iM-Best(SPY-SH).R1: The model’s out of sample performance YTD is 9.3%, and for the last 12 months is 11.3%. Over the same period the benchmark SPY performance was 21.7% and 10.8% respectively. Over the previous week the market value of Best(SPY-SH) gained 1.38% at a time when SPY gained 1.37%. A starting capital of $100,000 at inception on 1/2/2009 would have grown to $657,057 which includes -$5,021 cash and excludes $22,629 spent on fees and slippage. |
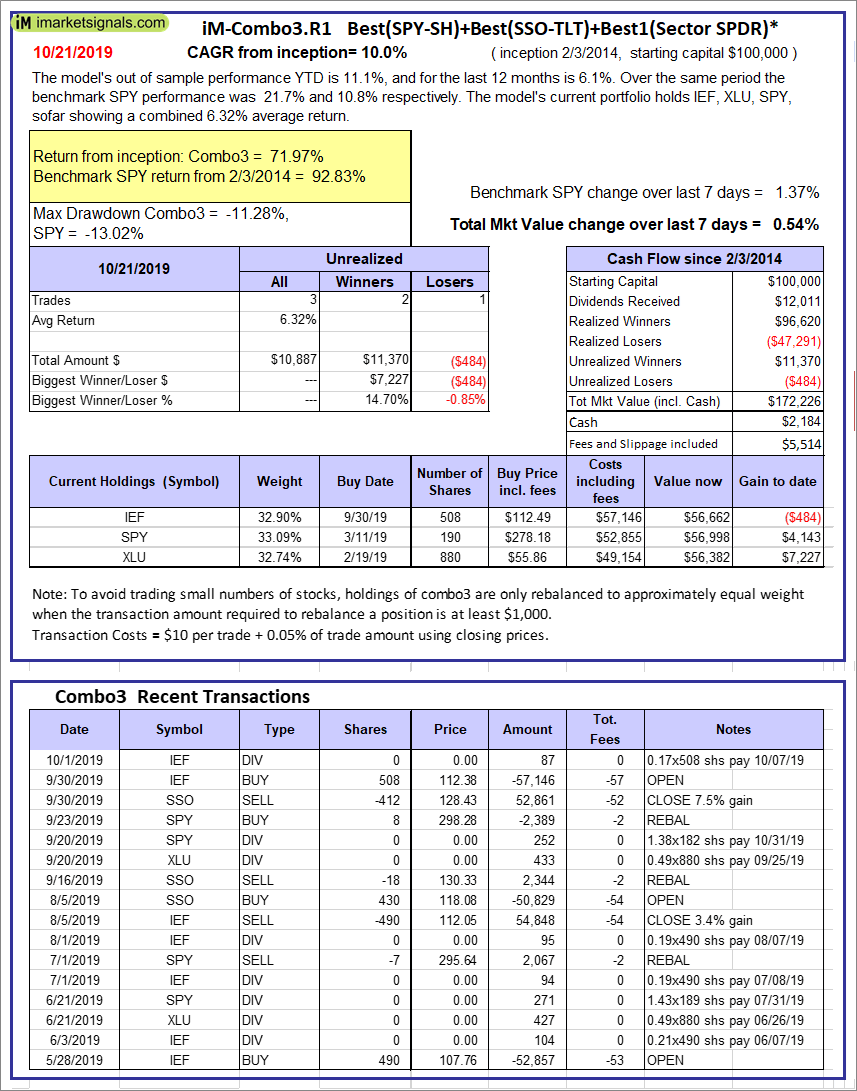 |
iM-Combo3.R1: The model’s out of sample performance YTD is 11.1%, and for the last 12 months is 6.1%. Over the same period the benchmark SPY performance was 21.7% and 10.8% respectively. Over the previous week the market value of iM-Combo3.R1 gained 0.54% at a time when SPY gained 1.37%. A starting capital of $100,000 at inception on 2/3/2014 would have grown to $172,226 which includes $2,184 cash and excludes $5,514 spent on fees and slippage. |
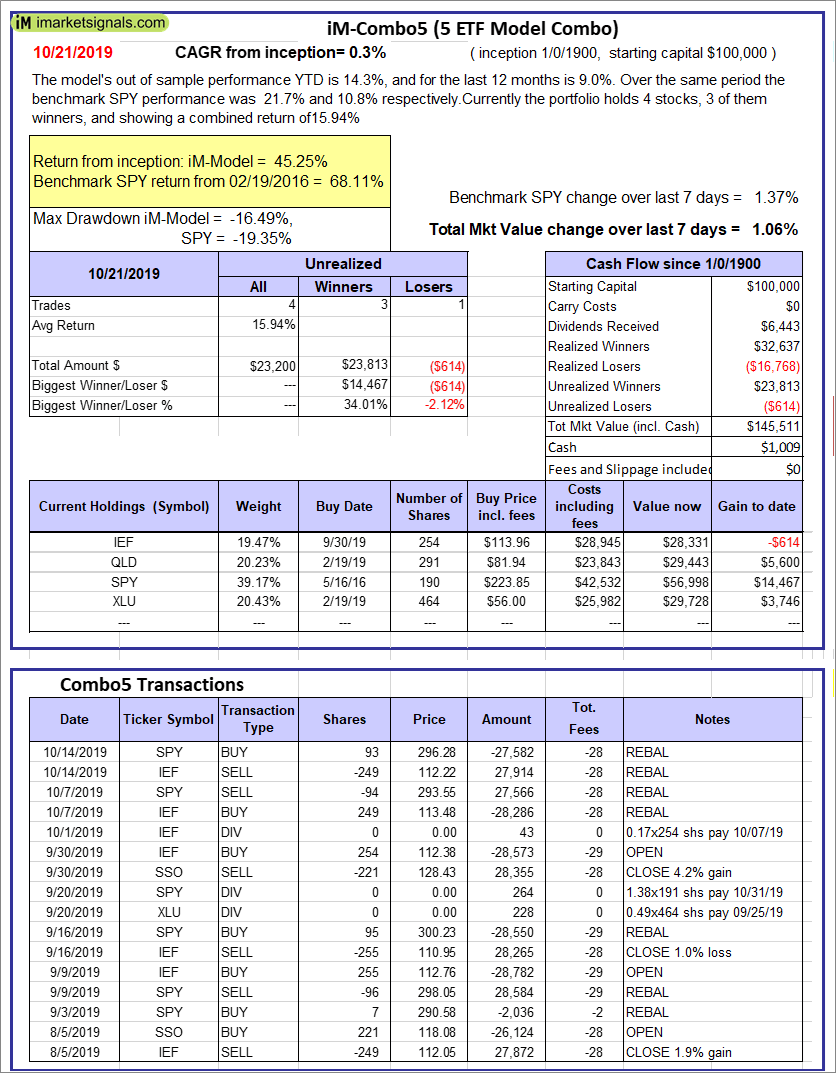 |
iM-Combo5: The model’s out of sample performance YTD is 14.3%, and for the last 12 months is 9.0%. Over the same period the benchmark SPY performance was 21.7% and 10.8% respectively. Over the previous week the market value of iM-Combo5 gained 1.06% at a time when SPY gained 1.37%. A starting capital of $100,000 at inception on 2/22/2016 would have grown to $145,511 which includes $1,009 cash and excludes $0 spent on fees and slippage. |
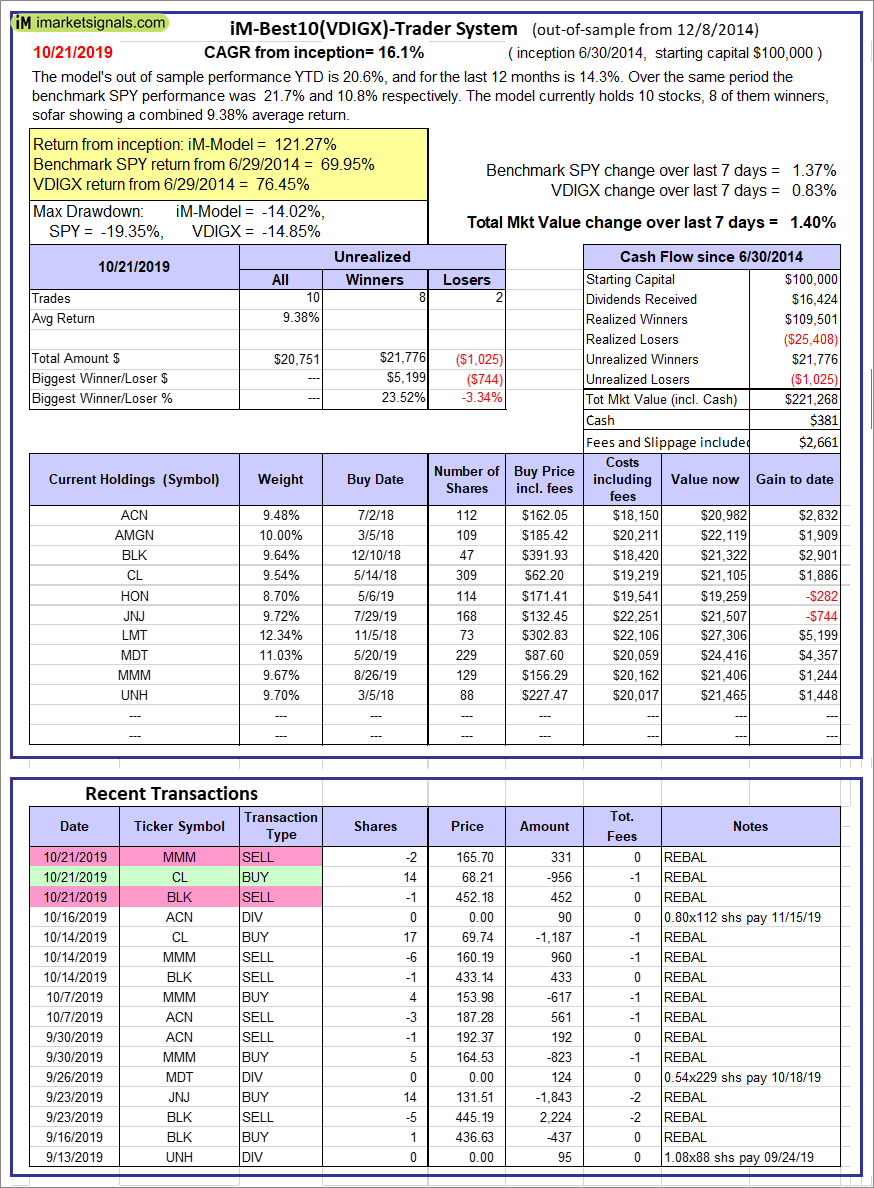 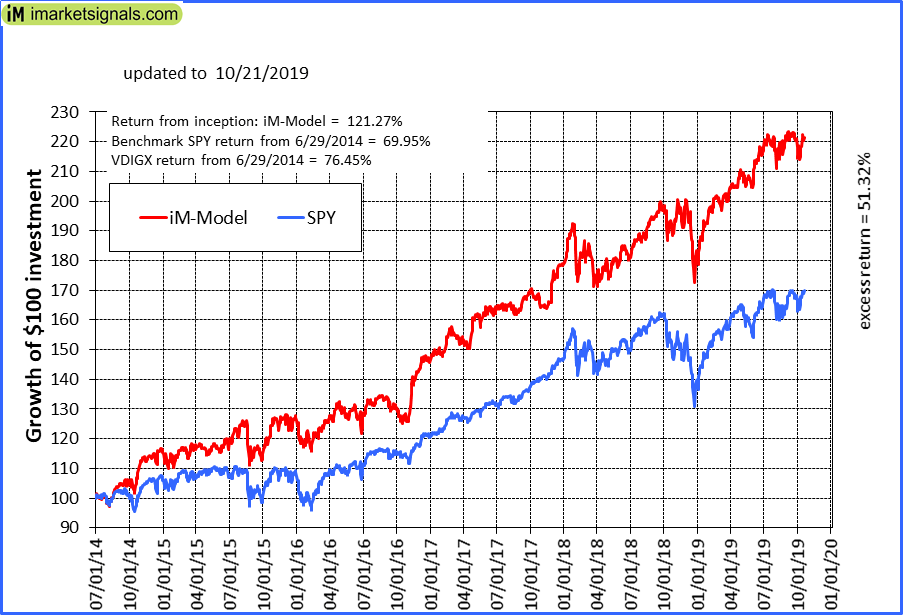 |
iM-Best10(VDIGX)-Trader: The model’s out of sample performance YTD is 20.6%, and for the last 12 months is 14.3%. Over the same period the benchmark SPY performance was 21.7% and 10.8% respectively. Since inception, on 7/1/2014, the model gained 121.27% while the benchmark SPY gained 69.95% and VDIGX gained 76.45% over the same period. Over the previous week the market value of iM-Best10(VDIGX) gained 1.40% at a time when SPY gained 1.37%. A starting capital of $100,000 at inception on 7/1/2014 would have grown to $221,268 which includes $381 cash and excludes $2,661 spent on fees and slippage. |
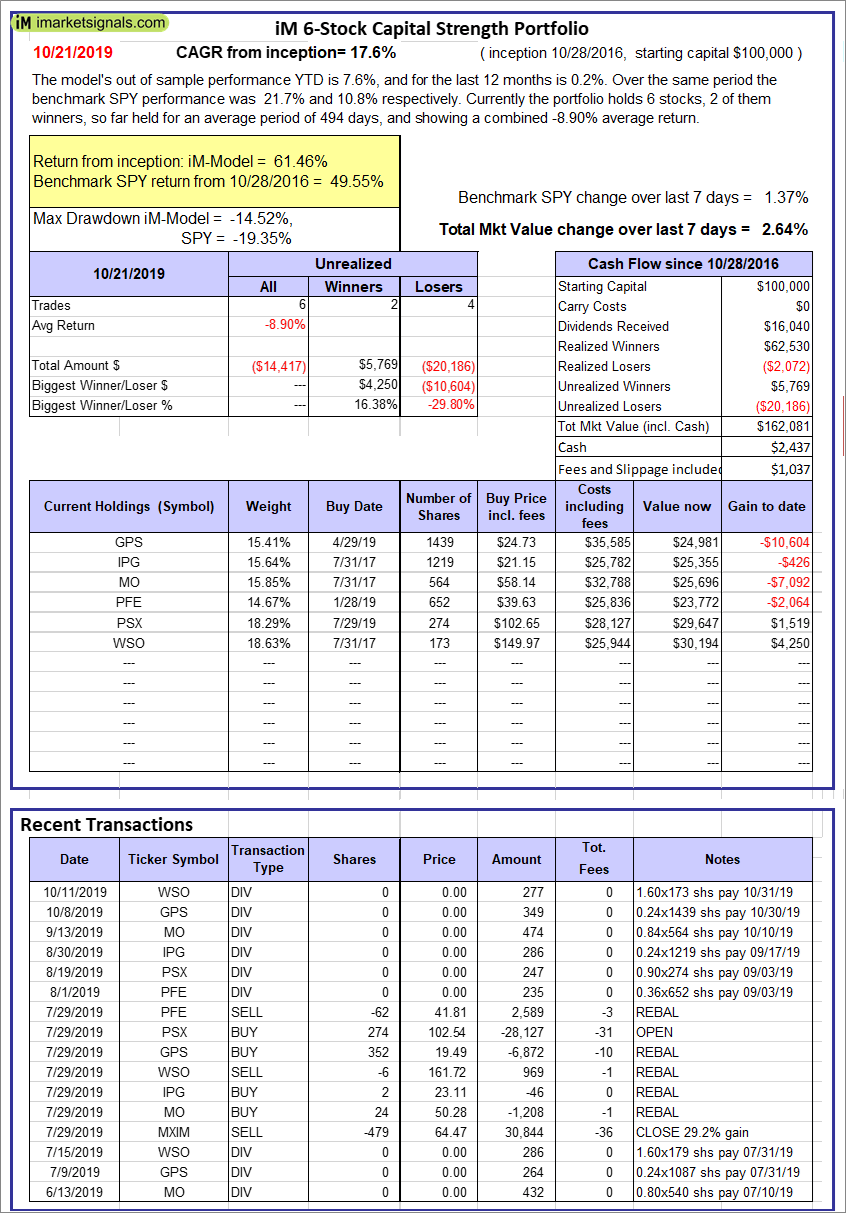 |
iM 6-Stock Capital Strength Portfolio: The model’s out of sample performance YTD is 7.6%, and for the last 12 months is 0.2%. Over the same period the benchmark SPY performance was 21.7% and 10.8% respectively. Over the previous week the market value of the iM 6-Stock Capital Strength Portfolio gained 2.64% at a time when SPY gained 1.37%. A starting capital of $100,000 at inception on 10/28/2016 would have grown to $162,081 which includes $2,437 cash and excludes $1,037 spent on fees and slippage. |
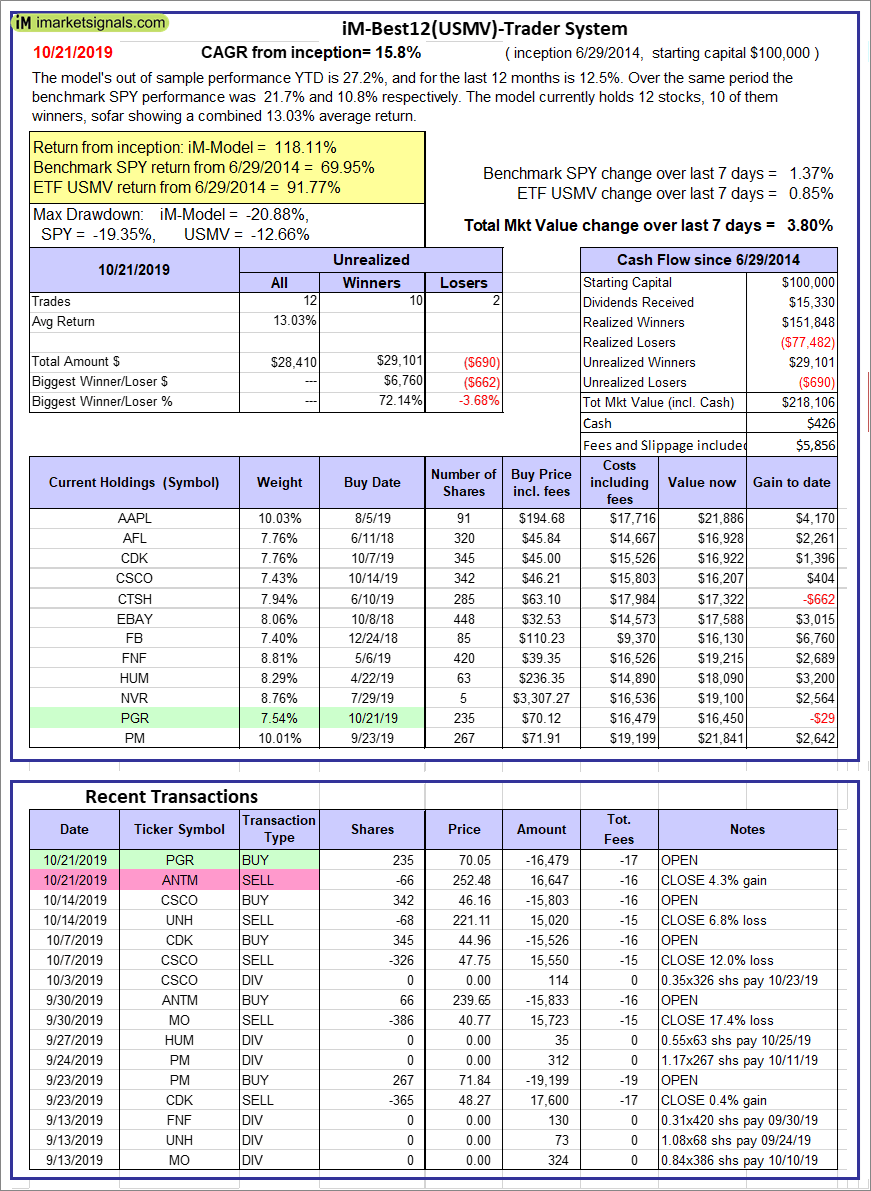 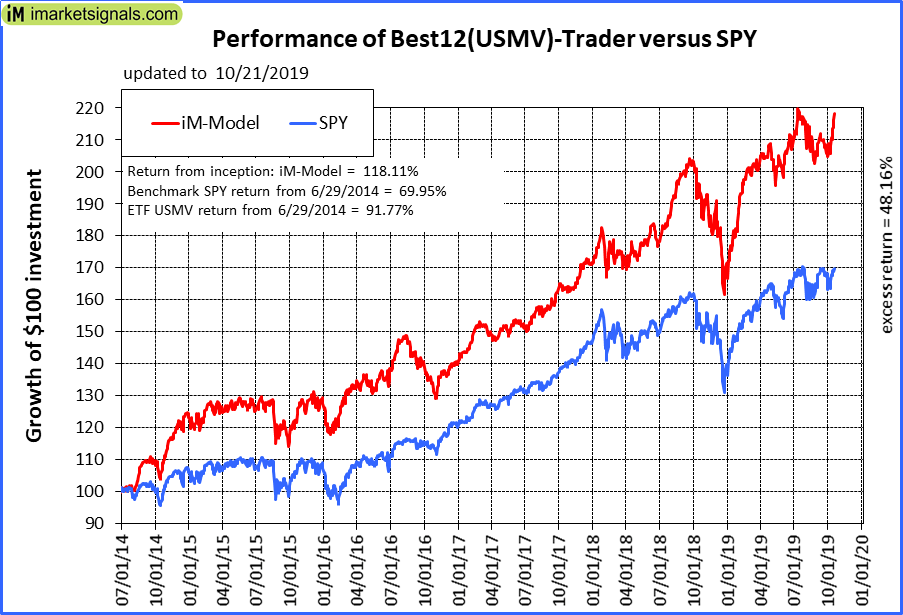 |
iM-Best12(USMV)-Trader: The model’s out of sample performance YTD is 27.2%, and for the last 12 months is 12.5%. Over the same period the benchmark SPY performance was 21.7% and 10.8% respectively. Since inception, on 6/30/2014, the model gained 118.11% while the benchmark SPY gained 69.95% and the ETF USMV gained 91.77% over the same period. Over the previous week the market value of iM-Best12(USMV)-Trader gained 3.80% at a time when SPY gained 1.37%. A starting capital of $100,000 at inception on 6/30/2014 would have grown to $218,106 which includes $426 cash and excludes $5,856 spent on fees and slippage. |
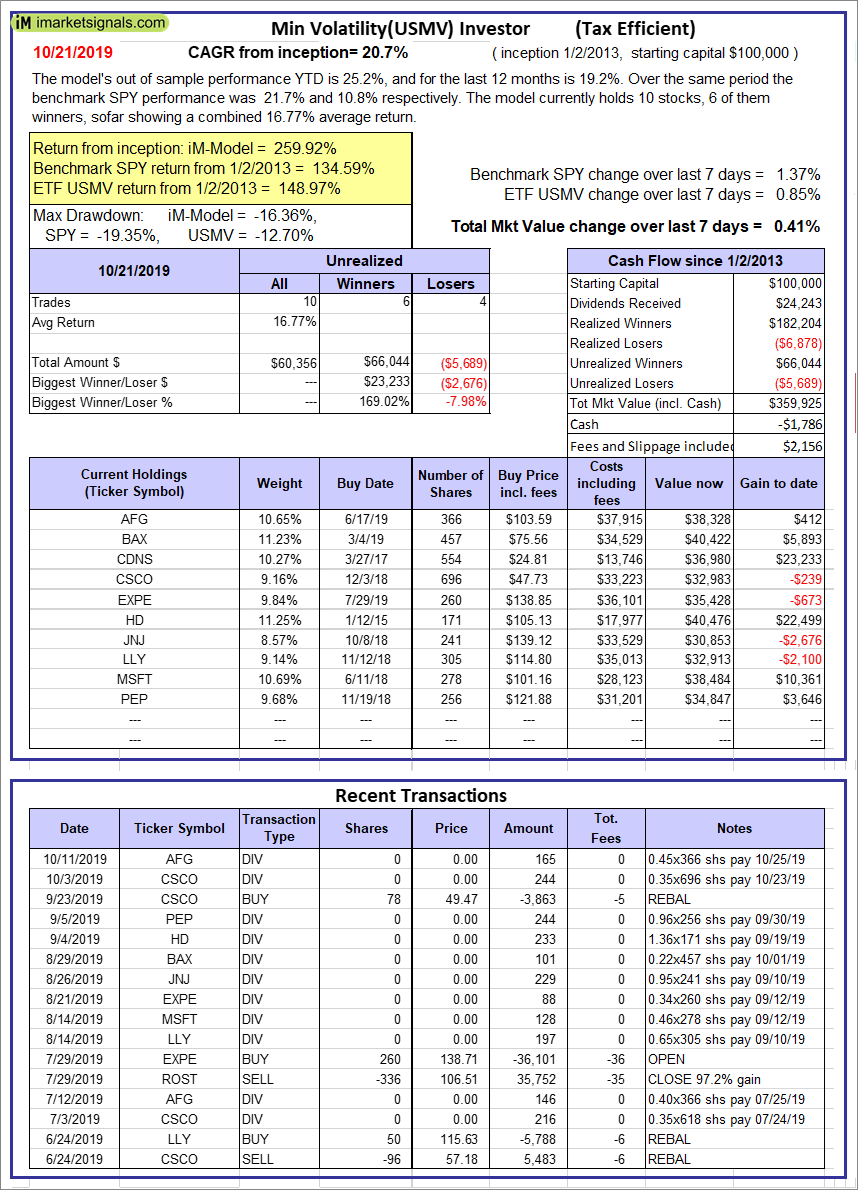 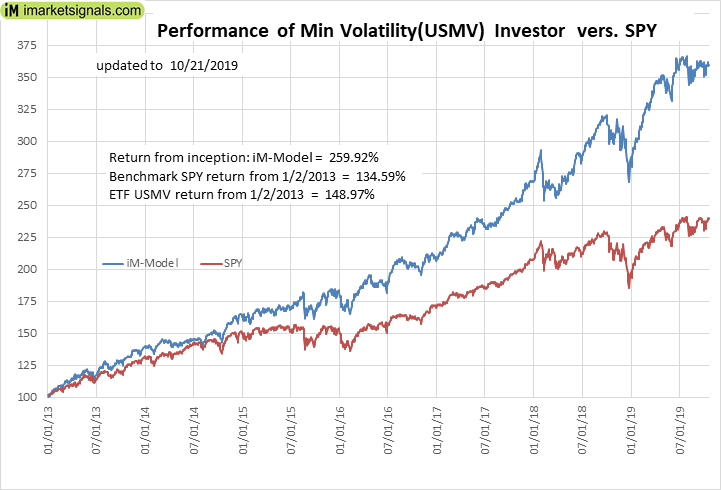 |
iM-Min Volatility(USMV) Investor (Tax Efficient): The model’s out of sample performance YTD is 25.2%, and for the last 12 months is 19.2%. Over the same period the benchmark SPY performance was 21.7% and 10.8% respectively. Since inception, on 1/3/2013, the model gained 259.92% while the benchmark SPY gained 134.59% and the ETF USMV gained 148.97% over the same period. Over the previous week the market value of iM-Best12(USMV)Q1 gained 0.41% at a time when SPY gained 1.37%. A starting capital of $100,000 at inception on 1/3/2013 would have grown to $359,925 which includes -$1,786 cash and excludes $2,156 spent on fees and slippage. |
|
|
iM Min Volatility (USMV) Investor: The model’s out of sample performance YTD is 25.2%, and for the last 12 months is 19.2%. Over the same period the benchmark SPY performance was 21.7% and 10.8% respectively. Since inception, on 1/3/2013, the model gained 259.92% while the benchmark SPY gained 134.59% and the ETF USMV gained 148.97% over the same period. Over the previous week the market value of iM Min Volatility (USMV) Investor gained 0.41% at a time when SPY gained 1.37%. A starting capital of $100,000 at inception on 1/3/2013 would have grown to $359,925 which includes -$1,786 cash and excludes $2,156 spent on fees and slippage. |
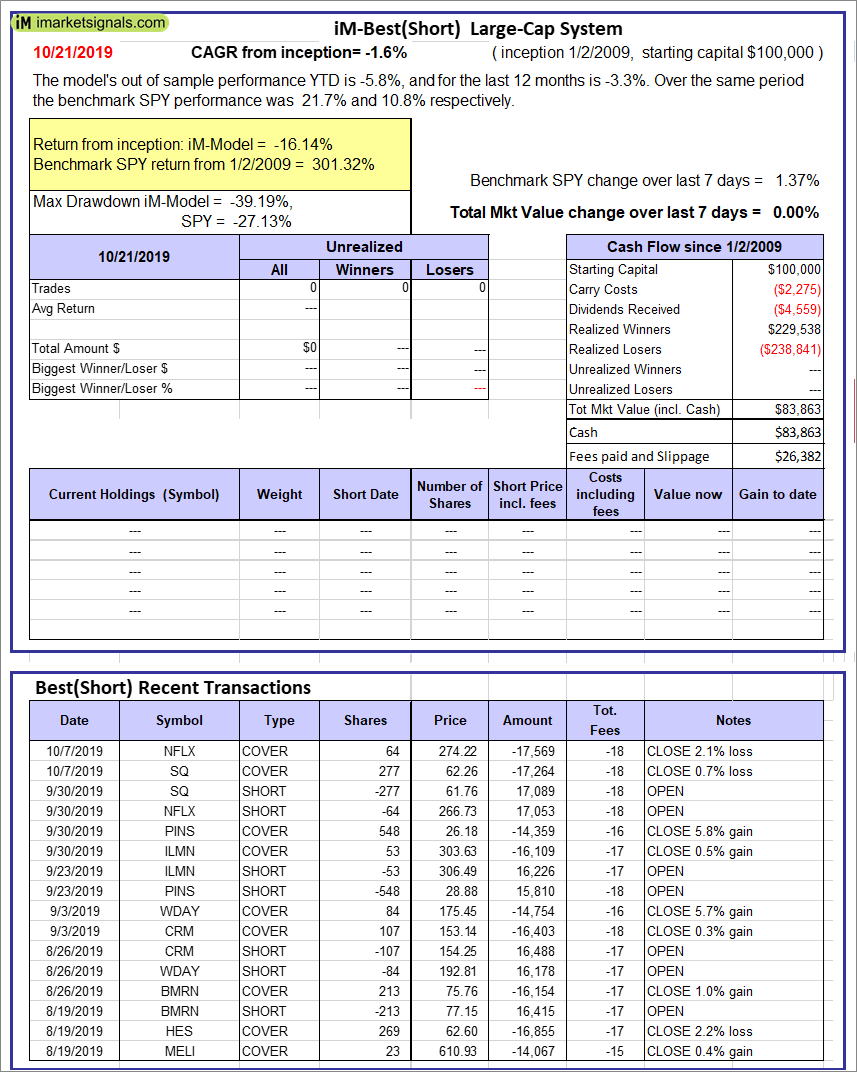 |
iM-Best(Short): The model’s out of sample performance YTD is -5.8%, and for the last 12 months is -3.3%. Over the same period the benchmark SPY performance was 21.7% and 10.8% respectively. Over the previous week the market value of iM-Best(Short) gained 0.00% at a time when SPY gained 1.37%. Over the period 1/2/2009 to 10/21/2019 the starting capital of $100,000 would have grown to $83,863 which includes $83,863 cash and excludes $26,382 spent on fees and slippage. |
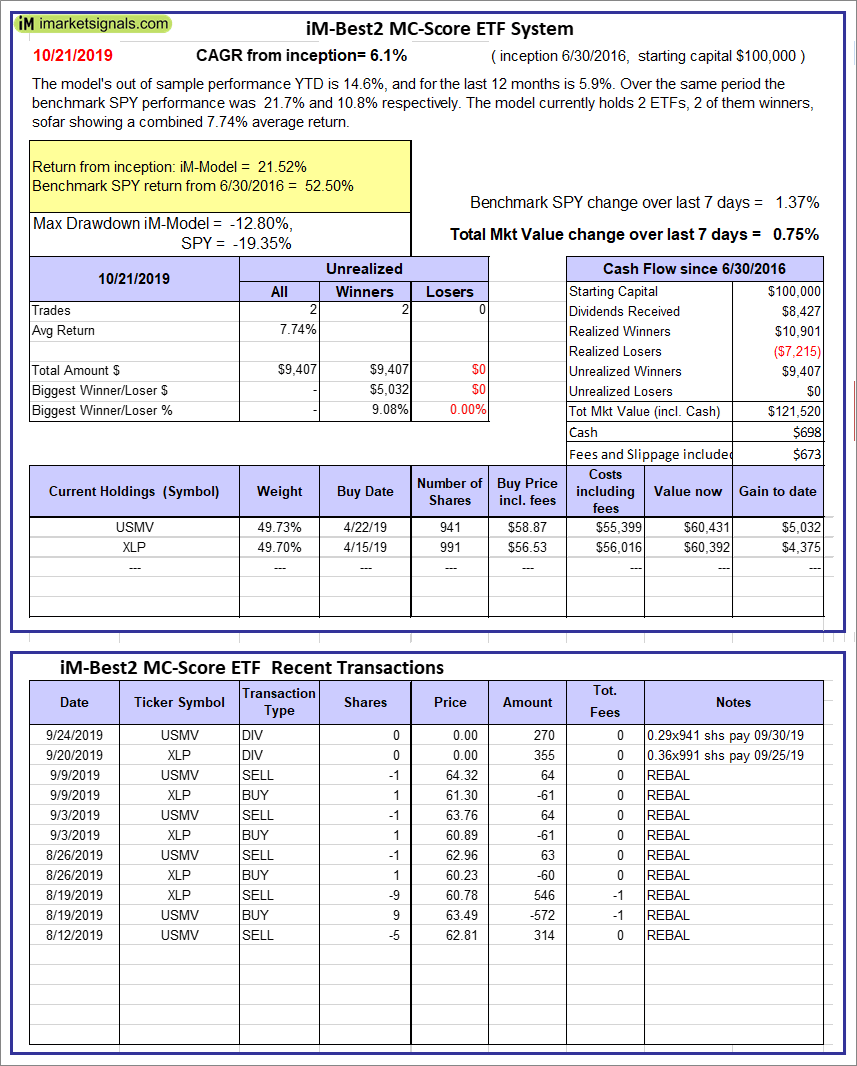 |
iM-Best2 MC-Score ETF System: The model’s out of sample performance YTD is 14.6%, and for the last 12 months is 5.9%. Over the same period the benchmark SPY performance was 21.7% and 10.8% respectively. Over the previous week the market value of the iM-Best2 MC-Score ETF System gained 0.75% at a time when SPY gained 1.37%. A starting capital of $100,000 at inception on 6/30/2016 would have grown to $121,520 which includes $698 cash and excludes $673 spent on fees and slippage. |
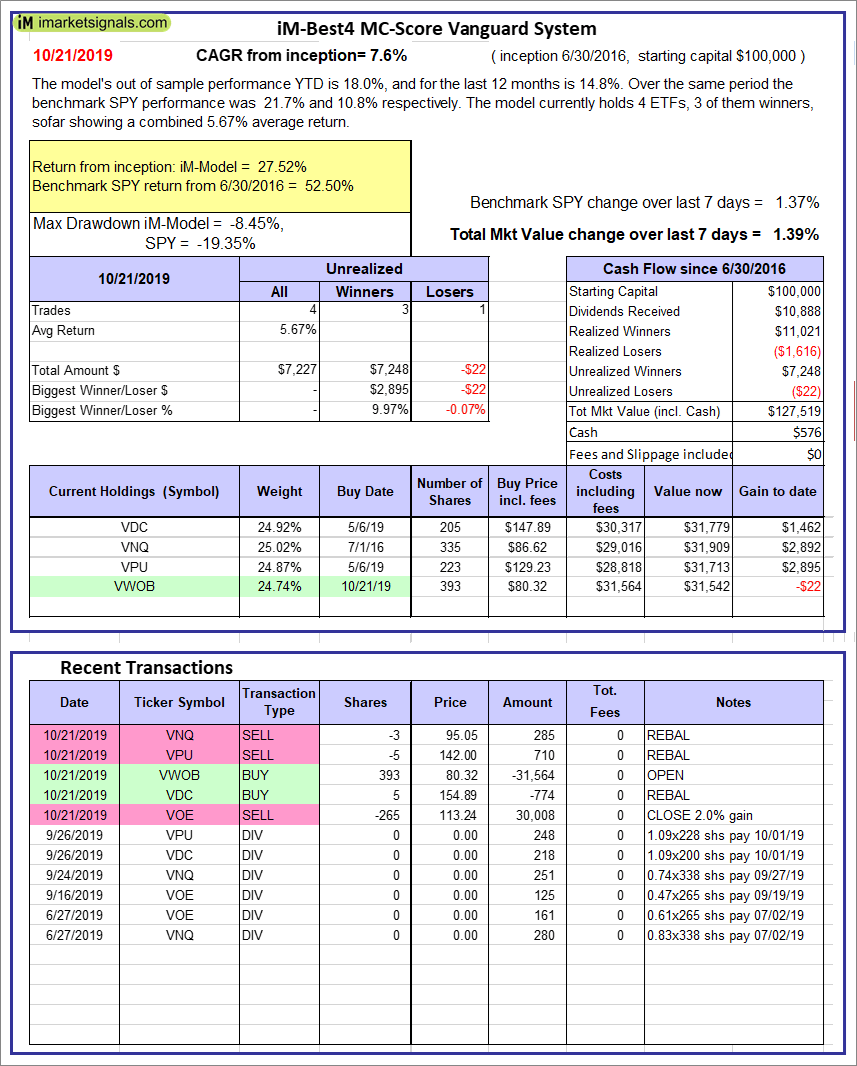 |
iM-Best4 MC-Score Vanguard System: The model’s out of sample performance YTD is 18.0%, and for the last 12 months is 14.8%. Over the same period the benchmark SPY performance was 21.7% and 10.8% respectively. Over the previous week the market value of the iM-Best4 MC-Score Vanguard System gained 1.39% at a time when SPY gained 1.37%. A starting capital of $100,000 at inception on 6/30/2016 would have grown to $127,519 which includes $576 cash and excludes $00 spent on fees and slippage. |
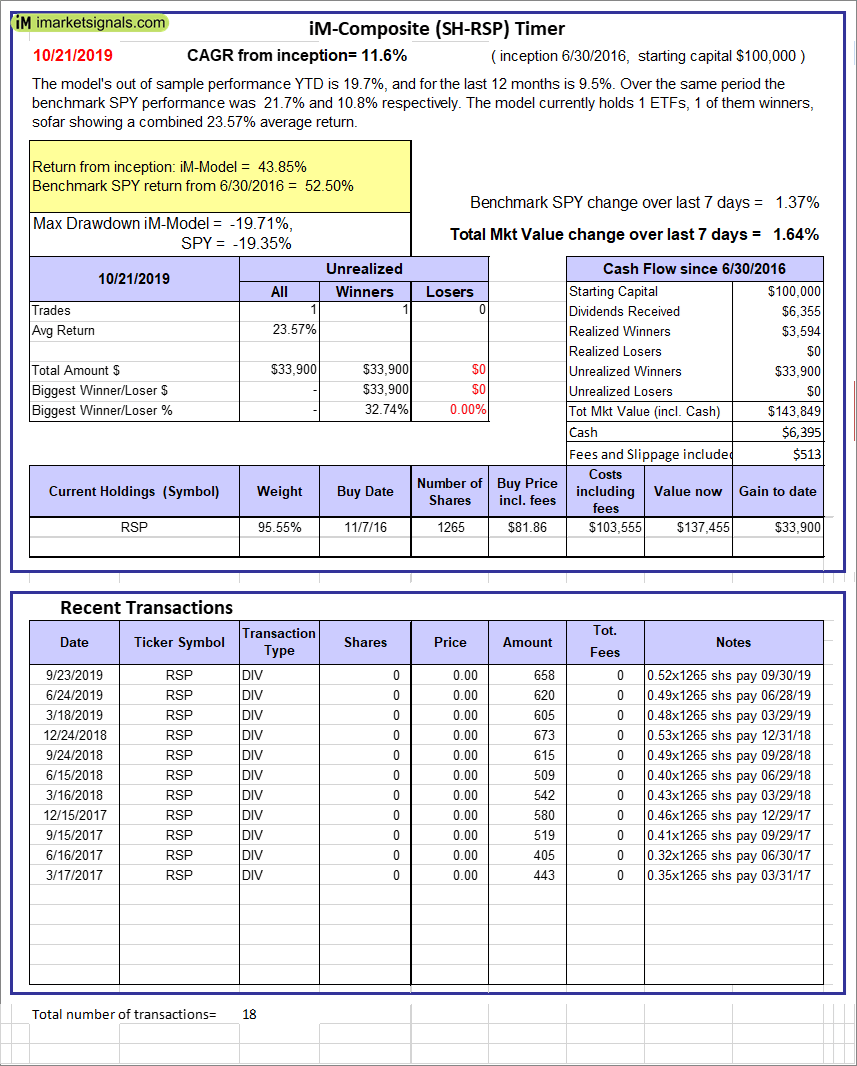 |
iM-Composite (SH-RSP) Timer: The model’s out of sample performance YTD is 19.7%, and for the last 12 months is 9.5%. Over the same period the benchmark SPY performance was 21.7% and 10.8% respectively. Over the previous week the market value of the iM-Composite (SH-RSP) Timer gained 1.64% at a time when SPY gained 1.37%. A starting capital of $100,000 at inception on 6/30/2016 would have grown to $143,849 which includes $6,395 cash and excludes $513 spent on fees and slippage. |
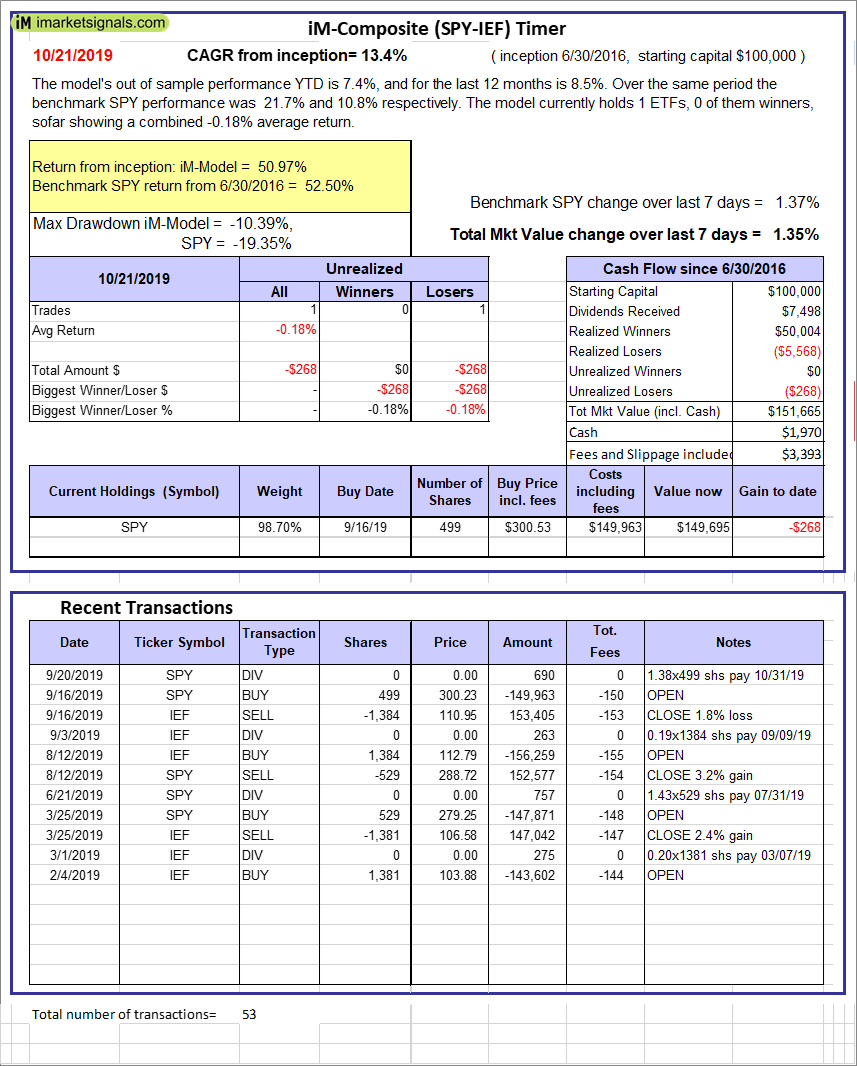 |
iM-Composite (SPY-IEF) Timer: The model’s out of sample performance YTD is 7.4%, and for the last 12 months is 8.5%. Over the same period the benchmark SPY performance was 21.7% and 10.8% respectively. Over the previous week the market value of the iM-Composite (SPY-IEF) Timer gained 1.35% at a time when SPY gained 1.37%. A starting capital of $100,000 at inception on 6/30/2016 would have grown to $151,665 which includes $1,970 cash and excludes $3,393 spent on fees and slippage. |
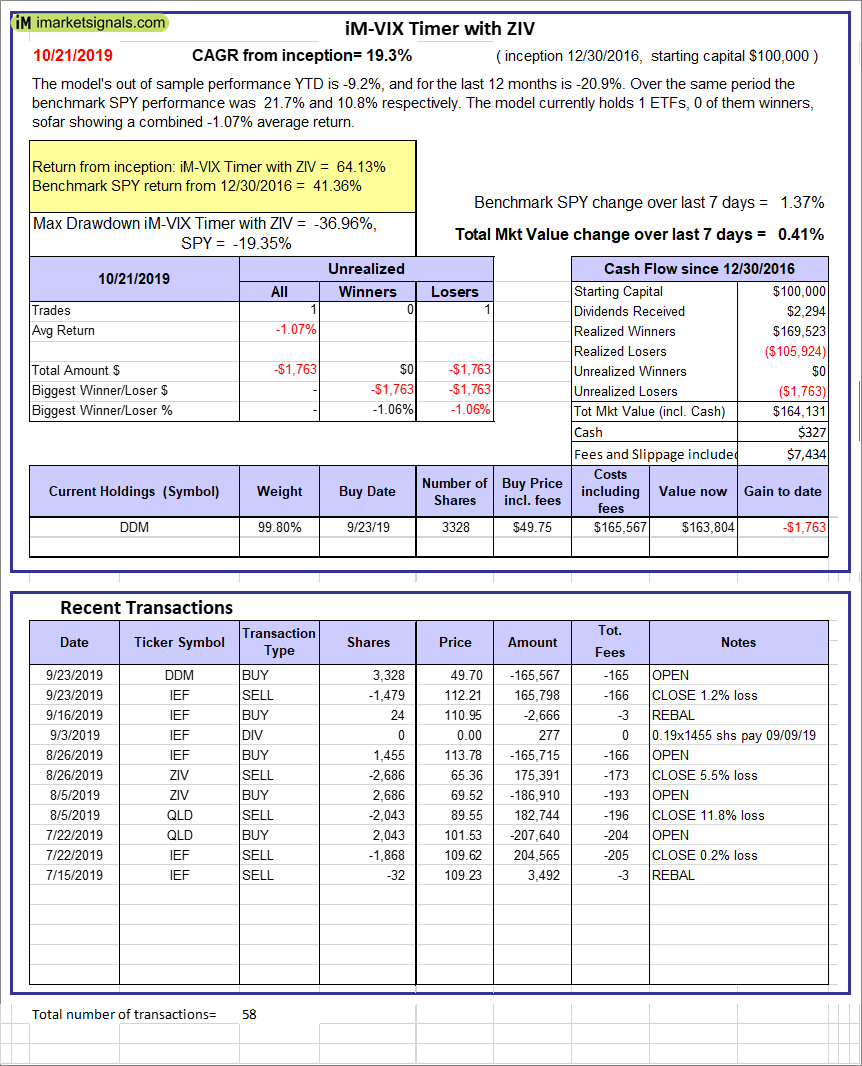 |
iM-VIX Timer with ZIV: The model’s out of sample performance YTD is -9.2%, and for the last 12 months is -20.9%. Over the same period the benchmark SPY performance was 21.7% and 10.8% respectively. Over the previous week the market value of the iM-VIX Timer with ZIV gained 0.41% at a time when SPY gained 1.37%. A starting capital of $100,000 at inception on 6/30/2016 would have grown to $164,131 which includes $327 cash and excludes $7,434 spent on fees and slippage. |
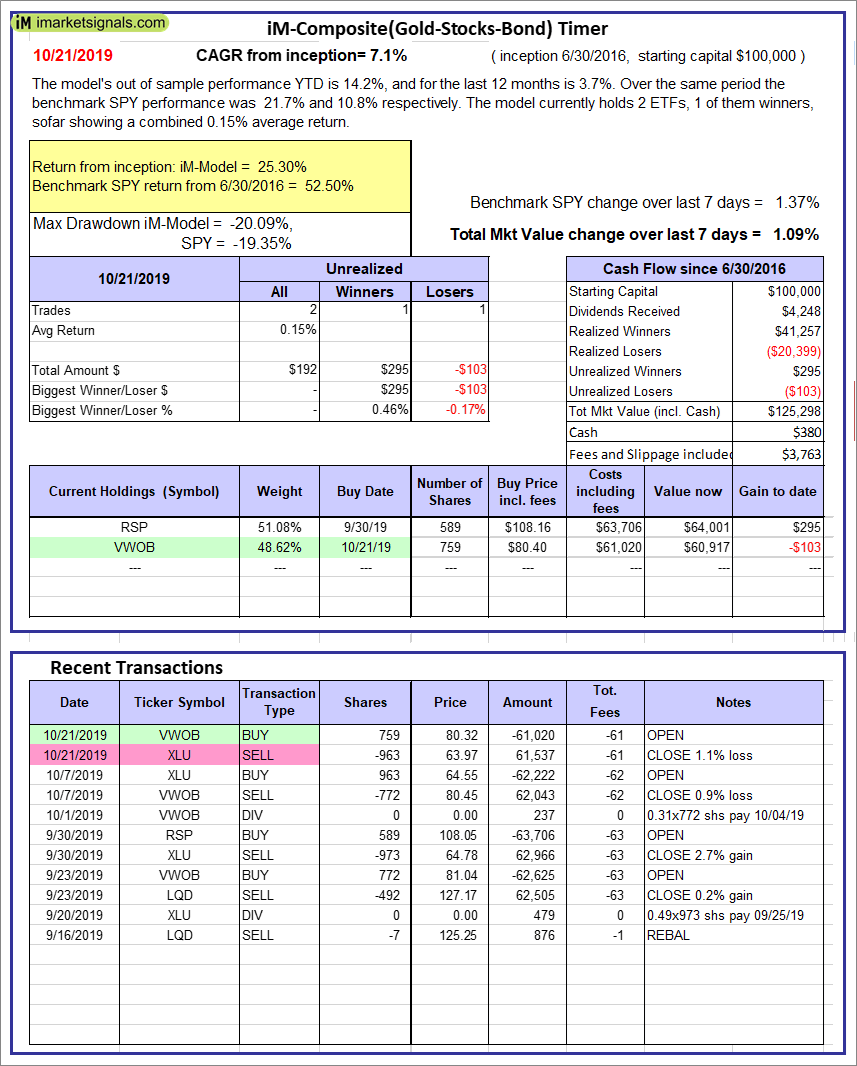 |
iM-Composite(Gold-Stocks-Bond) Timer: The model’s out of sample performance YTD is 14.2%, and for the last 12 months is 3.7%. Over the same period the benchmark SPY performance was 21.7% and 10.8% respectively. Over the previous week the market value of the iM-Composite(Gold-Stocks-Bond) Timer gained 1.09% at a time when SPY gained 1.37%. A starting capital of $100,000 at inception on 6/30/2016 would have grown to $125,298 which includes $380 cash and excludes $3,763 spent on fees and slippage. |
 |
iM-Low Turnover Composite Timer Combo: The model’s out of sample performance YTD is 12.7%, and for the last 12 months is 4.9%. Over the same period the benchmark SPY performance was 21.7% and 10.8% respectively. Over the previous week the market value of the iM-Low Turnover Composite Timer Combo gained 1.09% at a time when SPY gained 1.37%. A starting capital of $100,000 at inception on 3/24/27 would have grown to $108,593 which includes $163 cash and excludes $1,320 spent on fees and slippage. |
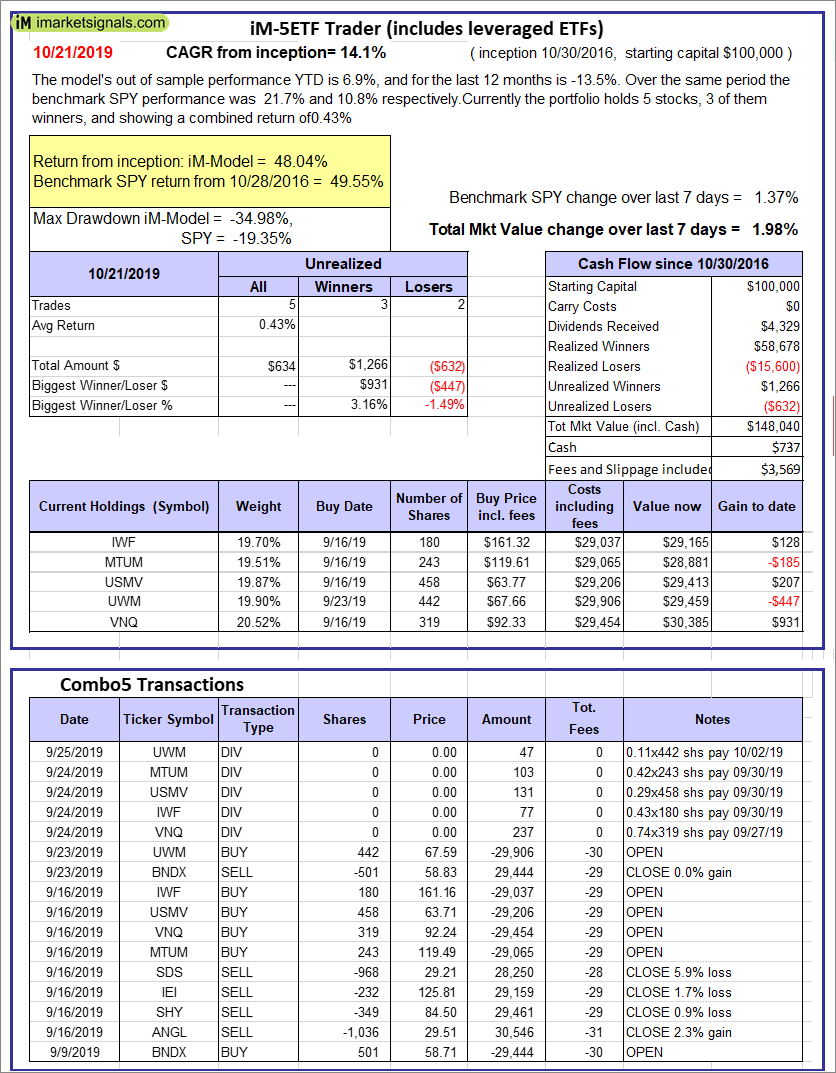 |
iM-5ETF Trader (includes leveraged ETFs): The model’s out of sample performance YTD is 6.9%, and for the last 12 months is -13.5%. Over the same period the benchmark SPY performance was 21.7% and 10.8% respectively. Over the previous week the market value of the iM-5ETF Trader (includes leveraged ETFs) gained 1.98% at a time when SPY gained 1.37%. A starting capital of $100,000 at inception on 10/30/2016 would have grown to $148,040 which includes $737 cash and excludes $3,569 spent on fees and slippage. |
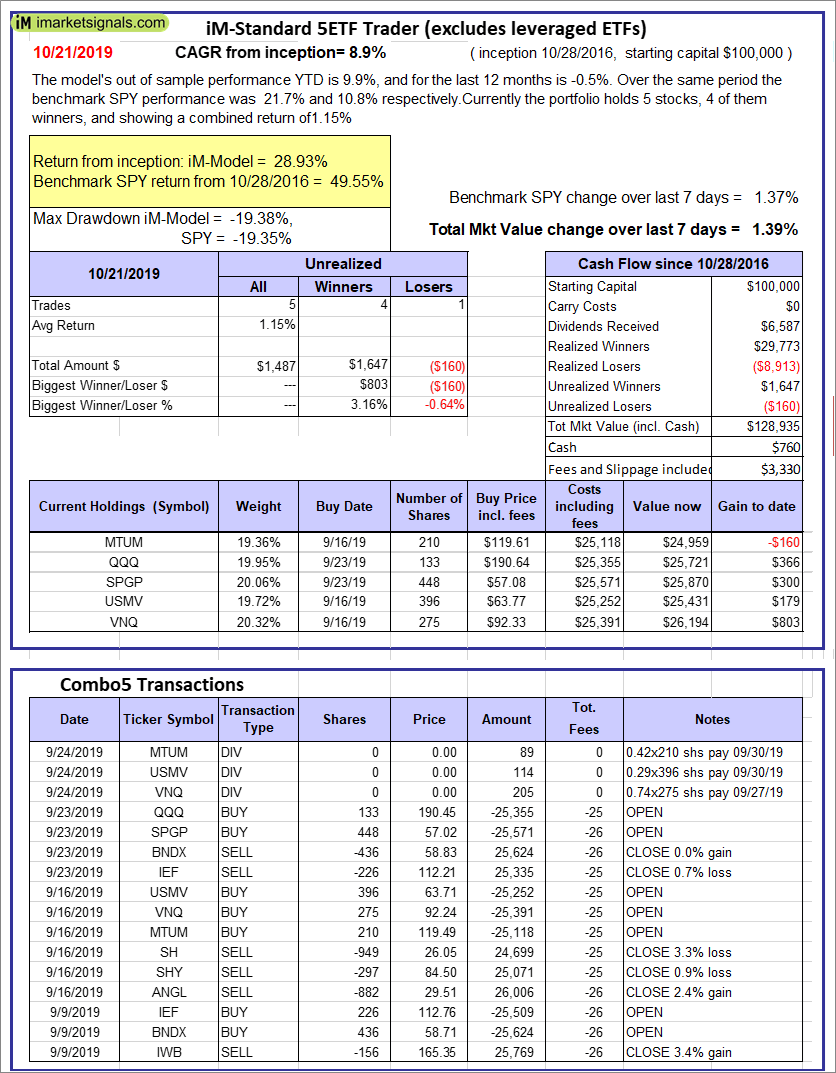 |
iM-Standard 5ETF Trader (excludes leveraged ETFs): The model’s out of sample performance YTD is 9.9%, and for the last 12 months is -0.5%. Over the same period the benchmark SPY performance was 21.7% and 10.8% respectively. Over the previous week the market value of the iM-Standard 5ETF Trader (excludes leveraged ETFs) gained 1.39% at a time when SPY gained 1.37%. A starting capital of $100,000 at inception on 10/30/2016 would have grown to $128,935 which includes $760 cash and excludes $3,330 spent on fees and slippage. |
iM-Best Reports – 10/21/2019
Posted in pmp SPY-SH
Leave a Reply
You must be logged in to post a comment.