
  |
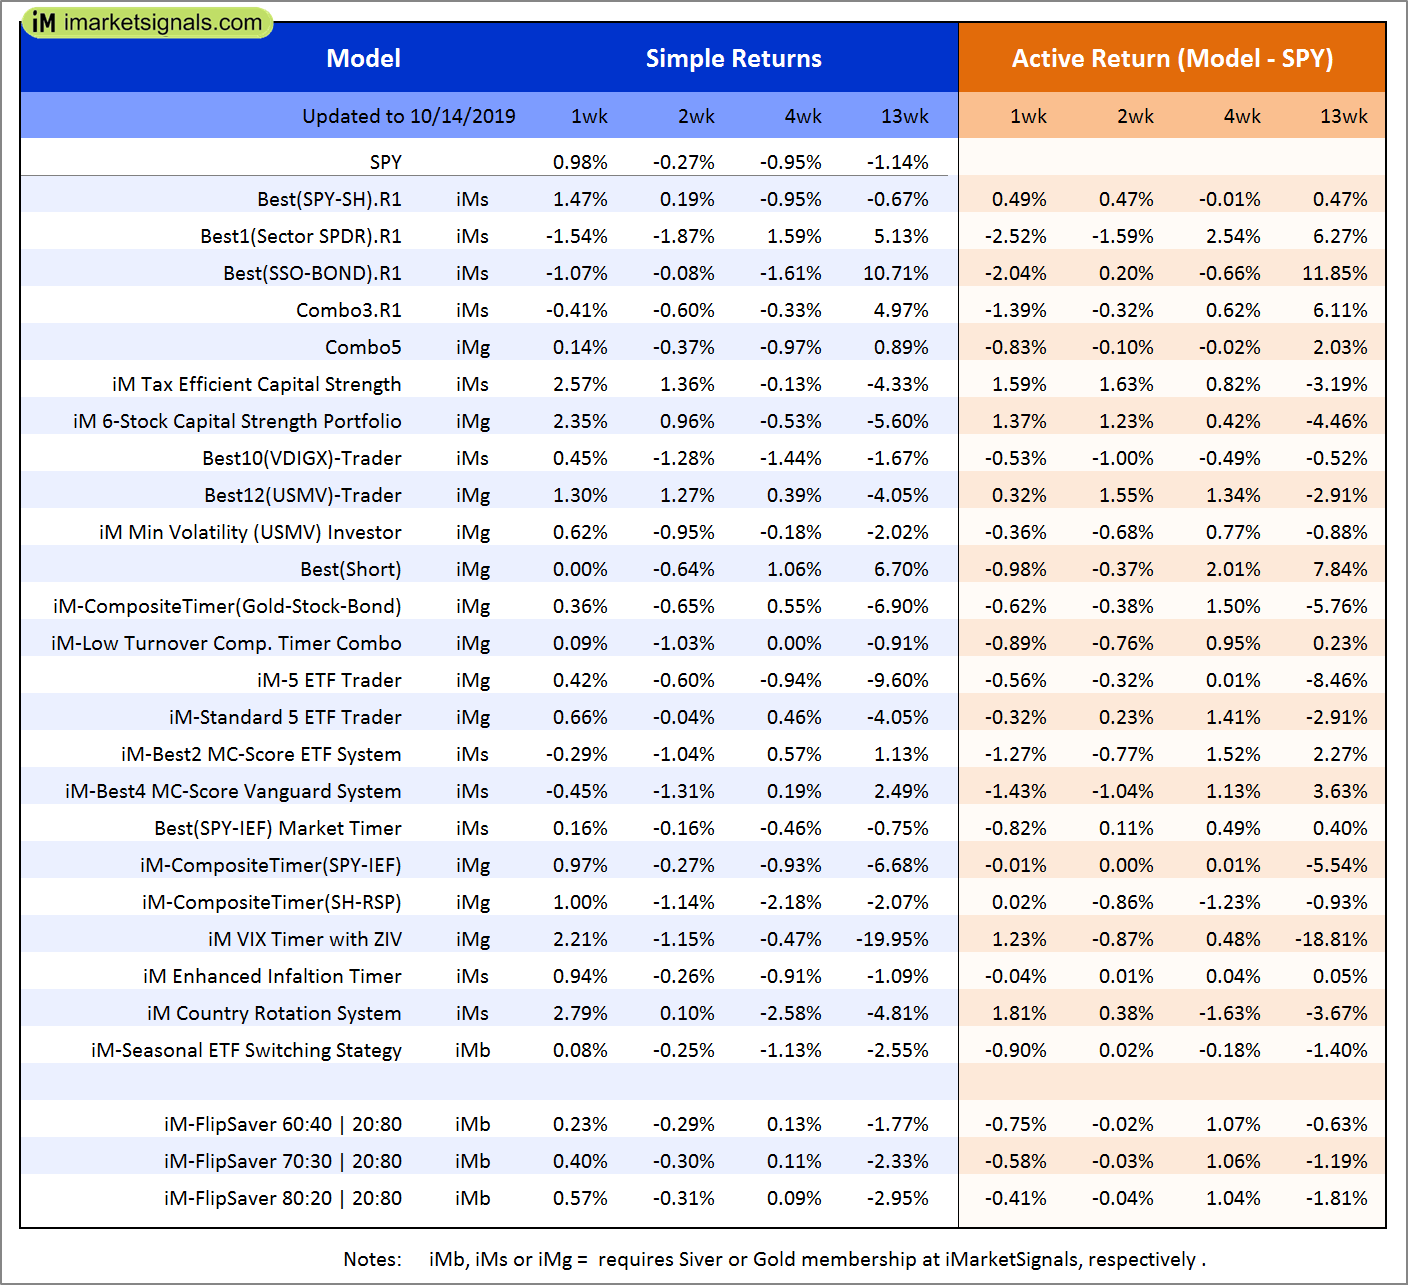
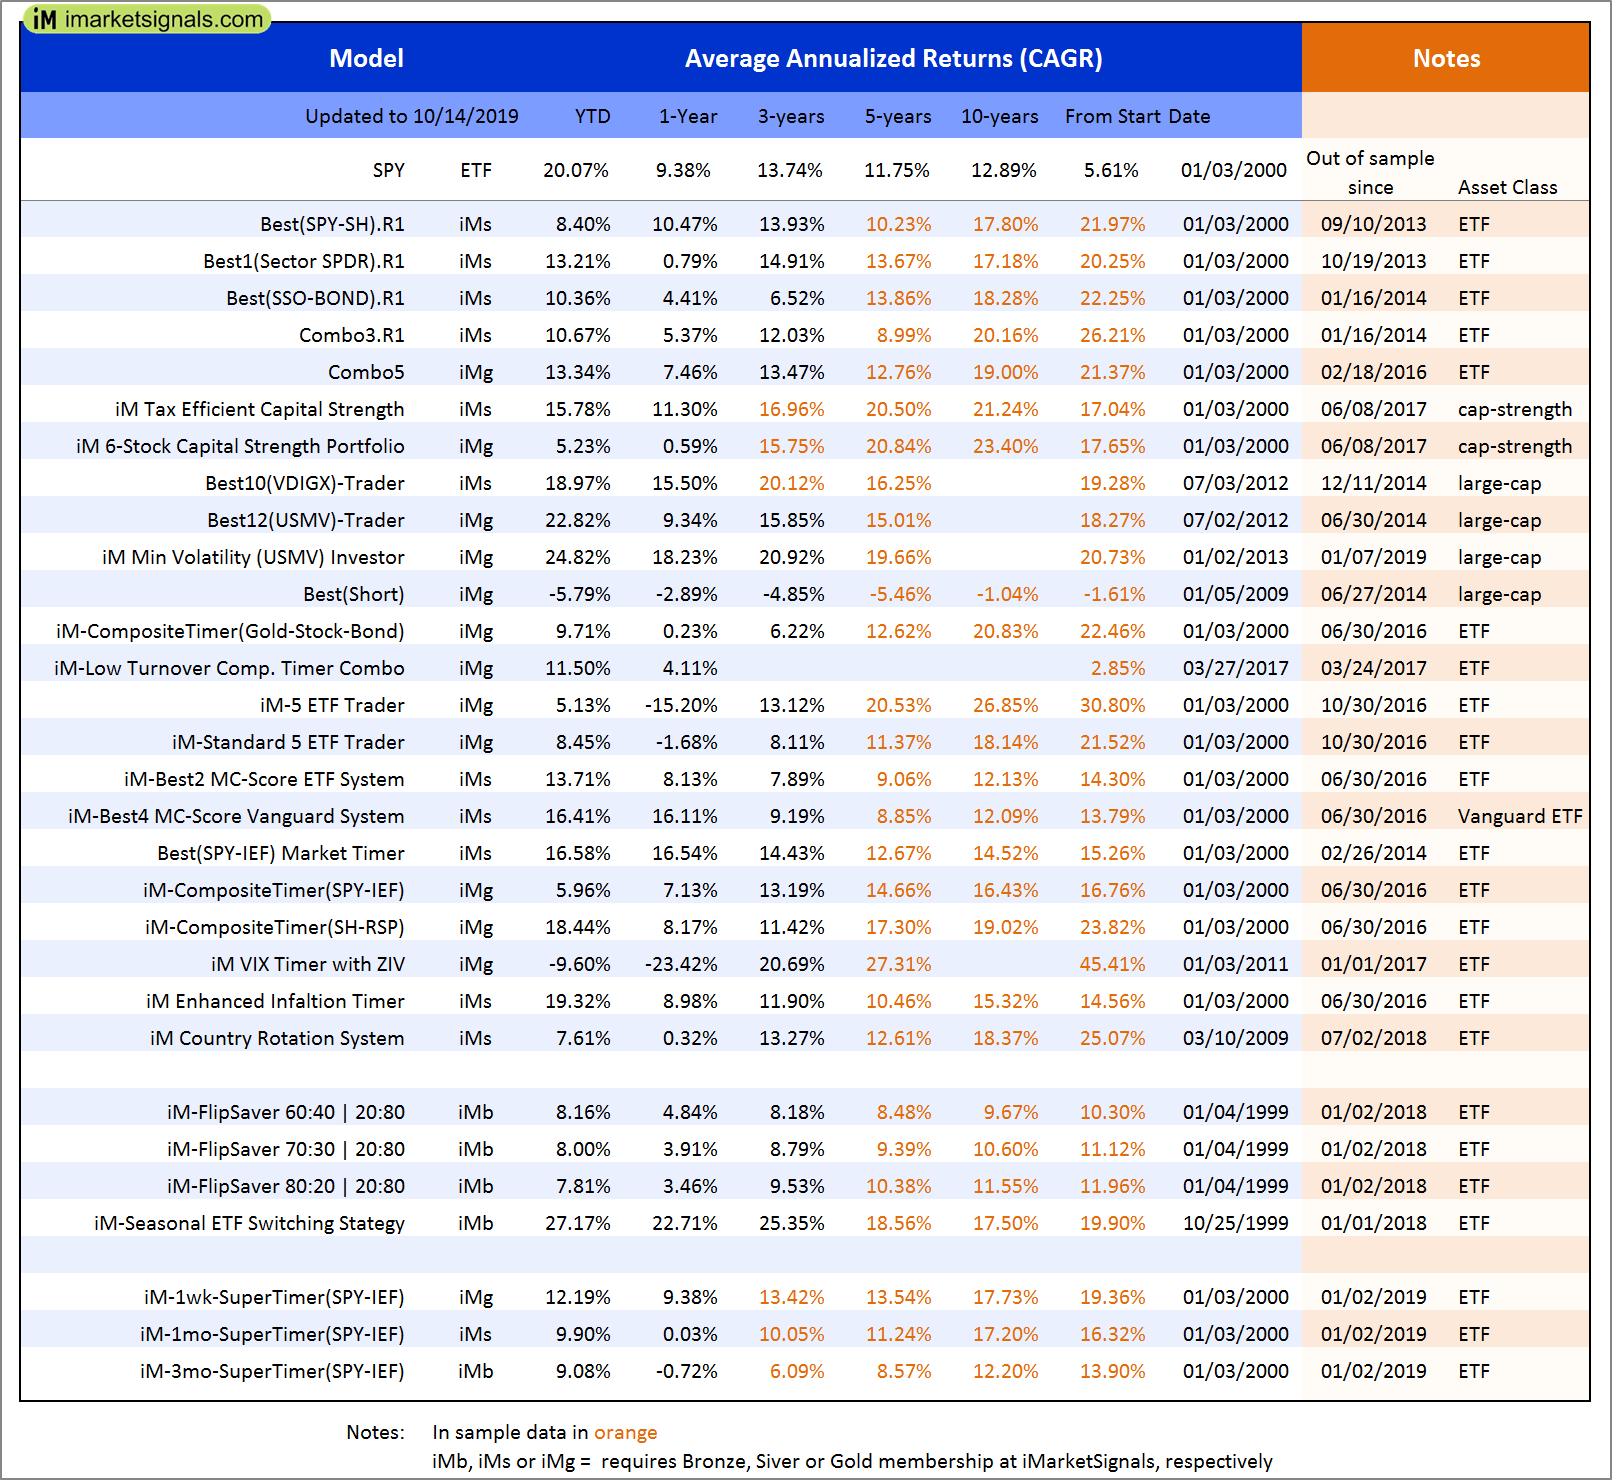
Out of sample performance summary of our models for the past 1, 2, 4 and 13 week periods. The active active return indicates how the models over- or underperformed the benchmark ETF SPY. Also the YTD, and the 1-, 3-, 5- and 10-year annualized returns are shown in the second table |
 |
iM-FlipSaver 60:40 | 20:80 – 2017: The model’s out of sample performance YTD is 9.2%, and for the last 12 months is 5.5%. Over the same period the benchmark E60B40 performance was 15.6% and 10.5% respectively. Over the previous week the market value of iM-FlipSaver 80:20 | 20:80 gained 0.23% at a time when SPY gained 0.36%. A starting capital of $100,000 at inception on 7/16/2015 would have grown to $122,230 which includes $22 cash and excludes $1,278 spent on fees and slippage. |
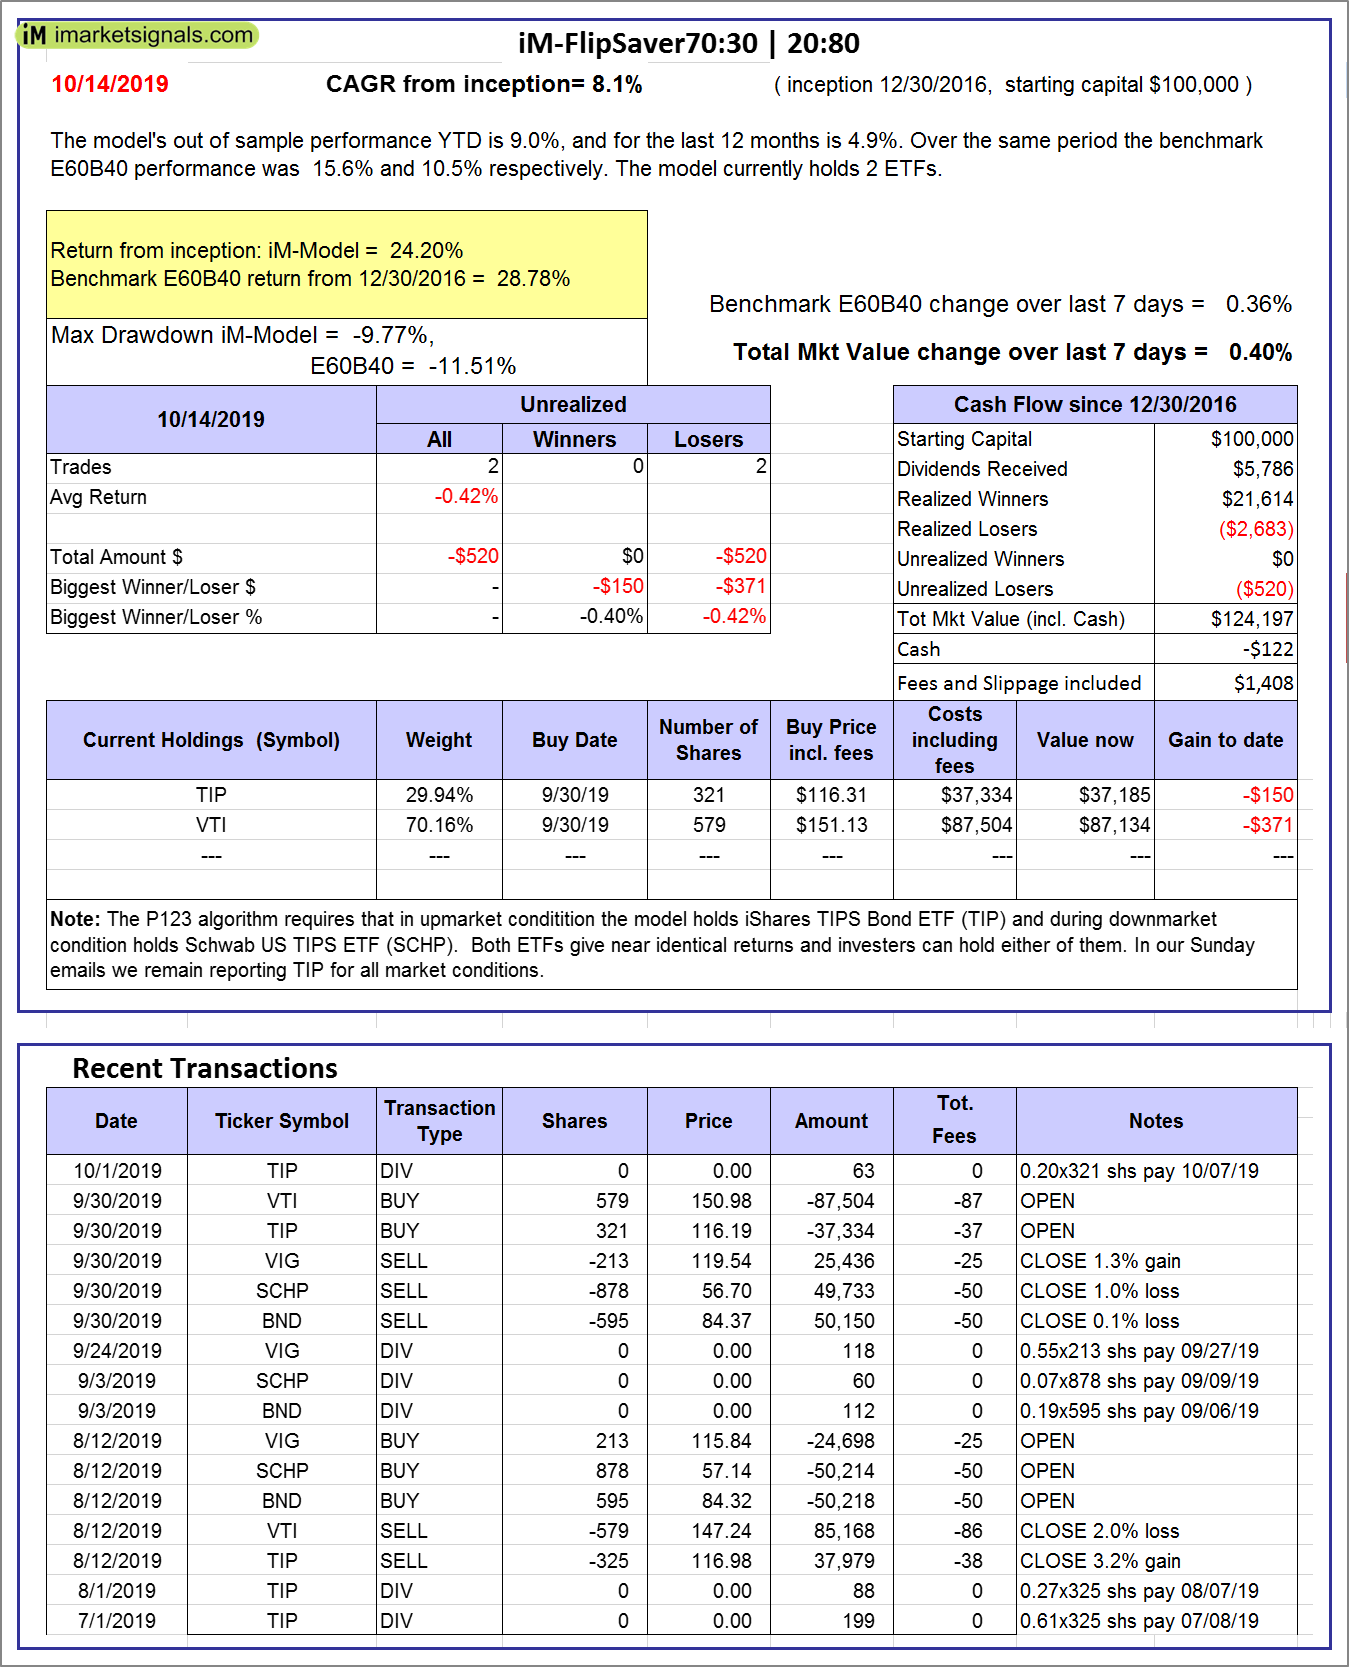 |
iM-FlipSaver 70:30 | 20:80 – 2017: The model’s out of sample performance YTD is 9.0%, and for the last 12 months is 4.9%. Over the same period the benchmark E60B40 performance was 15.6% and 10.5% respectively. Over the previous week the market value of iM-FlipSaver 70:30 | 20:80 gained 0.40% at a time when SPY gained 0.36%. A starting capital of $100,000 at inception on 7/15/2015 would have grown to $124,197 which includes -$122 cash and excludes $1,408 spent on fees and slippage. |
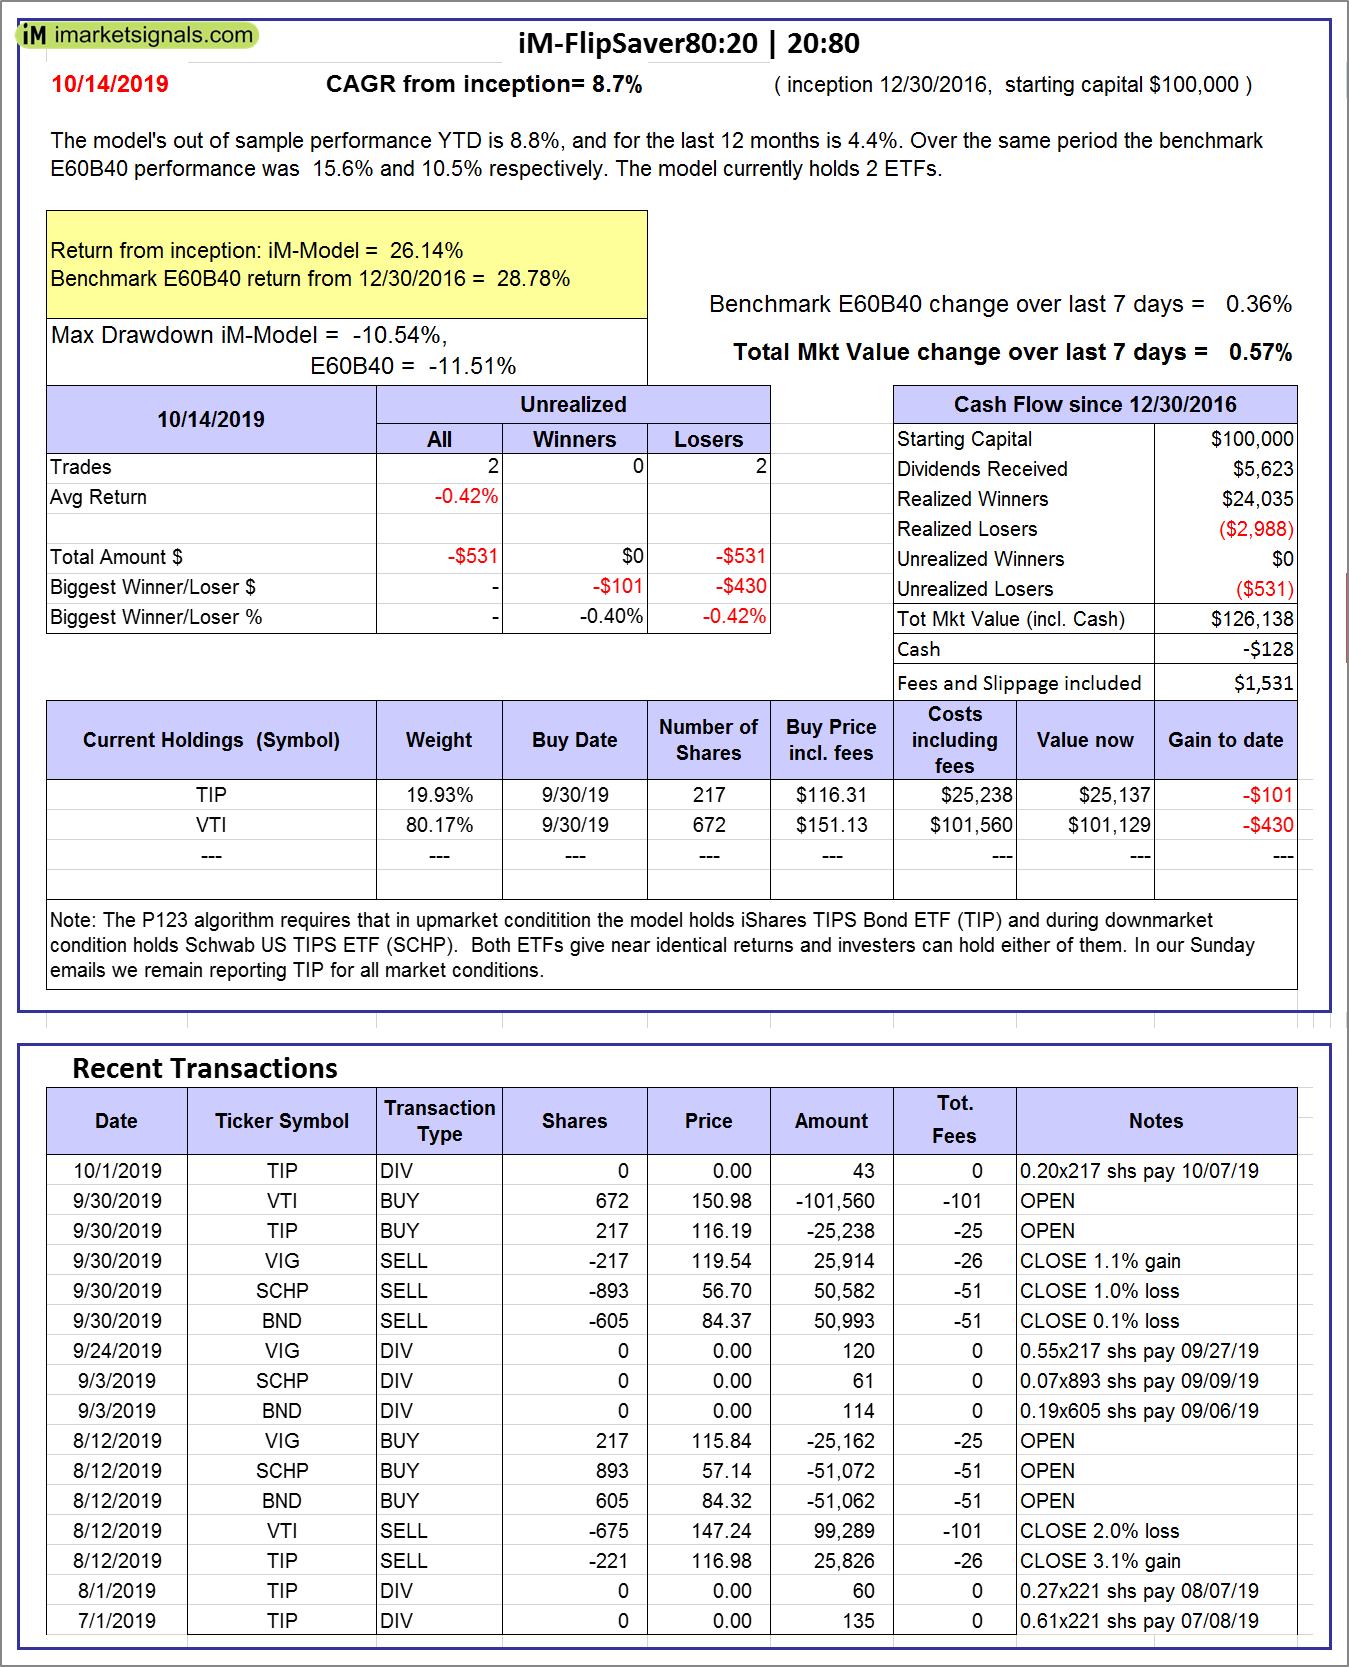 |
iM-FlipSaver 80:20 | 20:80 – 2017: The model’s out of sample performance YTD is 8.8%, and for the last 12 months is 4.4%. Over the same period the benchmark E60B40 performance was 15.6% and 10.5% respectively. Over the previous week the market value of iM-FlipSaver 80:20 | 20:80 gained 0.57% at a time when SPY gained 0.36%. A starting capital of $100,000 at inception on 1/2/2017 would have grown to $126,138 which includes -$128 cash and excludes $1,531 spent on fees and slippage. |
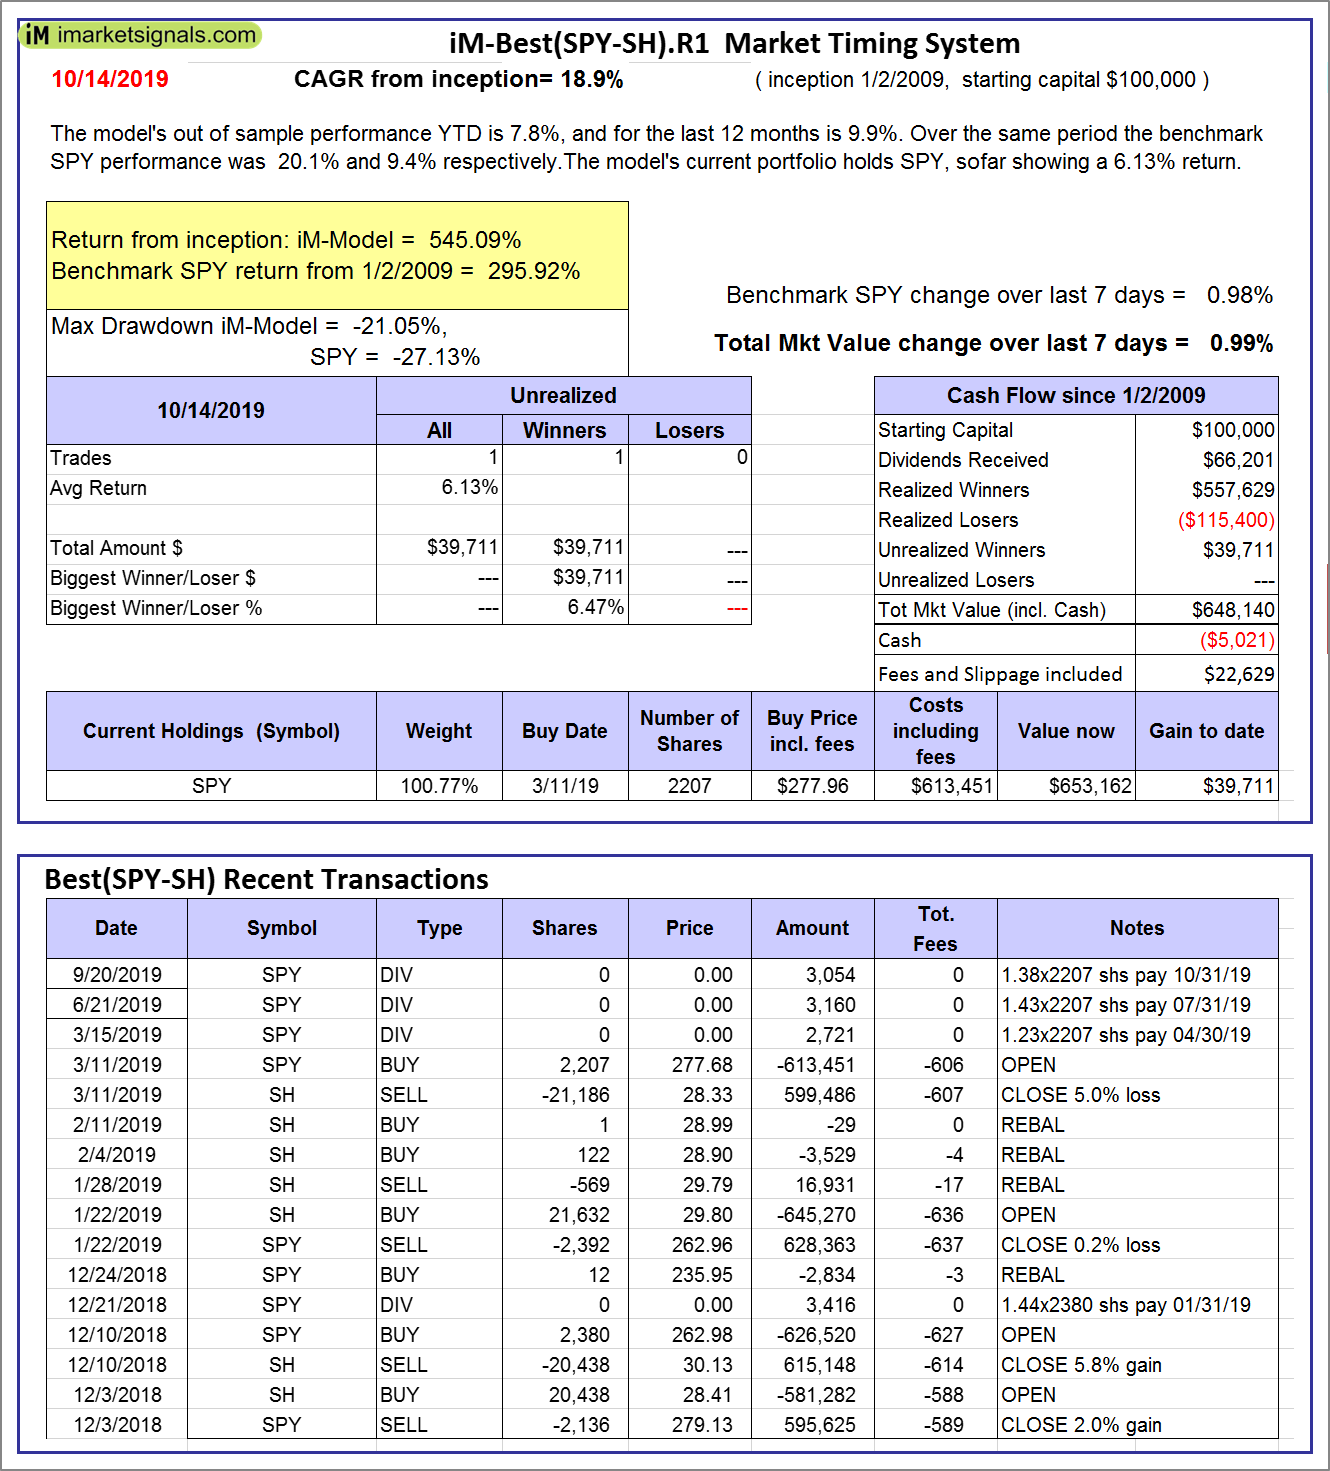 |
iM-Best(SPY-SH).R1: The model’s out of sample performance YTD is 7.8%, and for the last 12 months is 9.9%. Over the same period the benchmark SPY performance was 20.1% and 9.4% respectively. Over the previous week the market value of Best(SPY-SH) gained 0.99% at a time when SPY gained 0.98%. A starting capital of $100,000 at inception on 1/2/2009 would have grown to $648,140 which includes -$5,021 cash and excludes $22,629 spent on fees and slippage. |
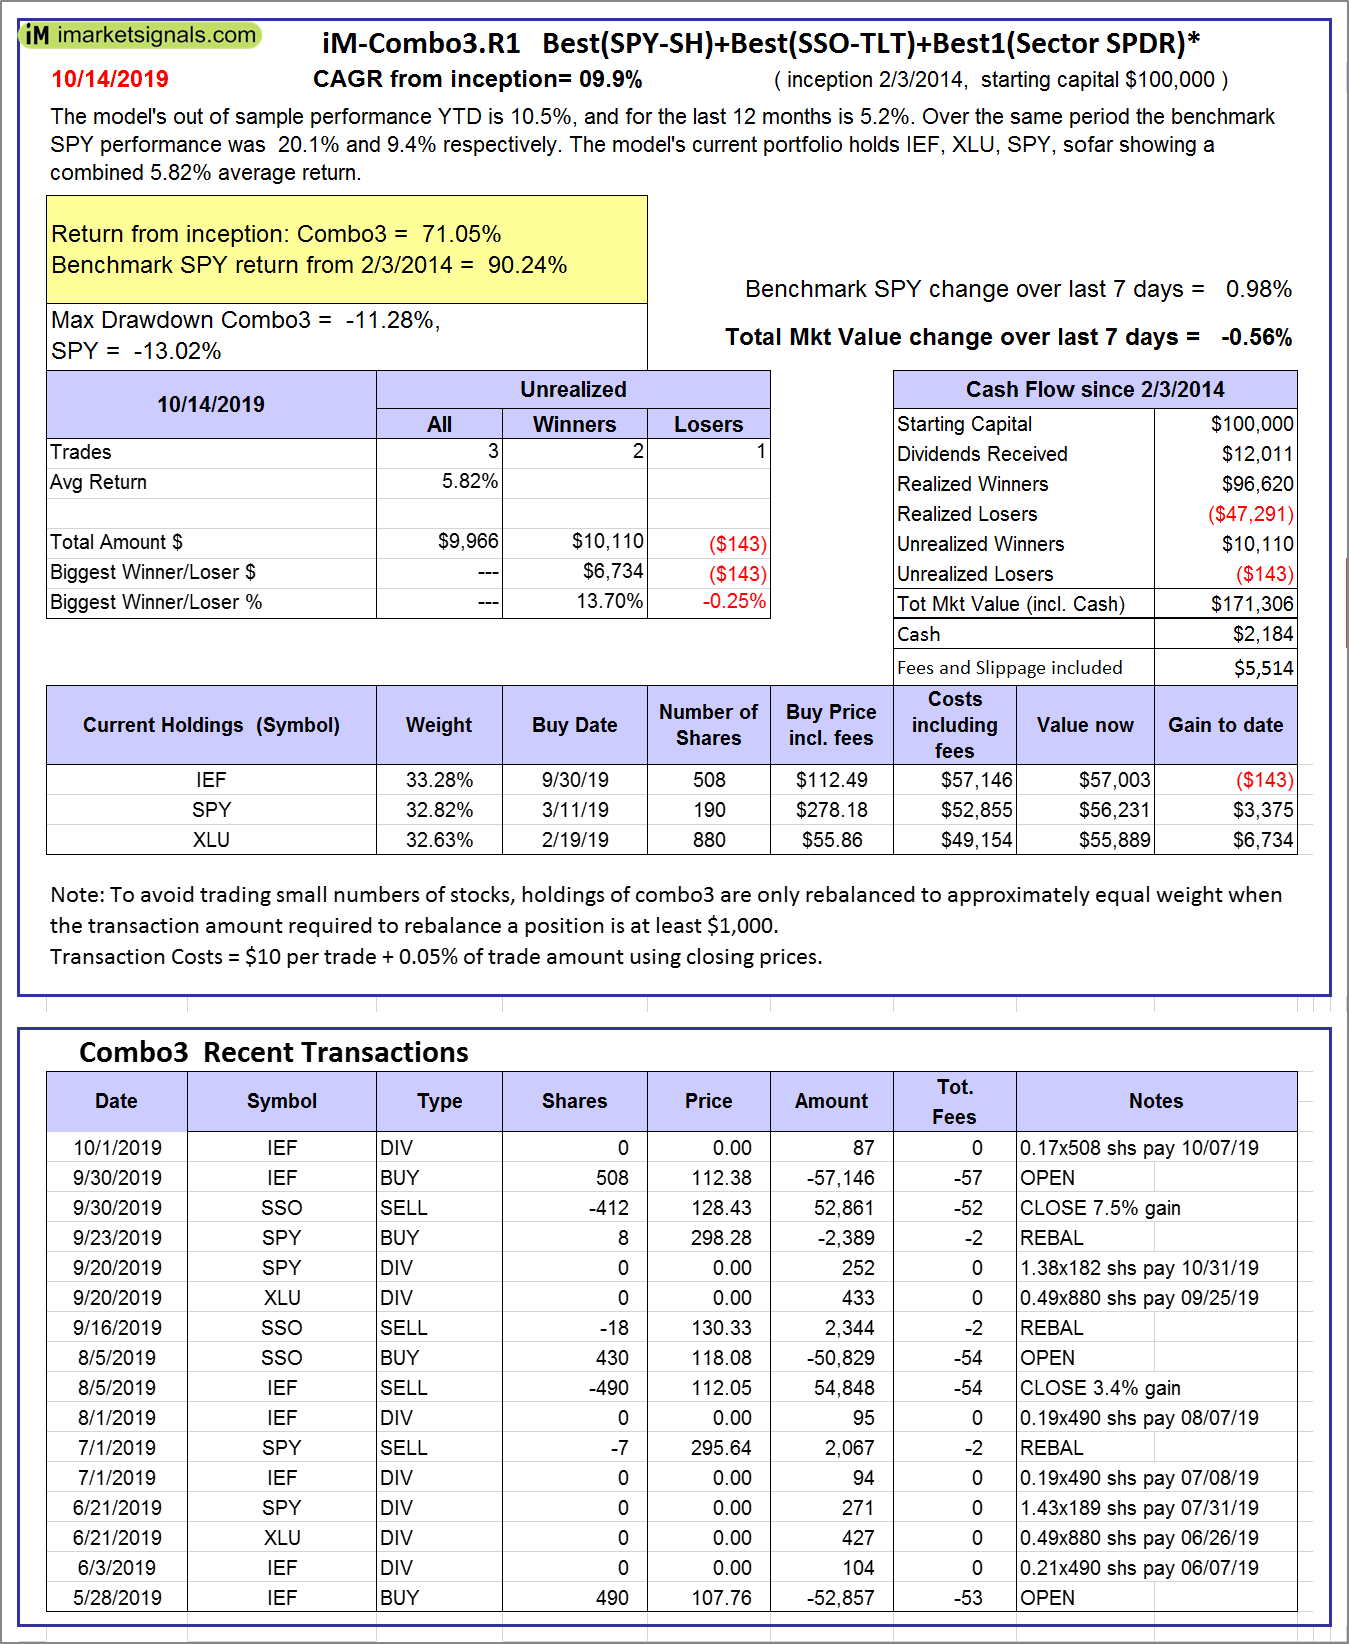 |
iM-Combo3.R1: The model’s out of sample performance YTD is 10.5%, and for the last 12 months is 5.2%. Over the same period the benchmark SPY performance was 20.1% and 9.4% respectively. Over the previous week the market value of iM-Combo3.R1 gained -0.56% at a time when SPY gained 0.98%. A starting capital of $100,000 at inception on 2/3/2014 would have grown to $171,306 which includes $2,184 cash and excludes $5,514 spent on fees and slippage. |
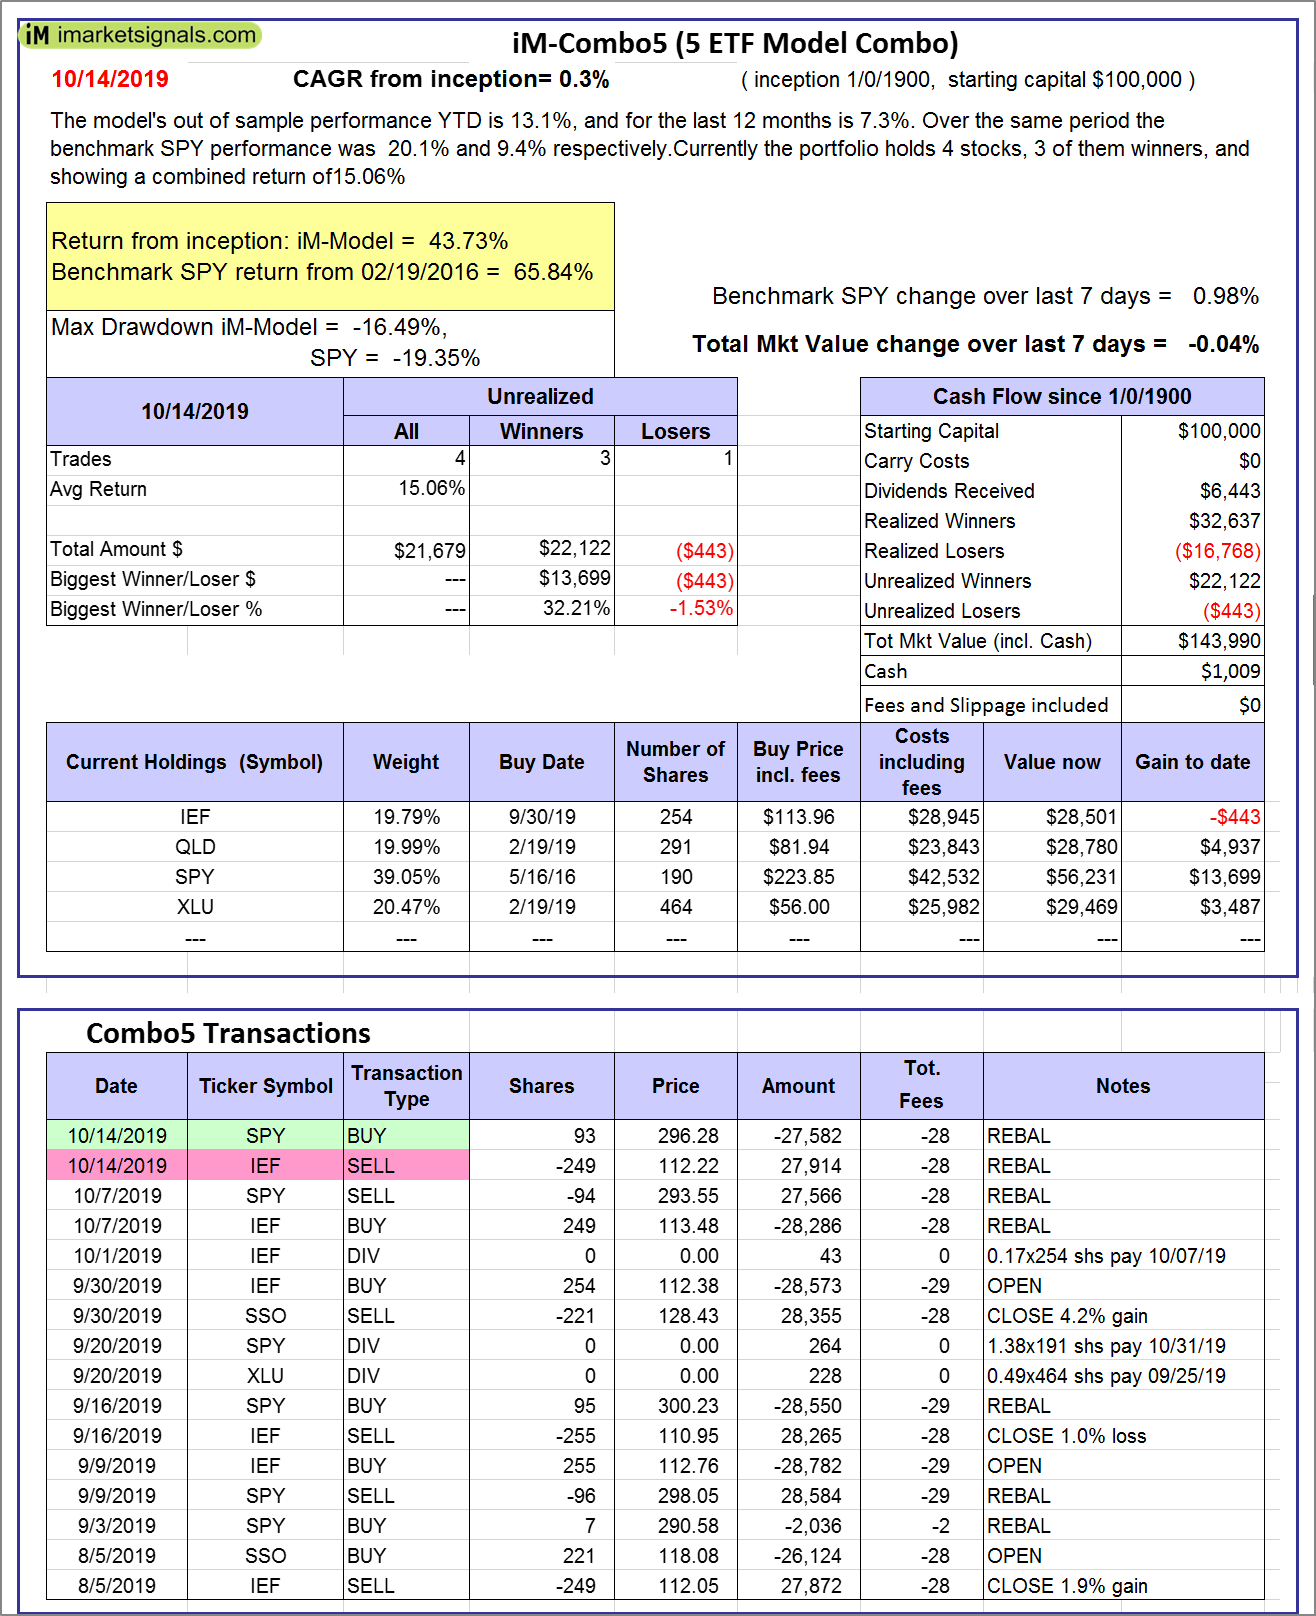 |
iM-Combo5: The model’s out of sample performance YTD is 13.1%, and for the last 12 months is 7.3%. Over the same period the benchmark SPY performance was 20.1% and 9.4% respectively. Over the previous week the market value of iM-Combo5 gained -0.04% at a time when SPY gained 0.98%. A starting capital of $100,000 at inception on 2/22/2016 would have grown to $143,990 which includes $1,009 cash and excludes $0 spent on fees and slippage. |
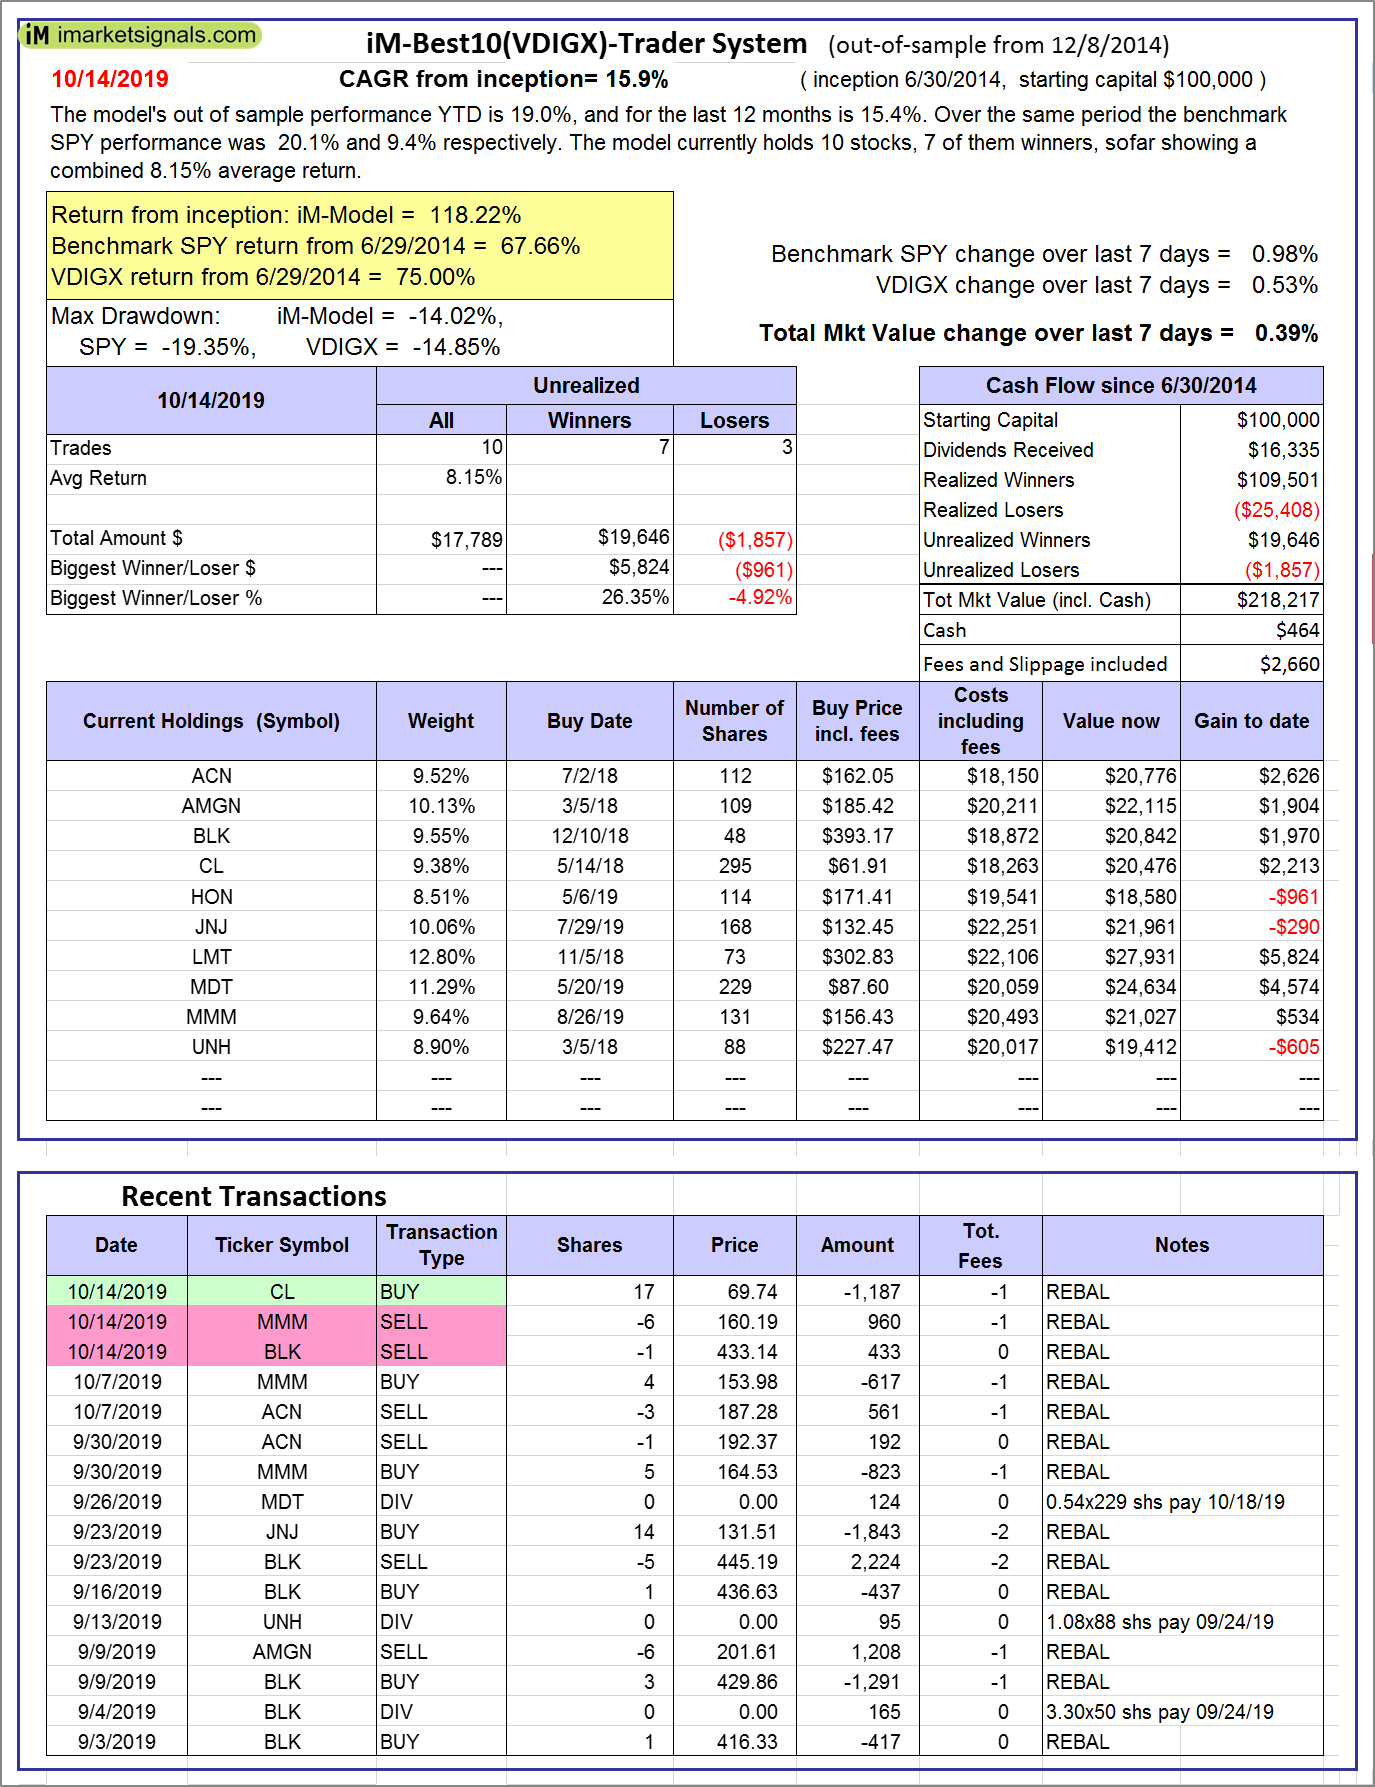 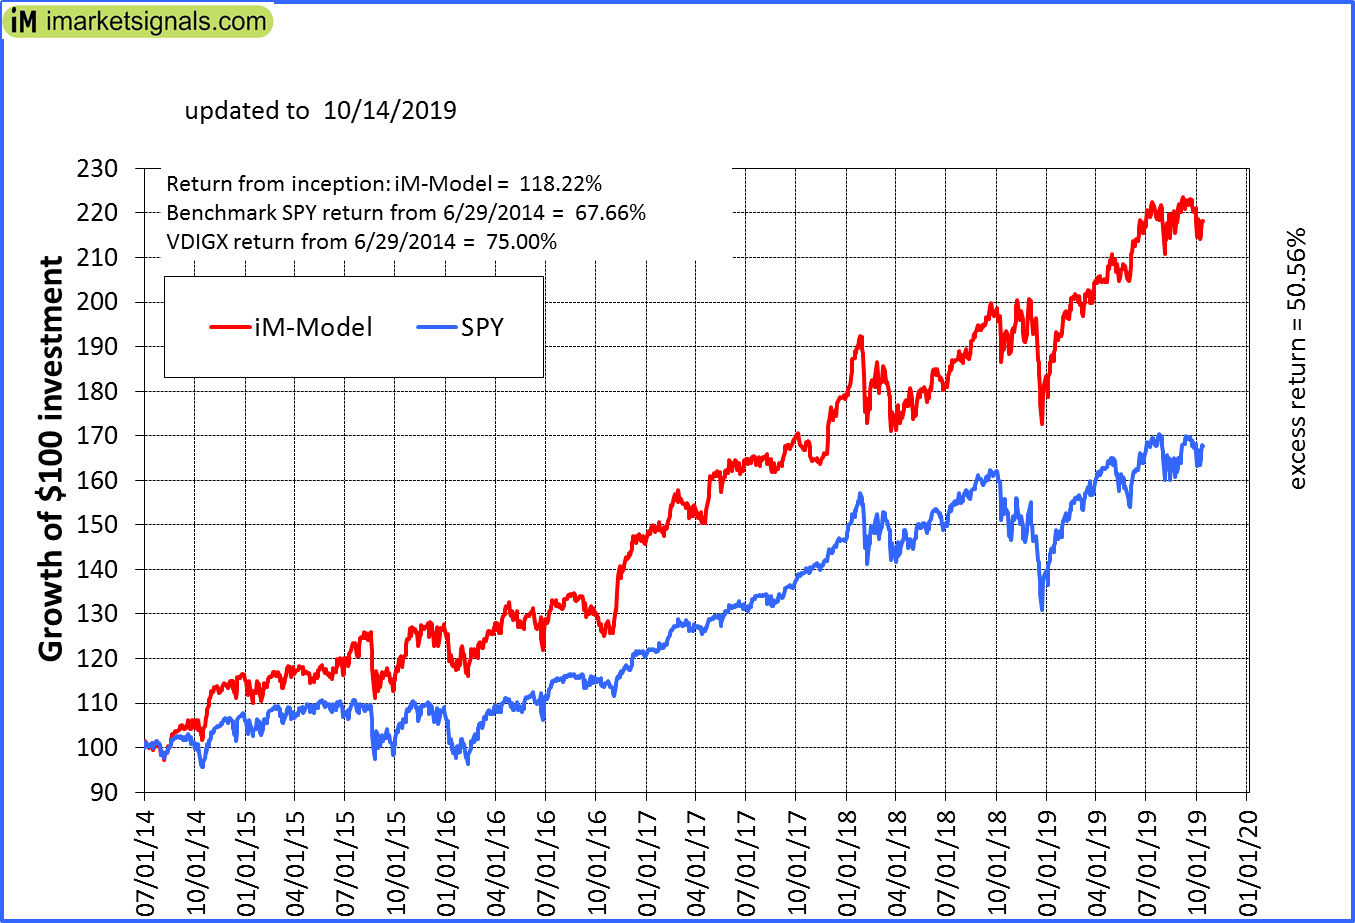 |
iM-Best10(VDIGX)-Trader: The model’s out of sample performance YTD is 19.0%, and for the last 12 months is 15.4%. Over the same period the benchmark SPY performance was 20.1% and 9.4% respectively. Since inception, on 7/1/2014, the model gained 118.22% while the benchmark SPY gained 67.66% and VDIGX gained 75.00% over the same period. Over the previous week the market value of iM-Best10(VDIGX) gained 0.39% at a time when SPY gained 0.98%. A starting capital of $100,000 at inception on 7/1/2014 would have grown to $218,217 which includes $464 cash and excludes $2,660 spent on fees and slippage. |
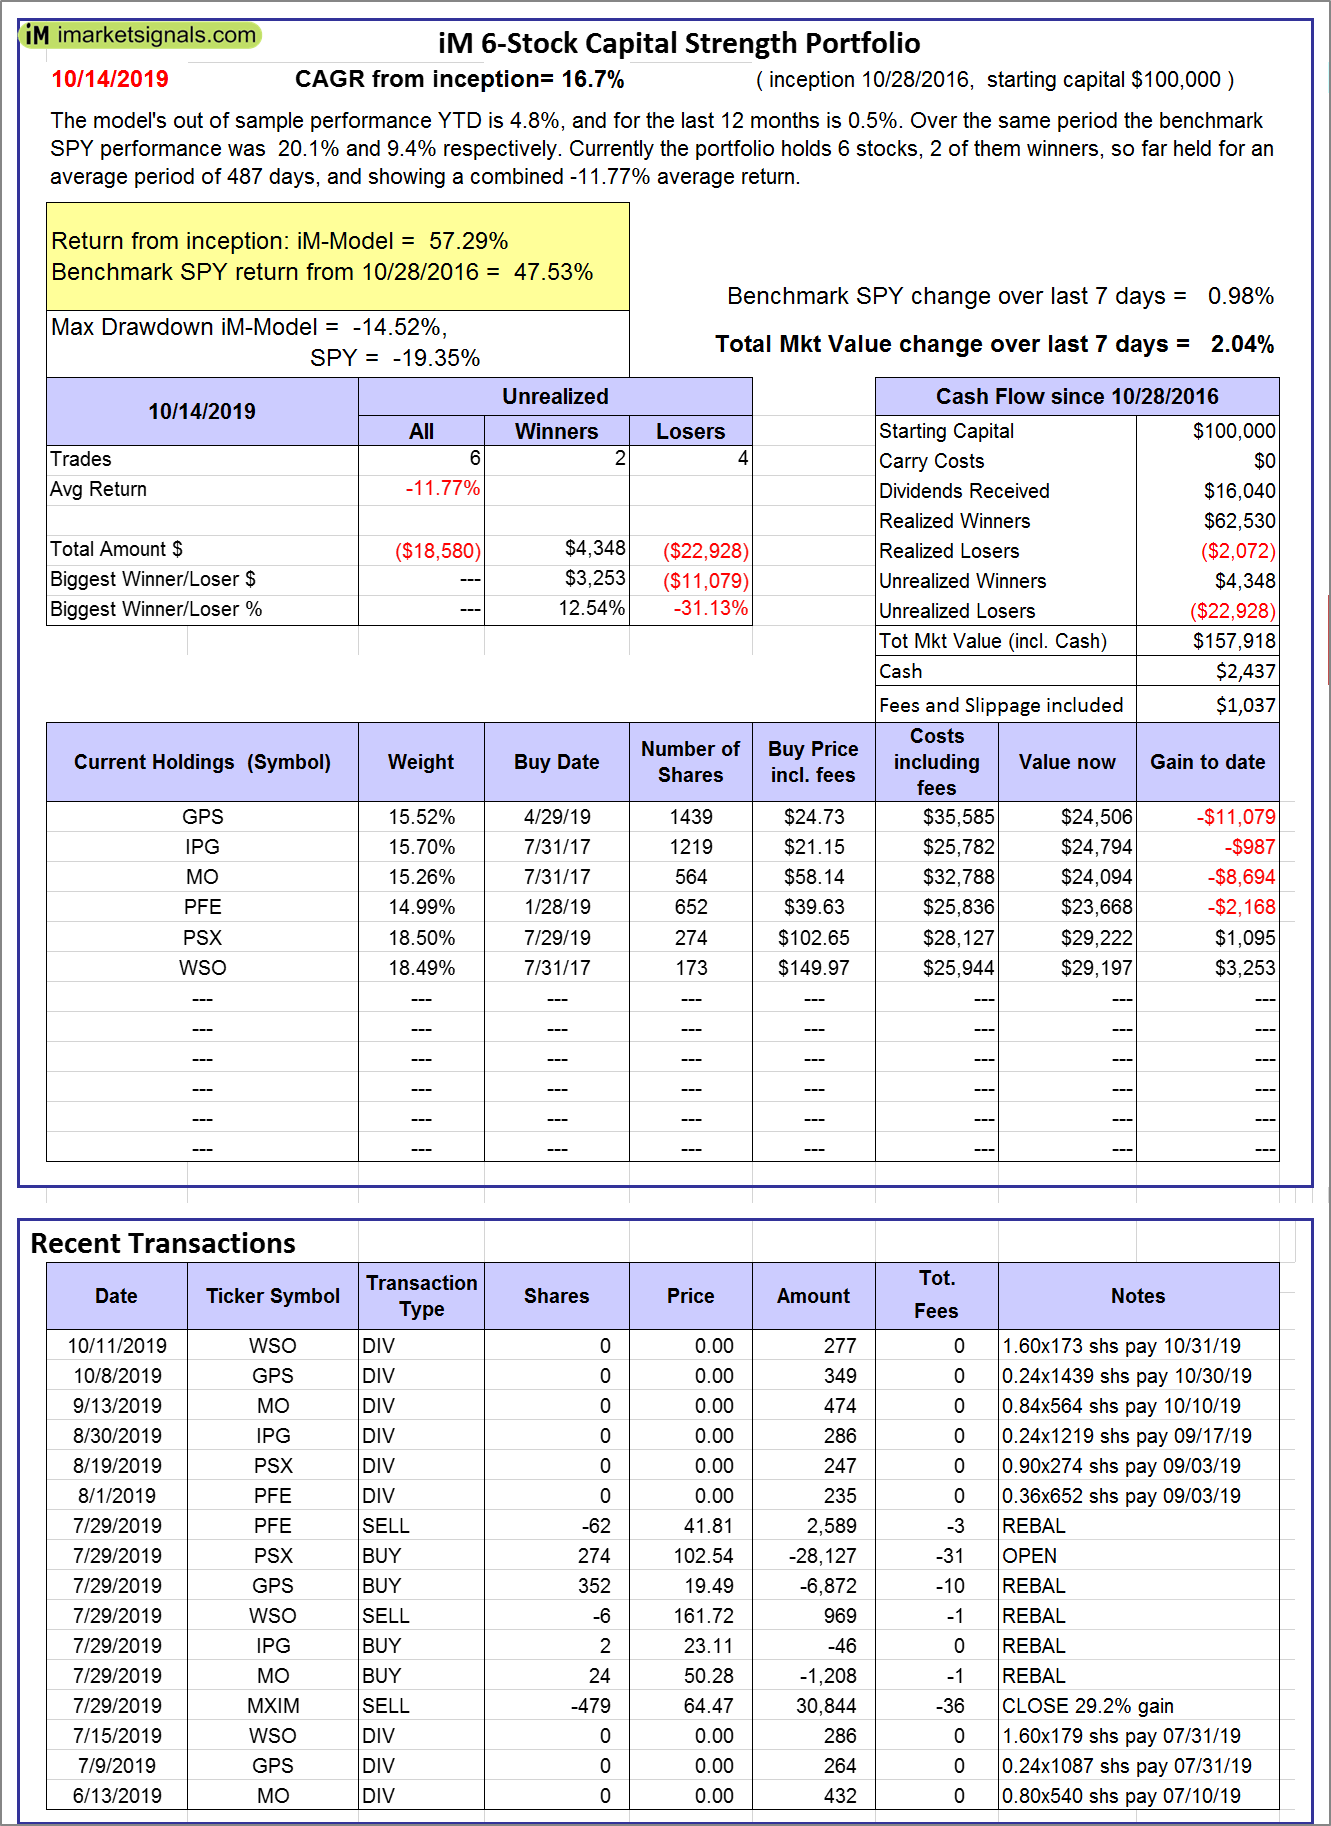 |
iM 6-Stock Capital Strength Portfolio: The model’s out of sample performance YTD is 4.8%, and for the last 12 months is 0.5%. Over the same period the benchmark SPY performance was 20.1% and 9.4% respectively. Over the previous week the market value of the iM 6-Stock Capital Strength Portfolio gained 2.04% at a time when SPY gained 0.98%. A starting capital of $100,000 at inception on 10/28/2016 would have grown to $157,918 which includes $2,437 cash and excludes $1,037 spent on fees and slippage. |
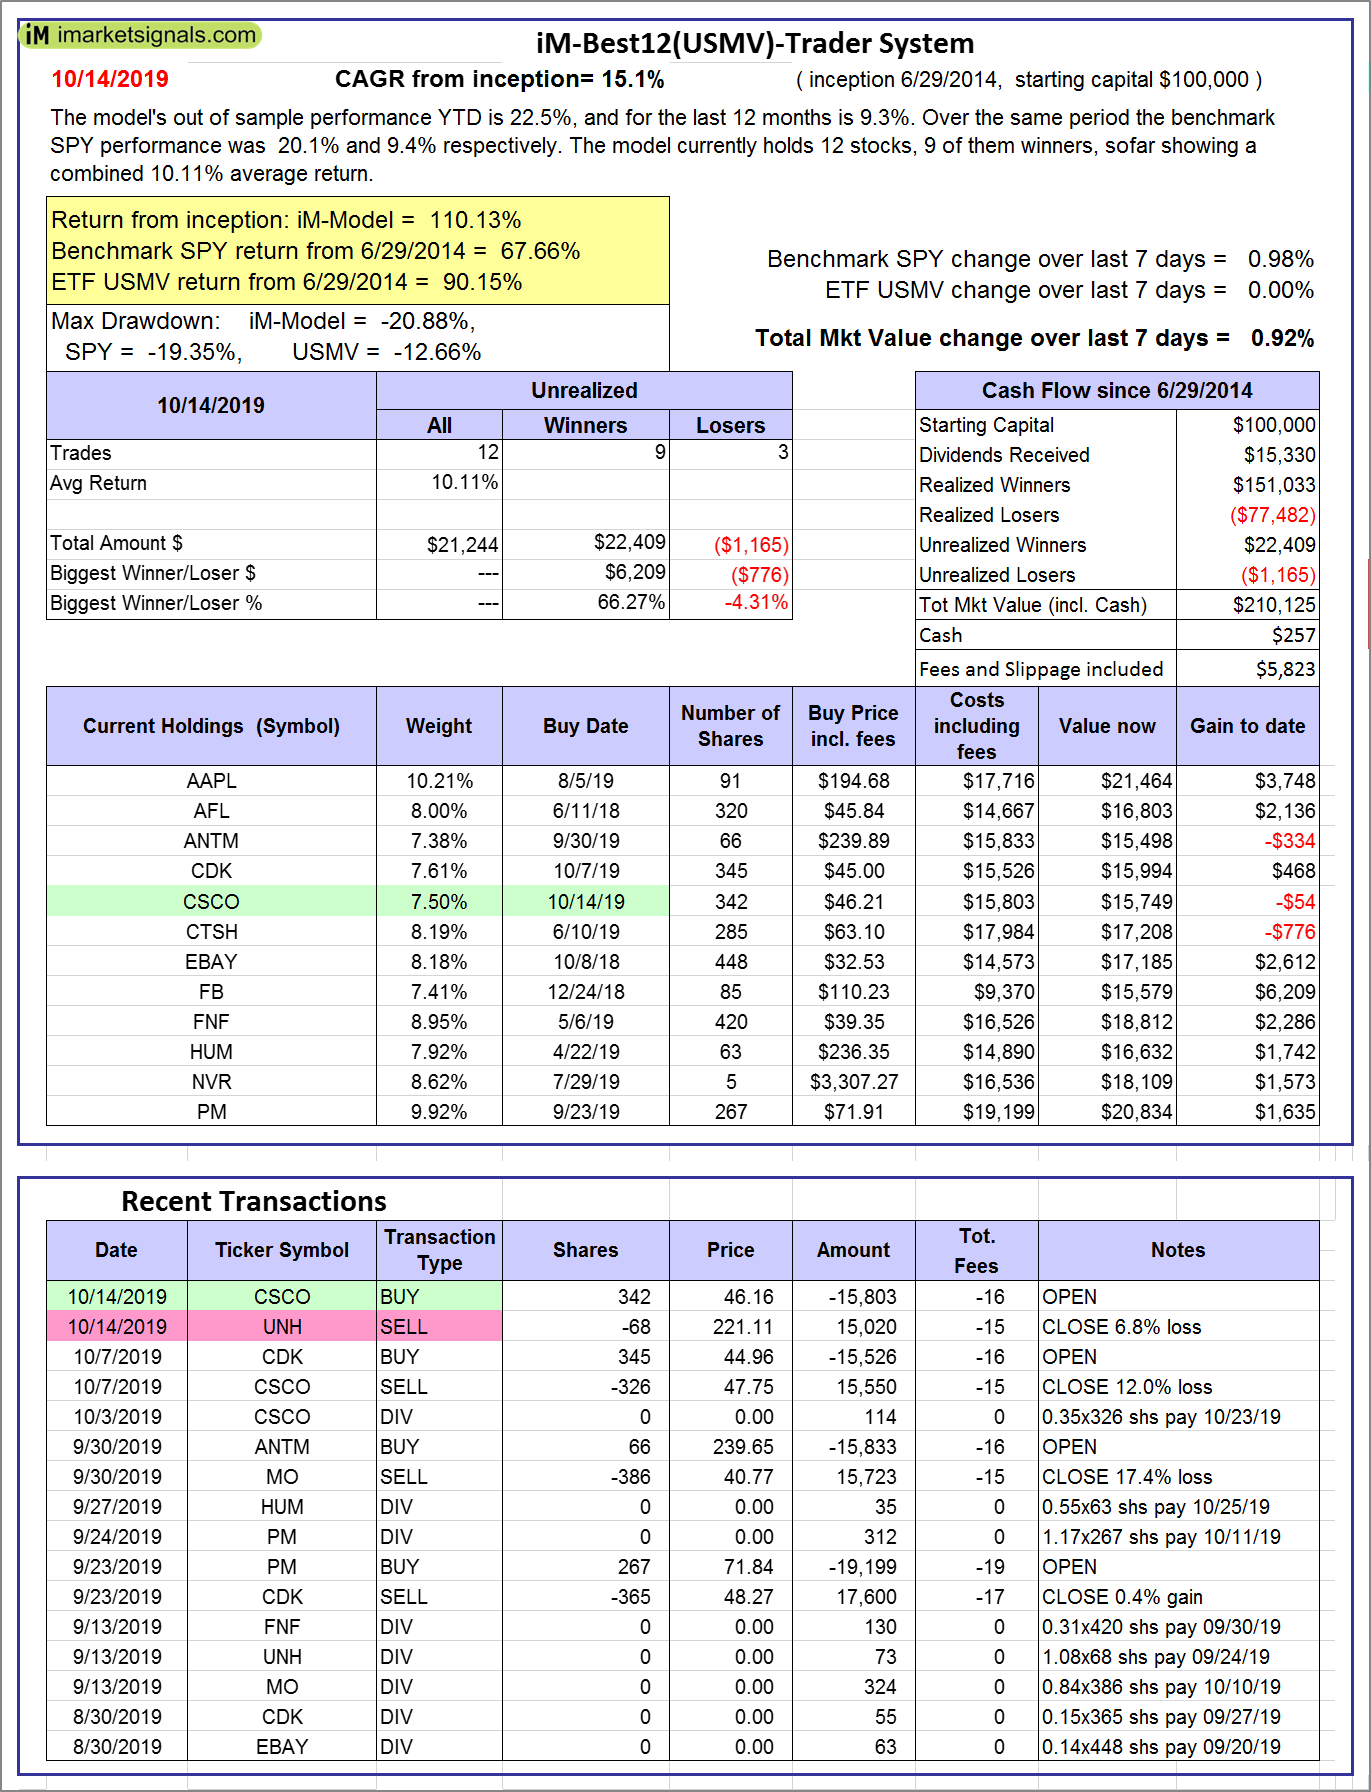 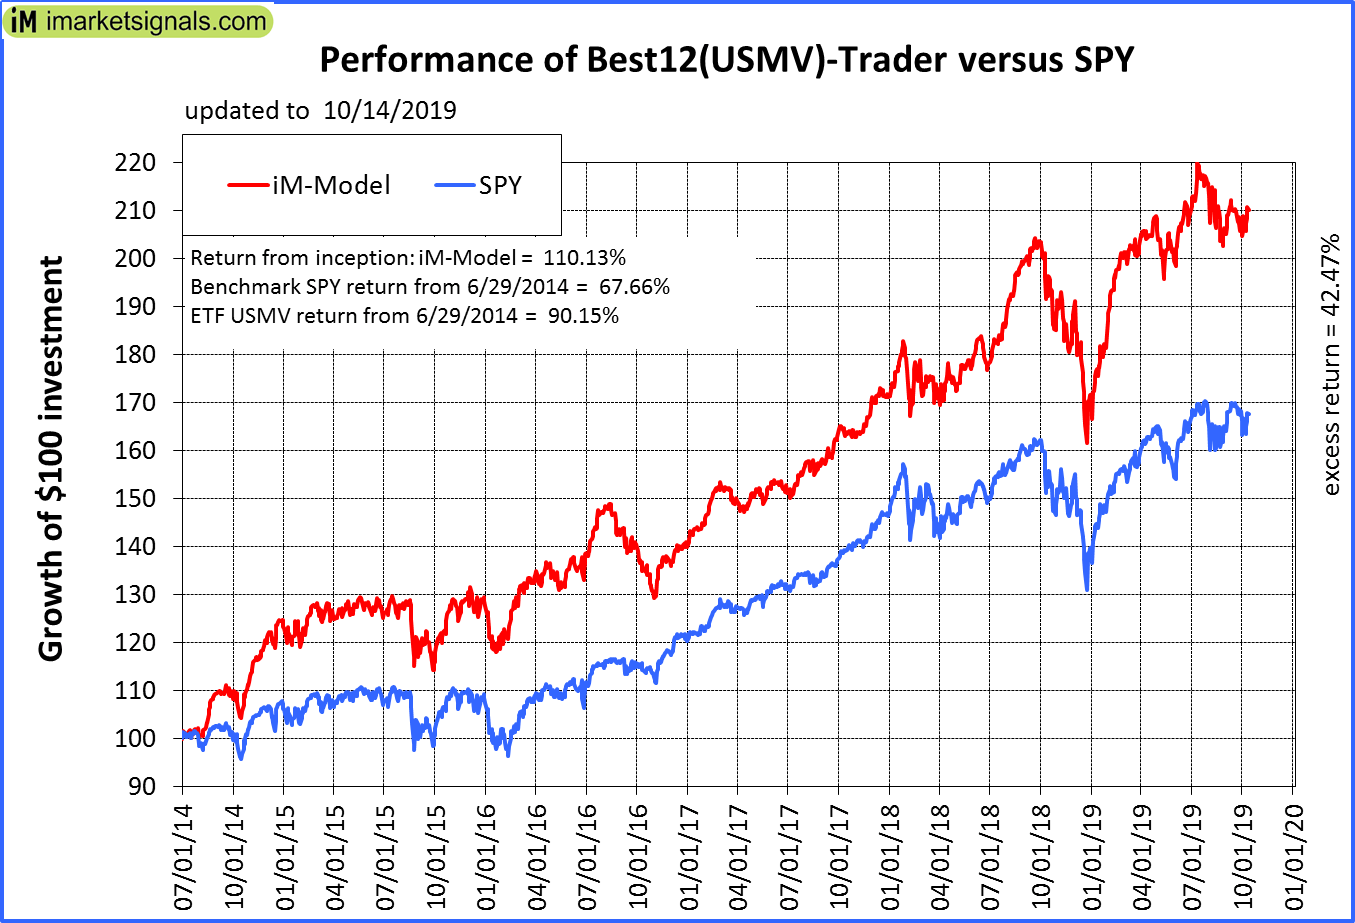 |
iM-Best12(USMV)-Trader: The model’s out of sample performance YTD is 22.5%, and for the last 12 months is 9.3%. Over the same period the benchmark SPY performance was 20.1% and 9.4% respectively. Since inception, on 6/30/2014, the model gained 110.13% while the benchmark SPY gained 67.66% and the ETF USMV gained 90.15% over the same period. Over the previous week the market value of iM-Best12(USMV)-Trader gained 0.92% at a time when SPY gained 0.98%. A starting capital of $100,000 at inception on 6/30/2014 would have grown to $210,125 which includes $257 cash and excludes $5,823 spent on fees and slippage. |
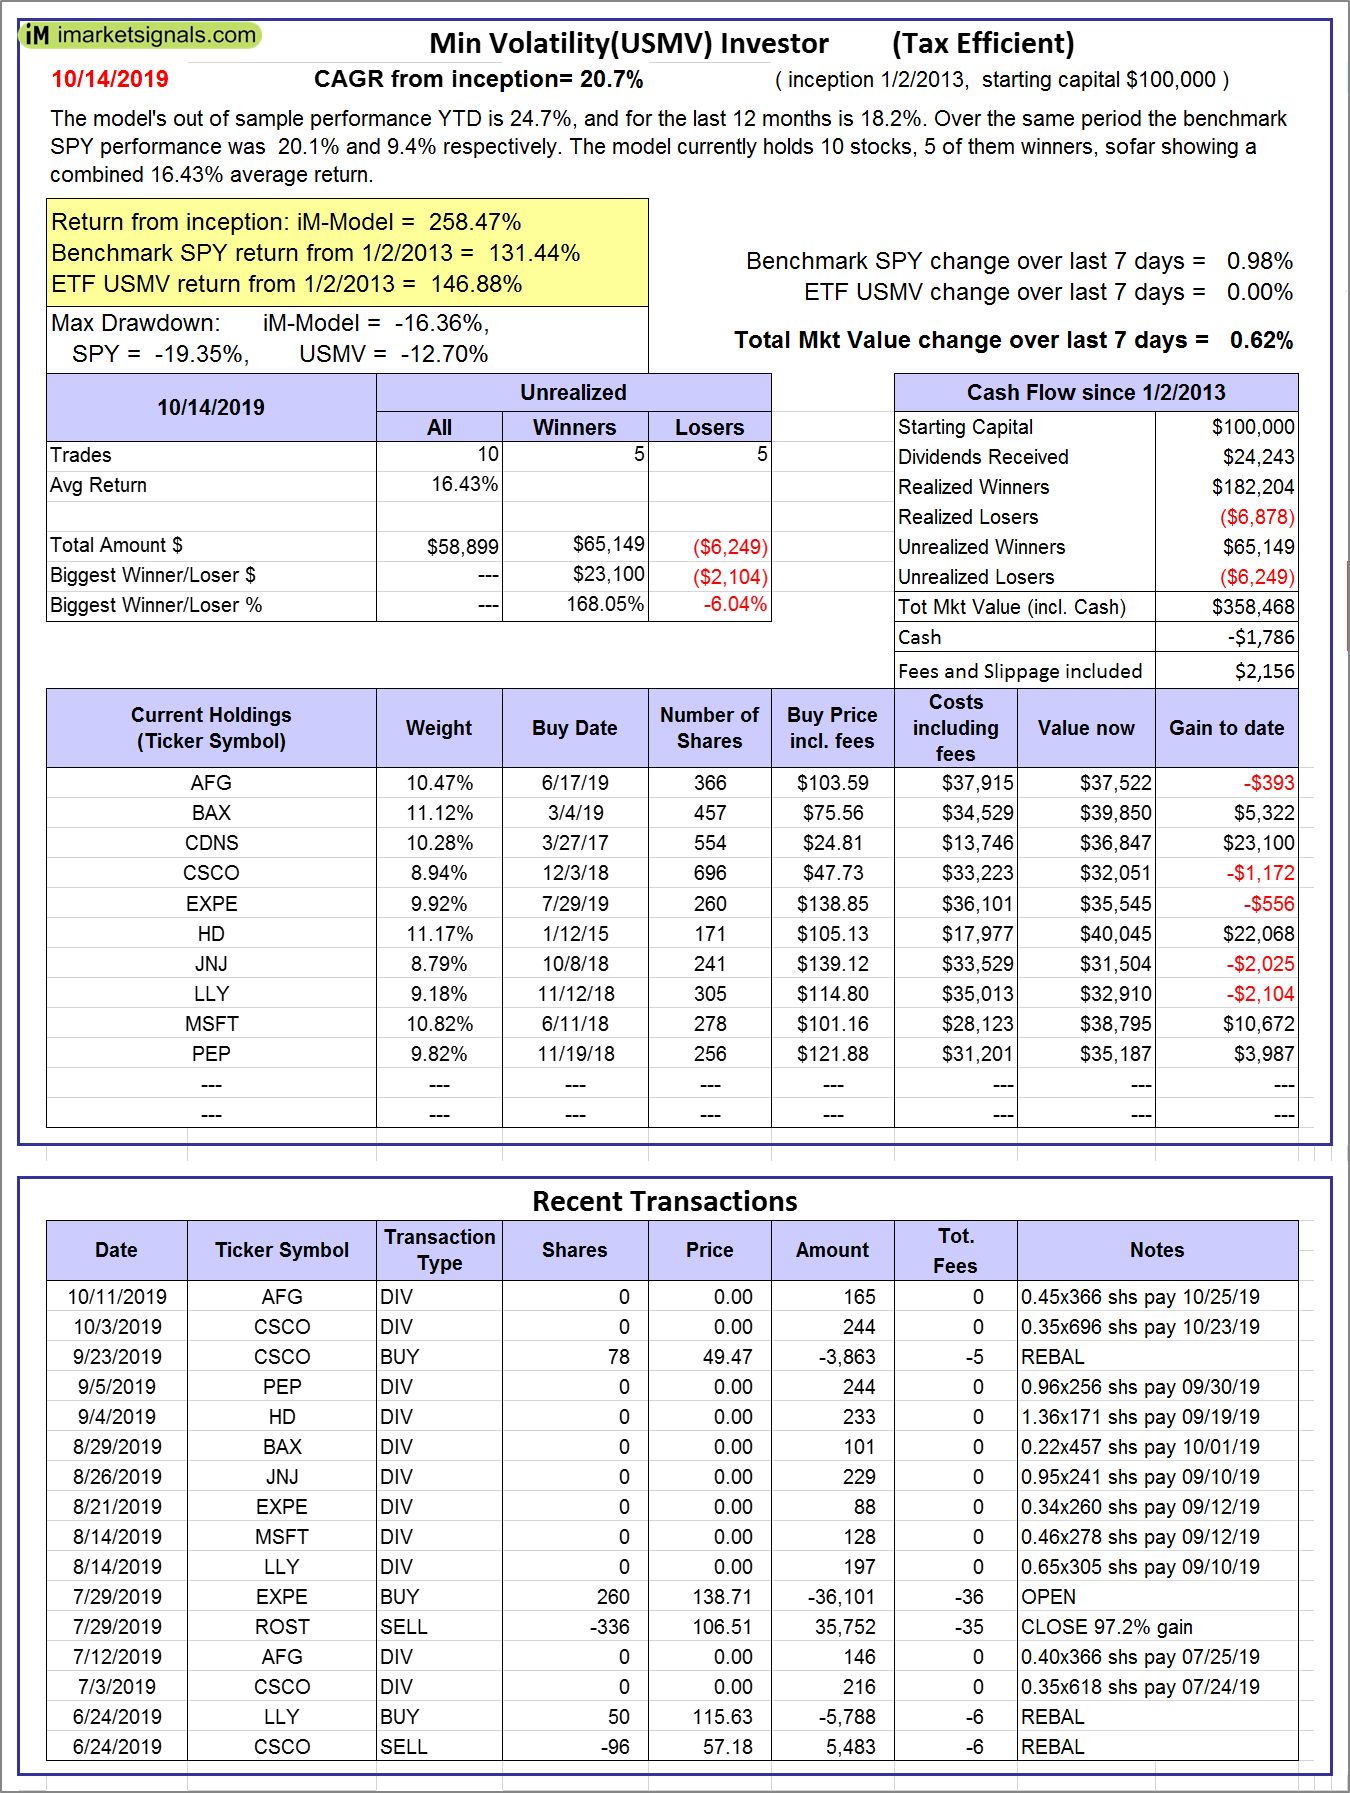 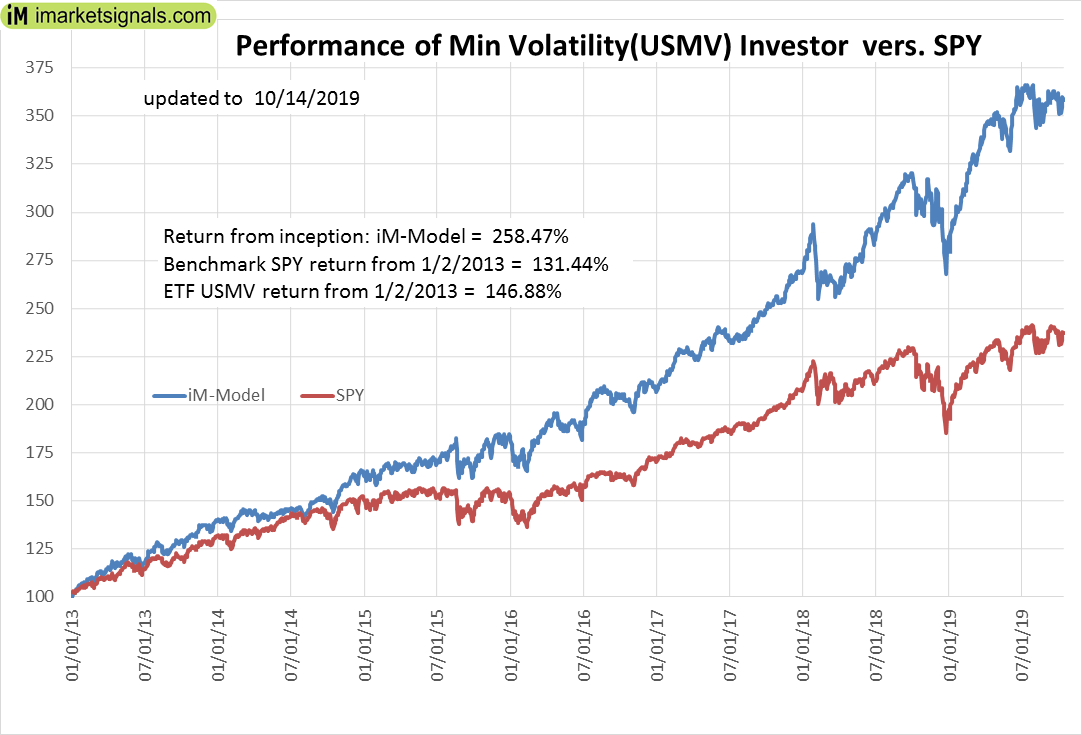 |
iM Min Volatility (USMV) Investor: The model’s out of sample performance YTD is 24.7%, and for the last 12 months is 18.2%. Over the same period the benchmark SPY performance was 20.1% and 9.4% respectively. Since inception, on 1/3/2013, the model gained 258.47% while the benchmark SPY gained 131.44% and the ETF USMV gained 146.88% over the same period. Over the previous week the market value of iM Min Volatility (USMV) Investor gained 0.62% at a time when SPY gained 0.98%. A starting capital of $100,000 at inception on 1/3/2013 would have grown to $358,468 which includes -$1,786 cash and excludes $2,156 spent on fees and slippage. |
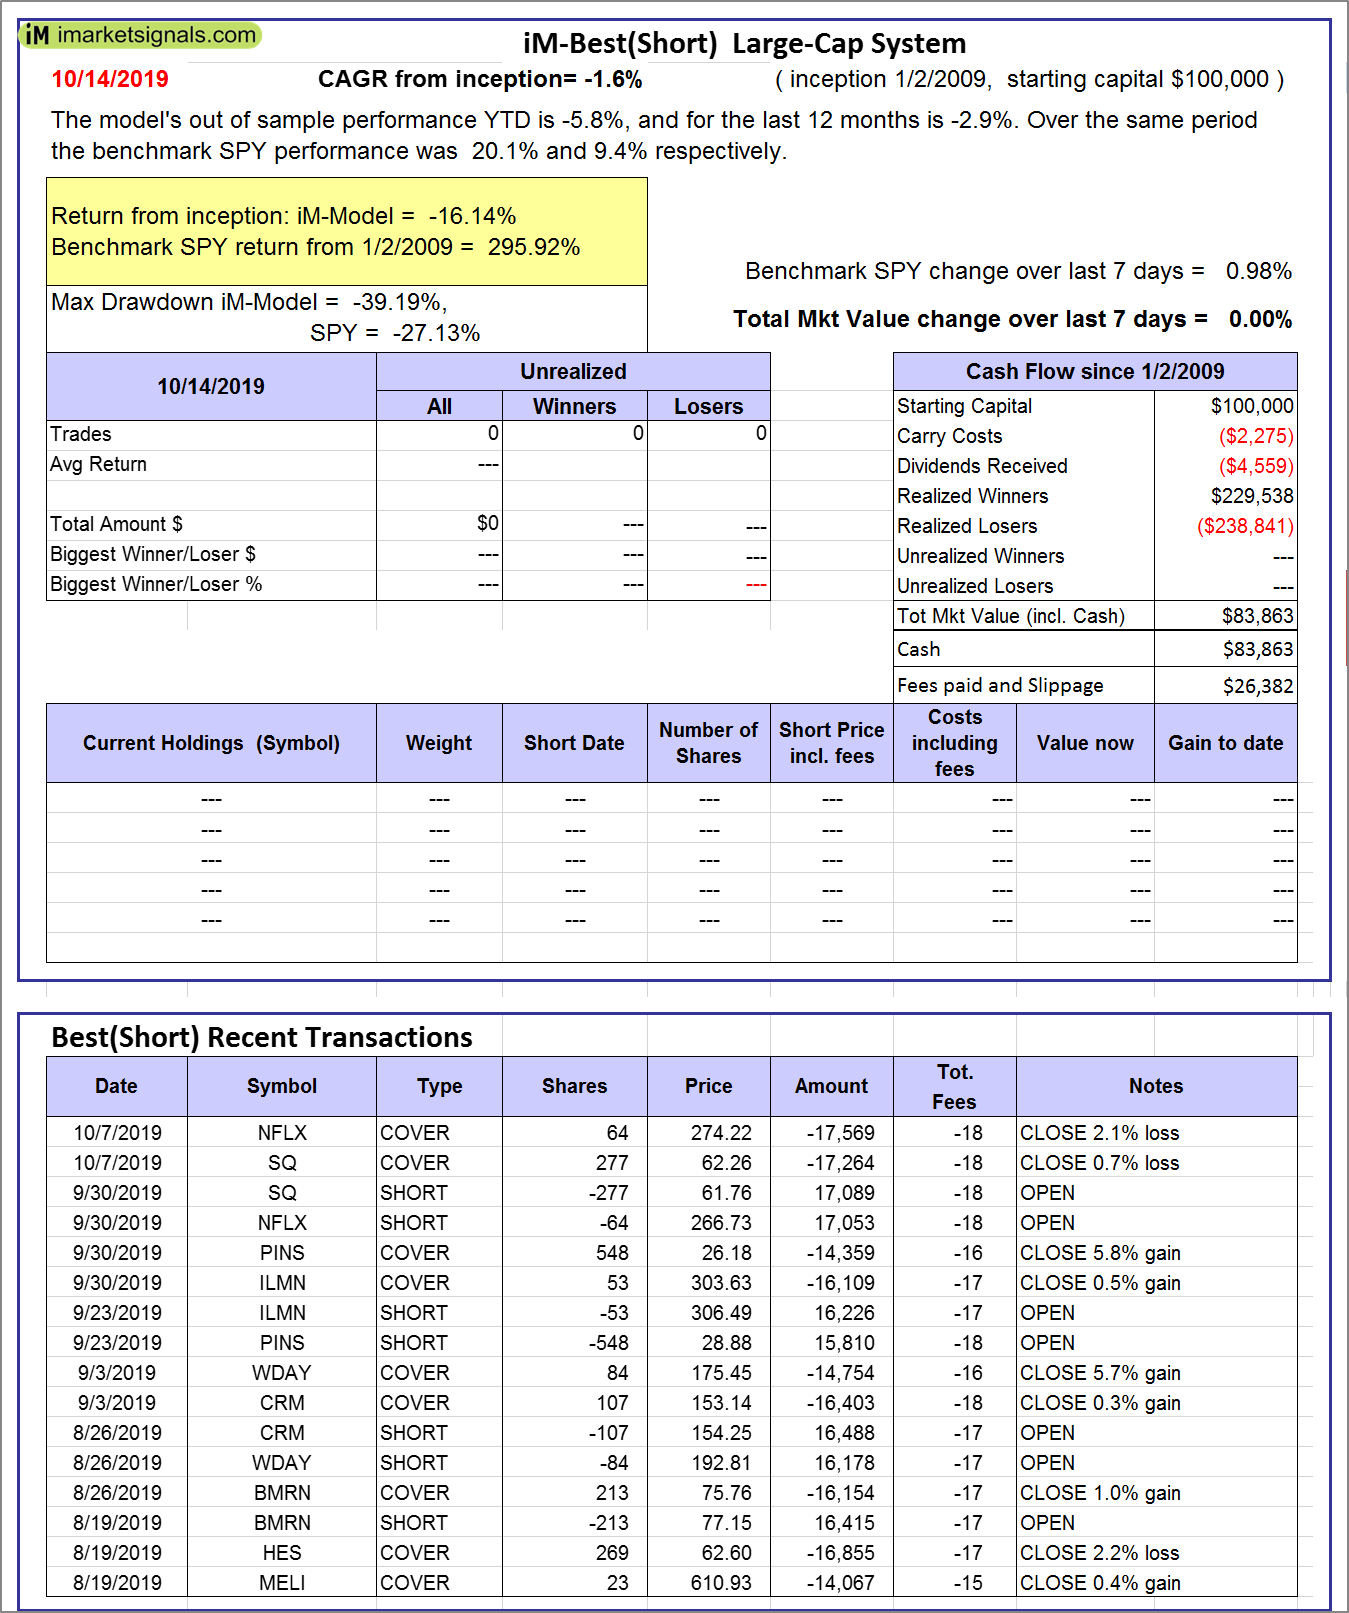 |
iM-Best(Short): The model’s out of sample performance YTD is -5.8%, and for the last 12 months is -2.9%. Over the same period the benchmark SPY performance was 20.1% and 9.4% respectively. Over the previous week the market value of iM-Best(Short) gained 0.00% at a time when SPY gained 0.98%. Over the period 1/2/2009 to 10/14/2019 the starting capital of $100,000 would have grown to $83,863 which includes $83,863 cash and excludes $26,382 spent on fees and slippage. |
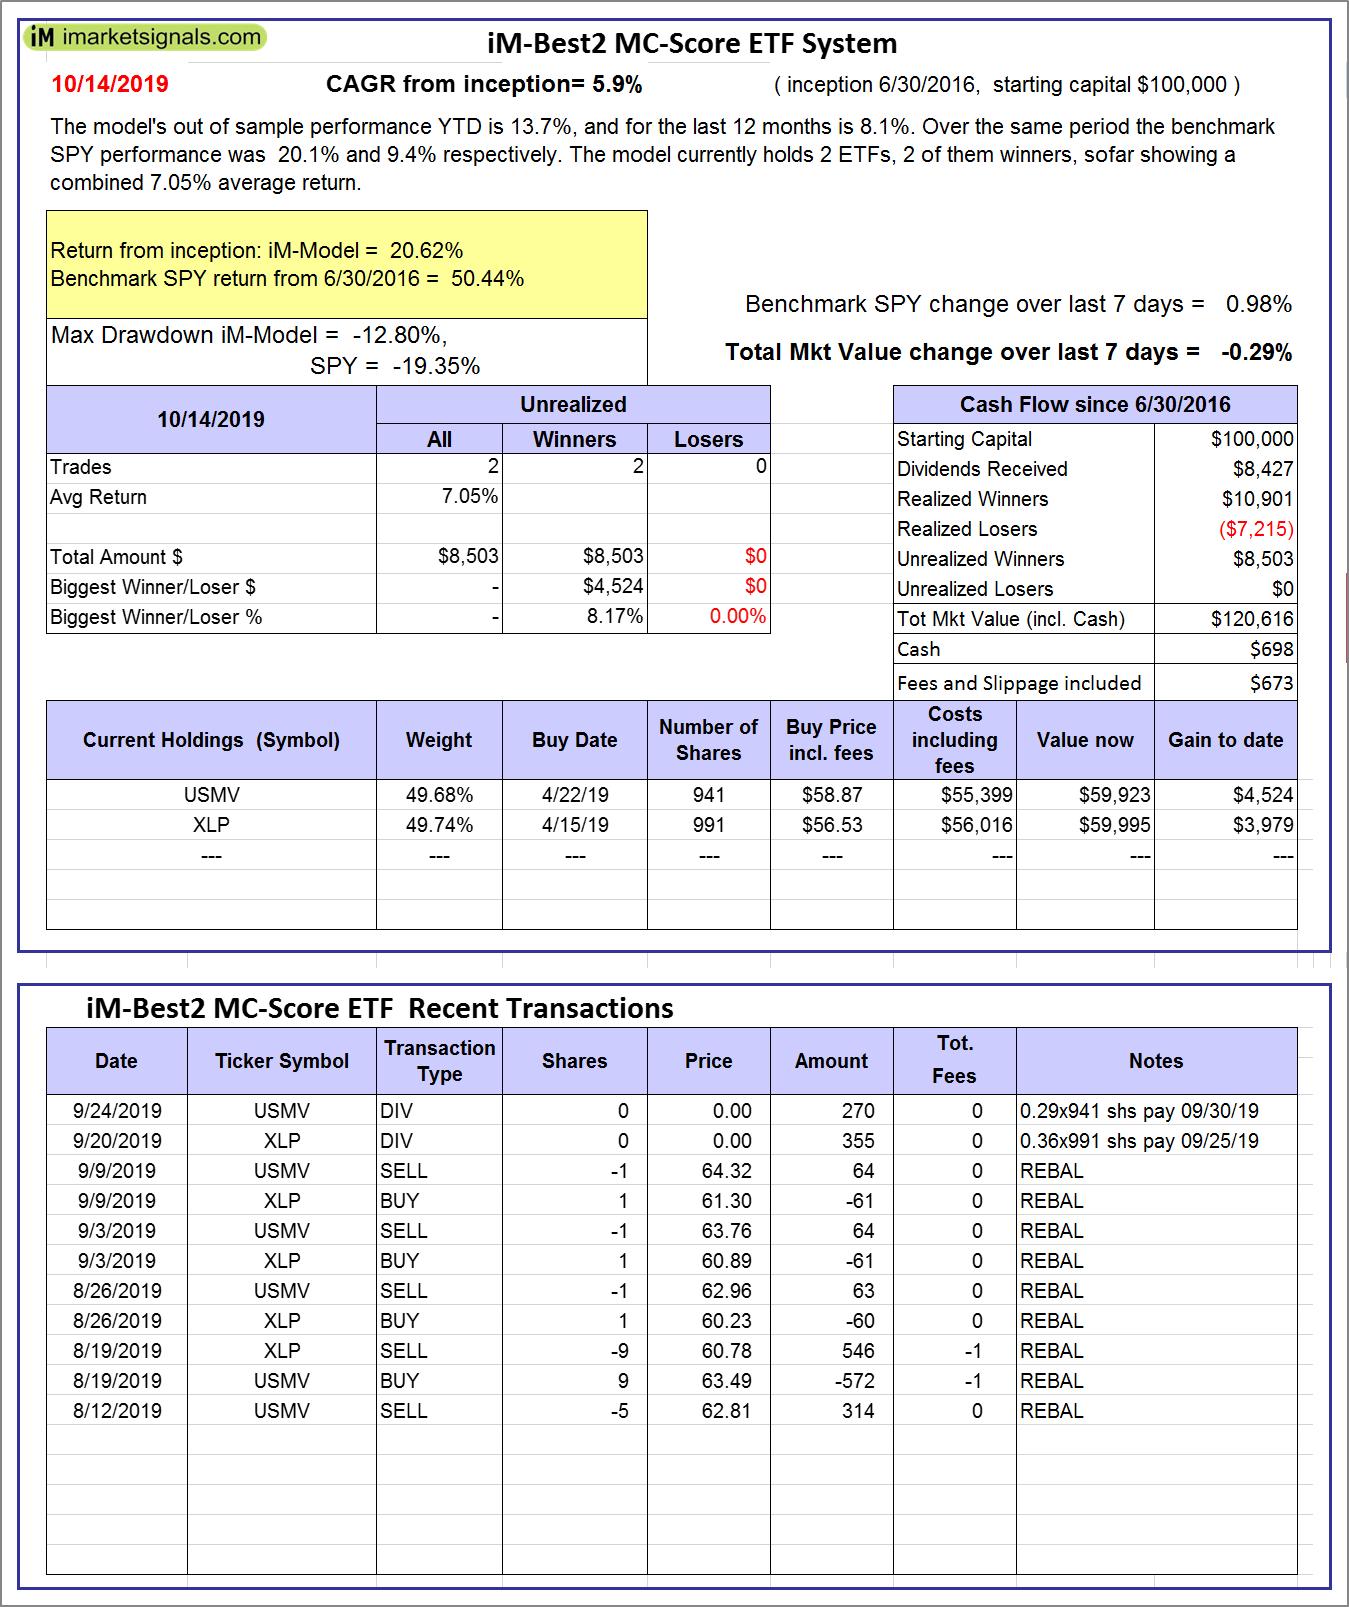 |
iM-Best2 MC-Score ETF System: The model’s out of sample performance YTD is 13.7%, and for the last 12 months is 8.1%. Over the same period the benchmark SPY performance was 20.1% and 9.4% respectively. Over the previous week the market value of the iM-Best2 MC-Score ETF System gained -0.29% at a time when SPY gained 0.98%. A starting capital of $100,000 at inception on 6/30/2016 would have grown to $120,616 which includes $698 cash and excludes $673 spent on fees and slippage. |
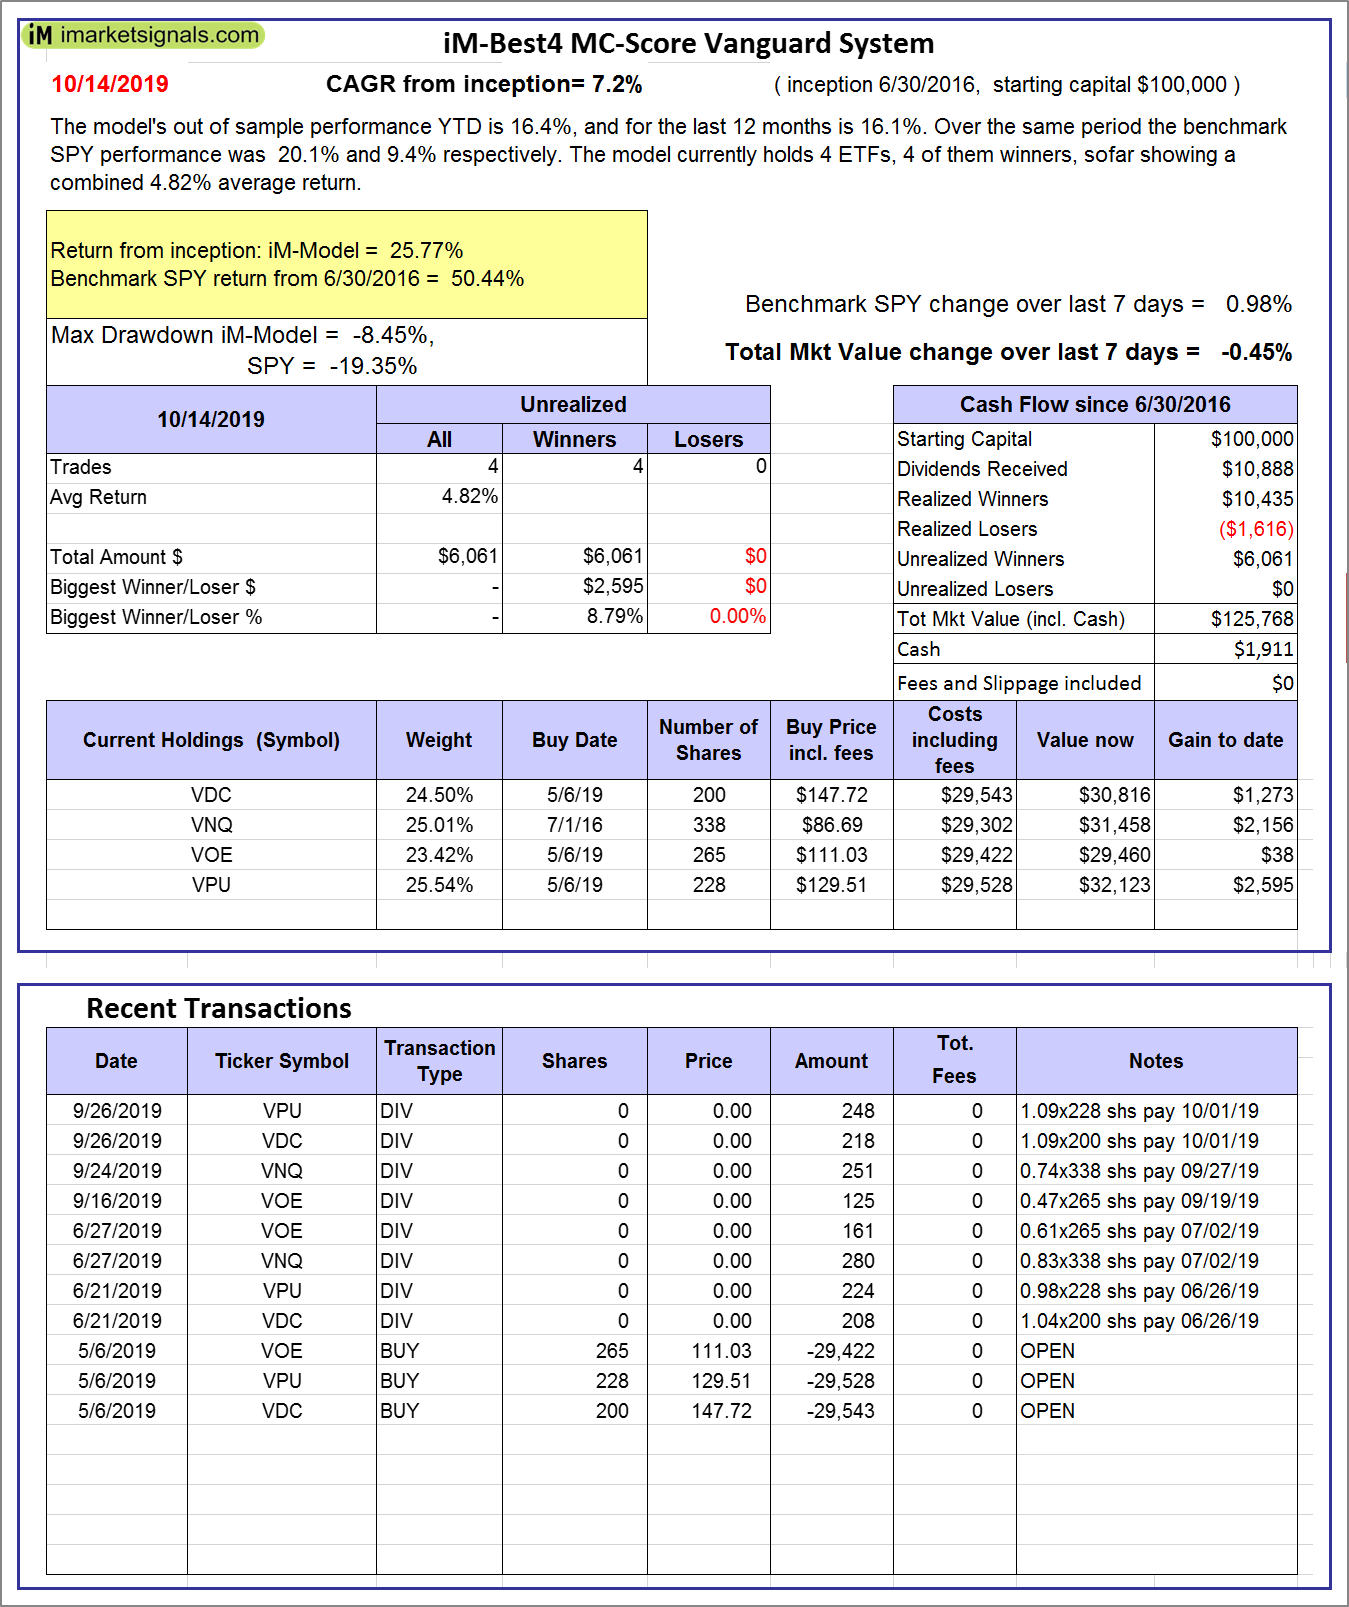 |
iM-Best4 MC-Score Vanguard System: The model’s out of sample performance YTD is 16.4%, and for the last 12 months is 16.1%. Over the same period the benchmark SPY performance was 20.1% and 9.4% respectively. Over the previous week the market value of the iM-Best4 MC-Score Vanguard System gained -0.45% at a time when SPY gained 0.98%. A starting capital of $100,000 at inception on 6/30/2016 would have grown to $125,768 which includes $1,911 cash and excludes $00 spent on fees and slippage. |
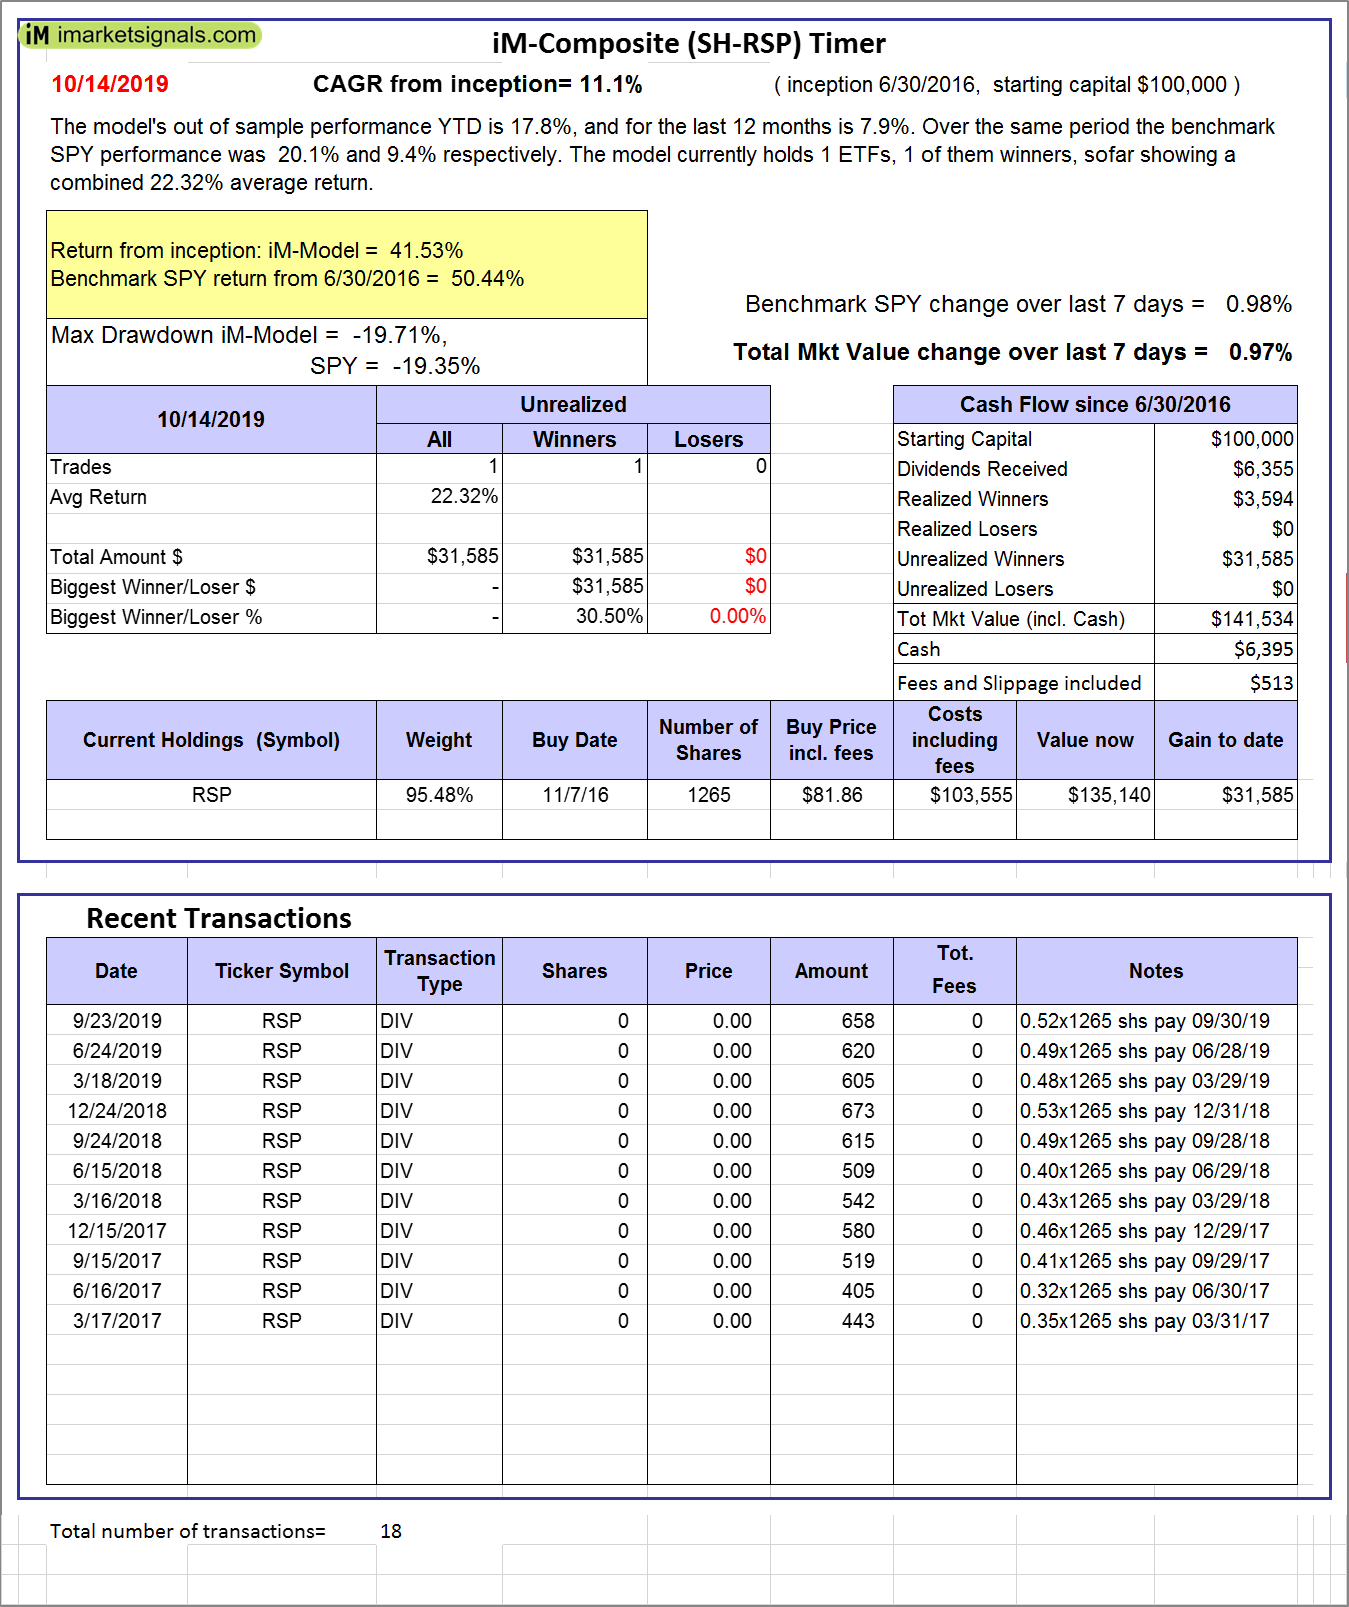 |
iM-Composite (SH-RSP) Timer: The model’s out of sample performance YTD is 17.8%, and for the last 12 months is 7.9%. Over the same period the benchmark SPY performance was 20.1% and 9.4% respectively. Over the previous week the market value of the iM-Composite (SH-RSP) Timer gained 0.97% at a time when SPY gained 0.98%. A starting capital of $100,000 at inception on 6/30/2016 would have grown to $141,534 which includes $6,395 cash and excludes $513 spent on fees and slippage. |
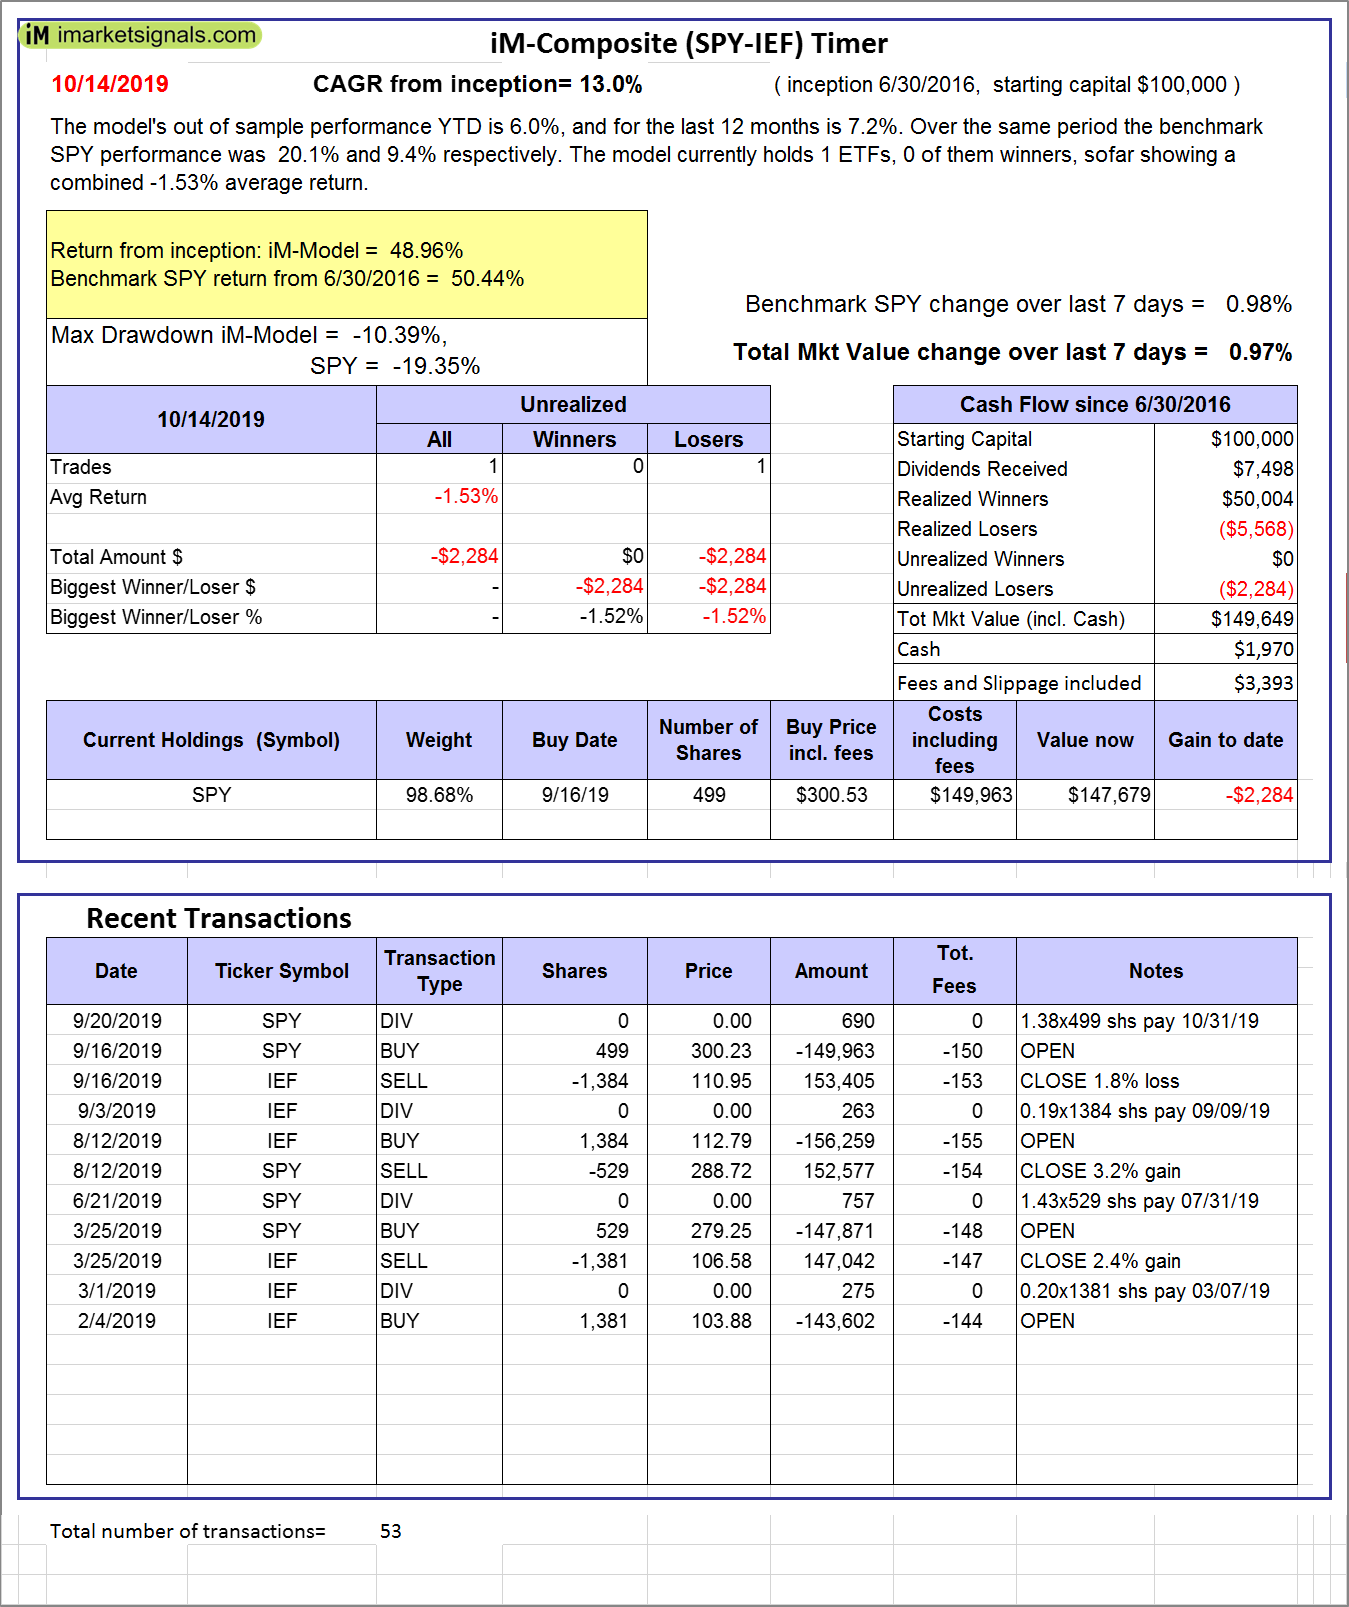 |
iM-Composite (SPY-IEF) Timer: The model’s out of sample performance YTD is 6.0%, and for the last 12 months is 7.2%. Over the same period the benchmark SPY performance was 20.1% and 9.4% respectively. Over the previous week the market value of the iM-Composite (SPY-IEF) Timer gained 0.97% at a time when SPY gained 0.98%. A starting capital of $100,000 at inception on 6/30/2016 would have grown to $149,649 which includes $1,970 cash and excludes $3,393 spent on fees and slippage. |
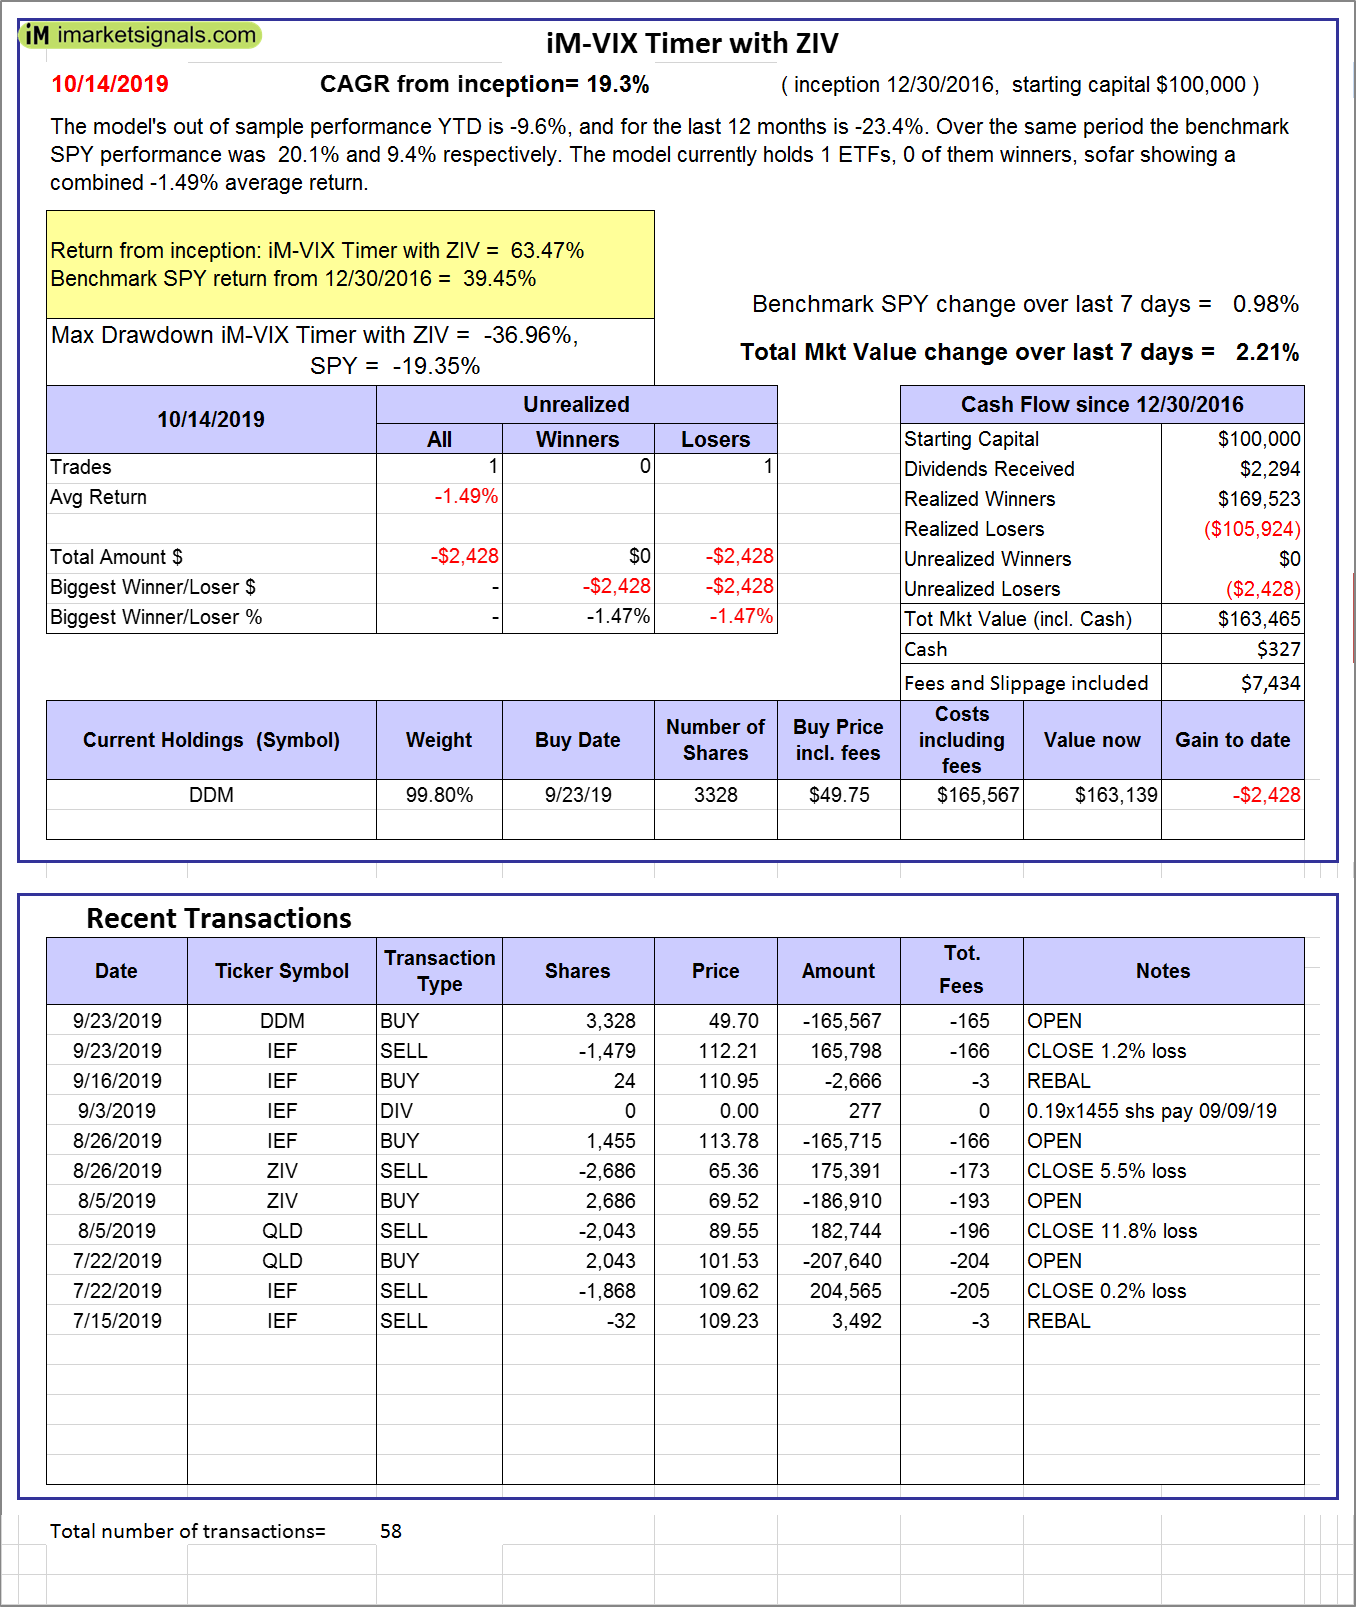 |
iM-VIX Timer with ZIV: The model’s out of sample performance YTD is -9.6%, and for the last 12 months is -23.4%. Over the same period the benchmark SPY performance was 20.1% and 9.4% respectively. Over the previous week the market value of the iM-VIX Timer with ZIV gained 2.21% at a time when SPY gained 0.98%. A starting capital of $100,000 at inception on 6/30/2016 would have grown to $163,465 which includes $327 cash and excludes $7,434 spent on fees and slippage. |
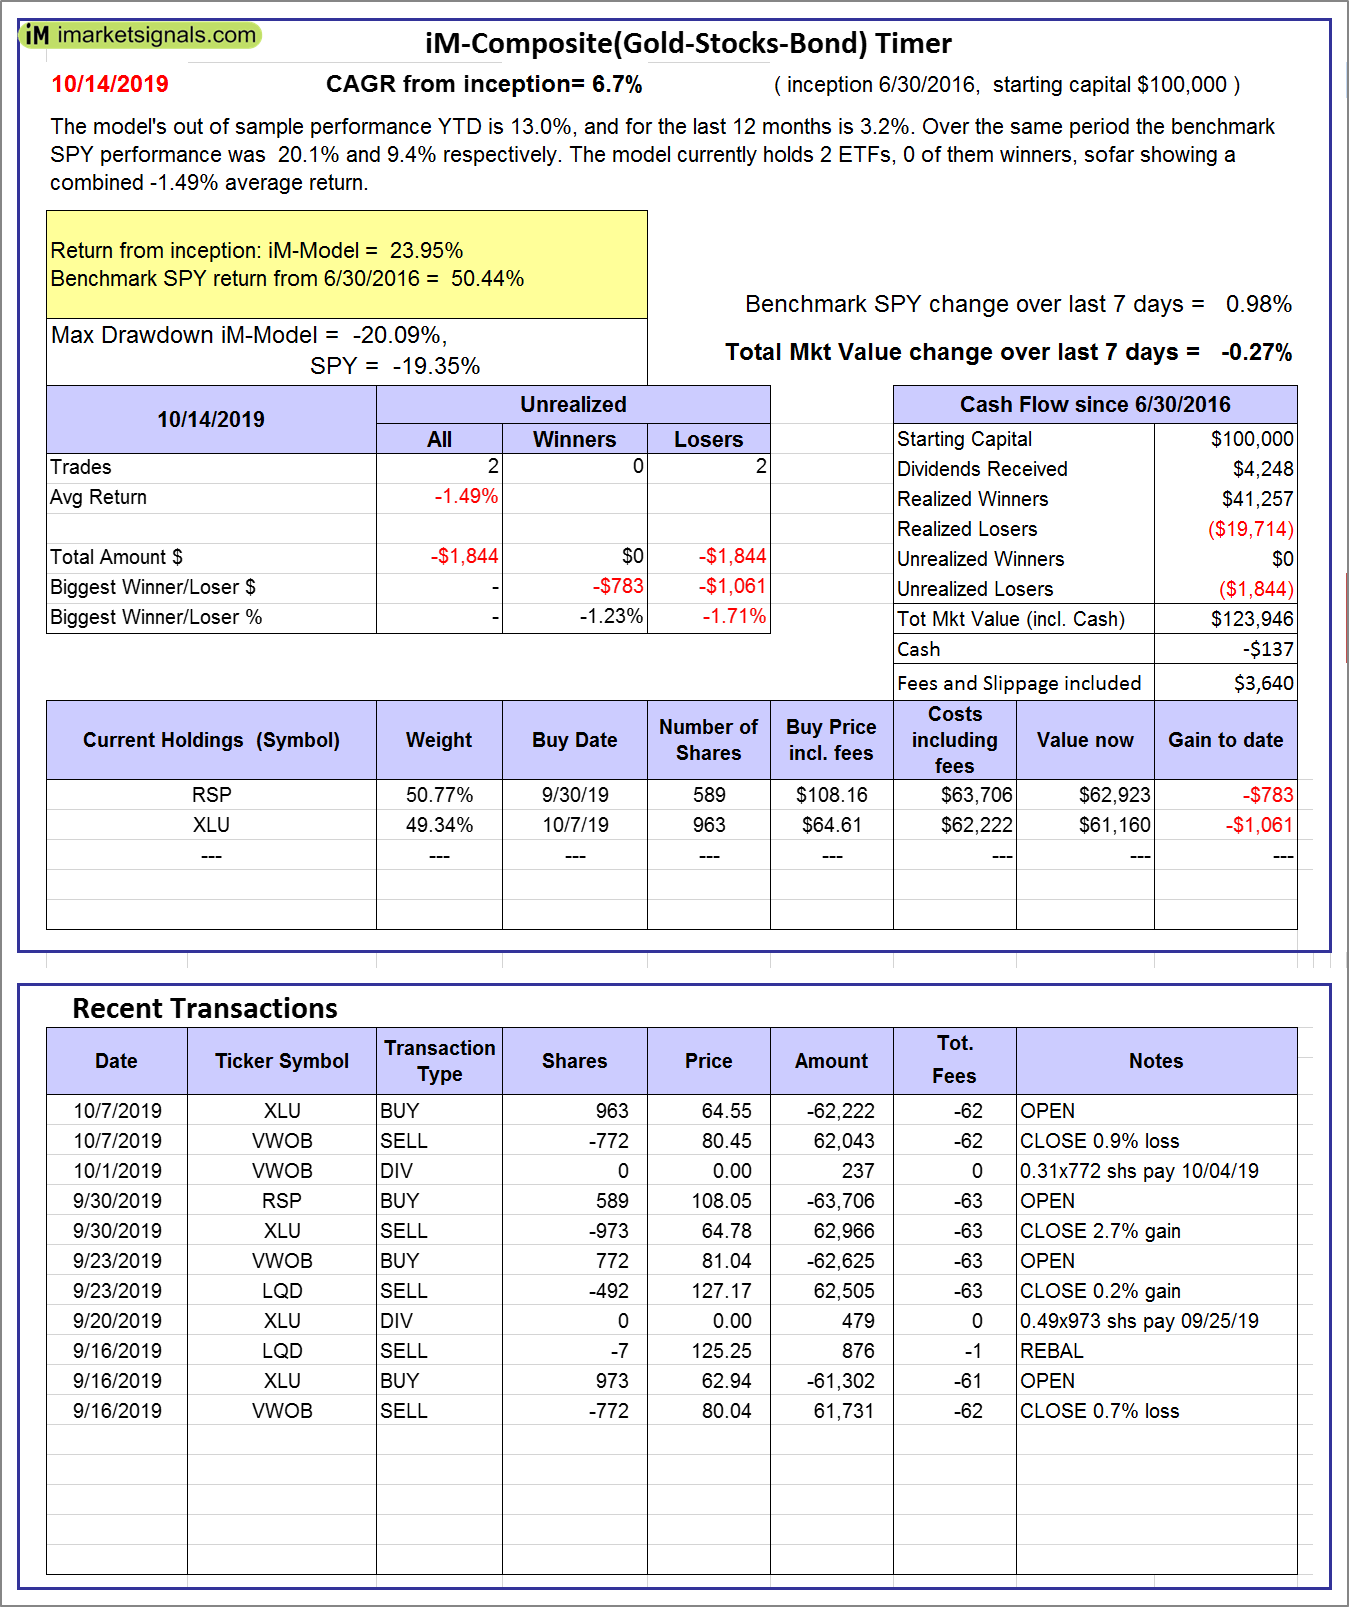 |
iM-Composite(Gold-Stocks-Bond) Timer: The model’s out of sample performance YTD is 13.0%, and for the last 12 months is 3.2%. Over the same period the benchmark SPY performance was 20.1% and 9.4% respectively. Over the previous week the market value of the iM-Composite(Gold-Stocks-Bond) Timer gained -0.27% at a time when SPY gained 0.98%. A starting capital of $100,000 at inception on 6/30/2016 would have grown to $123,946 which includes -$137 cash and excludes $3,640 spent on fees and slippage. |
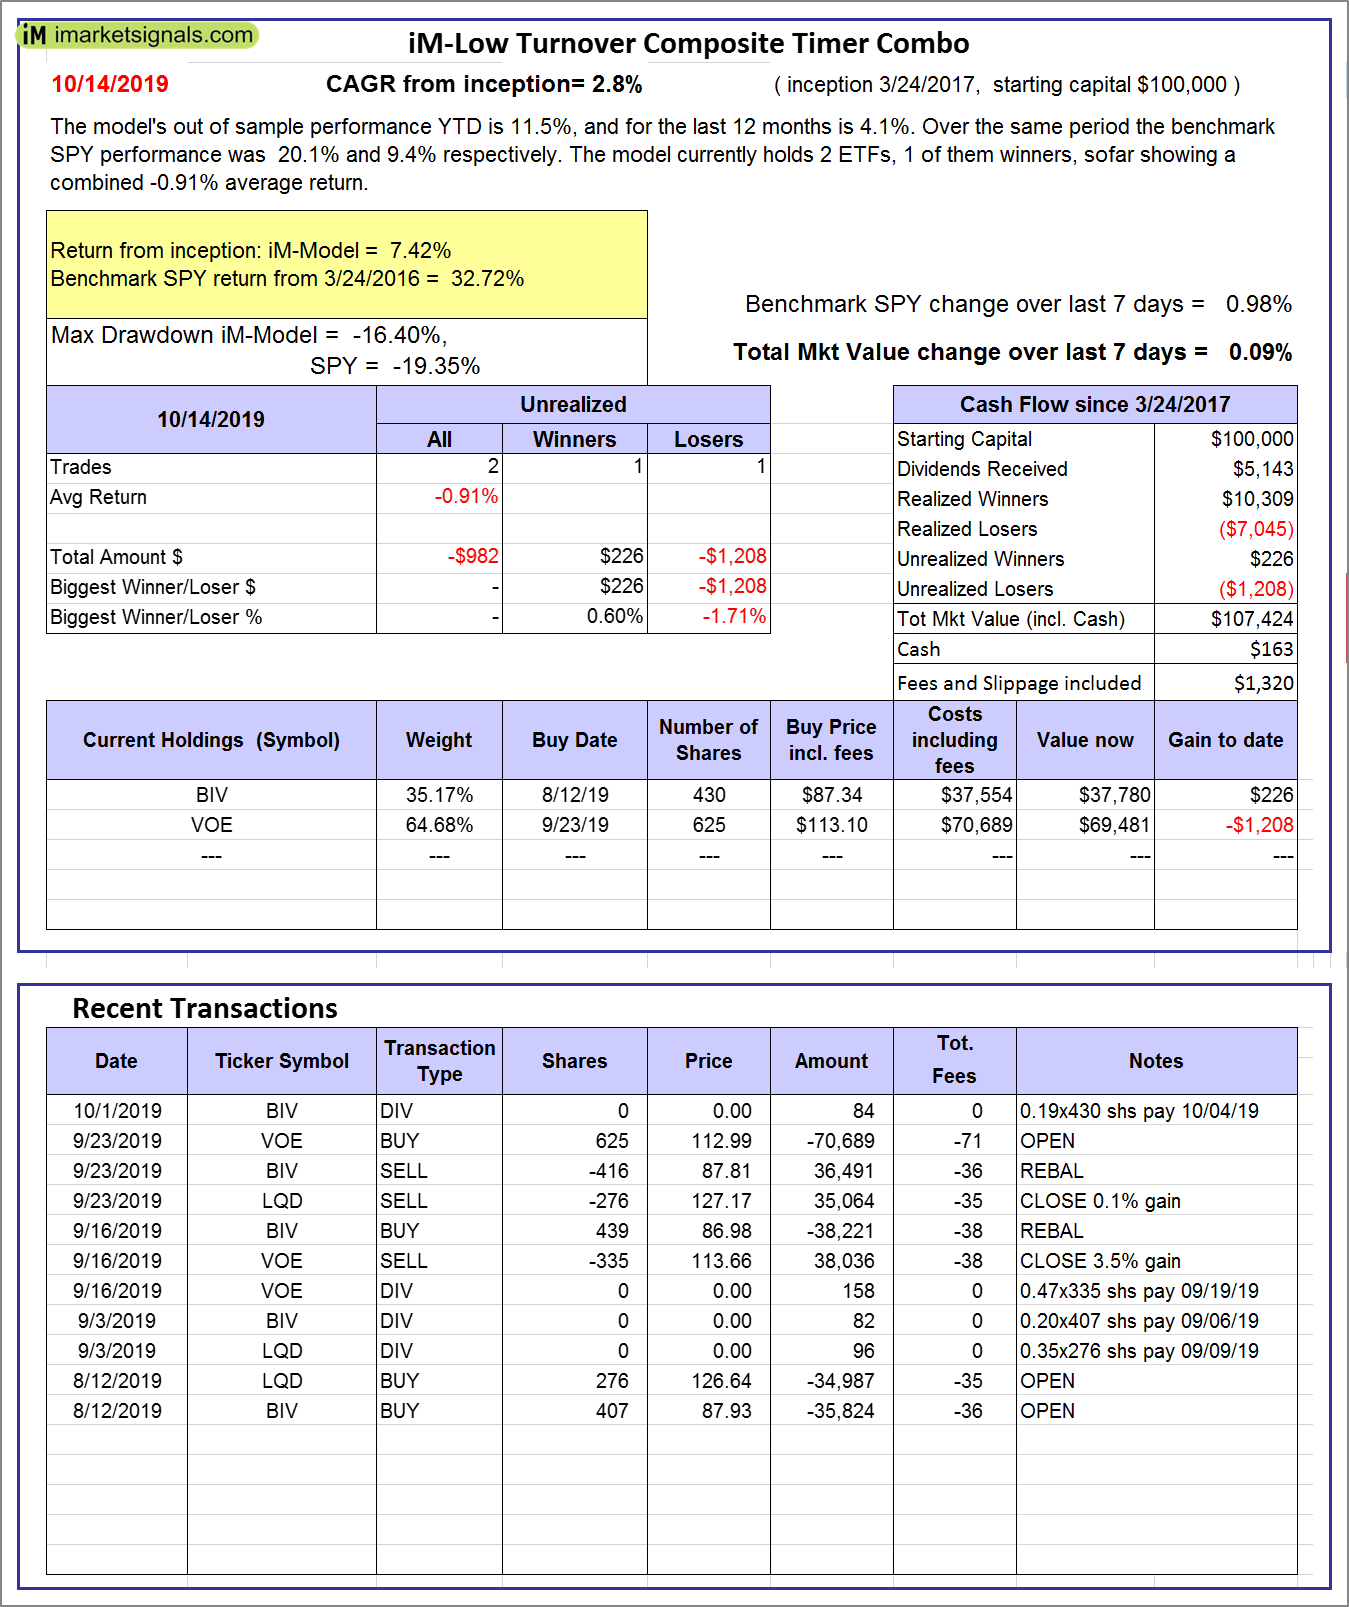 |
iM-Low Turnover Composite Timer Combo: The model’s out of sample performance YTD is 11.5%, and for the last 12 months is 4.1%. Over the same period the benchmark SPY performance was 20.1% and 9.4% respectively. Over the previous week the market value of the iM-Low Turnover Composite Timer Combo gained 0.09% at a time when SPY gained 0.98%. A starting capital of $100,000 at inception on 3/24/27 would have grown to $107,424 which includes $163 cash and excludes $1,320 spent on fees and slippage. |
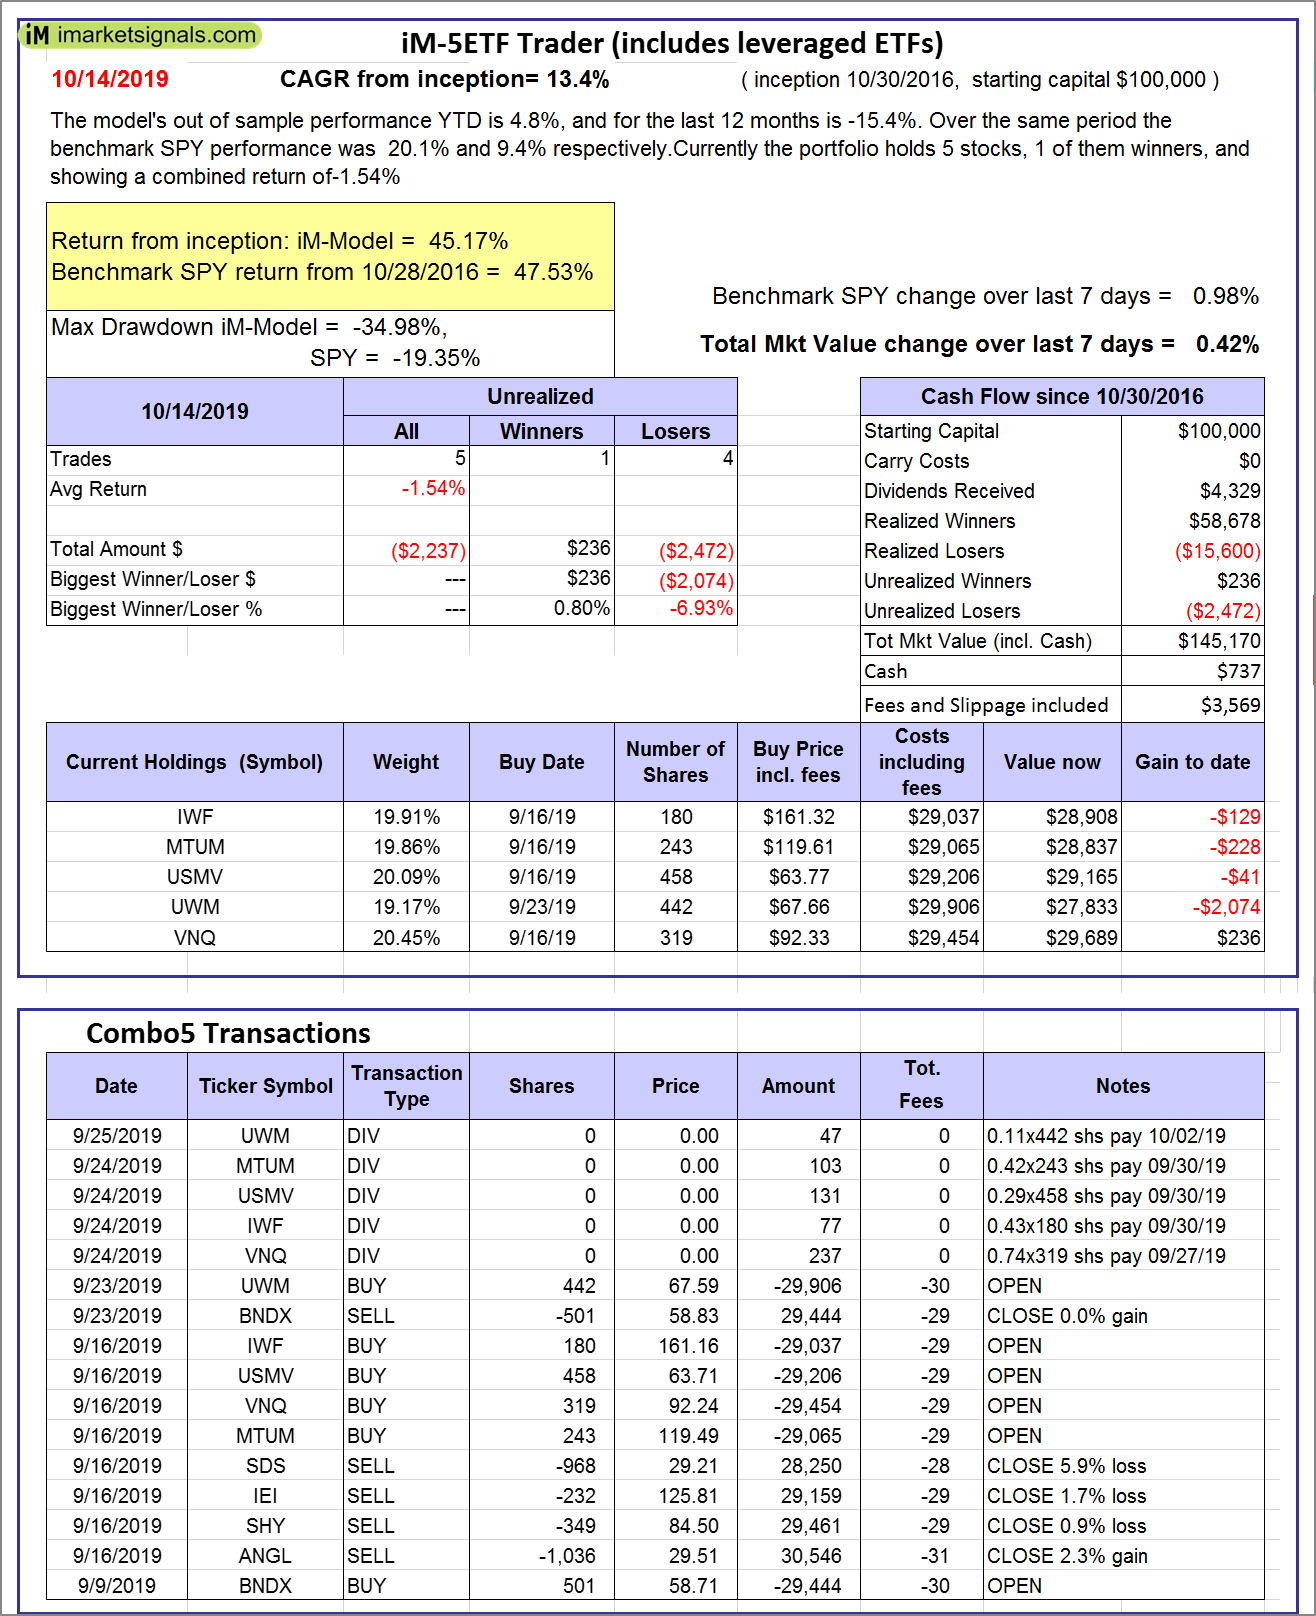 |
iM-5ETF Trader (includes leveraged ETFs): The model’s out of sample performance YTD is 4.8%, and for the last 12 months is -15.4%. Over the same period the benchmark SPY performance was 20.1% and 9.4% respectively. Over the previous week the market value of the iM-5ETF Trader (includes leveraged ETFs) gained 0.42% at a time when SPY gained 0.98%. A starting capital of $100,000 at inception on 10/30/2016 would have grown to $145,170 which includes $737 cash and excludes $3,569 spent on fees and slippage. |
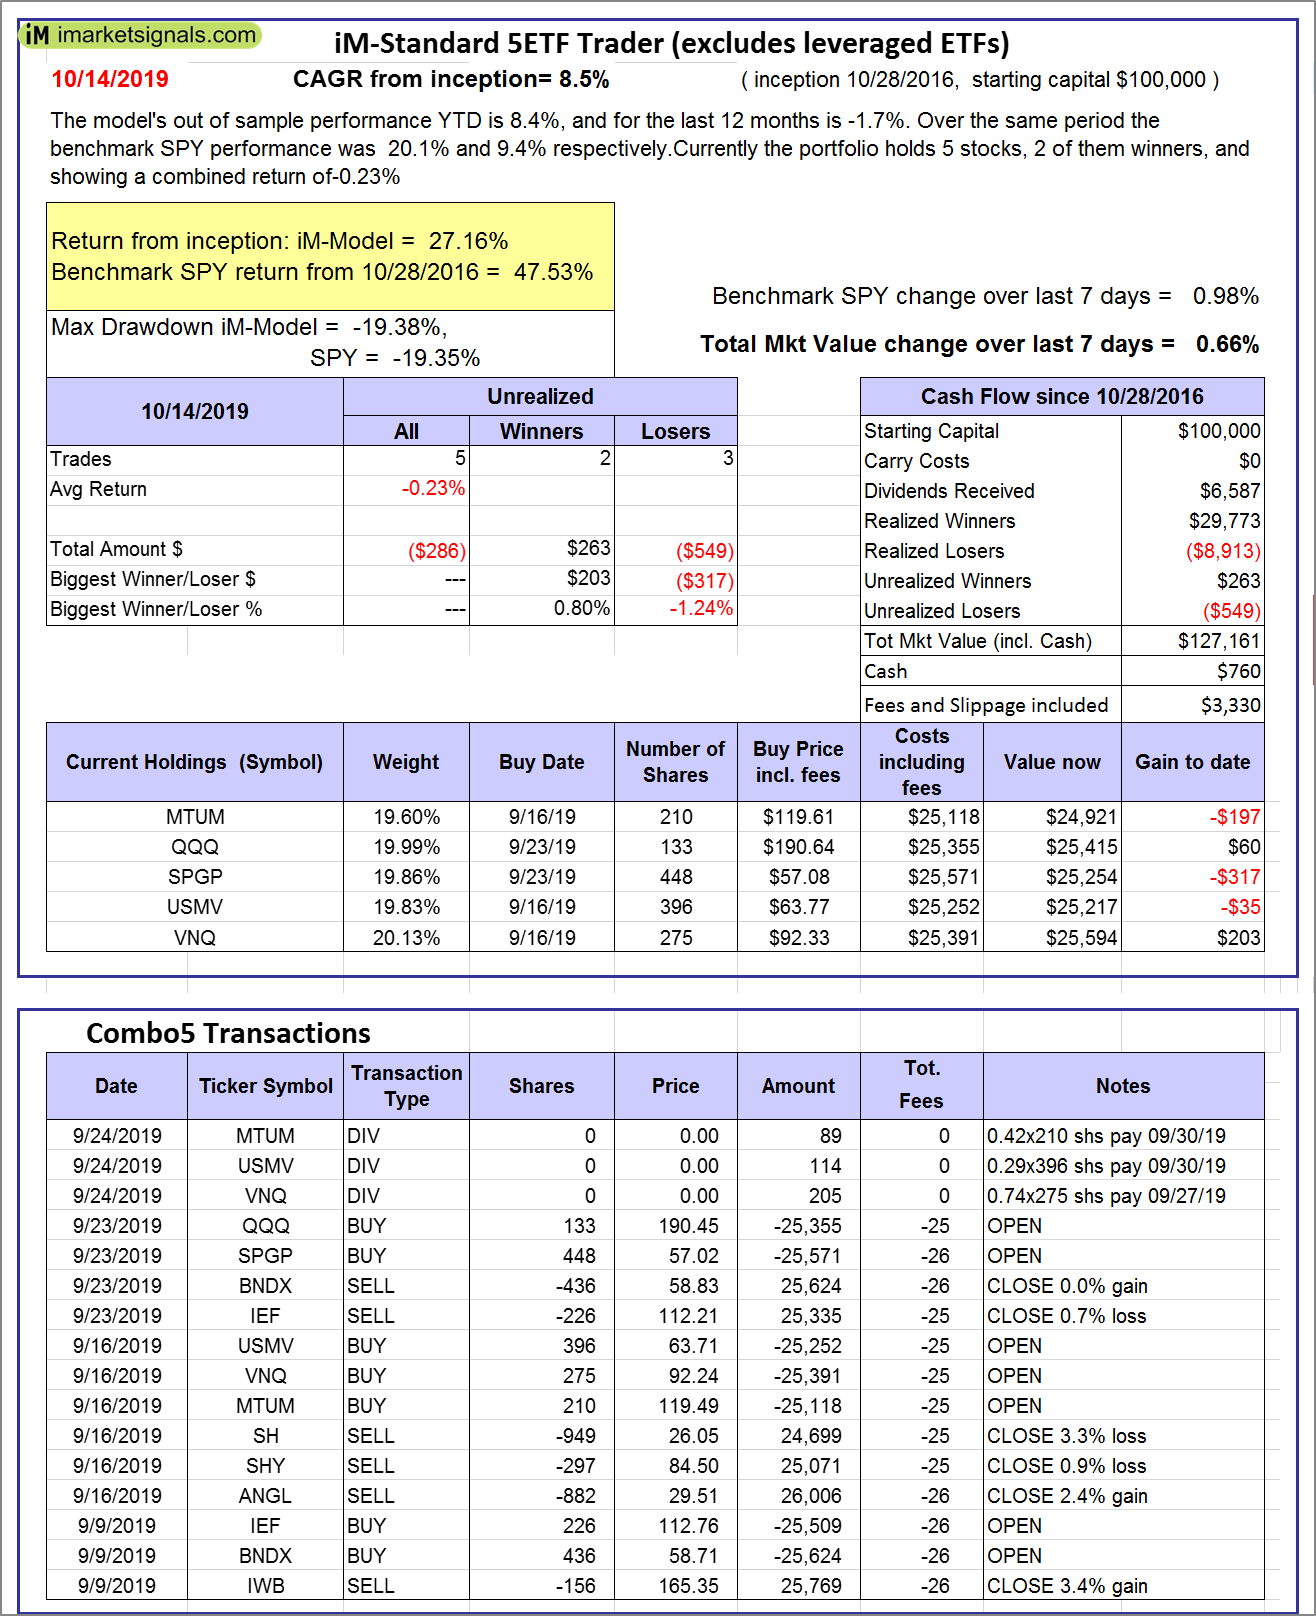 |
iM-Standard 5ETF Trader (excludes leveraged ETFs): The model’s out of sample performance YTD is 8.4%, and for the last 12 months is -1.7%. Over the same period the benchmark SPY performance was 20.1% and 9.4% respectively. Over the previous week the market value of the iM-Standard 5ETF Trader (excludes leveraged ETFs) gained 0.66% at a time when SPY gained 0.98%. A starting capital of $100,000 at inception on 10/30/2016 would have grown to $127,161 which includes $760 cash and excludes $3,330 spent on fees and slippage. |
iM-Best Reports – 10/14/2019
Posted in pmp SPY-SH
Leave a Reply
You must be logged in to post a comment.