
  |
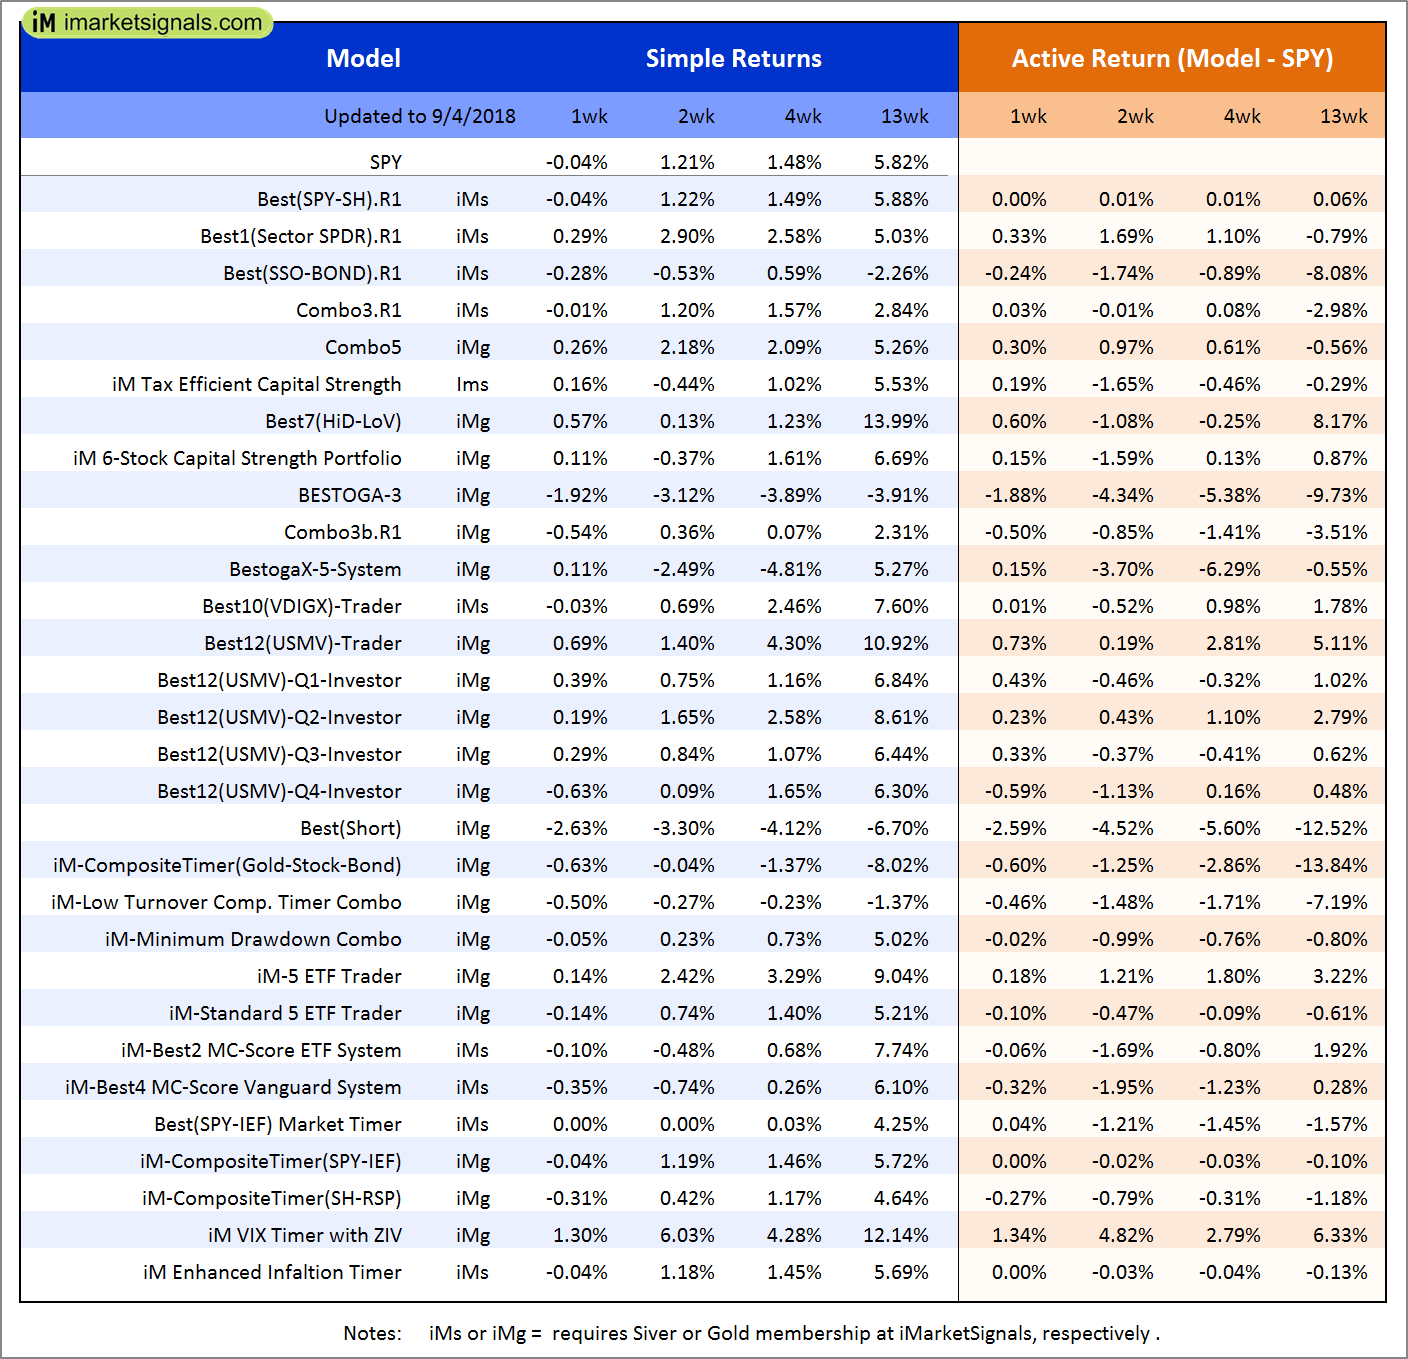
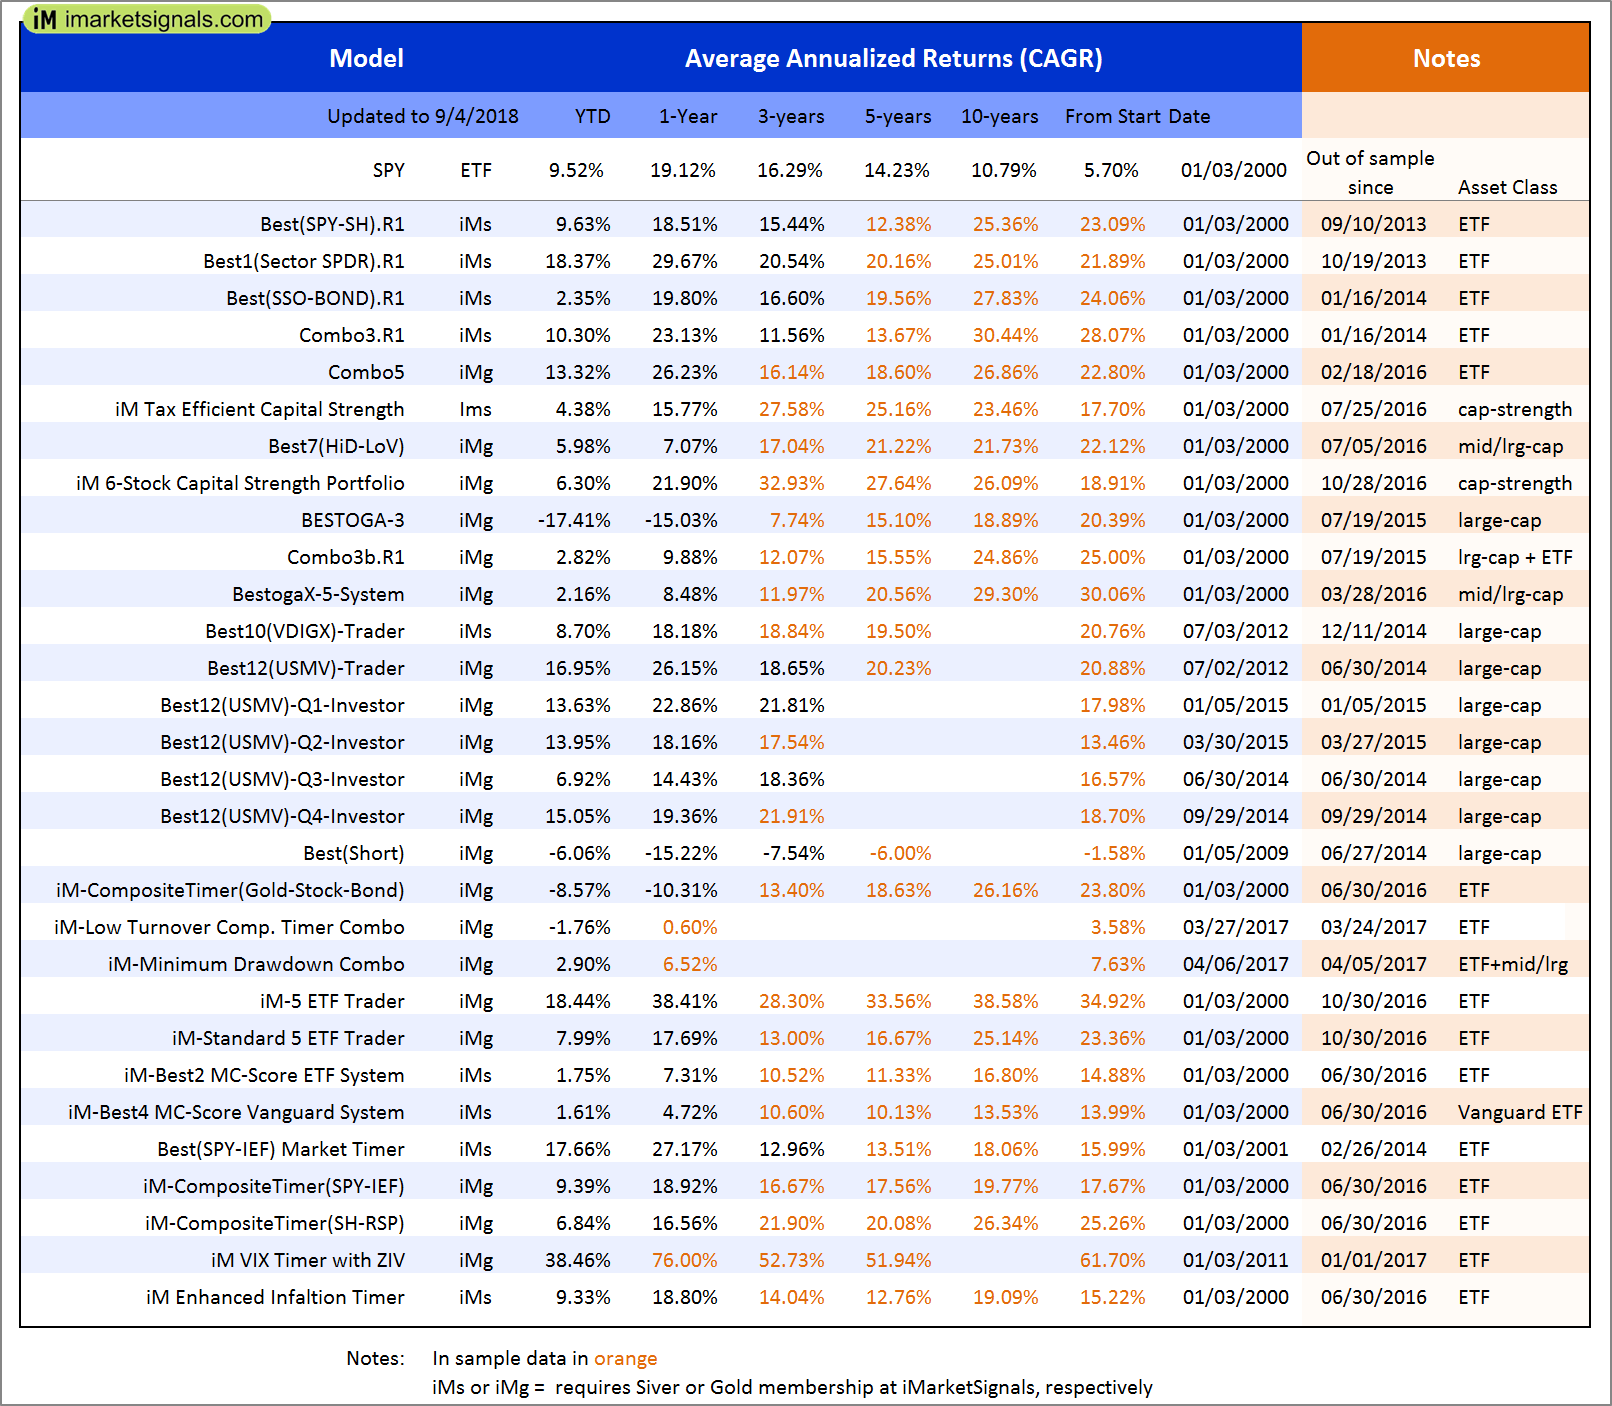
Out of sample performance summary of our models for the past 1, 2, 4 and 13 week periods. The active active return indicates how the models over- or underperformed the benchmark ETF SPY. Also the YTD, and the 1-, 3-, 5- and 10-year annualized returns are shown in the second table |
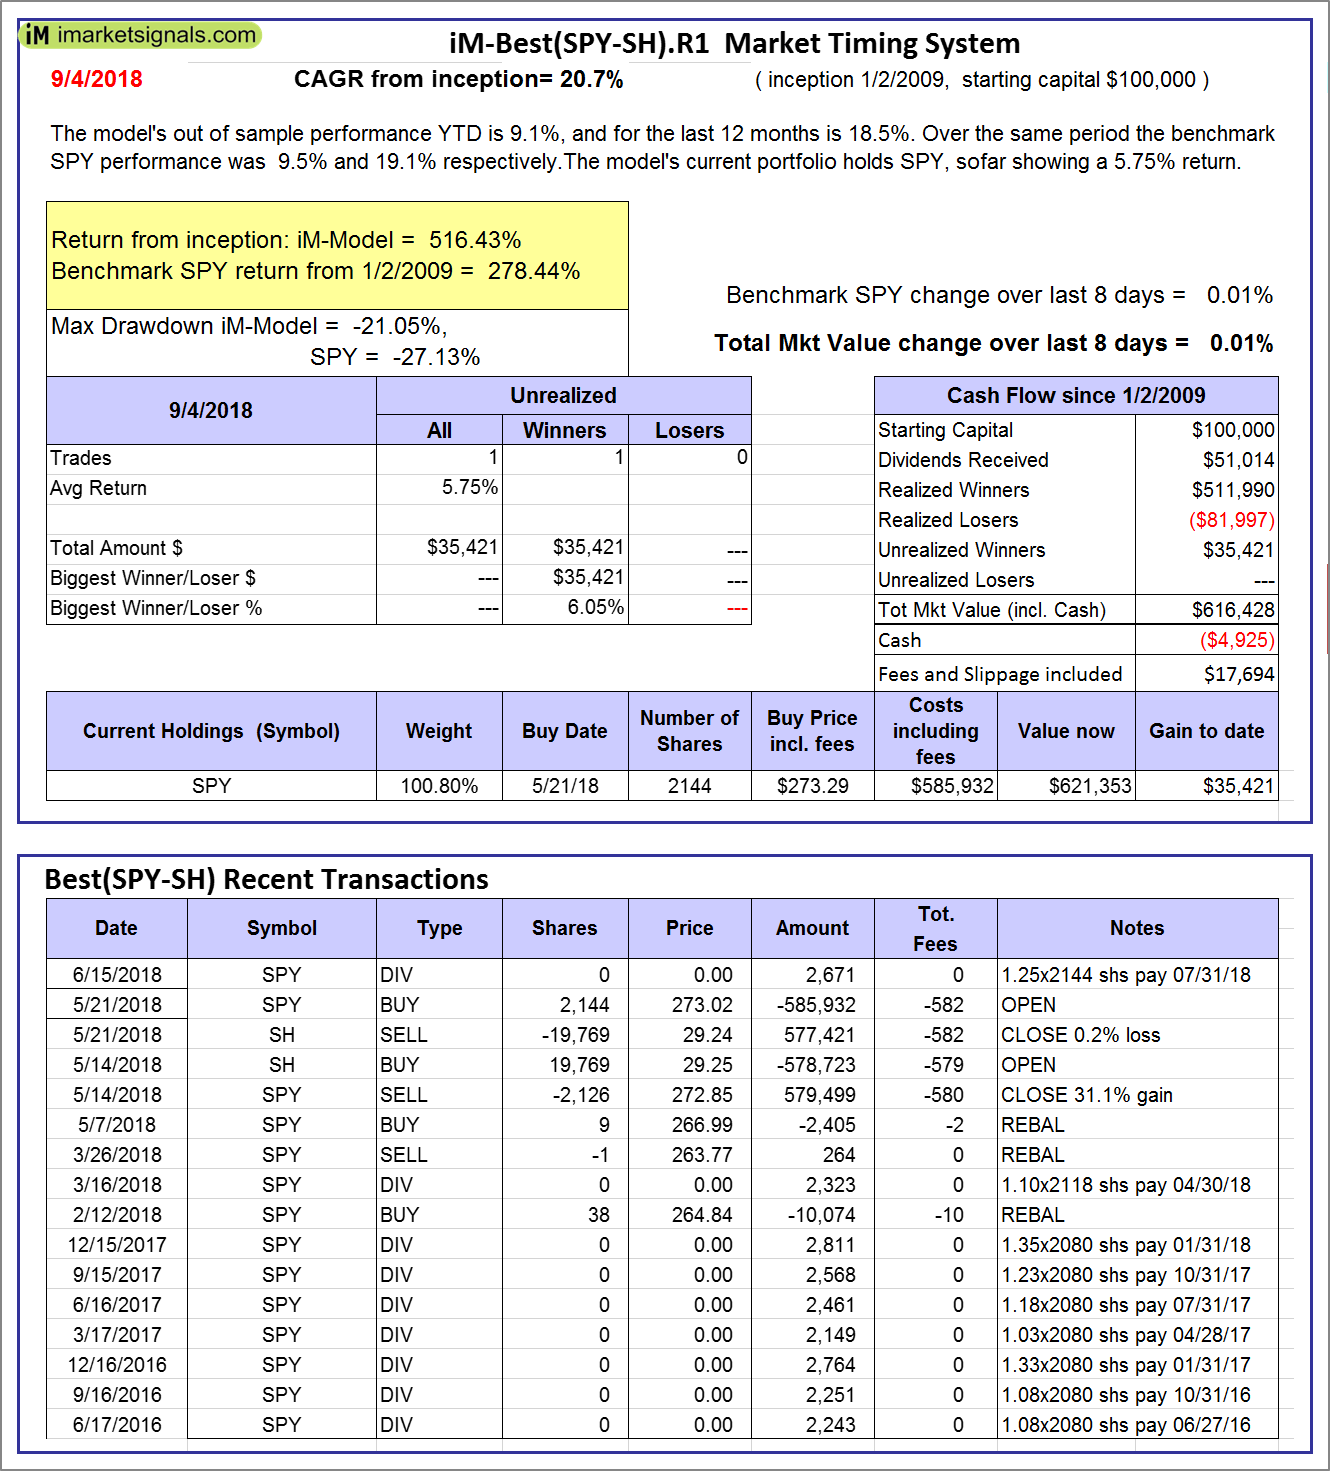 |
iM-Best(SPY-SH).R1: The model’s out of sample performance YTD is 9.1%, and for the last 12 months is 18.5%. Over the same period the benchmark SPY performance was 9.5% and 19.1% respectively. Over the previous week the market value of Best(SPY-SH) gained 0.01% at a time when SPY gained 0.01%. A starting capital of $100,000 at inception on 1/2/2009 would have grown to $616,428 which includes -$4,925 cash and excludes $17,694 spent on fees and slippage. |
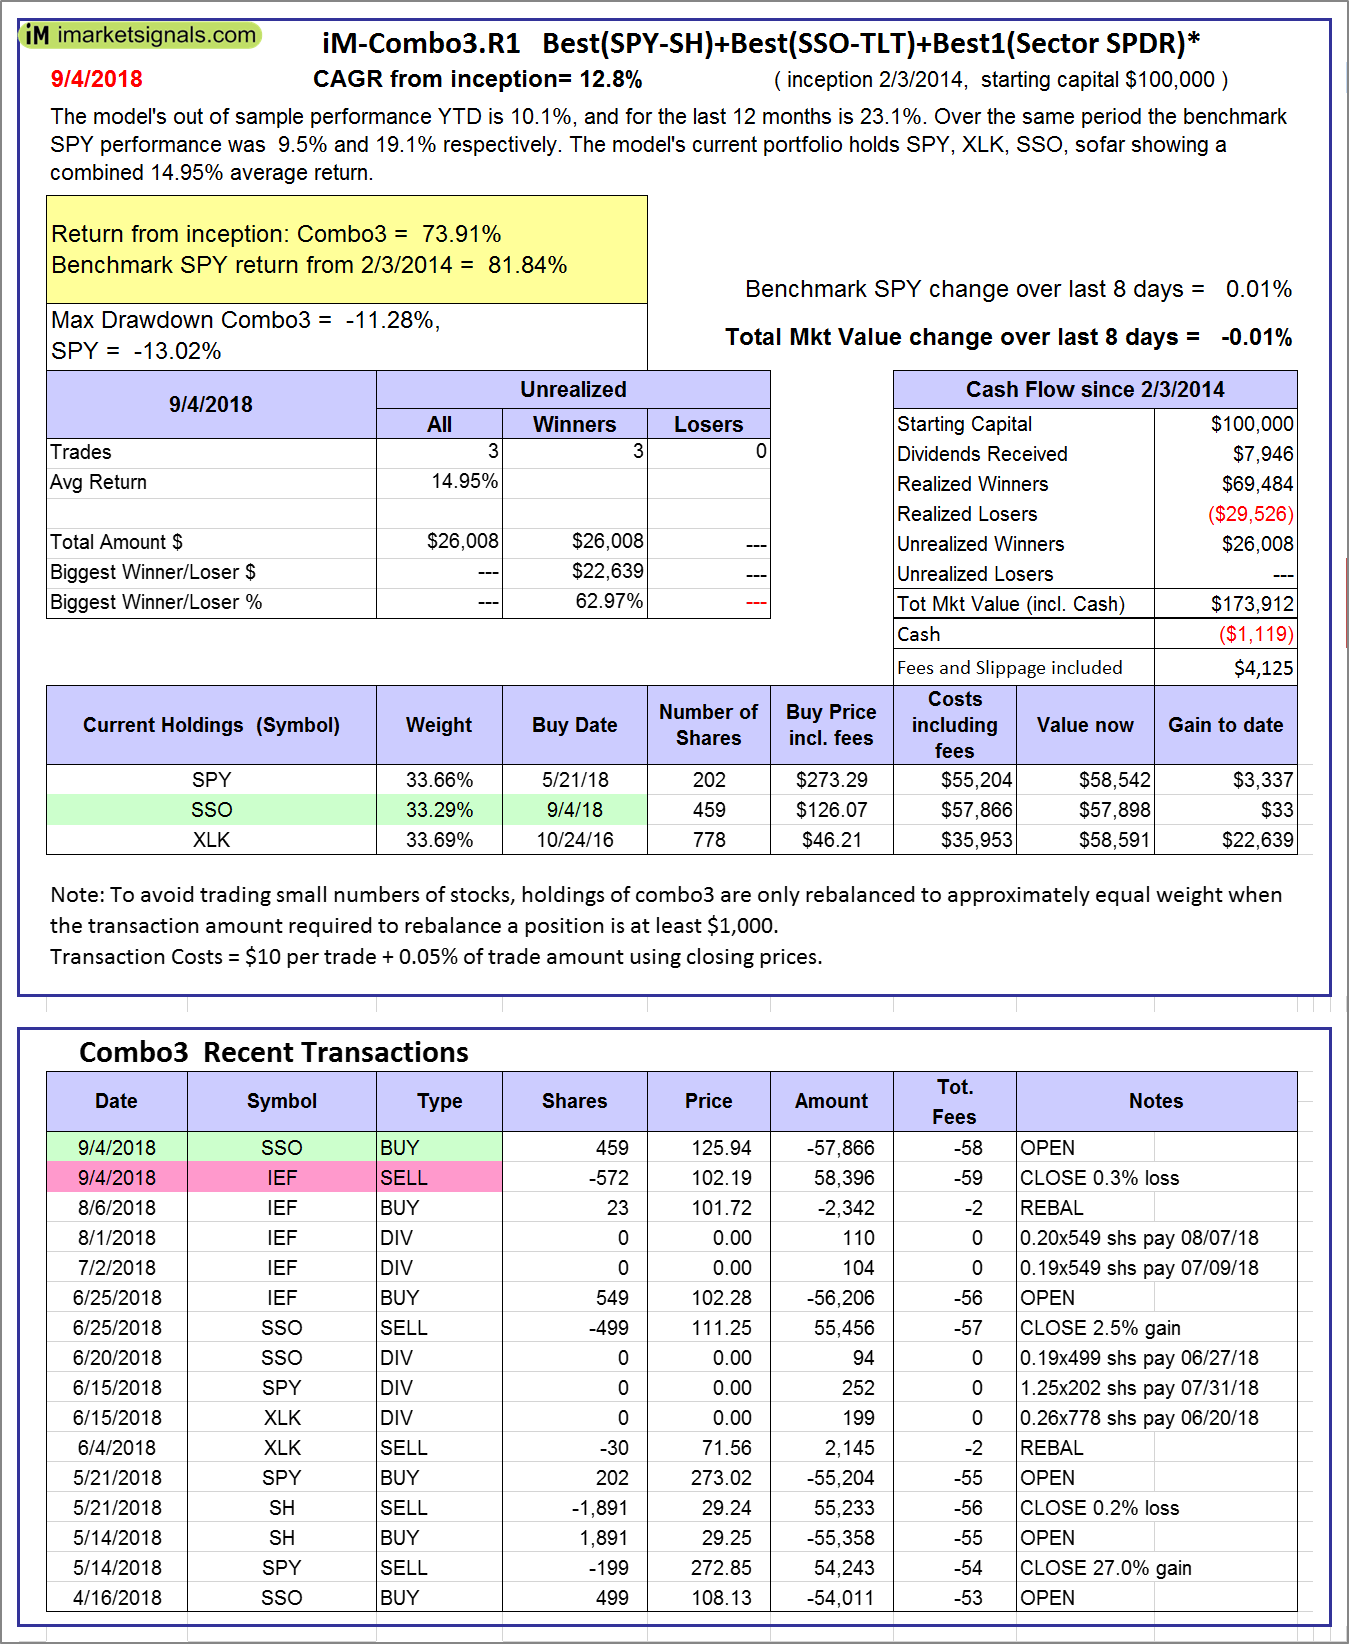 |
iM-Combo3.R1: The model’s out of sample performance YTD is 10.1%, and for the last 12 months is 23.1%. Over the same period the benchmark SPY performance was 9.5% and 19.1% respectively. Over the previous week the market value of iM-Combo3.R1 gained -0.01% at a time when SPY gained 0.01%. A starting capital of $100,000 at inception on 2/3/2014 would have grown to $173,912 which includes -$1,119 cash and excludes $4,125 spent on fees and slippage. |
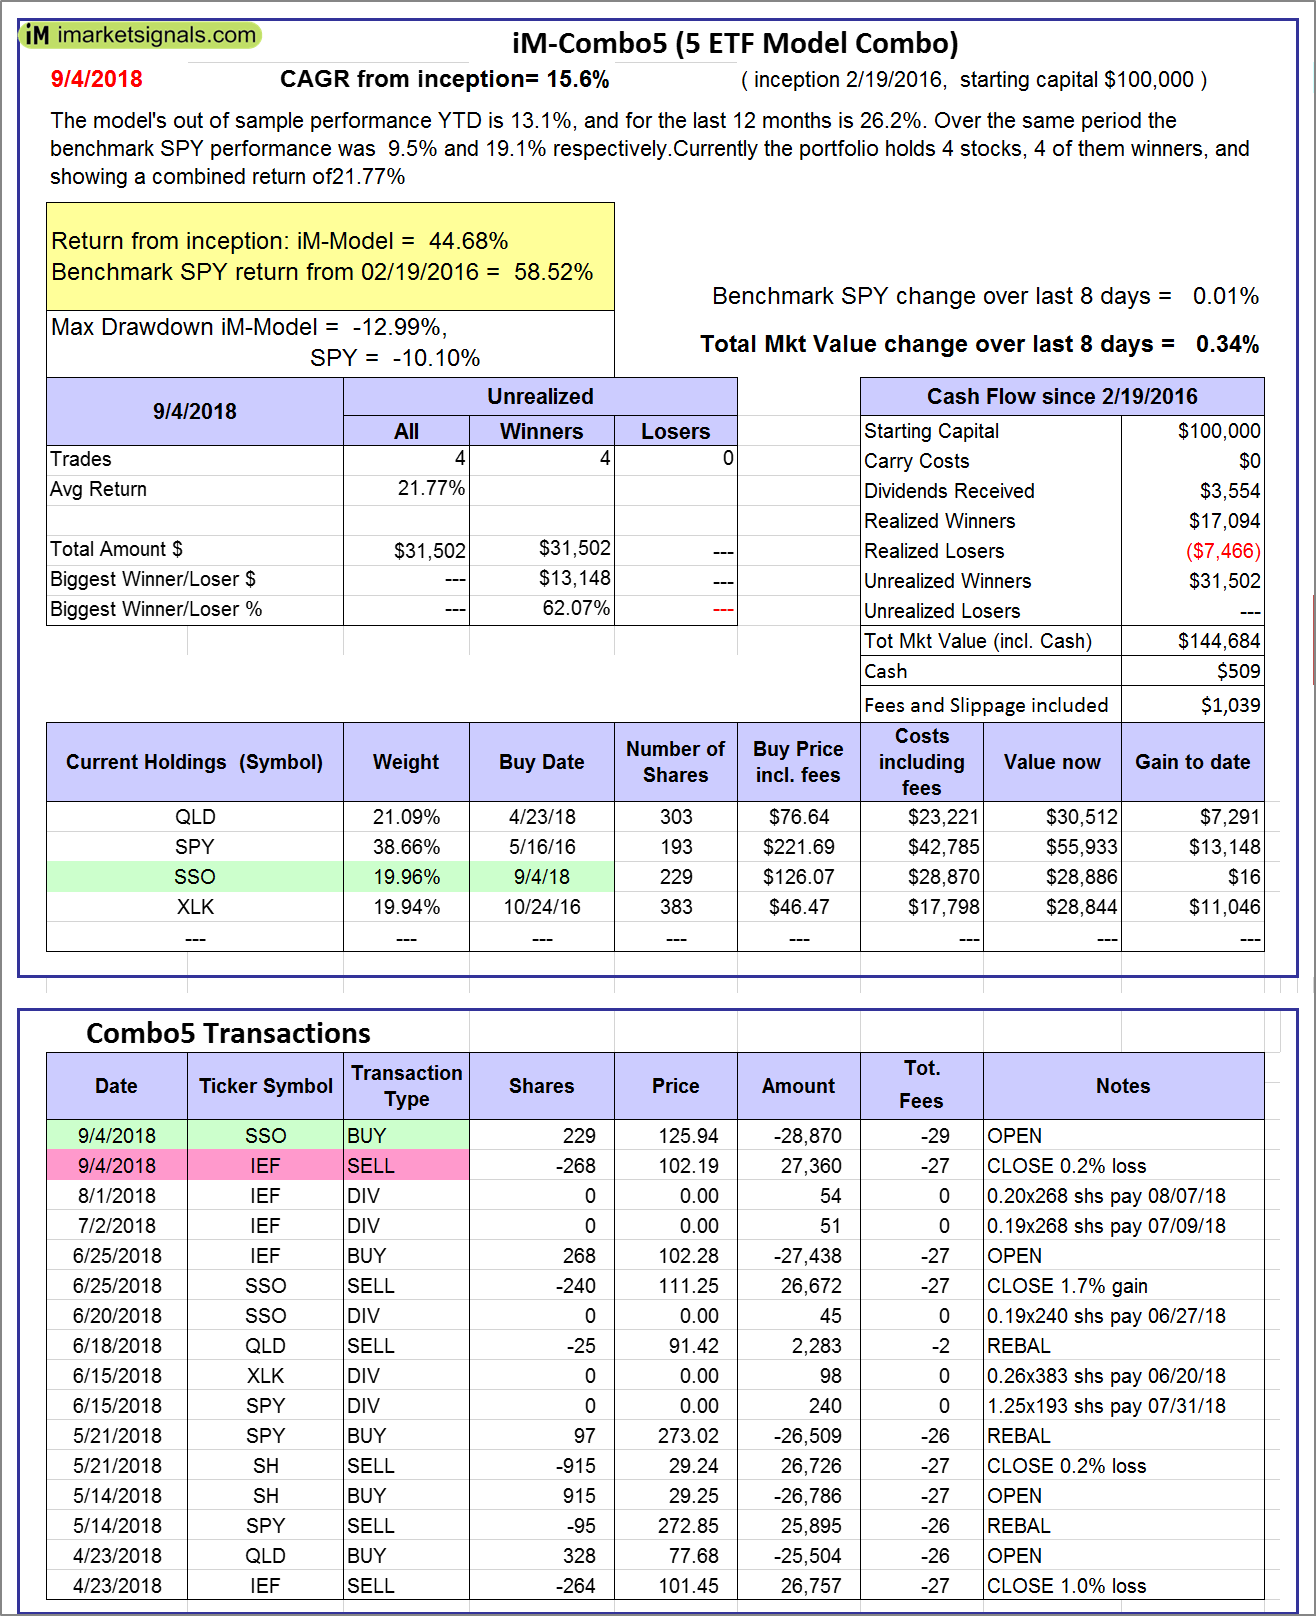 |
iM-Combo5: The model’s out of sample performance YTD is 13.1%, and for the last 12 months is 26.2%. Over the same period the benchmark SPY performance was 9.5% and 19.1% respectively. Over the previous week the market value of iM-Combo5 gained 0.34% at a time when SPY gained 0.01%. A starting capital of $100,000 at inception on 2/22/2016 would have grown to $144,684 which includes $509 cash and excludes $1,039 spent on fees and slippage. |
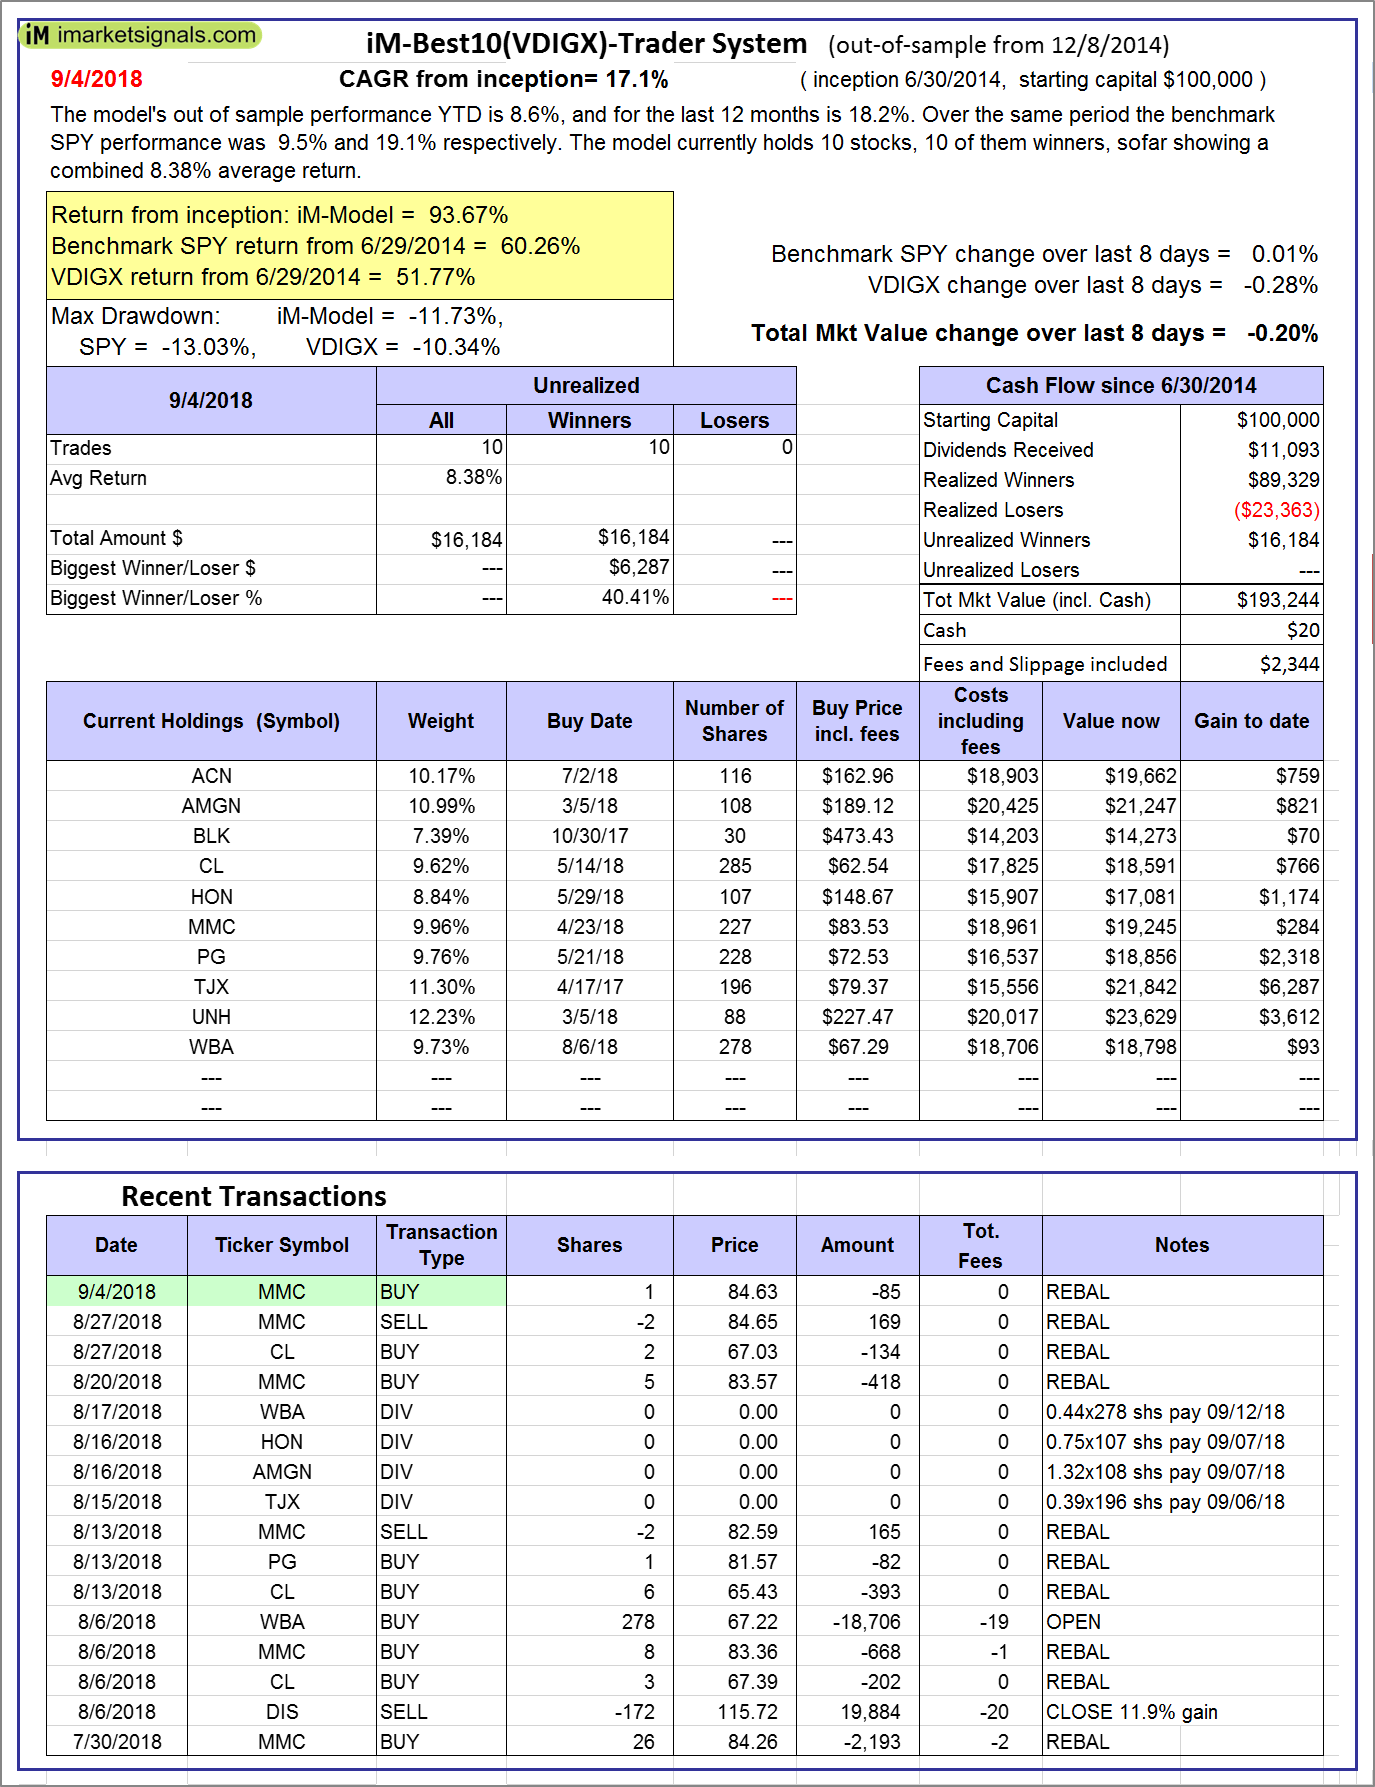 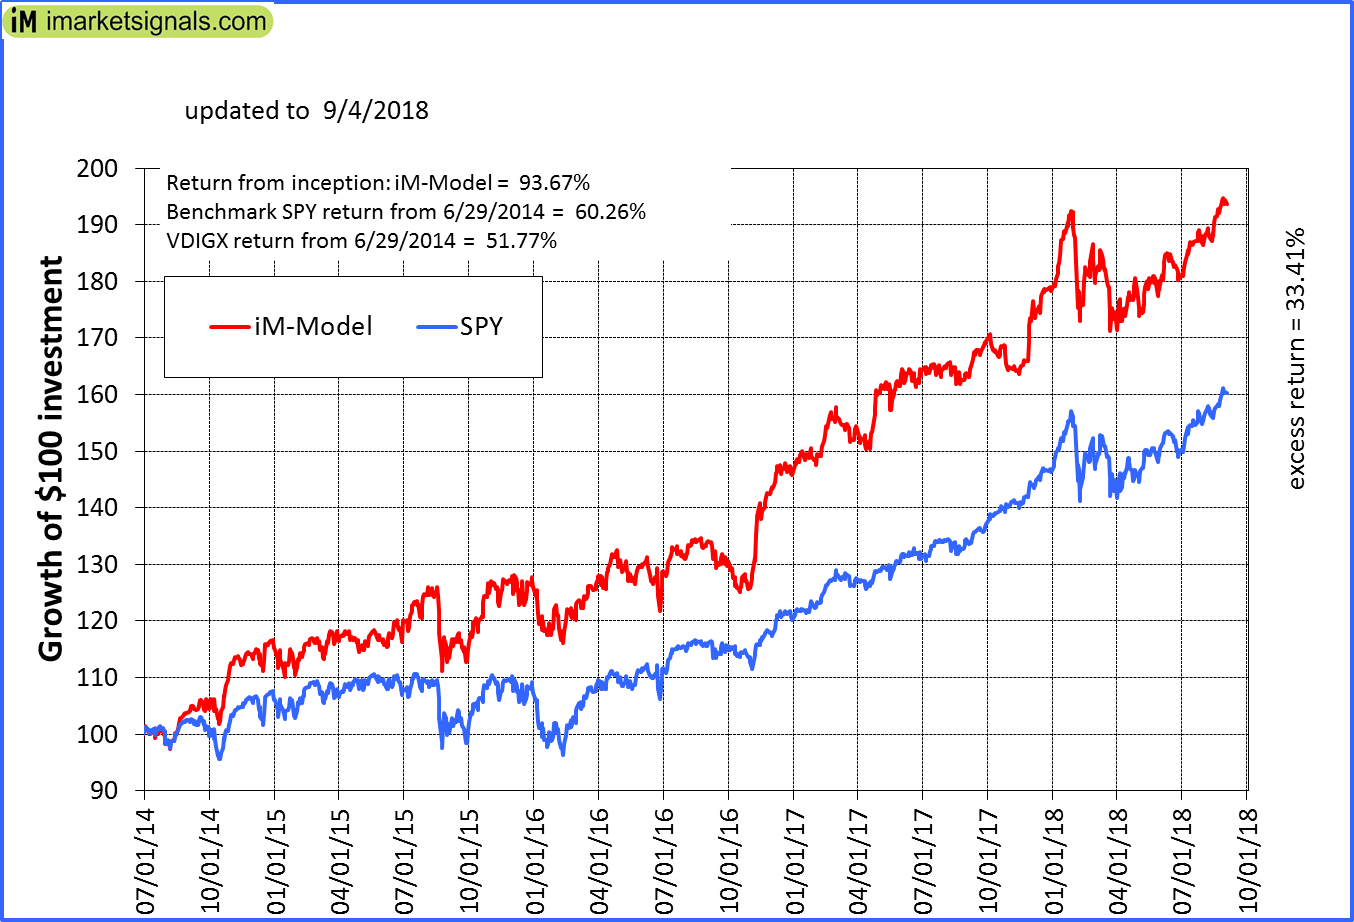 |
iM-Best10(VDIGX)-Trader: The model’s out of sample performance YTD is 8.6%, and for the last 12 months is 18.2%. Over the same period the benchmark SPY performance was 9.5% and 19.1% respectively. Since inception, on 7/1/2014, the model gained 93.67% while the benchmark SPY gained 60.26% and VDIGX gained 51.77% over the same period. Over the previous week the market value of iM-Best10(VDIGX) gained -0.20% at a time when SPY gained 0.01%. A starting capital of $100,000 at inception on 7/1/2014 would have grown to $193,244 which includes $20 cash and excludes $2,344 spent on fees and slippage. |
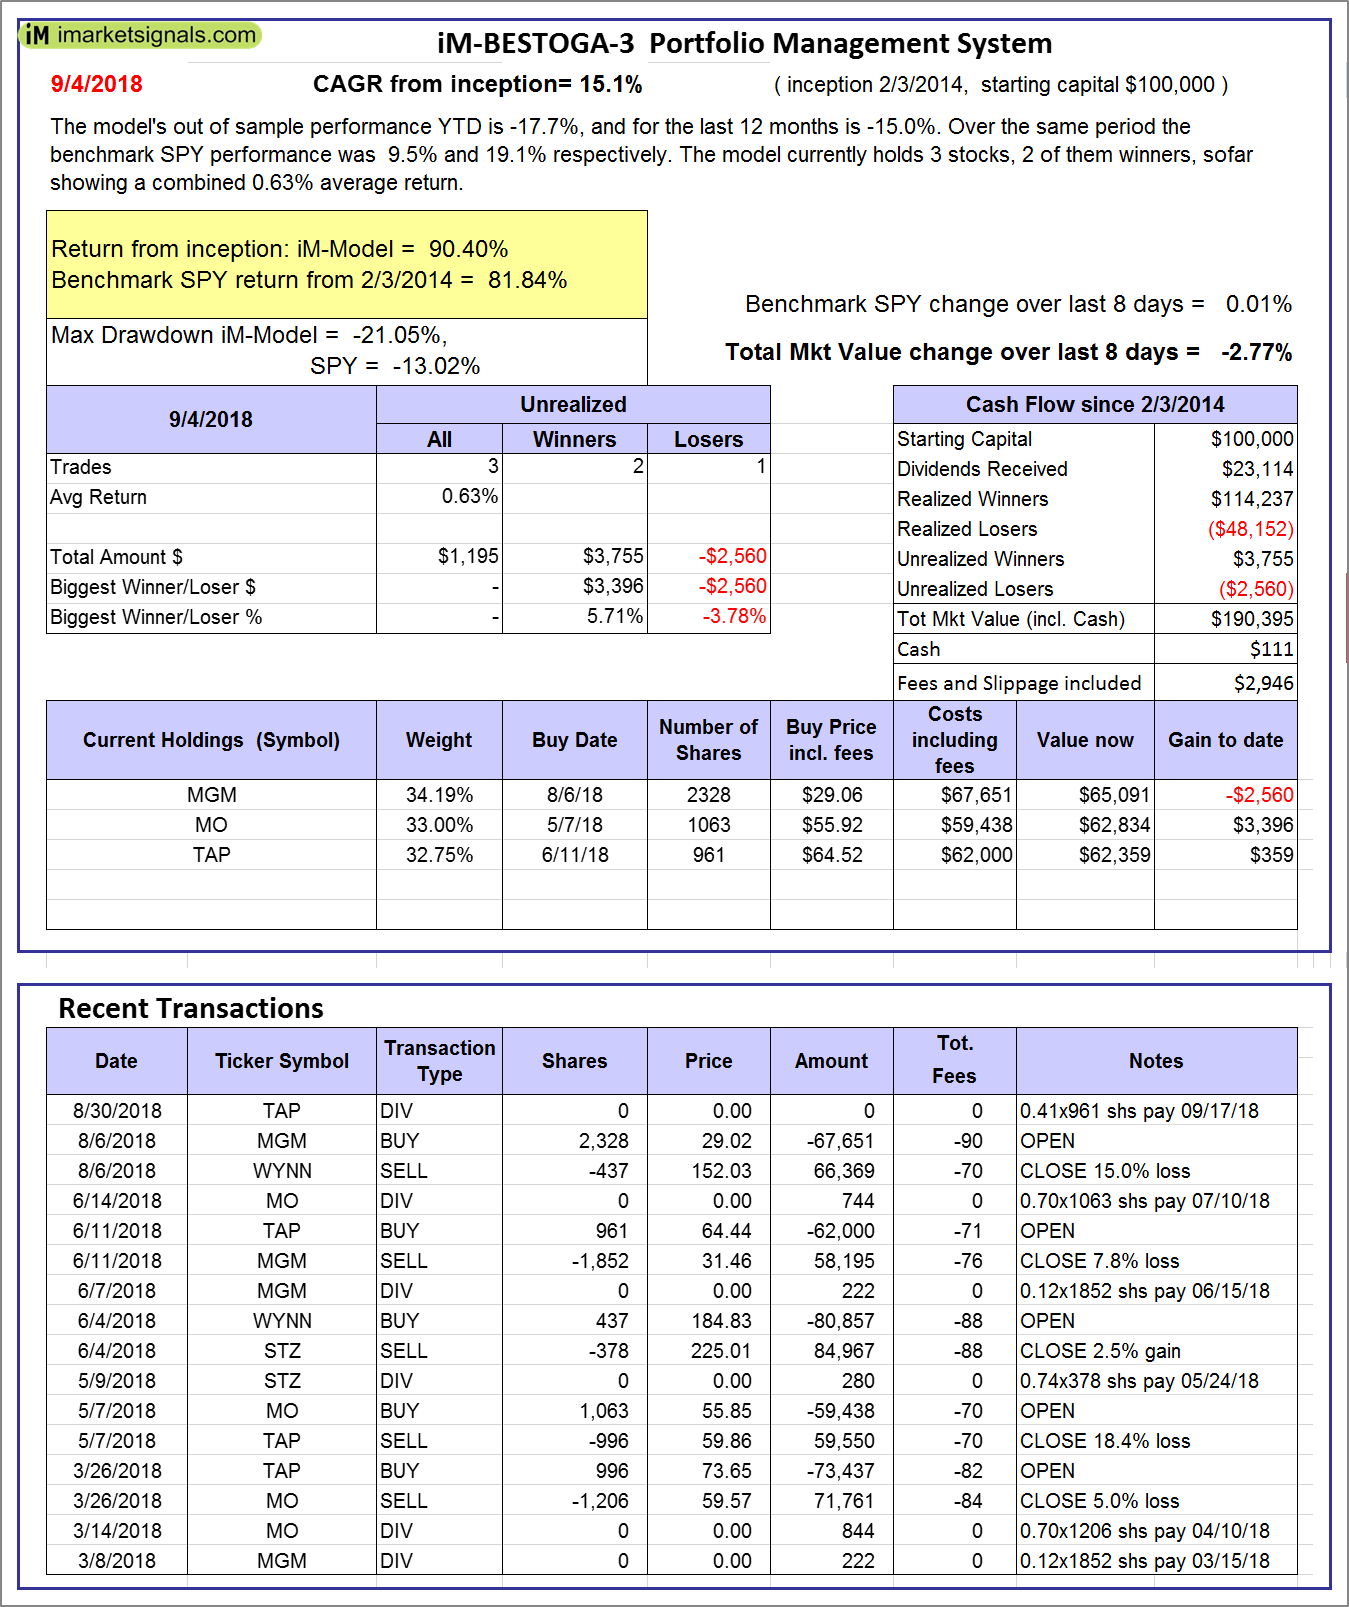 |
iM-BESTOGA-3: The model’s out of sample performance YTD is -17.7%, and for the last 12 months is -15.0%. Over the same period the benchmark SPY performance was 9.5% and 19.1% respectively. Over the previous week the market value of iM-BESTOGA-3 gained -2.77% at a time when SPY gained 0.01%. A starting capital of $100,000 at inception on 2/3/2014 would have grown to $190,395 which includes $111 cash and excludes $2,946 spent on fees and slippage. |
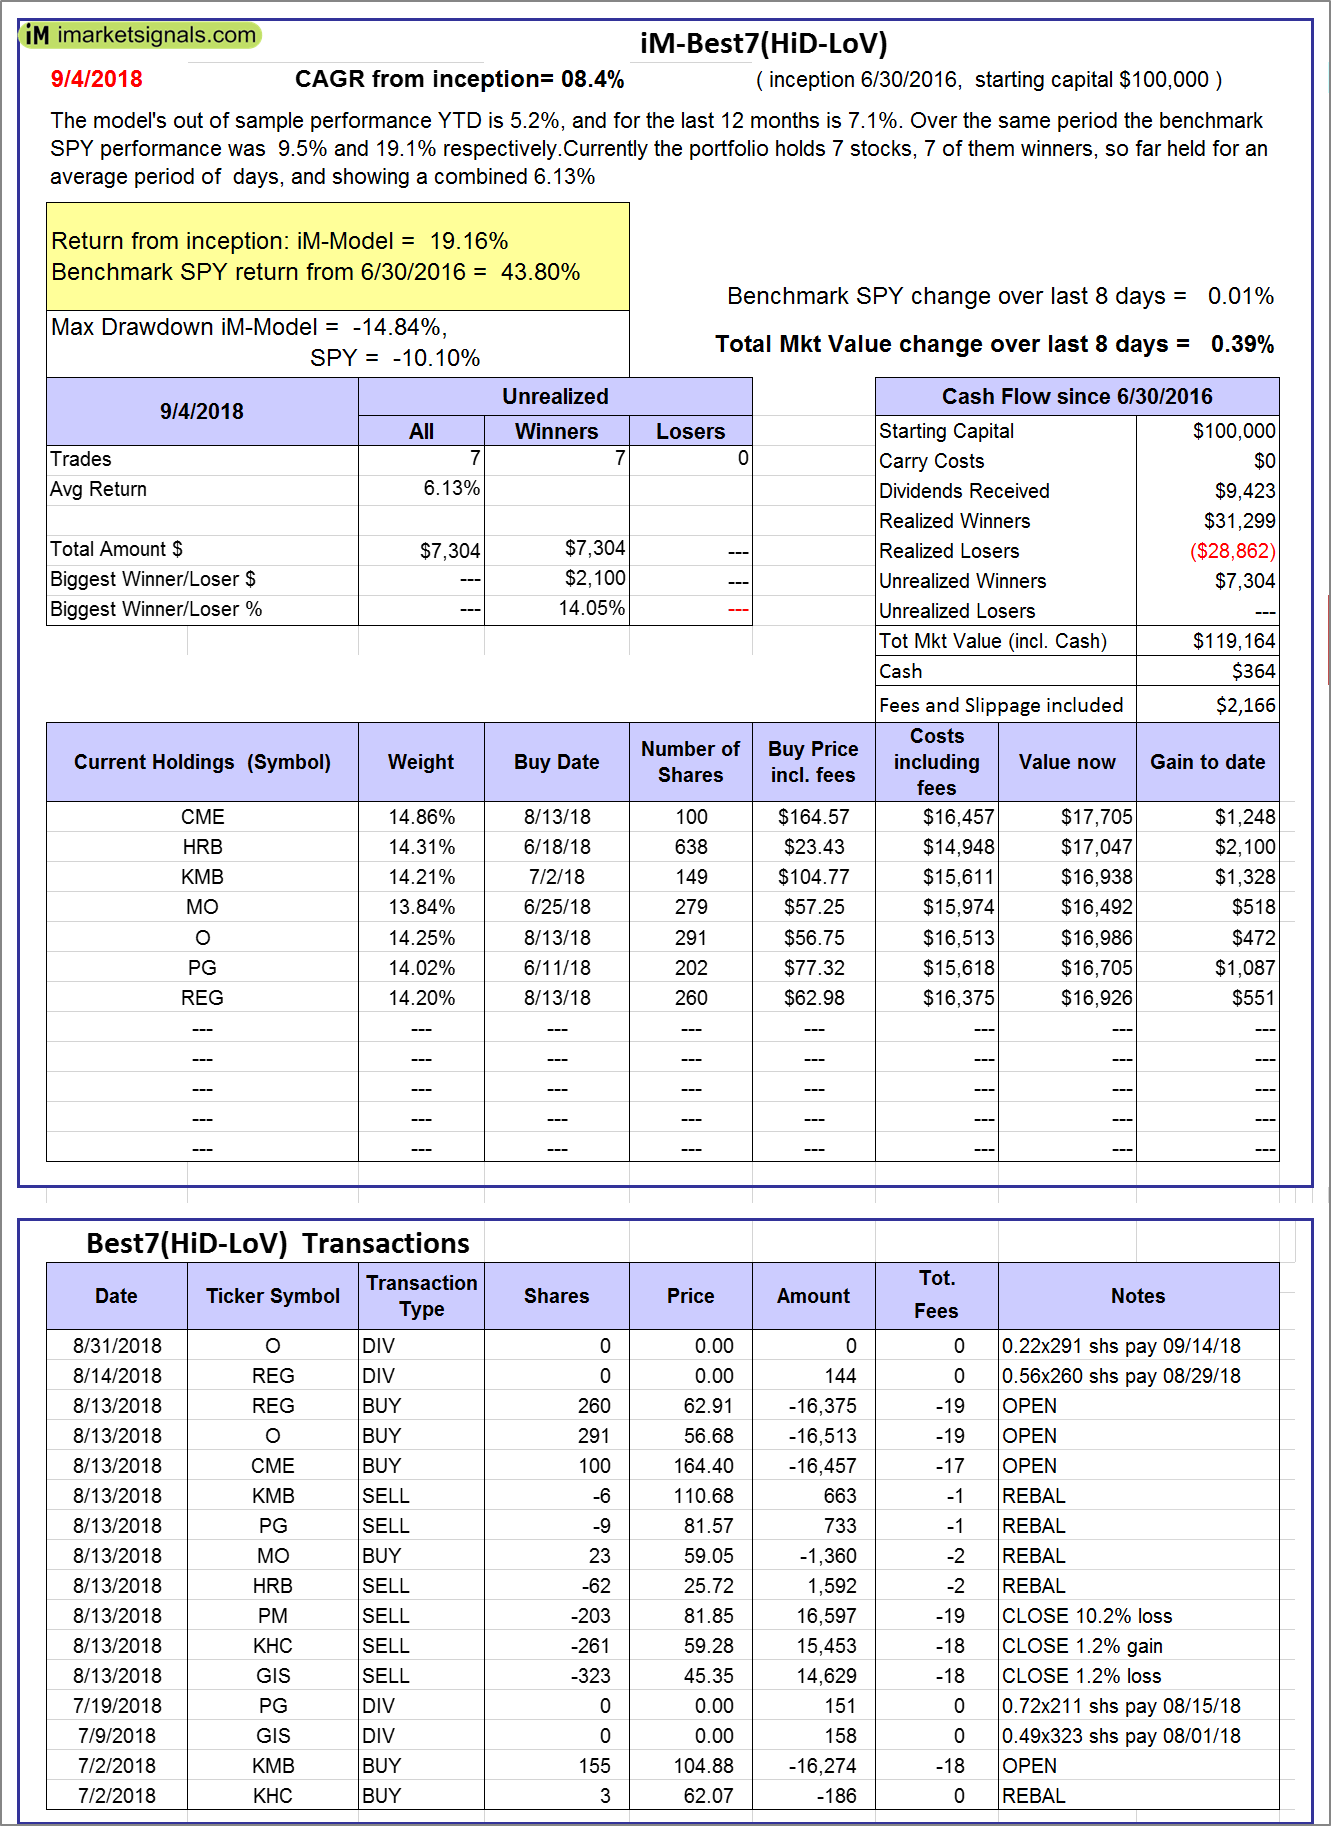 |
iM-Best7(HiD-LoV): The model’s out of sample performance YTD is 5.2%, and for the last 12 months is 7.1%. Over the same period the benchmark SPY performance was 9.5% and 19.1% respectively. Over the previous week the market value of iM-BESTOGA-3 gained 0.39% at a time when SPY gained 0.01%. A starting capital of $100,000 at inception on 6/30/2016 would have grown to $119,164 which includes $364 cash and excludes $2,166 spent on fees and slippage. |
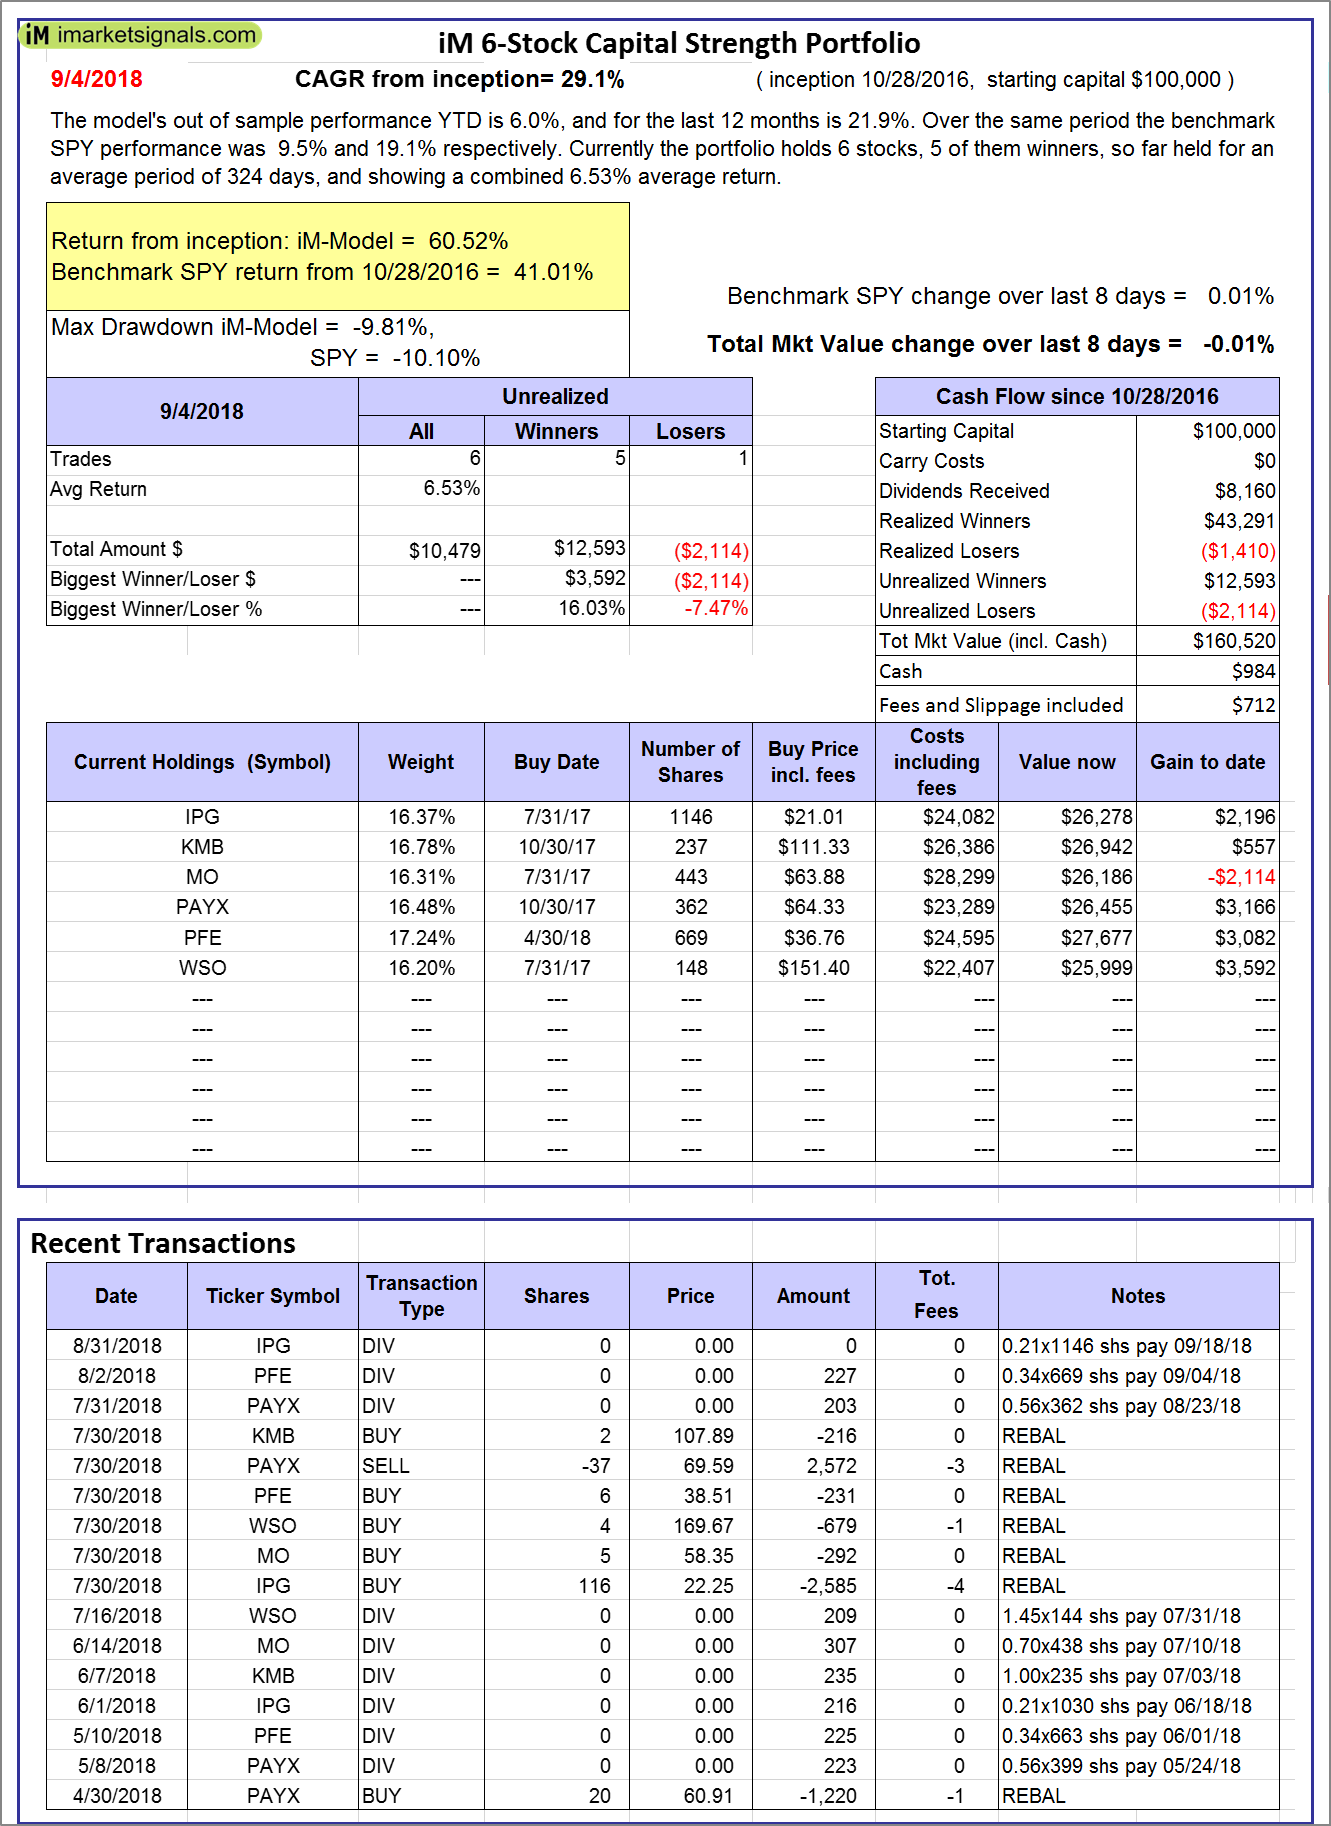 |
iM 6-Stock Capital Strength Portfolio: The model’s out of sample performance YTD is 6.0%, and for the last 12 months is 21.9%. Over the same period the benchmark SPY performance was 9.5% and 19.1% respectively. Over the previous week the market value of the iM 6-Stock Capital Strength Portfolio gained -0.01% at a time when SPY gained 0.01%. A starting capital of $100,000 at inception on 10/28/2016 would have grown to $160,520 which includes $984 cash and excludes $712 spent on fees and slippage. |
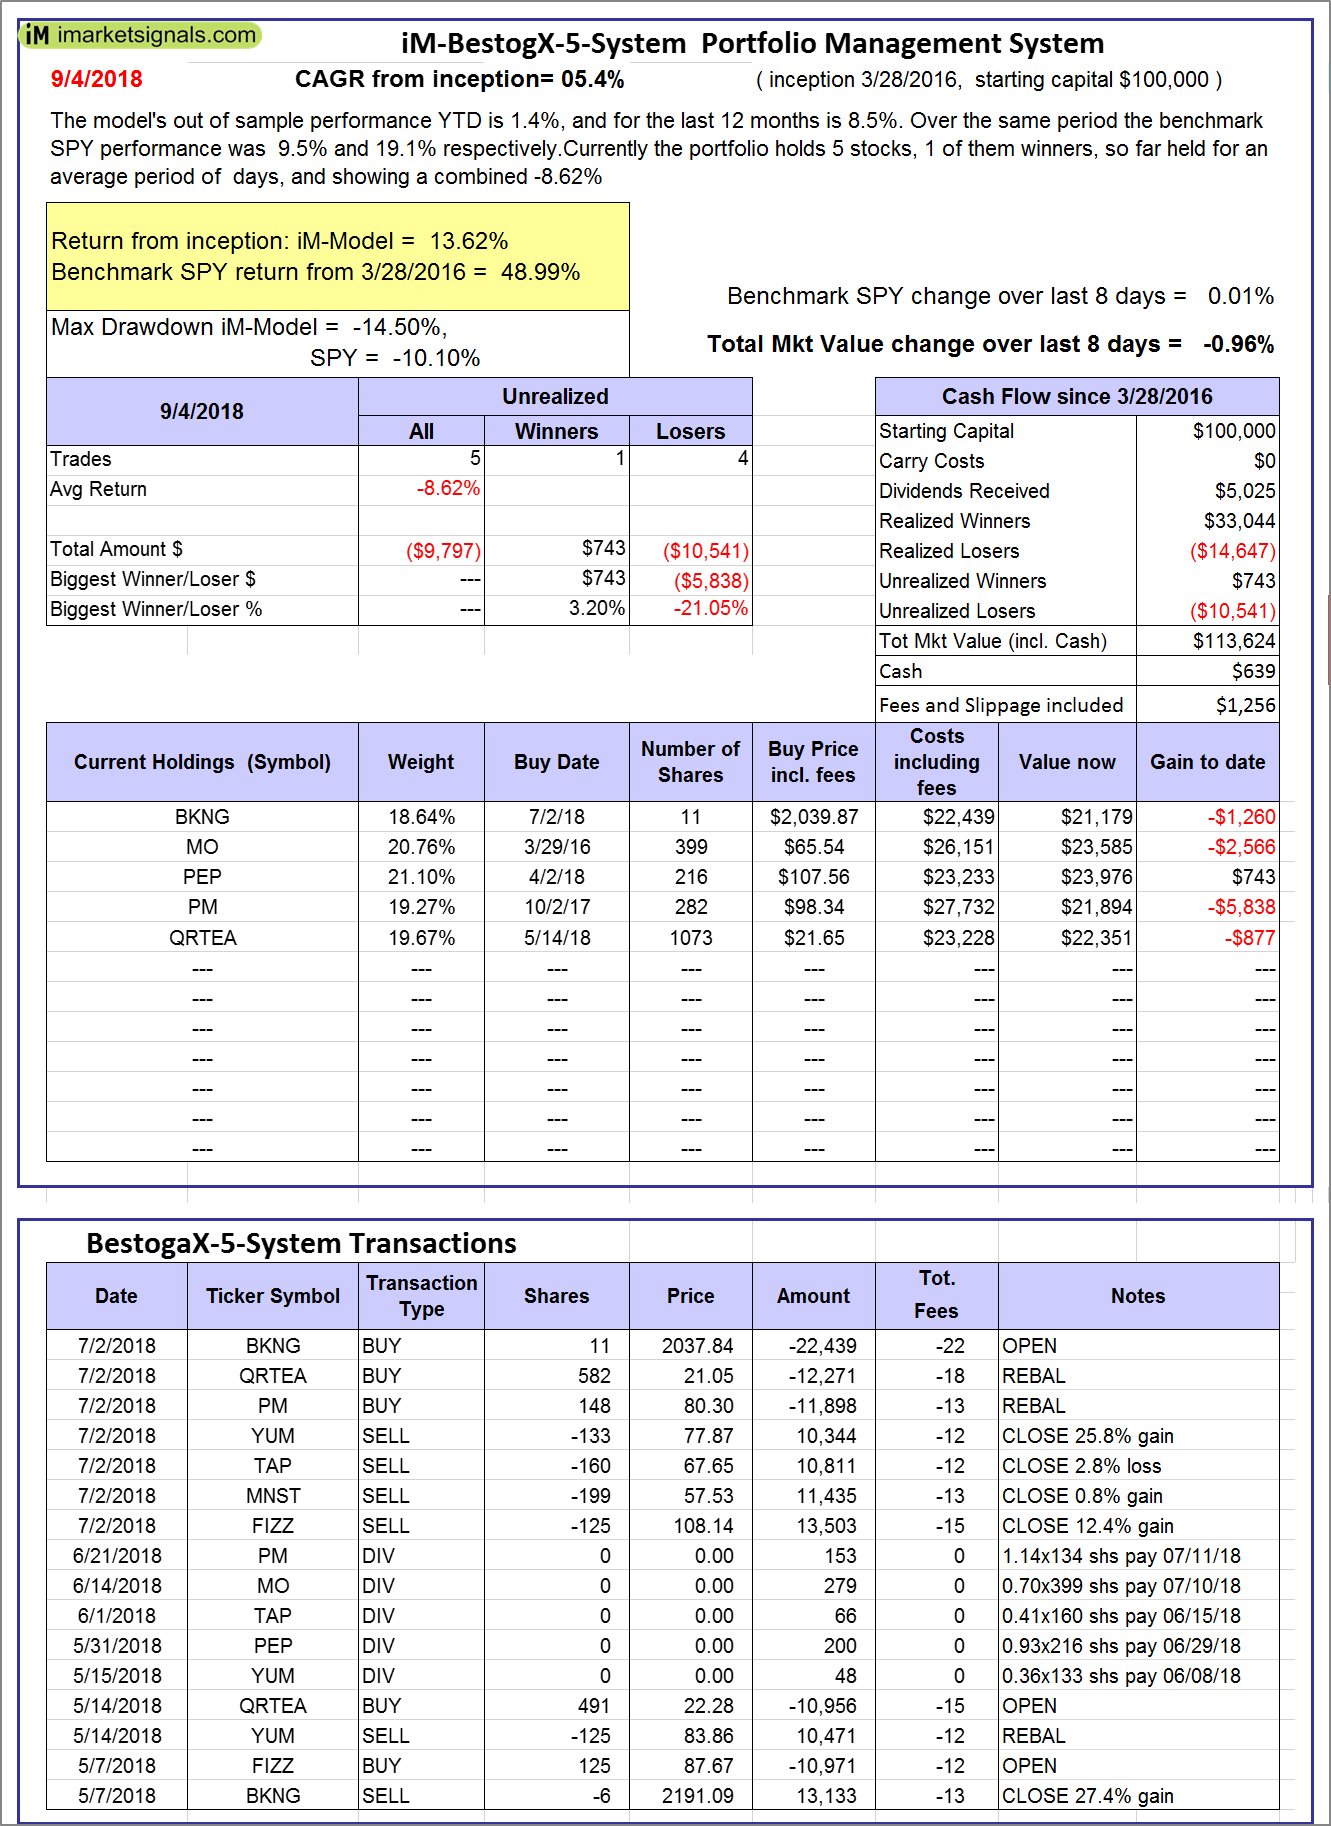 |
iM-BestogaX5-System: The model’s out of sample performance YTD is 1.4%, and for the last 12 months is 8.5%. Over the same period the benchmark SPY performance was 9.5% and 19.1% respectively. Over the previous week the market value of iM-BestogaX5-System gained -0.96% at a time when SPY gained 0.01%. A starting capital of $100,000 at inception on 3/28/2016 would have grown to $113,624 which includes $639 cash and excludes $1,256 spent on fees and slippage. |
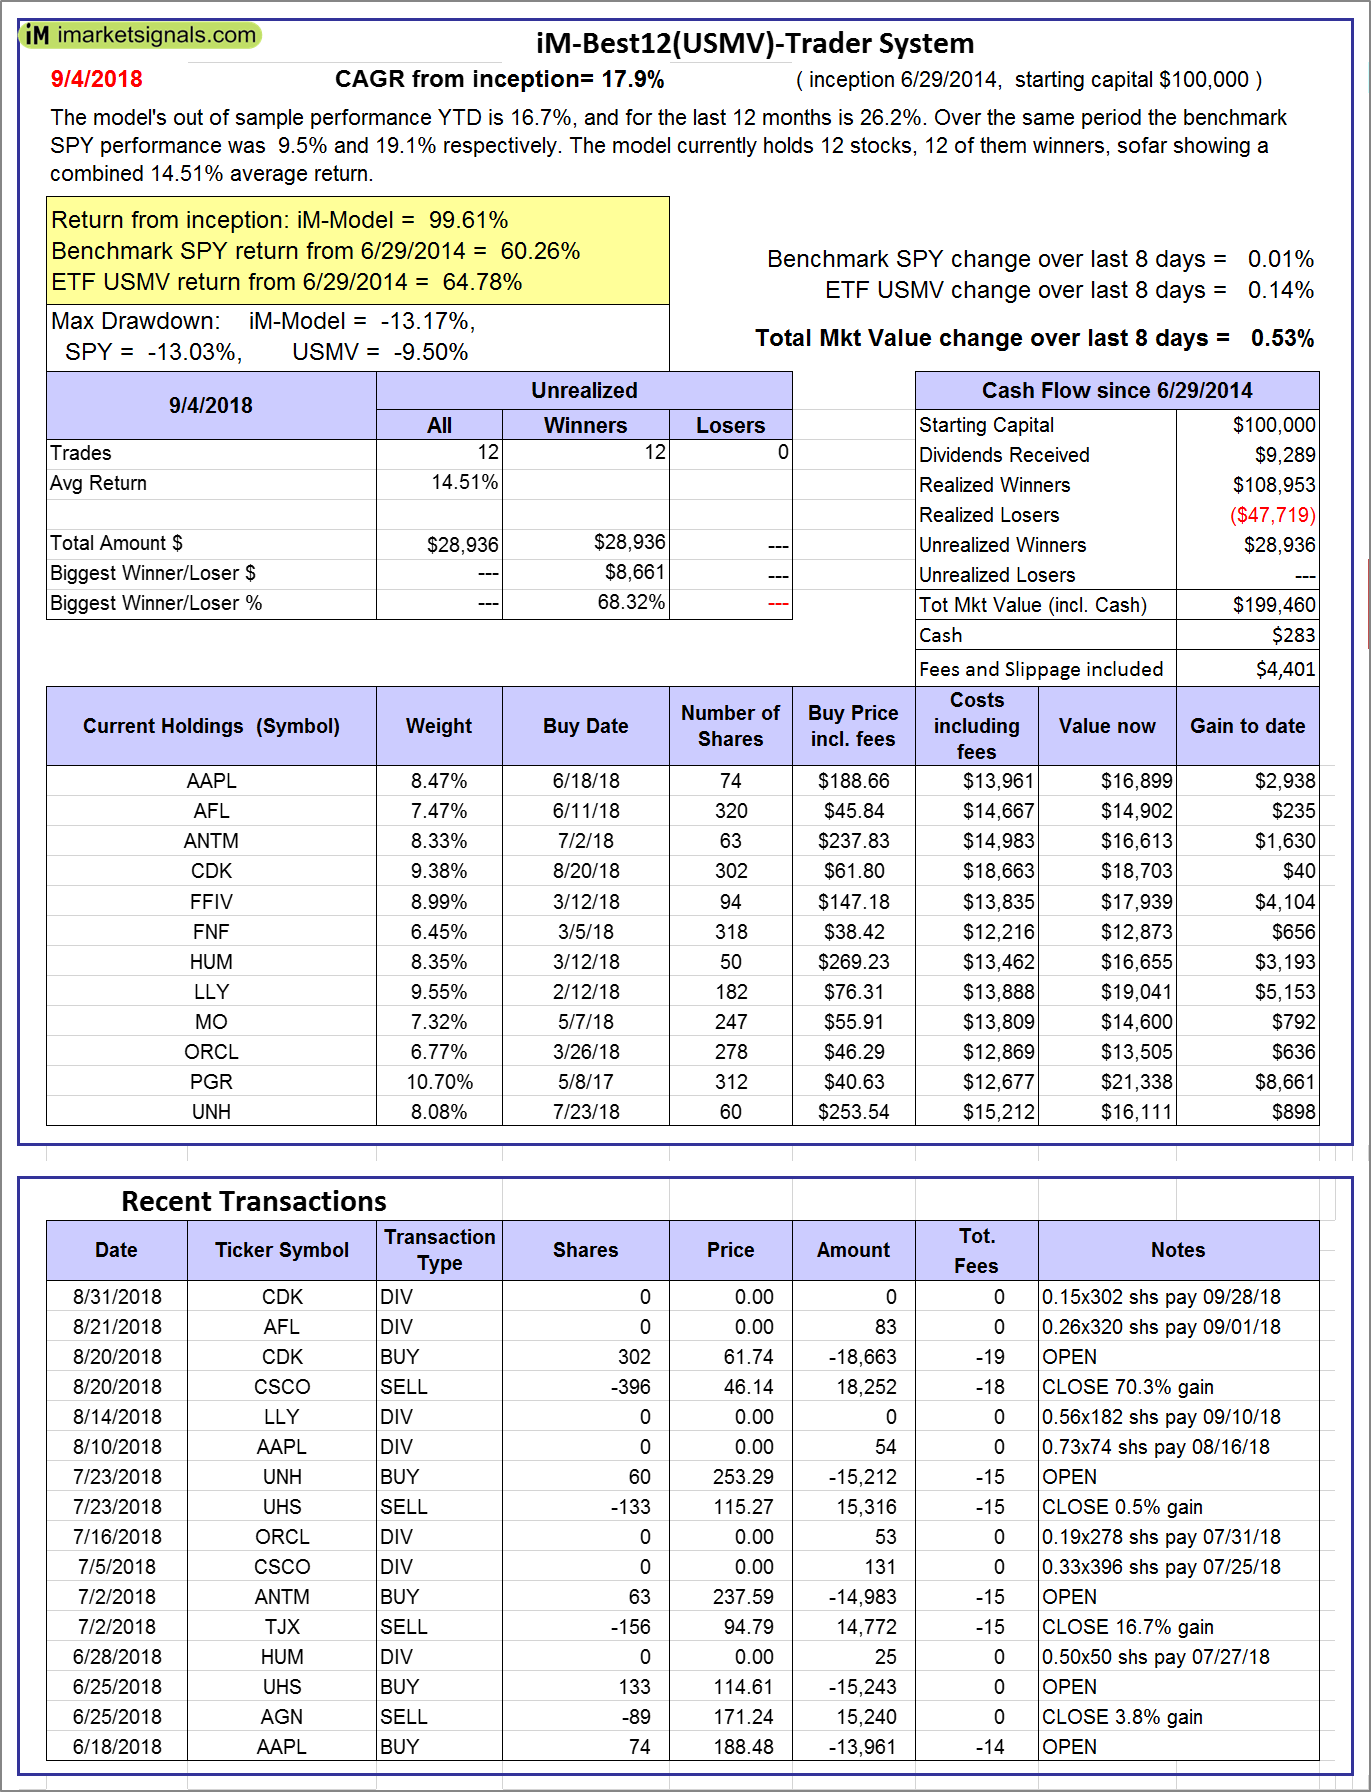 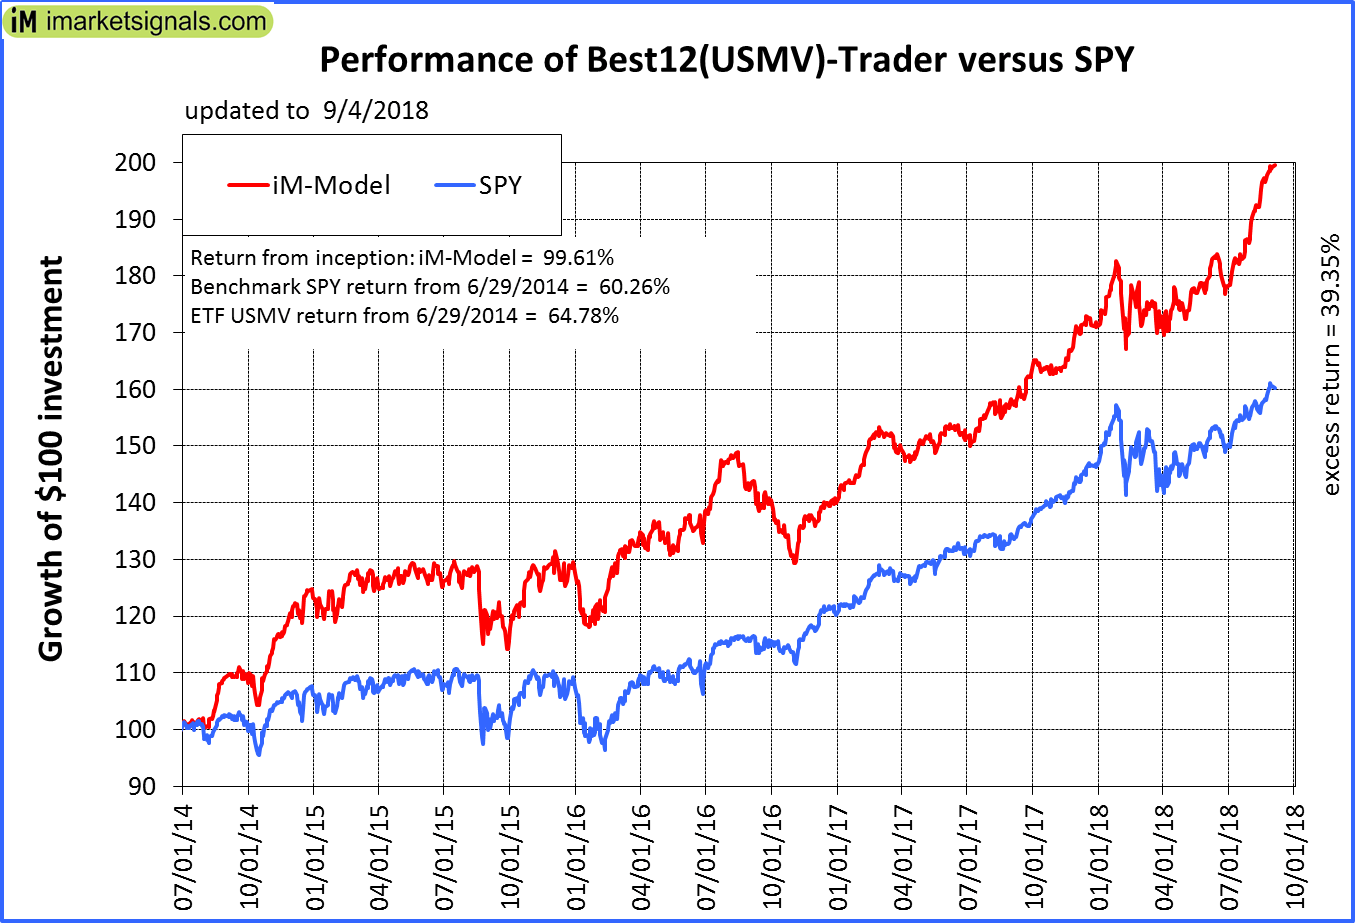 |
iM-Best12(USMV)-Trader: The model’s out of sample performance YTD is 16.7%, and for the last 12 months is 26.2%. Over the same period the benchmark SPY performance was 9.5% and 19.1% respectively. Since inception, on 6/30/2014, the model gained 99.61% while the benchmark SPY gained 60.26% and the ETF USMV gained 64.78% over the same period. Over the previous week the market value of iM-Best12(USMV)-Trader gained 0.53% at a time when SPY gained 0.01%. A starting capital of $100,000 at inception on 6/30/2014 would have grown to $199,460 which includes $283 cash and excludes $4,401 spent on fees and slippage. |
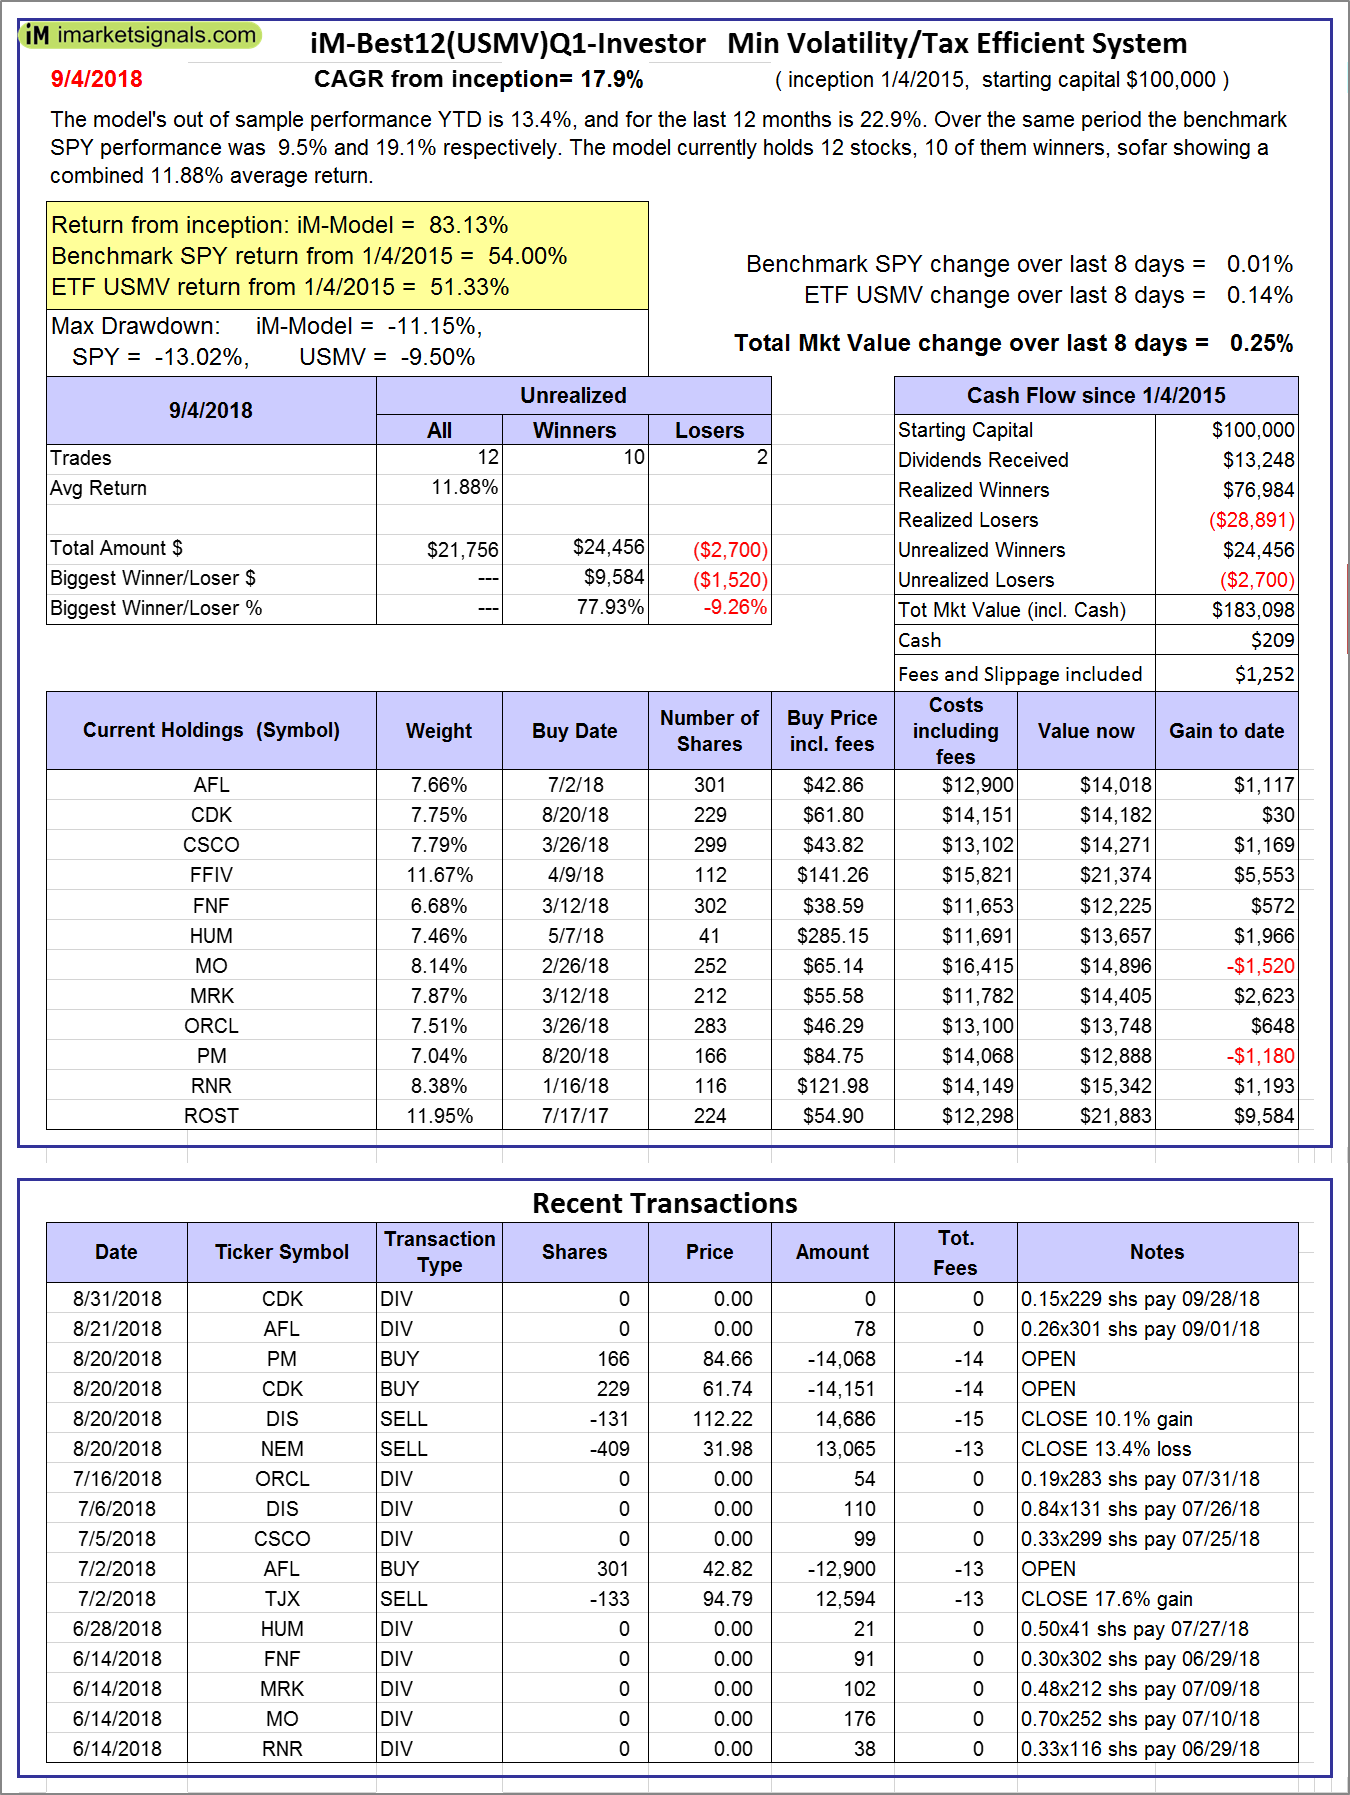  |
iM-Best12(USMV)Q1-Investor: The model’s out of sample performance YTD is 13.4%, and for the last 12 months is 22.9%. Over the same period the benchmark SPY performance was 9.5% and 19.1% respectively. Since inception, on 1/5/2015, the model gained 83.13% while the benchmark SPY gained 54.00% and the ETF USMV gained 51.33% over the same period. Over the previous week the market value of iM-Best12(USMV)Q1 gained 0.25% at a time when SPY gained 0.01%. A starting capital of $100,000 at inception on 1/5/2015 would have grown to $183,098 which includes $209 cash and excludes $1,252 spent on fees and slippage. |
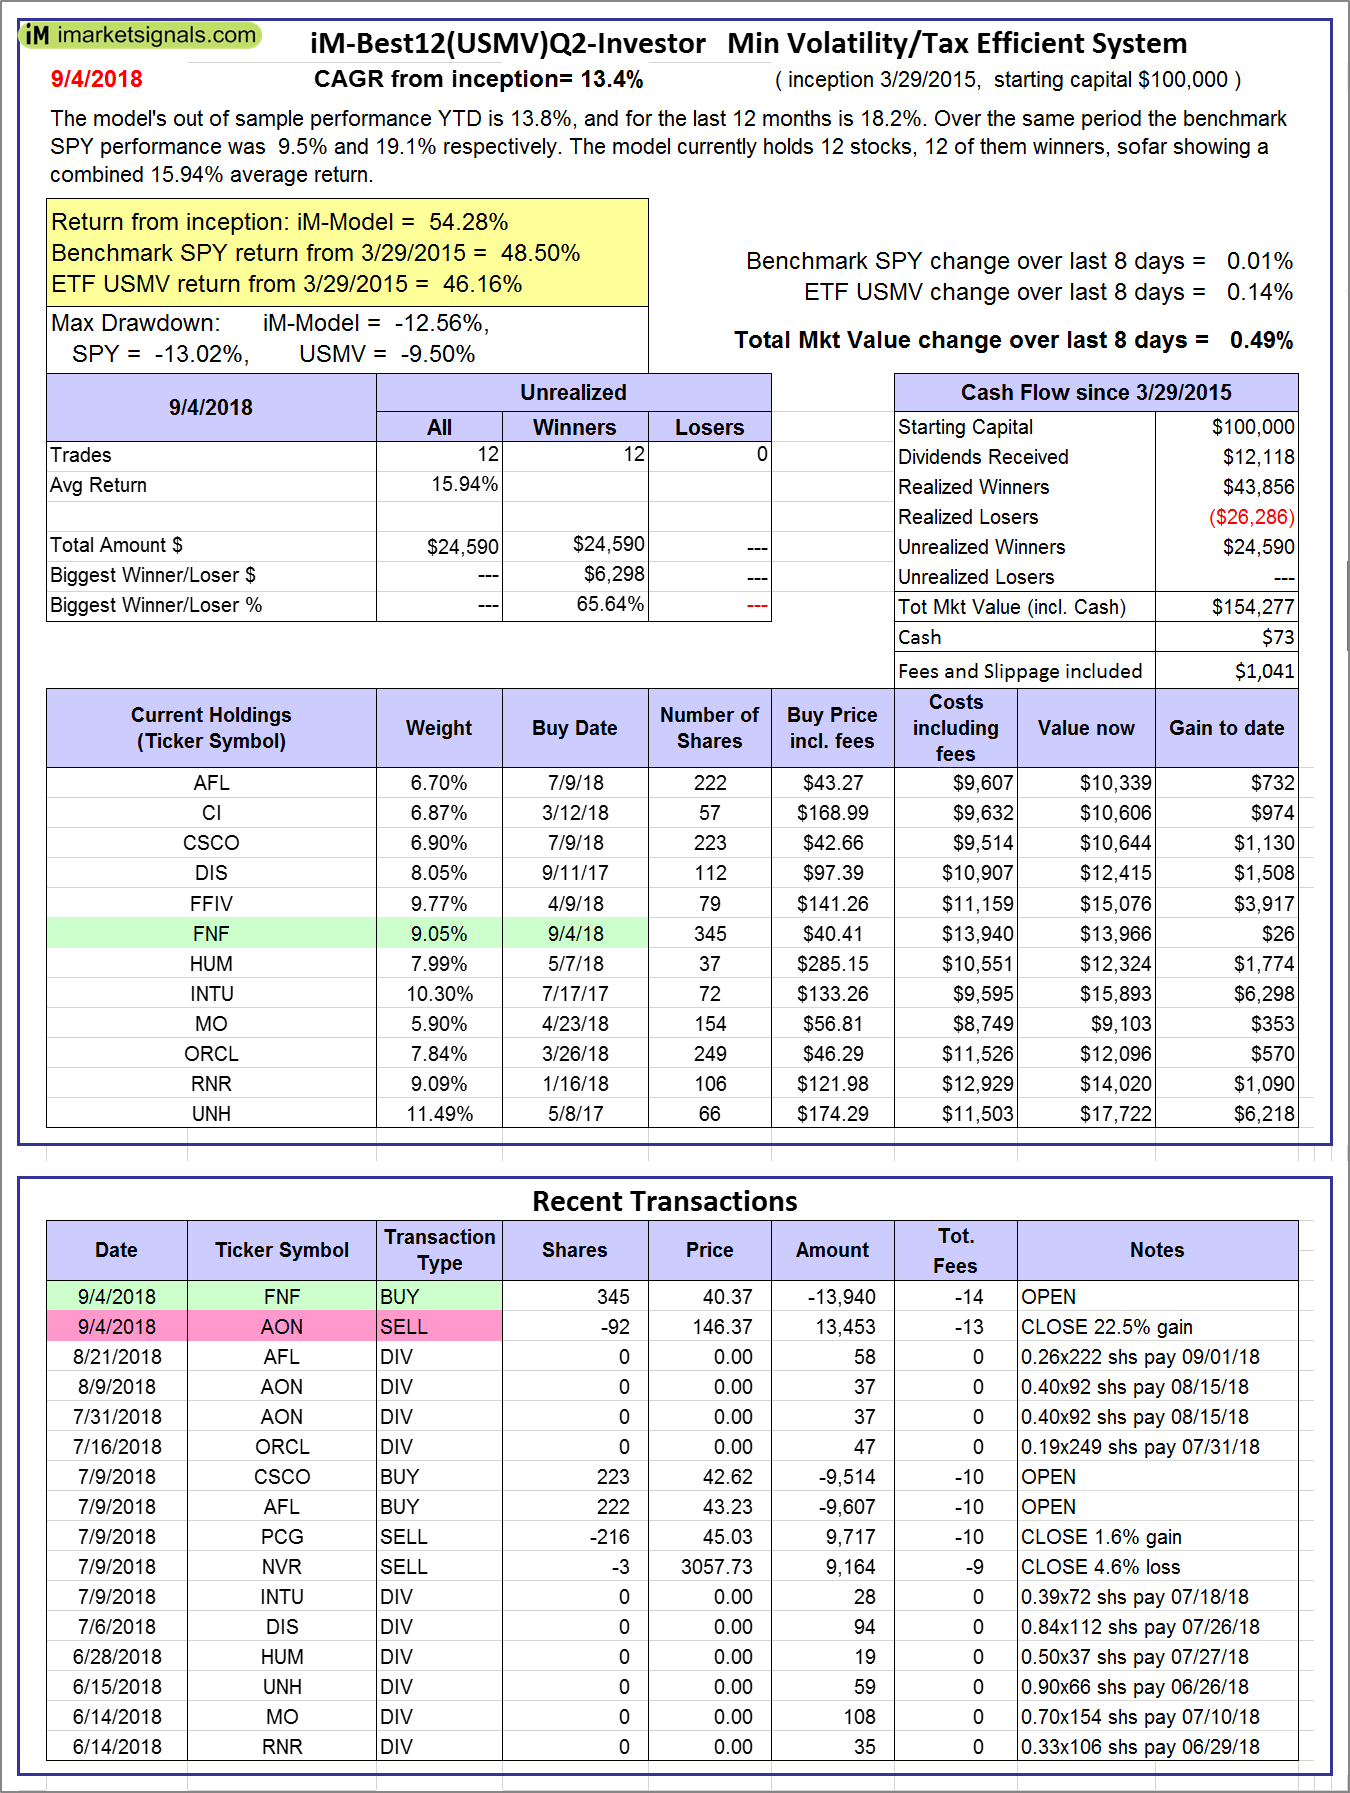 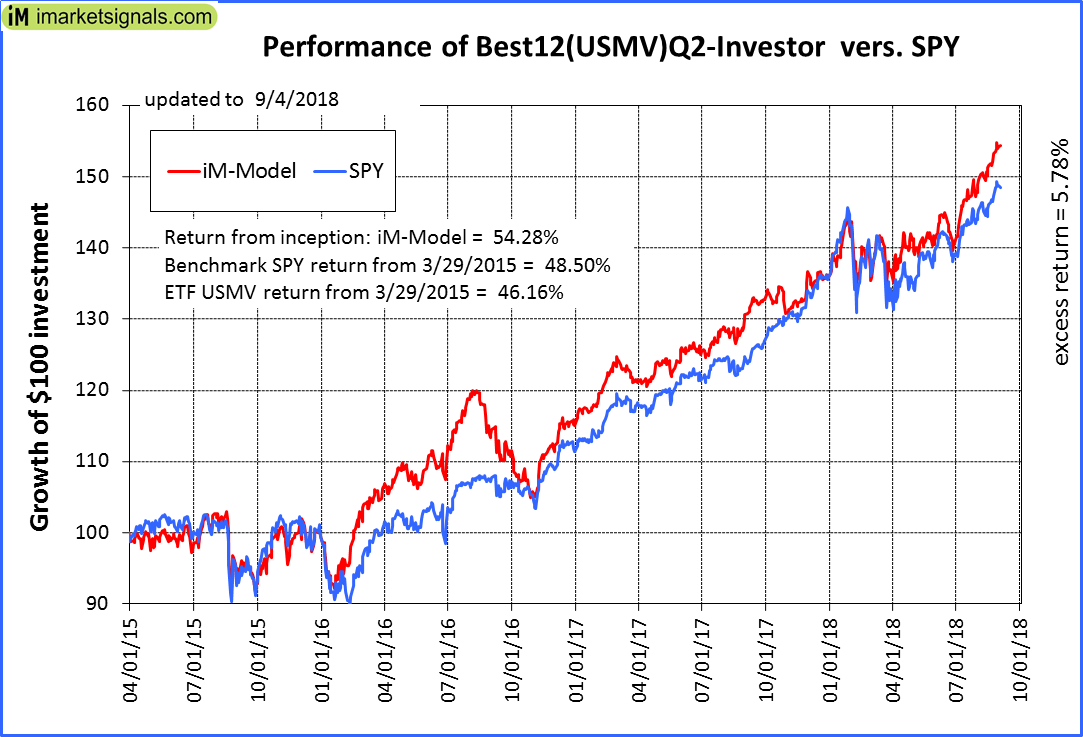 |
iM-Best12(USMV)Q2-Investor: The model’s out of sample performance YTD is 13.8%, and for the last 12 months is 18.2%. Over the same period the benchmark SPY performance was 9.5% and 19.1% respectively. Since inception, on 3/30/2015, the model gained 54.28% while the benchmark SPY gained 48.50% and the ETF USMV gained 46.16% over the same period. Over the previous week the market value of iM-Best12(USMV)Q2 gained 0.49% at a time when SPY gained 0.01%. A starting capital of $100,000 at inception on 3/30/2015 would have grown to $154,277 which includes $73 cash and excludes $1,041 spent on fees and slippage. |
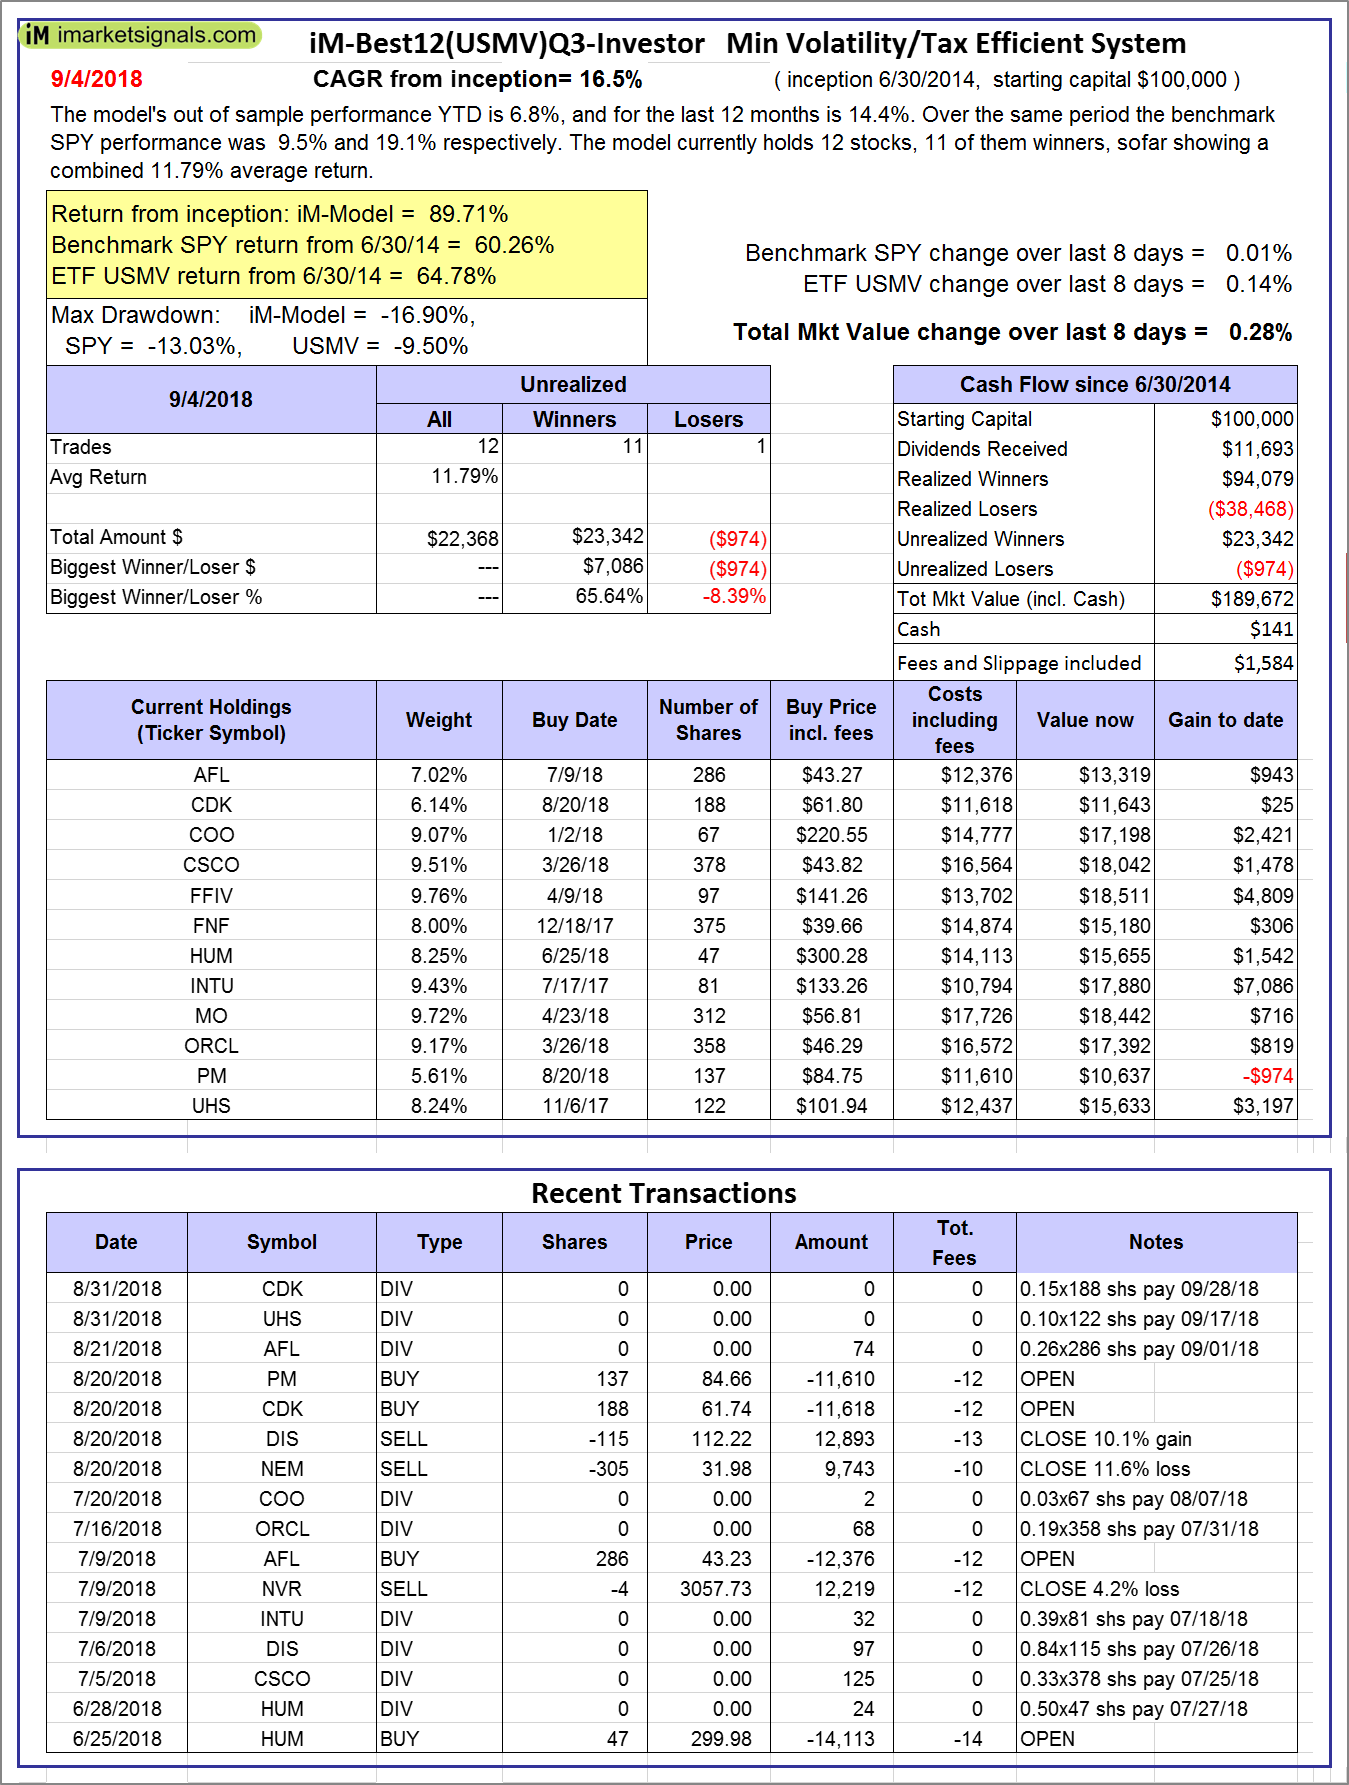 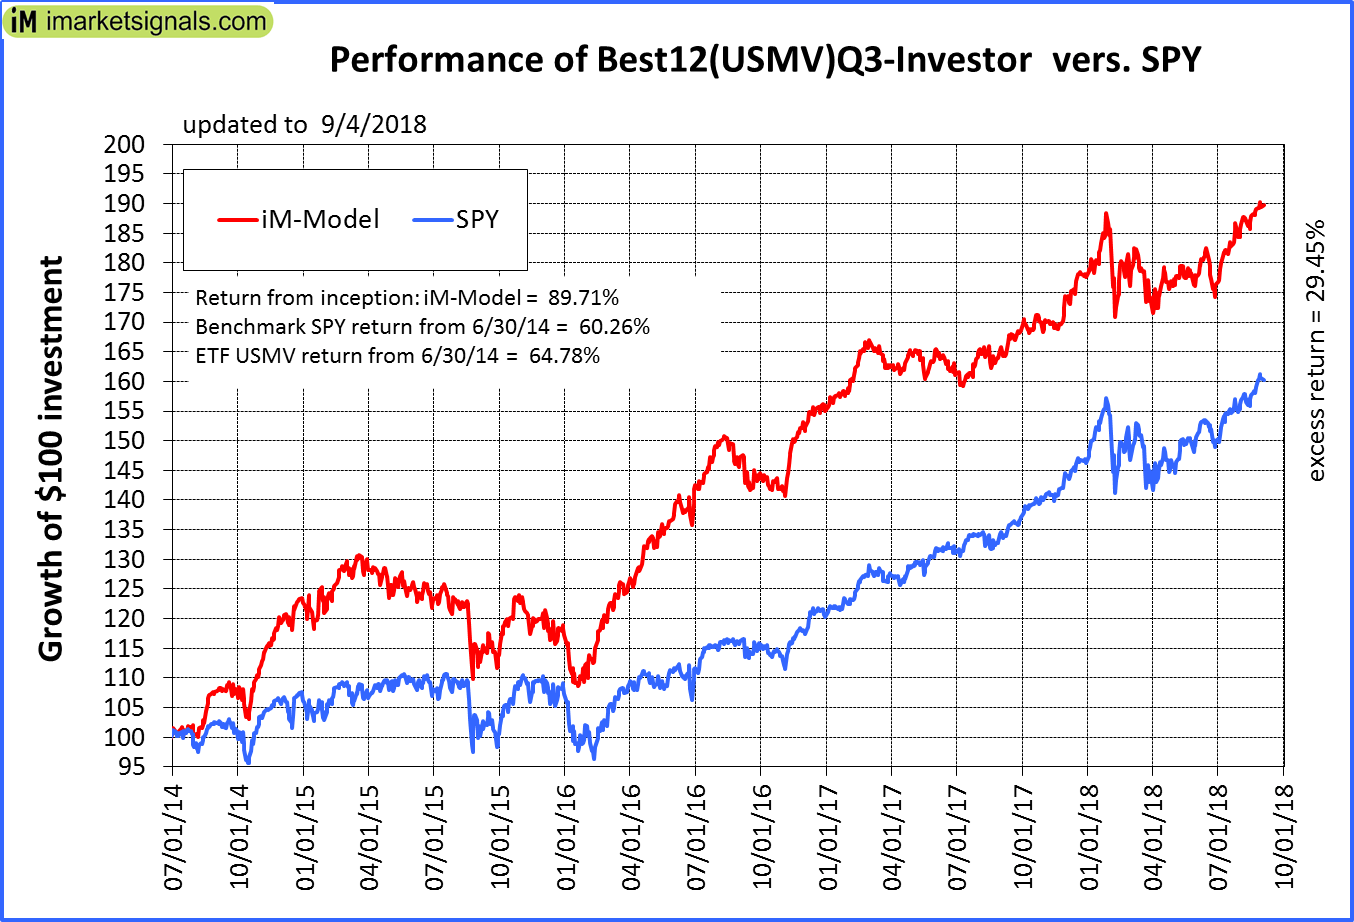 |
iM-Best12(USMV)Q3-Investor: The model’s out of sample performance YTD is 6.8%, and for the last 12 months is 14.4%. Over the same period the benchmark SPY performance was 9.5% and 19.1% respectively. Since inception, on 7/1/2014, the model gained 89.71% while the benchmark SPY gained 60.26% and the ETF USMV gained 64.78% over the same period. Over the previous week the market value of iM-Best12(USMV)Q3 gained 0.28% at a time when SPY gained 0.01%. A starting capital of $100,000 at inception on 7/1/2014 would have grown to $189,672 which includes $141 cash and excludes $1,584 spent on fees and slippage. |
  |
iM-Best12(USMV)Q4-Investor: Since inception, on 9/29/2014, the model gained 96.11% while the benchmark SPY gained 57.83% and the ETF USMV gained 62.50% over the same period. Over the previous week the market value of iM-Best12(USMV)Q4 gained -0.72% at a time when SPY gained 0.01%. A starting capital of $100,000 at inception on 9/29/2014 would have grown to $196,100 which includes -$45 cash and excludes $1,379 spent on fees and slippage. |
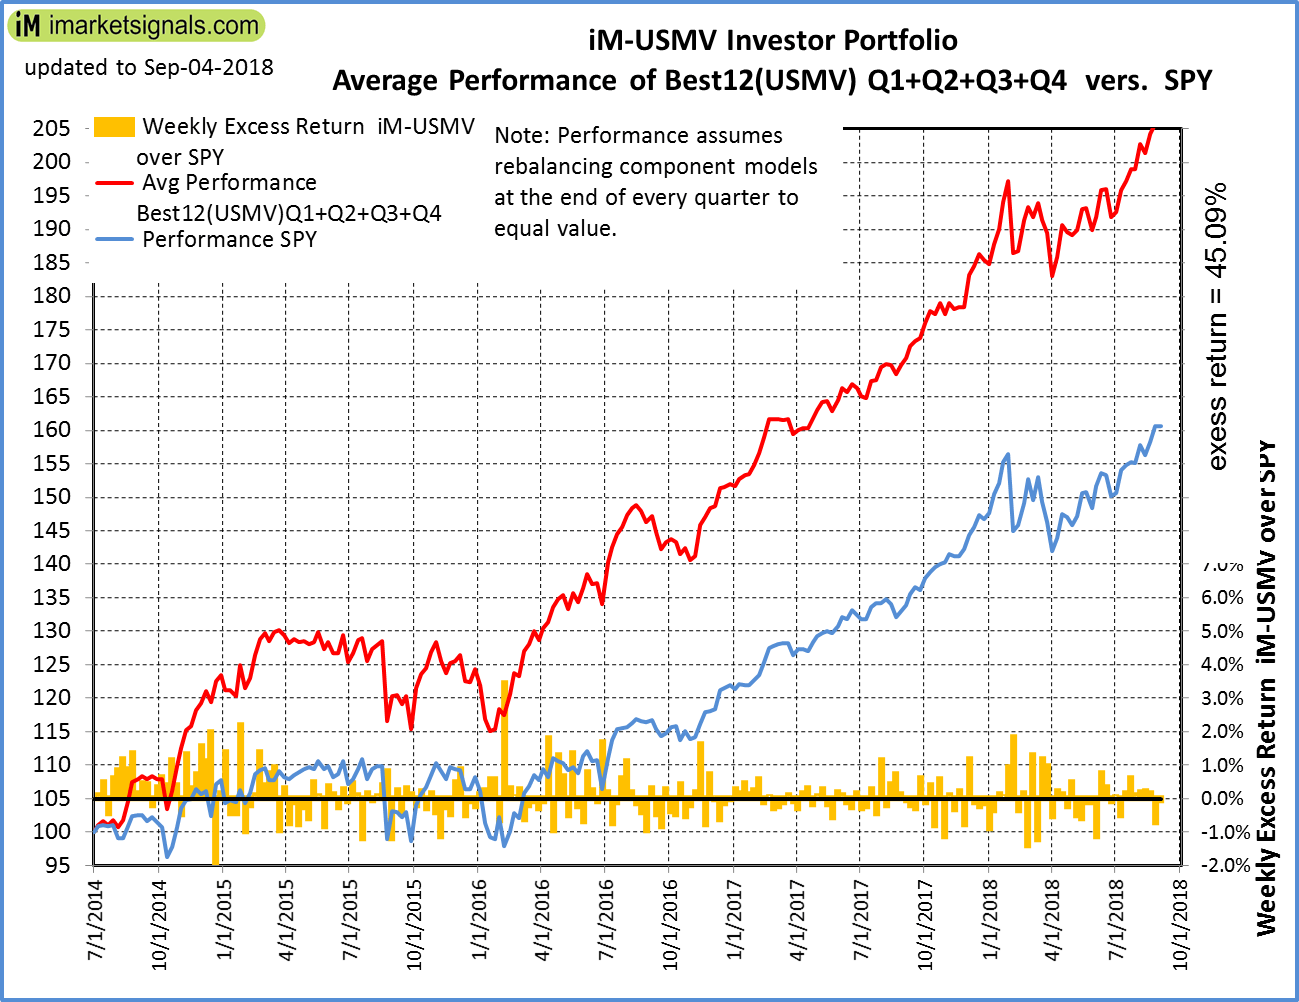 |
Average Performance of iM-Best12(USMV)Q1+Q2+Q3+Q4-Investor resulted in an excess return of 45.09% over SPY. (see iM-USMV Investor Portfolio) |
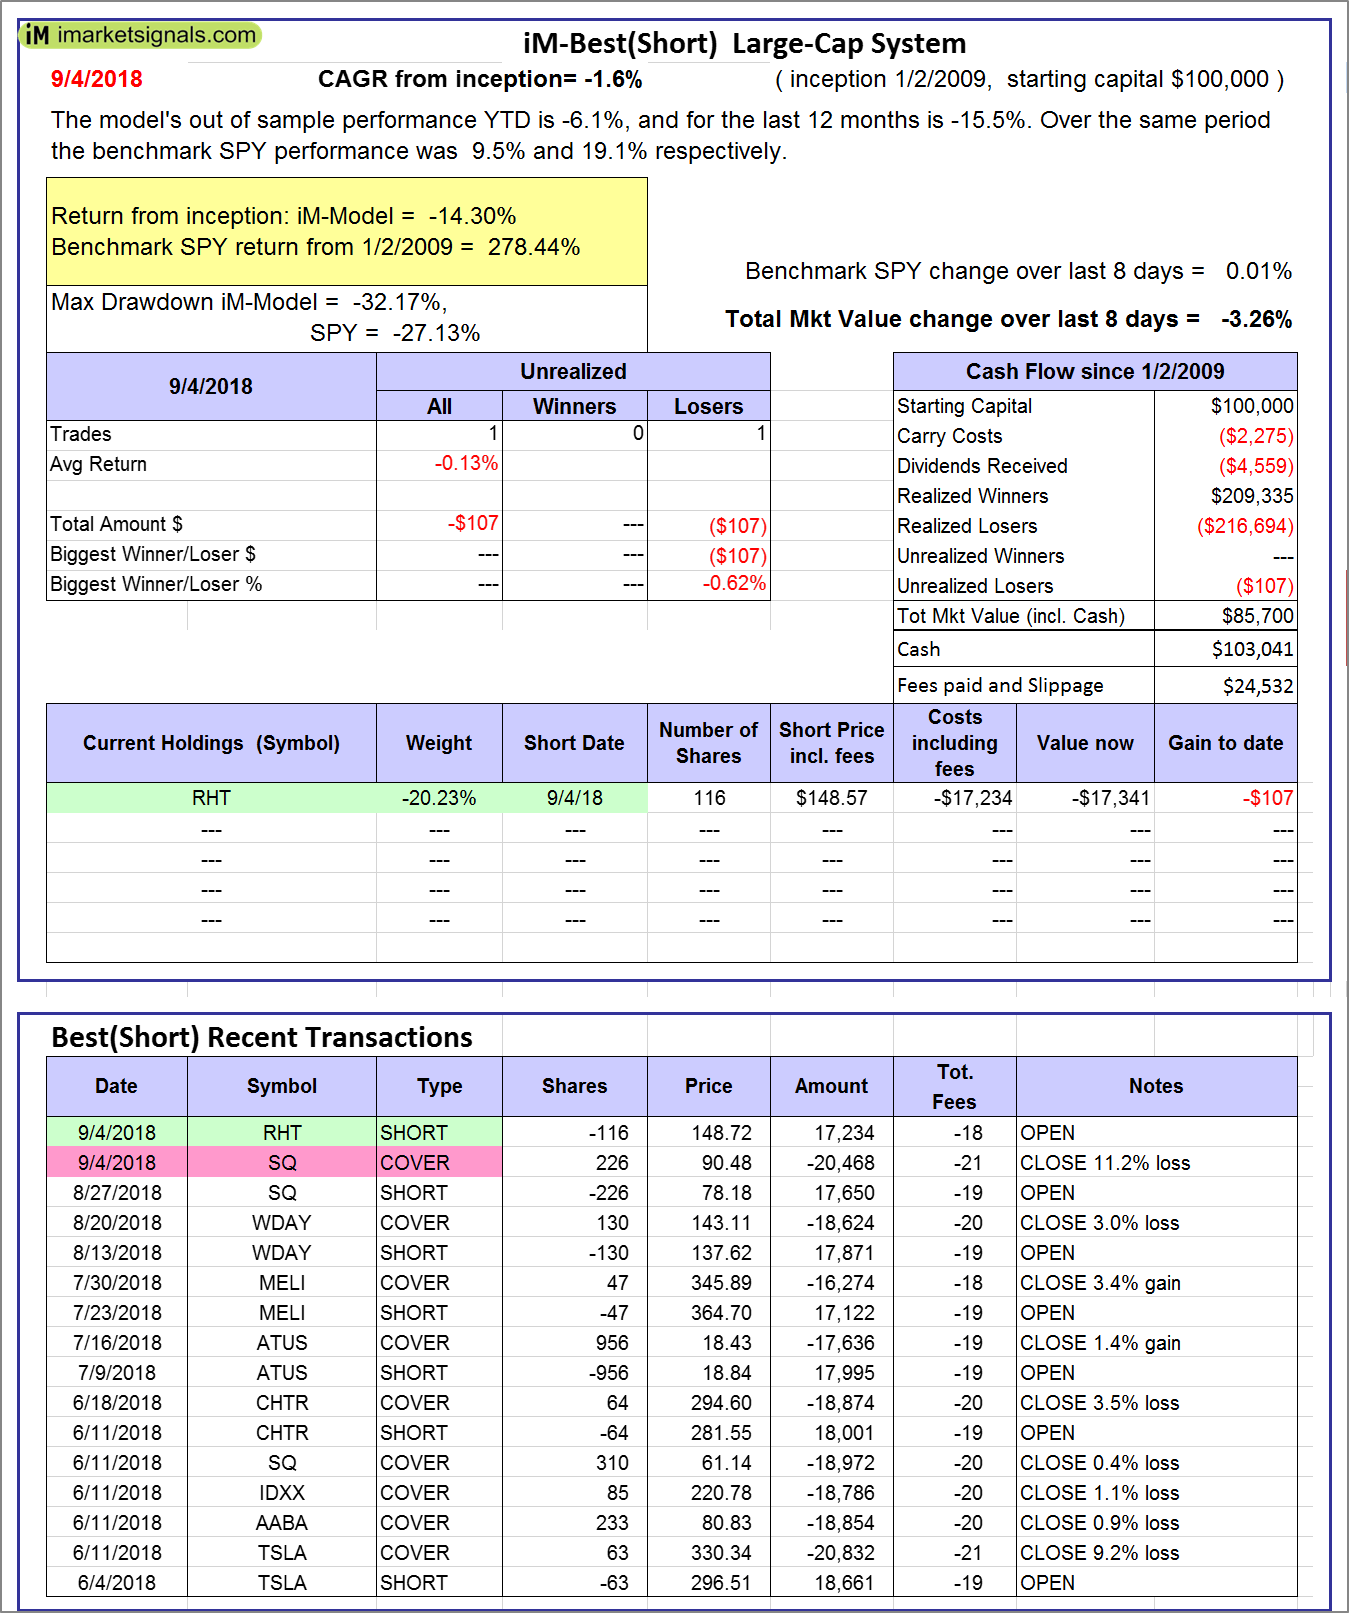 |
iM-Best(Short): The model’s out of sample performance YTD is -6.1%, and for the last 12 months is -15.5%. Over the same period the benchmark SPY performance was 9.5% and 19.1% respectively. Over the previous week the market value of iM-Best(Short) gained -3.26% at a time when SPY gained 0.01%. Over the period 1/2/2009 to 9/4/2018 the starting capital of $100,000 would have grown to $85,700 which includes $103,041 cash and excludes $24,532 spent on fees and slippage. |
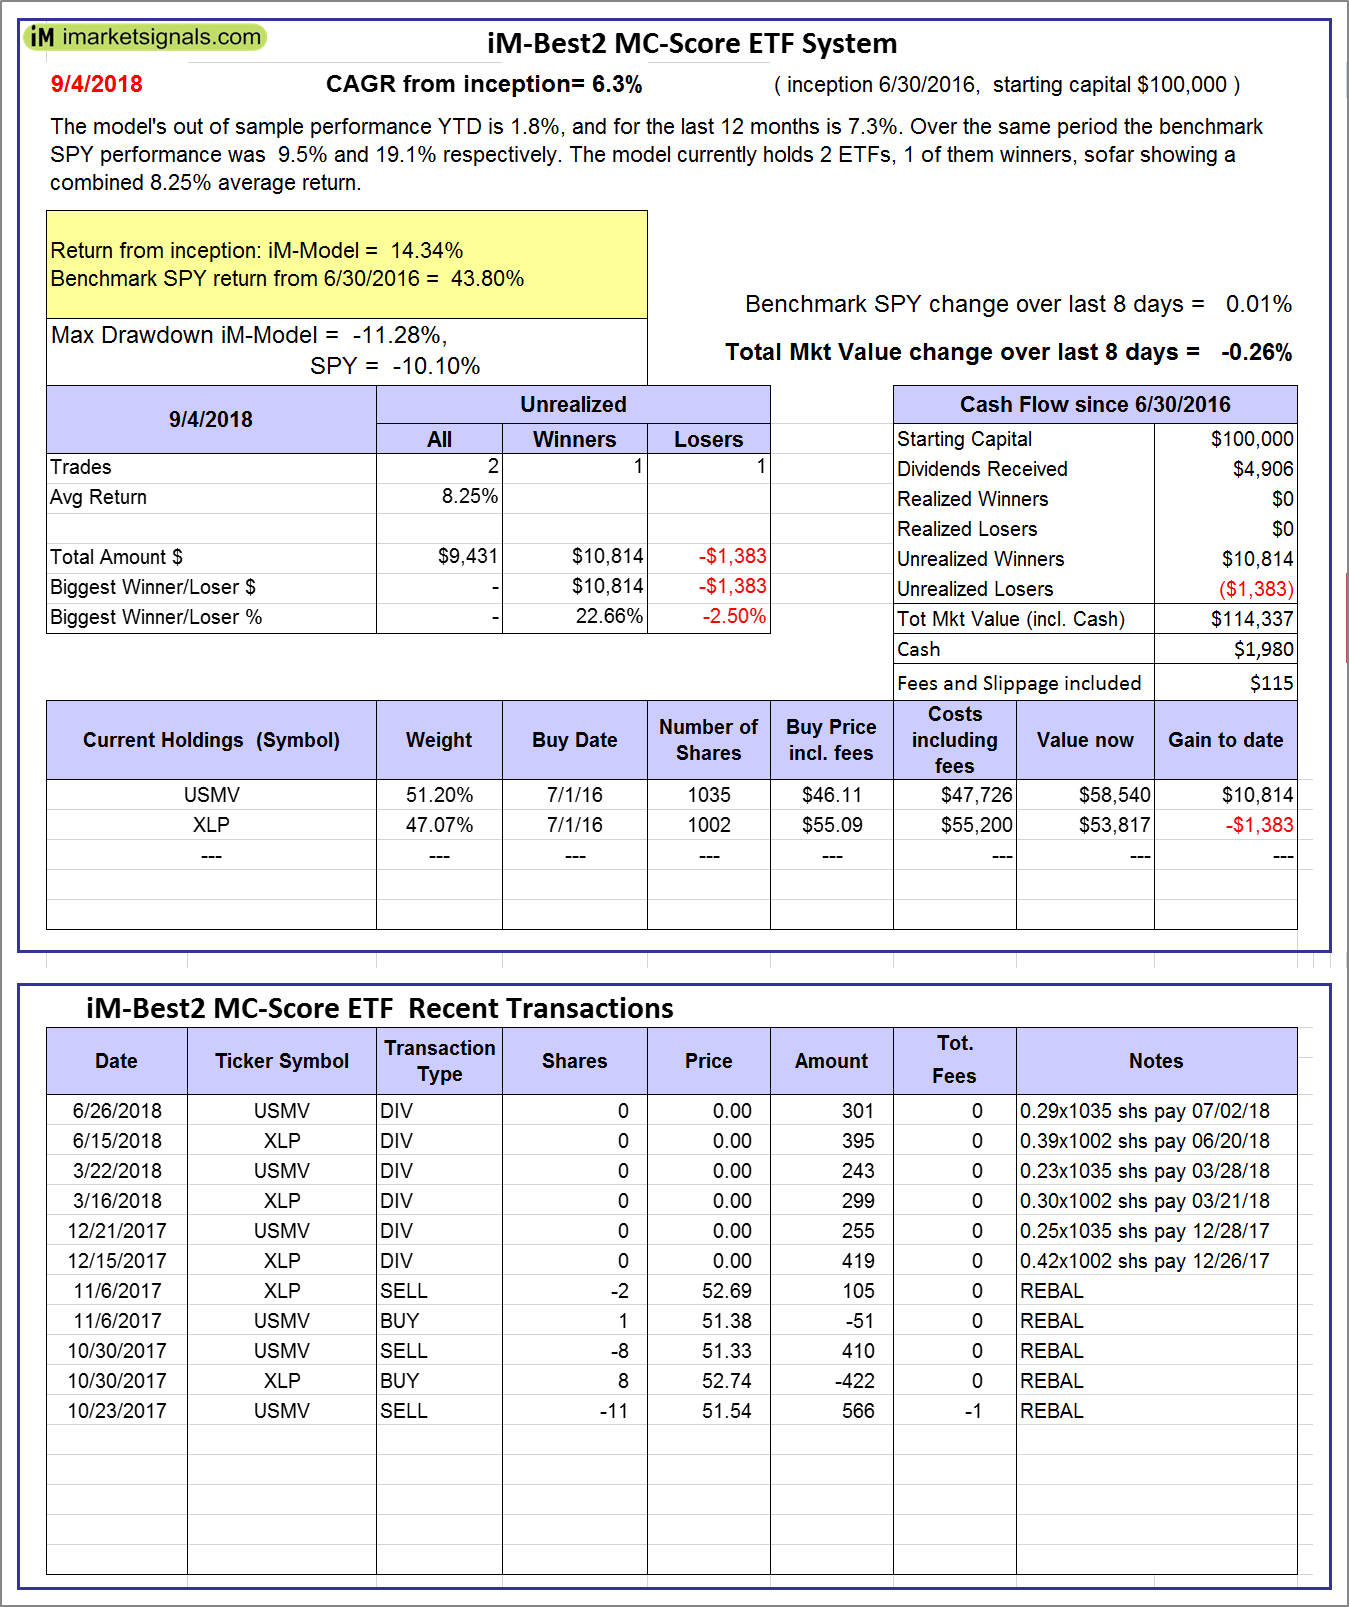 |
iM-Best2 MC-Score ETF System: The model’s out of sample performance YTD is 1.8%, and for the last 12 months is 7.3%. Over the same period the benchmark SPY performance was 9.5% and 19.1% respectively. Over the previous week the market value of the iM-Best2 MC-Score ETF System gained -0.26% at a time when SPY gained 0.01%. A starting capital of $100,000 at inception on 6/30/2016 would have grown to $114,337 which includes $1,980 cash and excludes $115 spent on fees and slippage. |
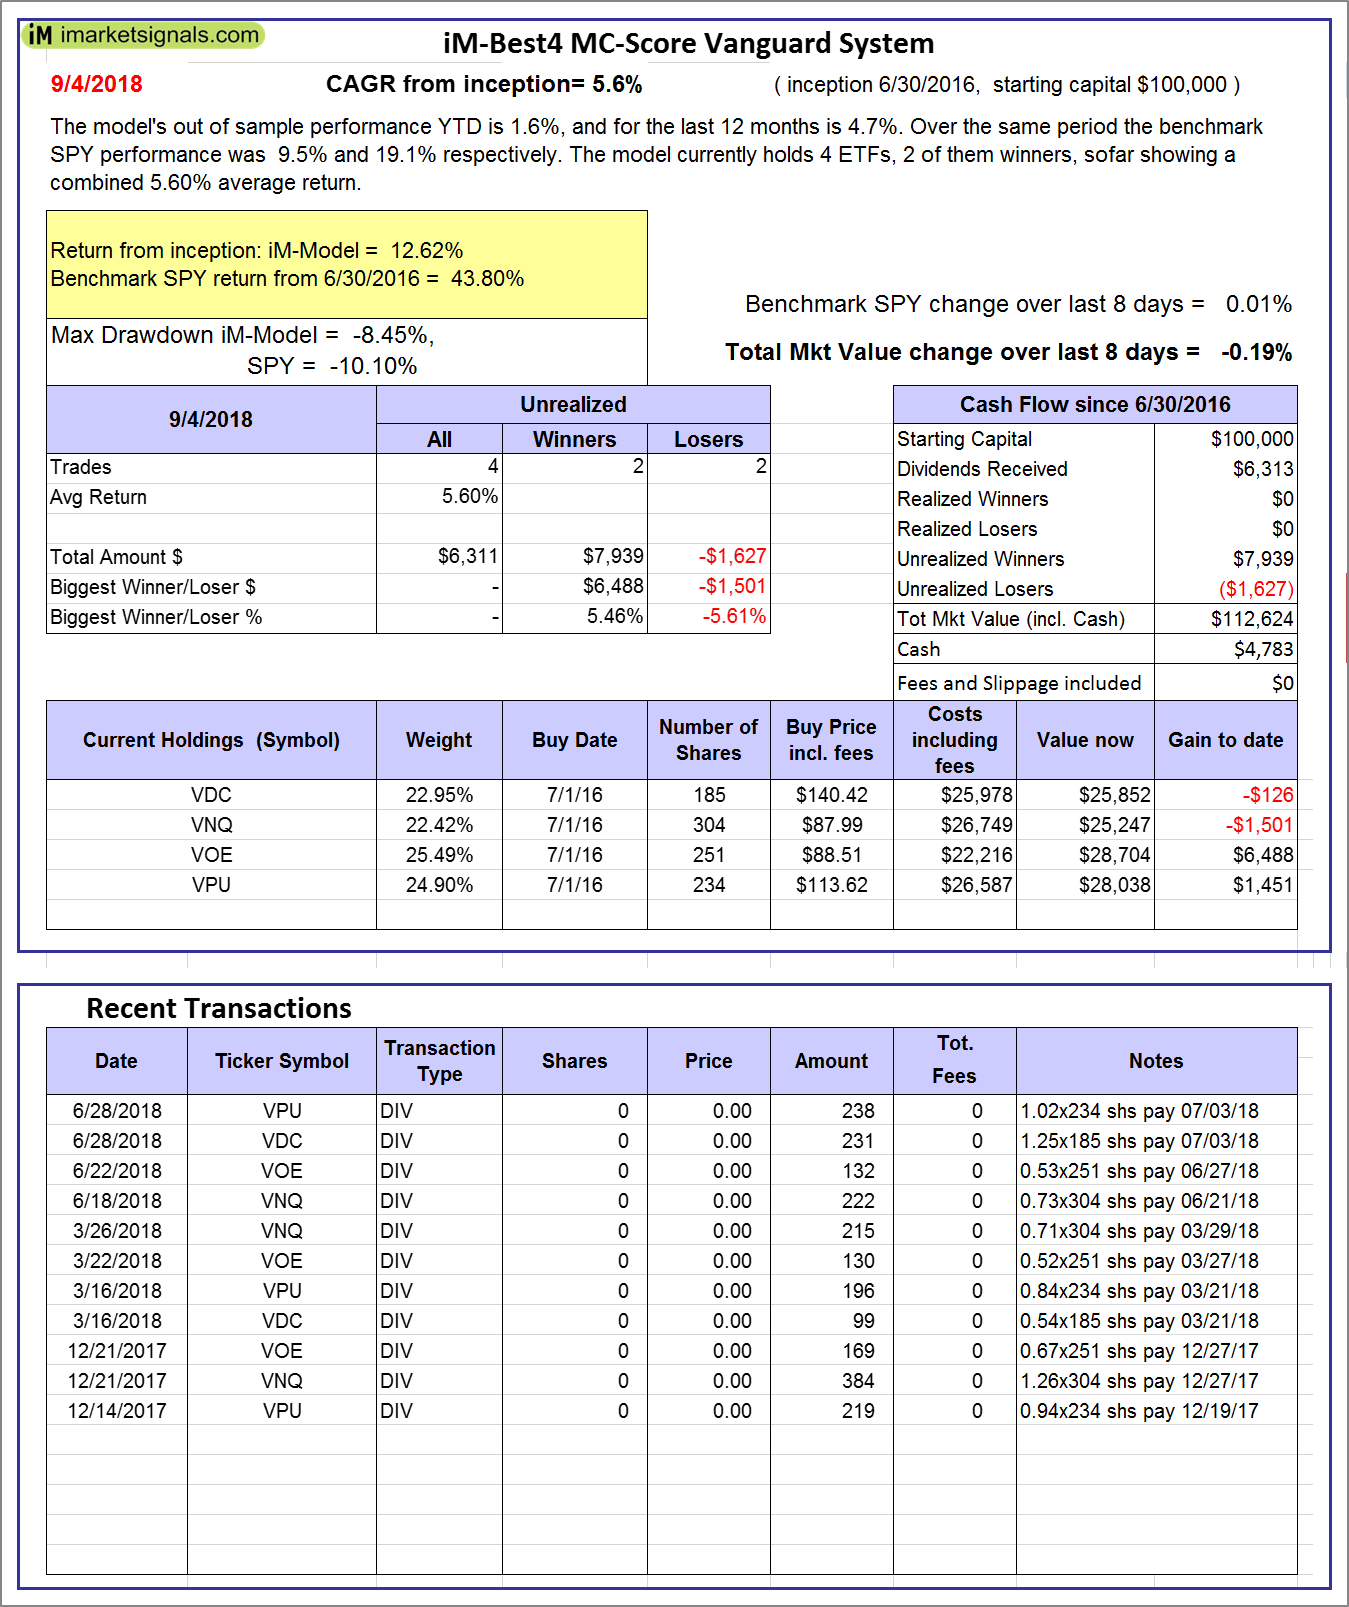 |
iM-Best4 MC-Score Vanguard System: The model’s out of sample performance YTD is 1.6%, and for the last 12 months is 4.7%. Over the same period the benchmark SPY performance was 9.5% and 19.1% respectively. Over the previous week the market value of the iM-Best4 MC-Score Vanguard System gained -0.19% at a time when SPY gained 0.01%. A starting capital of $100,000 at inception on 6/30/2016 would have grown to $112,624 which includes $4,783 cash and excludes $00 spent on fees and slippage. |
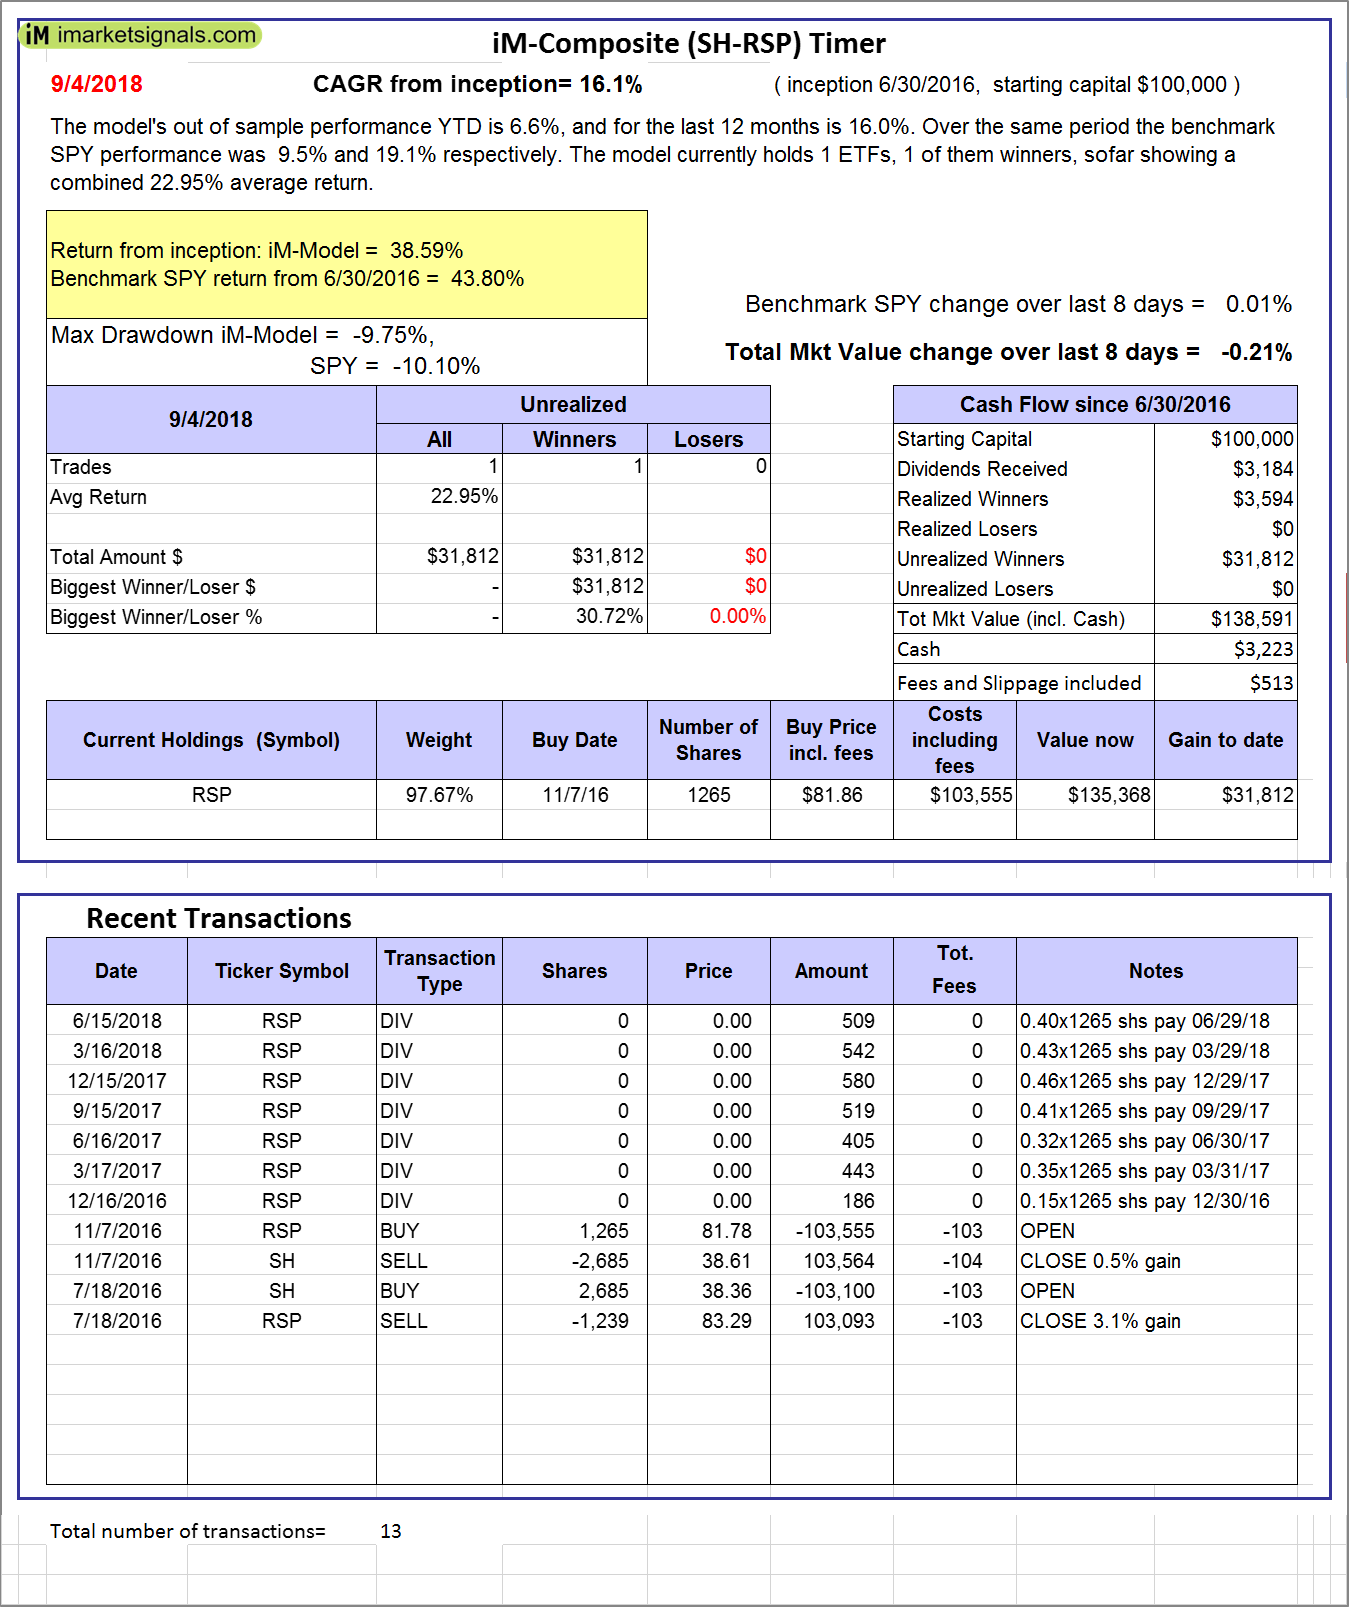 |
iM-Composite (SH-RSP) Timer: The model’s out of sample performance YTD is 6.6%, and for the last 12 months is 16.0%. Over the same period the benchmark SPY performance was 9.5% and 19.1% respectively. Over the previous week the market value of the iM-Composite (SH-RSP) Timer gained -0.21% at a time when SPY gained 0.01%. A starting capital of $100,000 at inception on 6/30/2016 would have grown to $138,591 which includes $3,223 cash and excludes $513 spent on fees and slippage. |
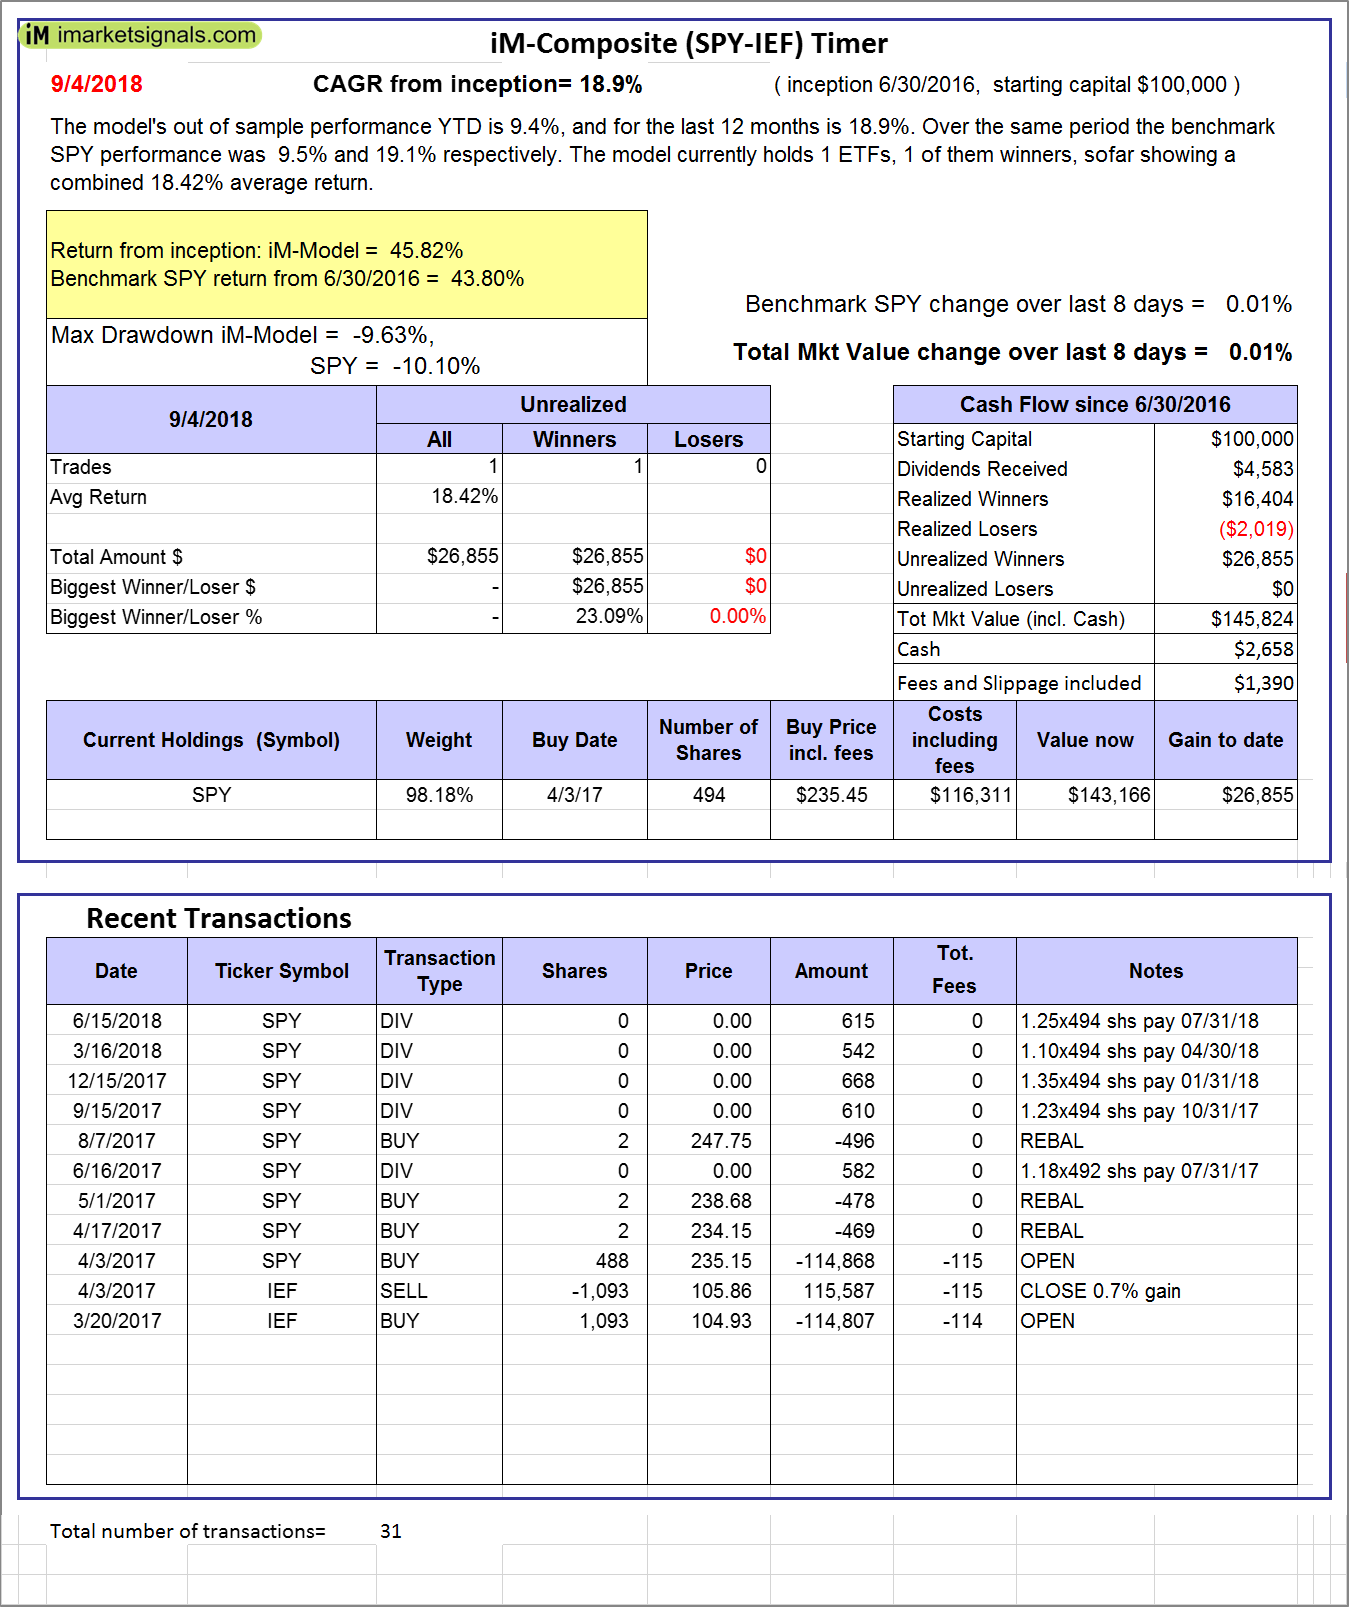 |
iM-Composite (SPY-IEF) Timer: The model’s out of sample performance YTD is 9.4%, and for the last 12 months is 18.9%. Over the same period the benchmark SPY performance was 9.5% and 19.1% respectively. Over the previous week the market value of the iM-Composite (SPY-IEF) Timer gained 0.01% at a time when SPY gained 0.01%. A starting capital of $100,000 at inception on 6/30/2016 would have grown to $145,824 which includes $2,658 cash and excludes $1,390 spent on fees and slippage. |
 |
iM-VIX Timer with ZIV: The model’s out of sample performance YTD is 38.4%, and for the last 12 months is 76.0%. Over the same period the benchmark SPY performance was 9.5% and 19.1% respectively. Over the previous week the market value of the iM-VIX Timer with ZIV gained 1.61% at a time when SPY gained 0.01%. A starting capital of $100,000 at inception on 6/30/2016 would have grown to $243,671 which includes $77 cash and excludes $2,429 spent on fees and slippage. |
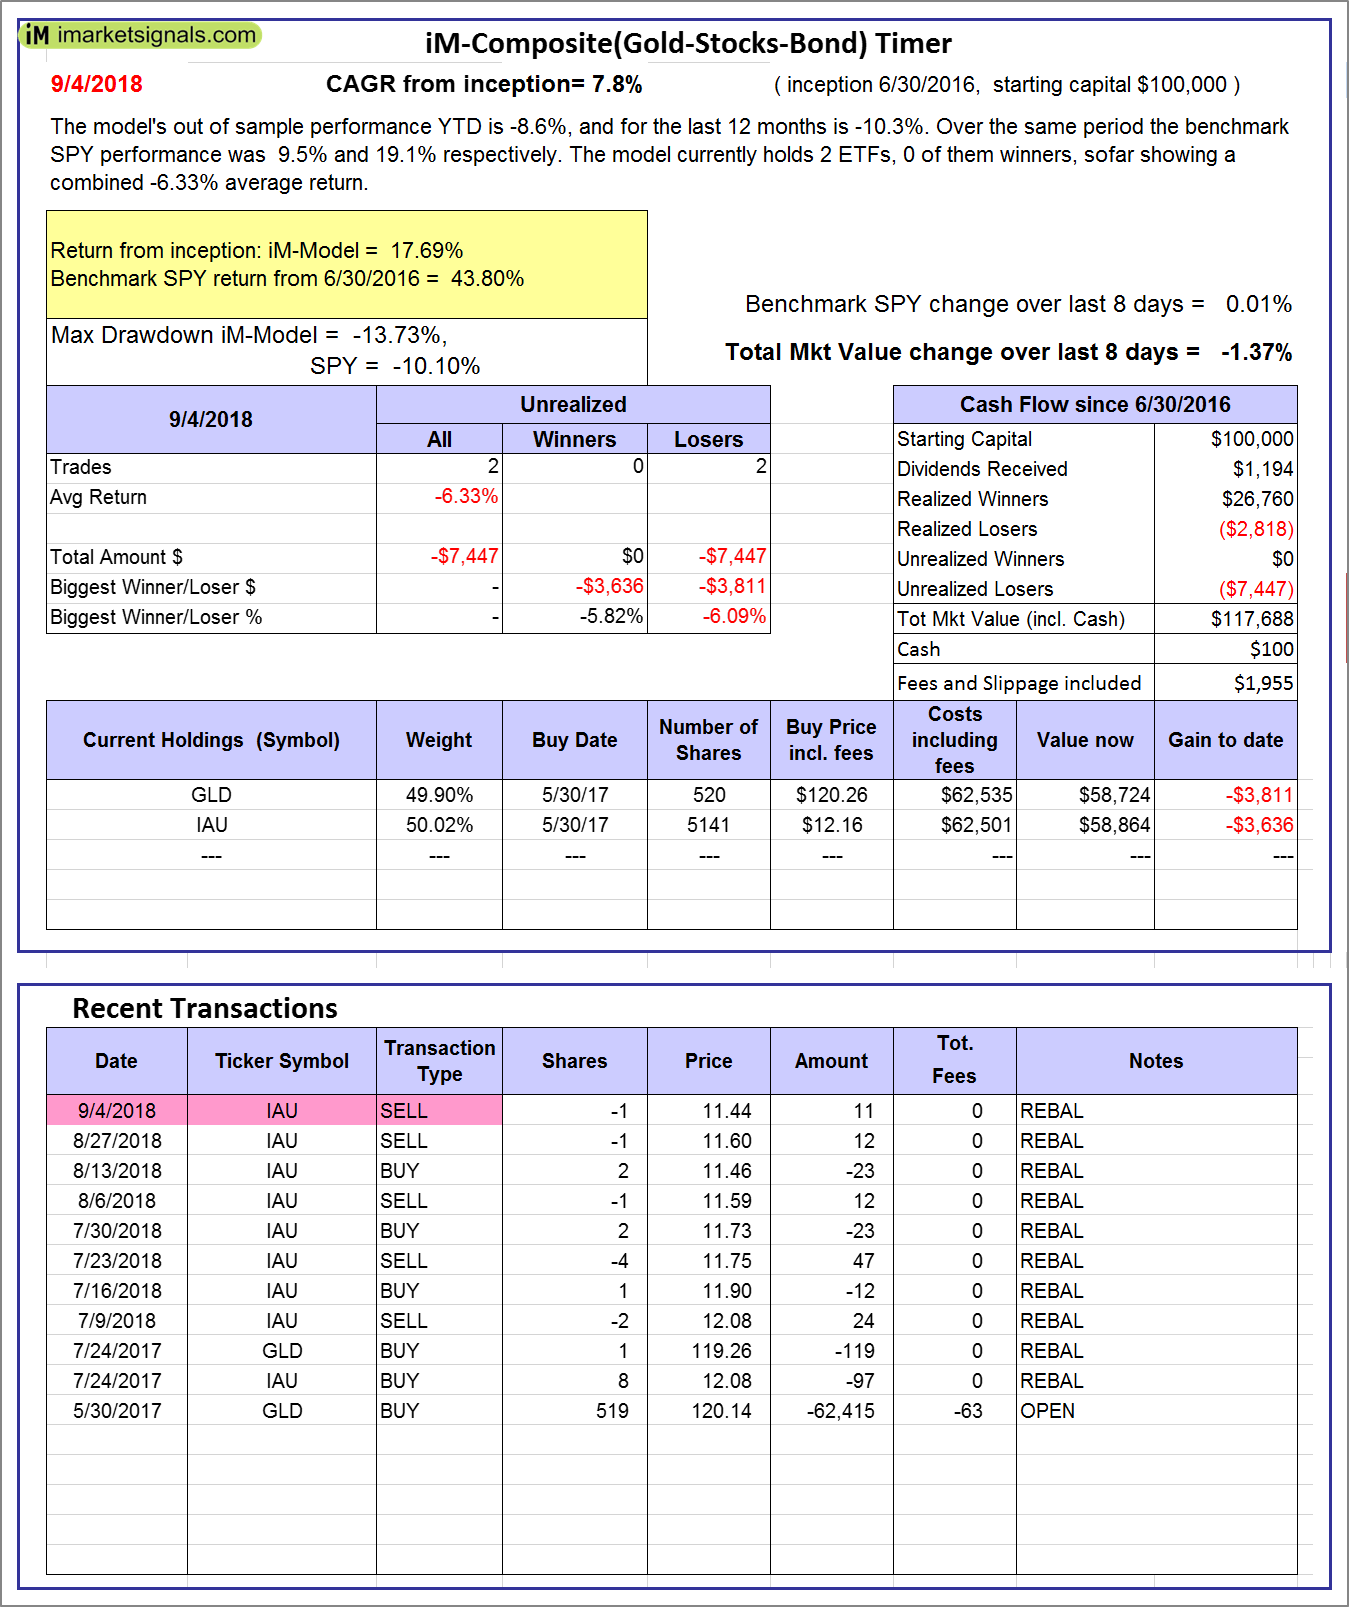 |
iM-Composite(Gold-Stocks-Bond) Timer: The model’s out of sample performance YTD is -8.6%, and for the last 12 months is -10.3%. Over the same period the benchmark SPY performance was 9.5% and 19.1% respectively. Over the previous week the market value of the iM-Composite(Gold-Stocks-Bond) Timer gained -1.37% at a time when SPY gained 0.01%. A starting capital of $100,000 at inception on 6/30/2016 would have grown to $117,688 which includes $100 cash and excludes $1,955 spent on fees and slippage. |
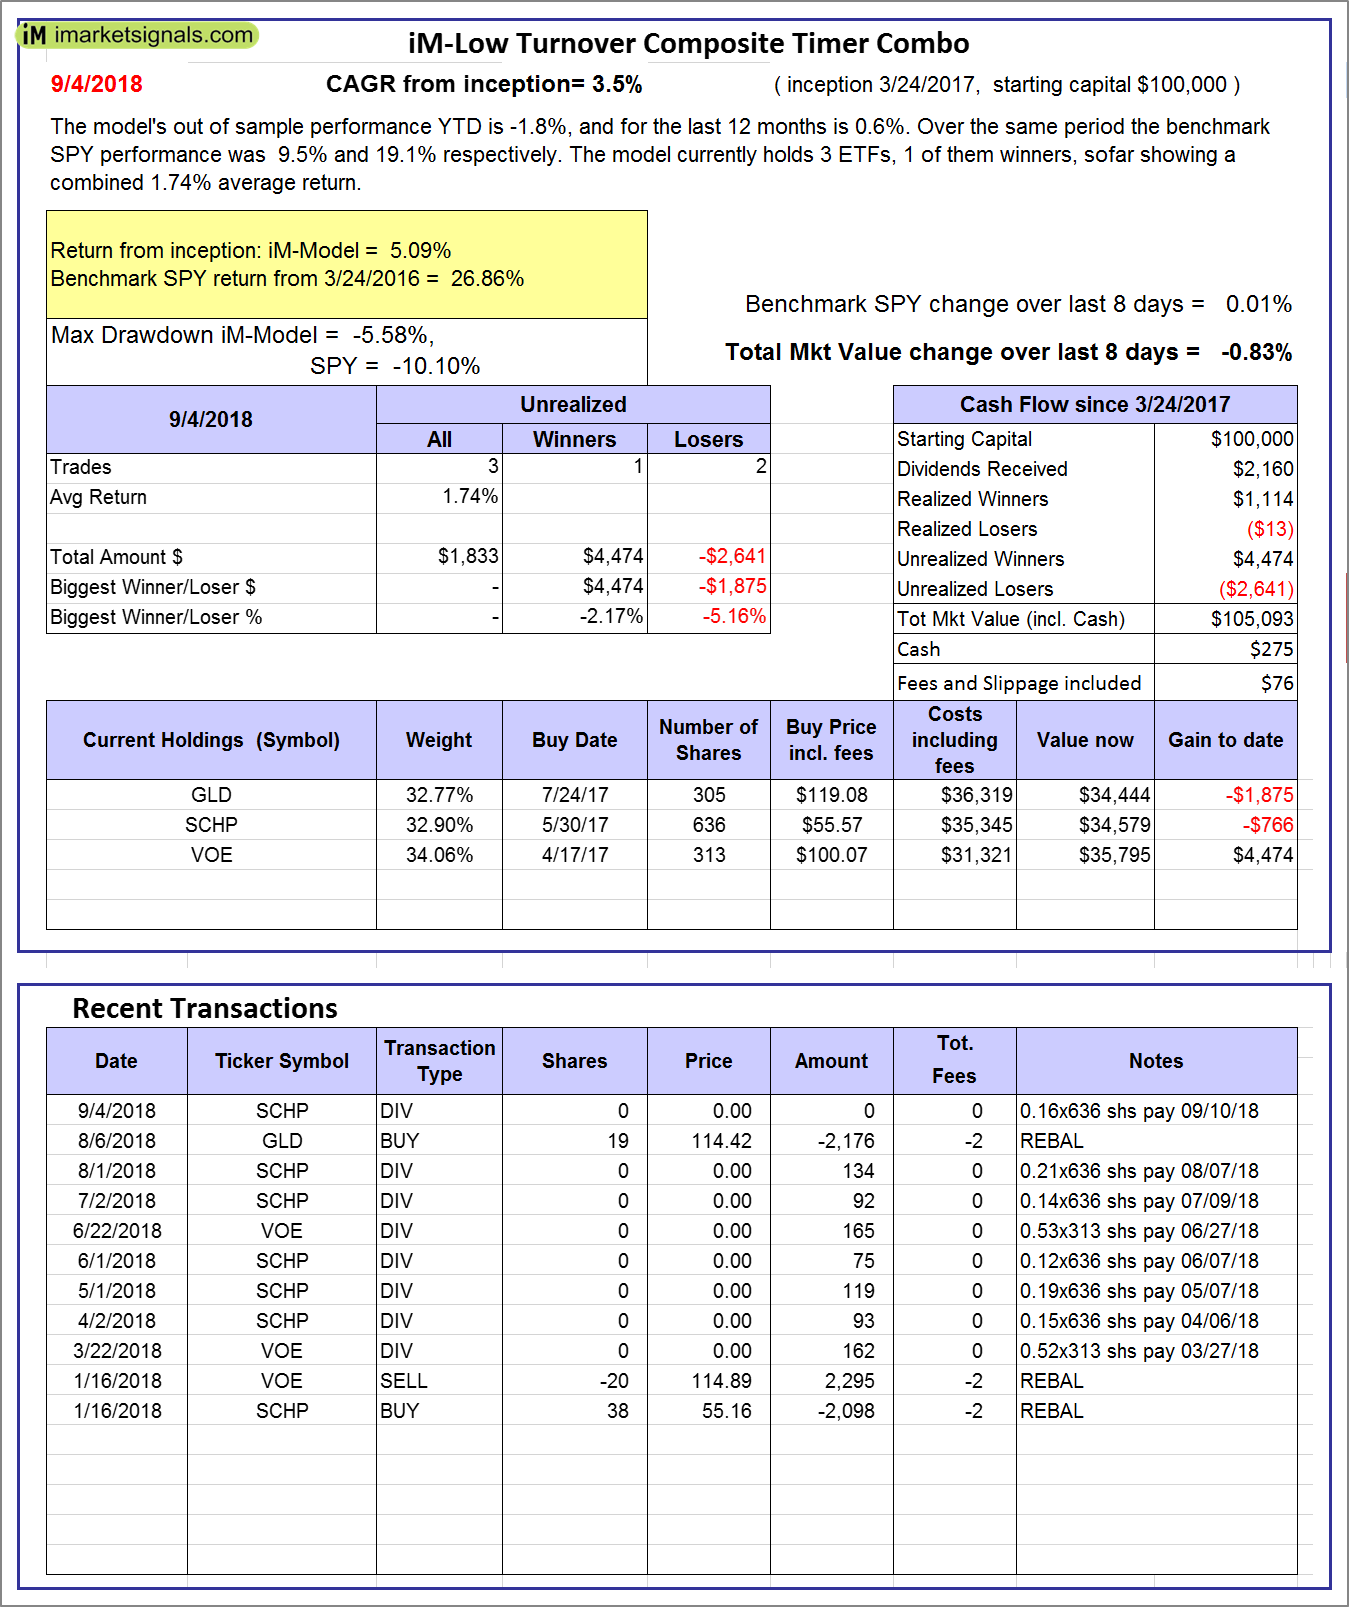 |
iM-Low Turnover Composite Timer Combo: The model’s out of sample performance YTD is -1.8%, and for the last 12 months is 0.6%. Over the same period the benchmark SPY performance was 9.5% and 19.1% respectively. Over the previous week the market value of the iM-Low Turnover Composite Timer Combo gained -0.83% at a time when SPY gained 0.01%. A starting capital of $100,000 at inception on 3/24/27 would have grown to $105,093 which includes $275 cash and excludes $76 spent on fees and slippage. |
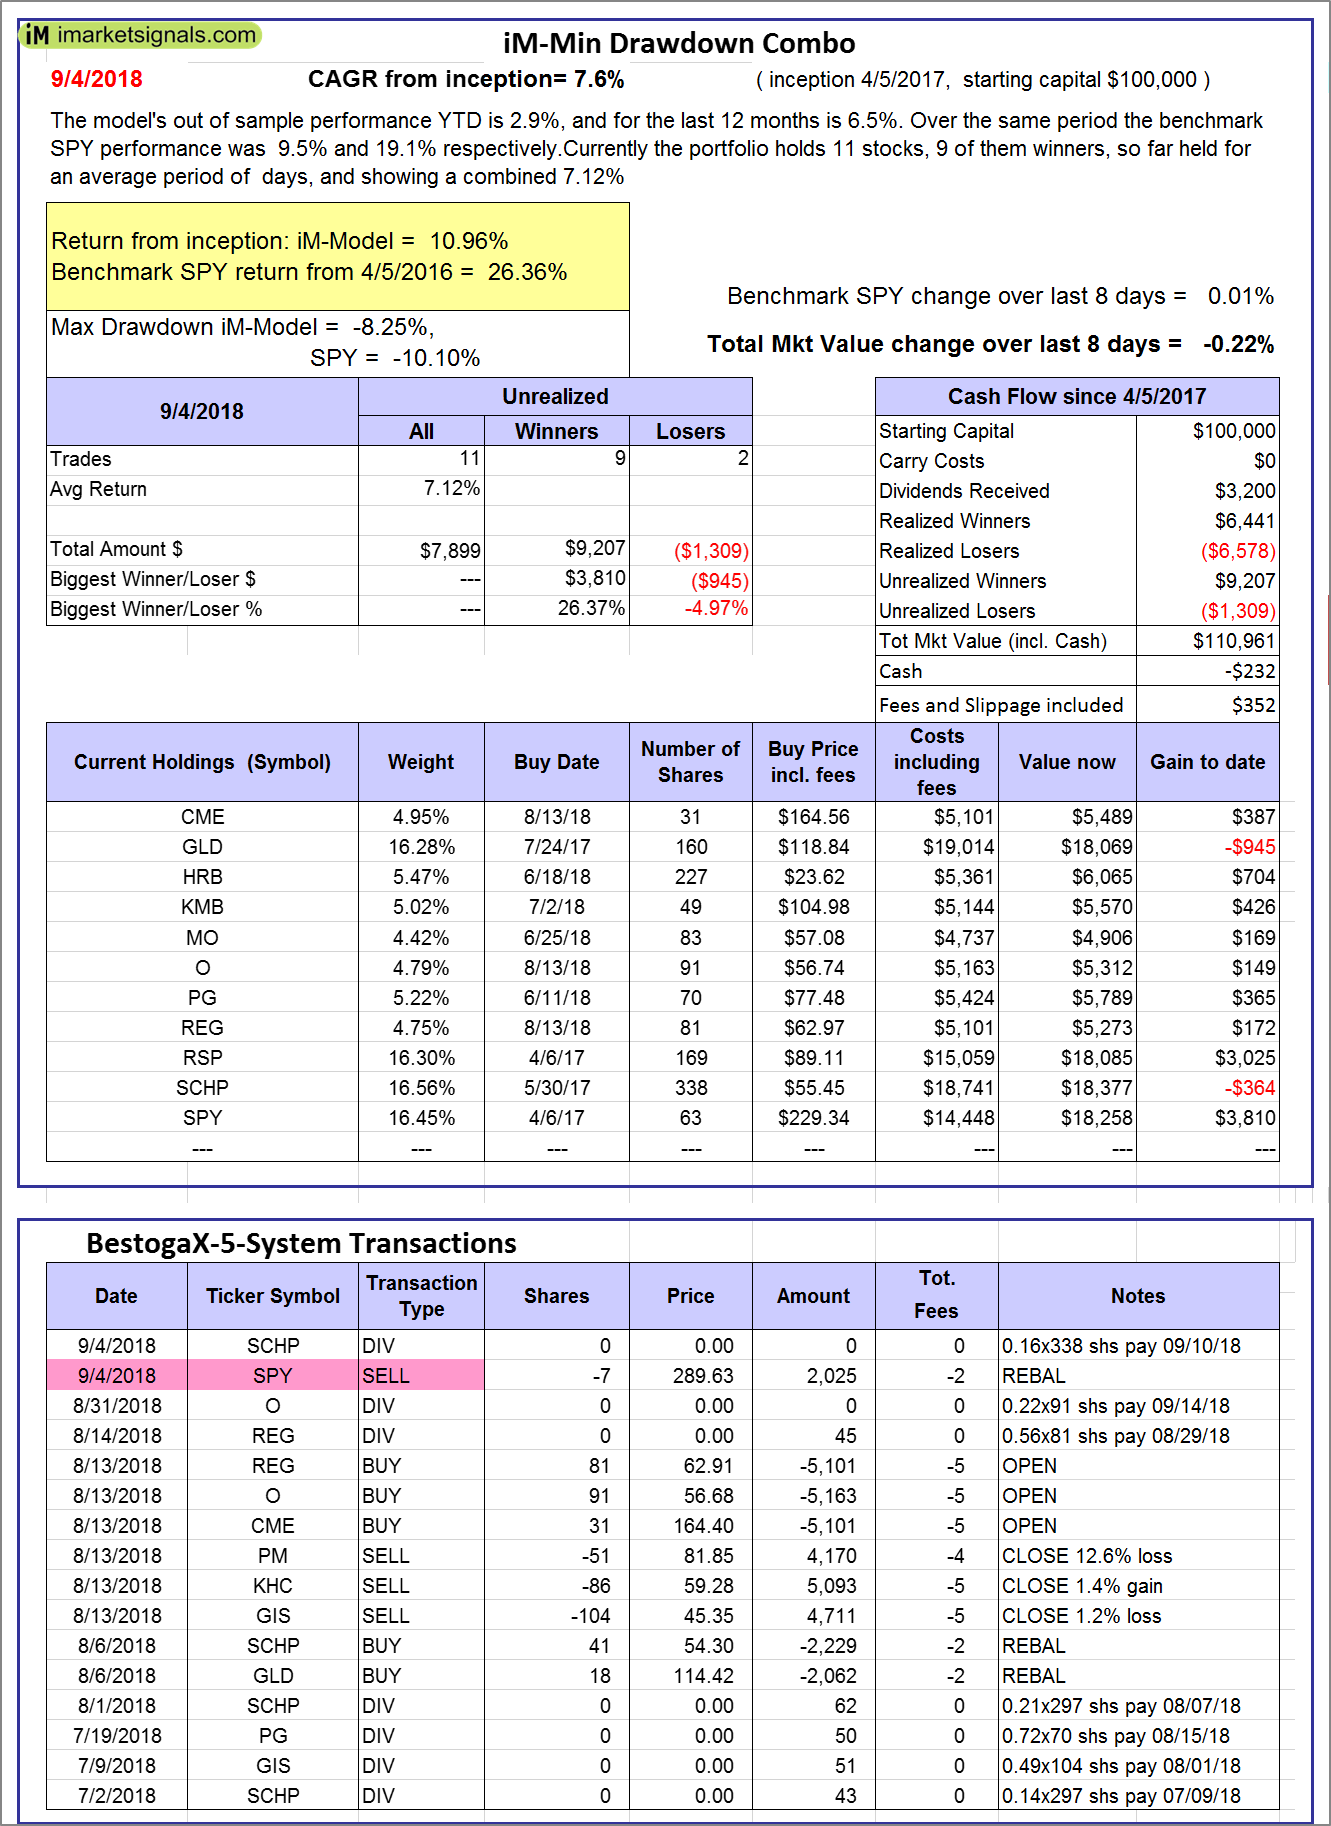 |
iM-Min Drawdown Combo: The model’s out of sample performance YTD is 2.9%, and for the last 12 months is 6.5%. Over the same period the benchmark SPY performance was 9.5% and 19.1% respectively. Over the previous week the market value of the iM-Min Drawdown Combo gained -0.22% at a time when SPY gained 0.01%. A starting capital of $100,000 at inception on 4/5/2017 would have grown to $110,961 which includes -$232 cash and excludes $352 spent on fees and slippage. |
 |
iM-5ETF Trader (includes leveraged ETFs): The model’s out of sample performance YTD is 18.4%, and for the last 12 months is 38.3%. Over the same period the benchmark SPY performance was 9.5% and 19.1% respectively. Over the previous week the market value of the iM-5ETF Trader (includes leveraged ETFs) gained 0.29% at a time when SPY gained 0.01%. A starting capital of $100,000 at inception on 10/30/2016 would have grown to $192,735 which includes $1,539 cash and excludes $1,030 spent on fees and slippage. |
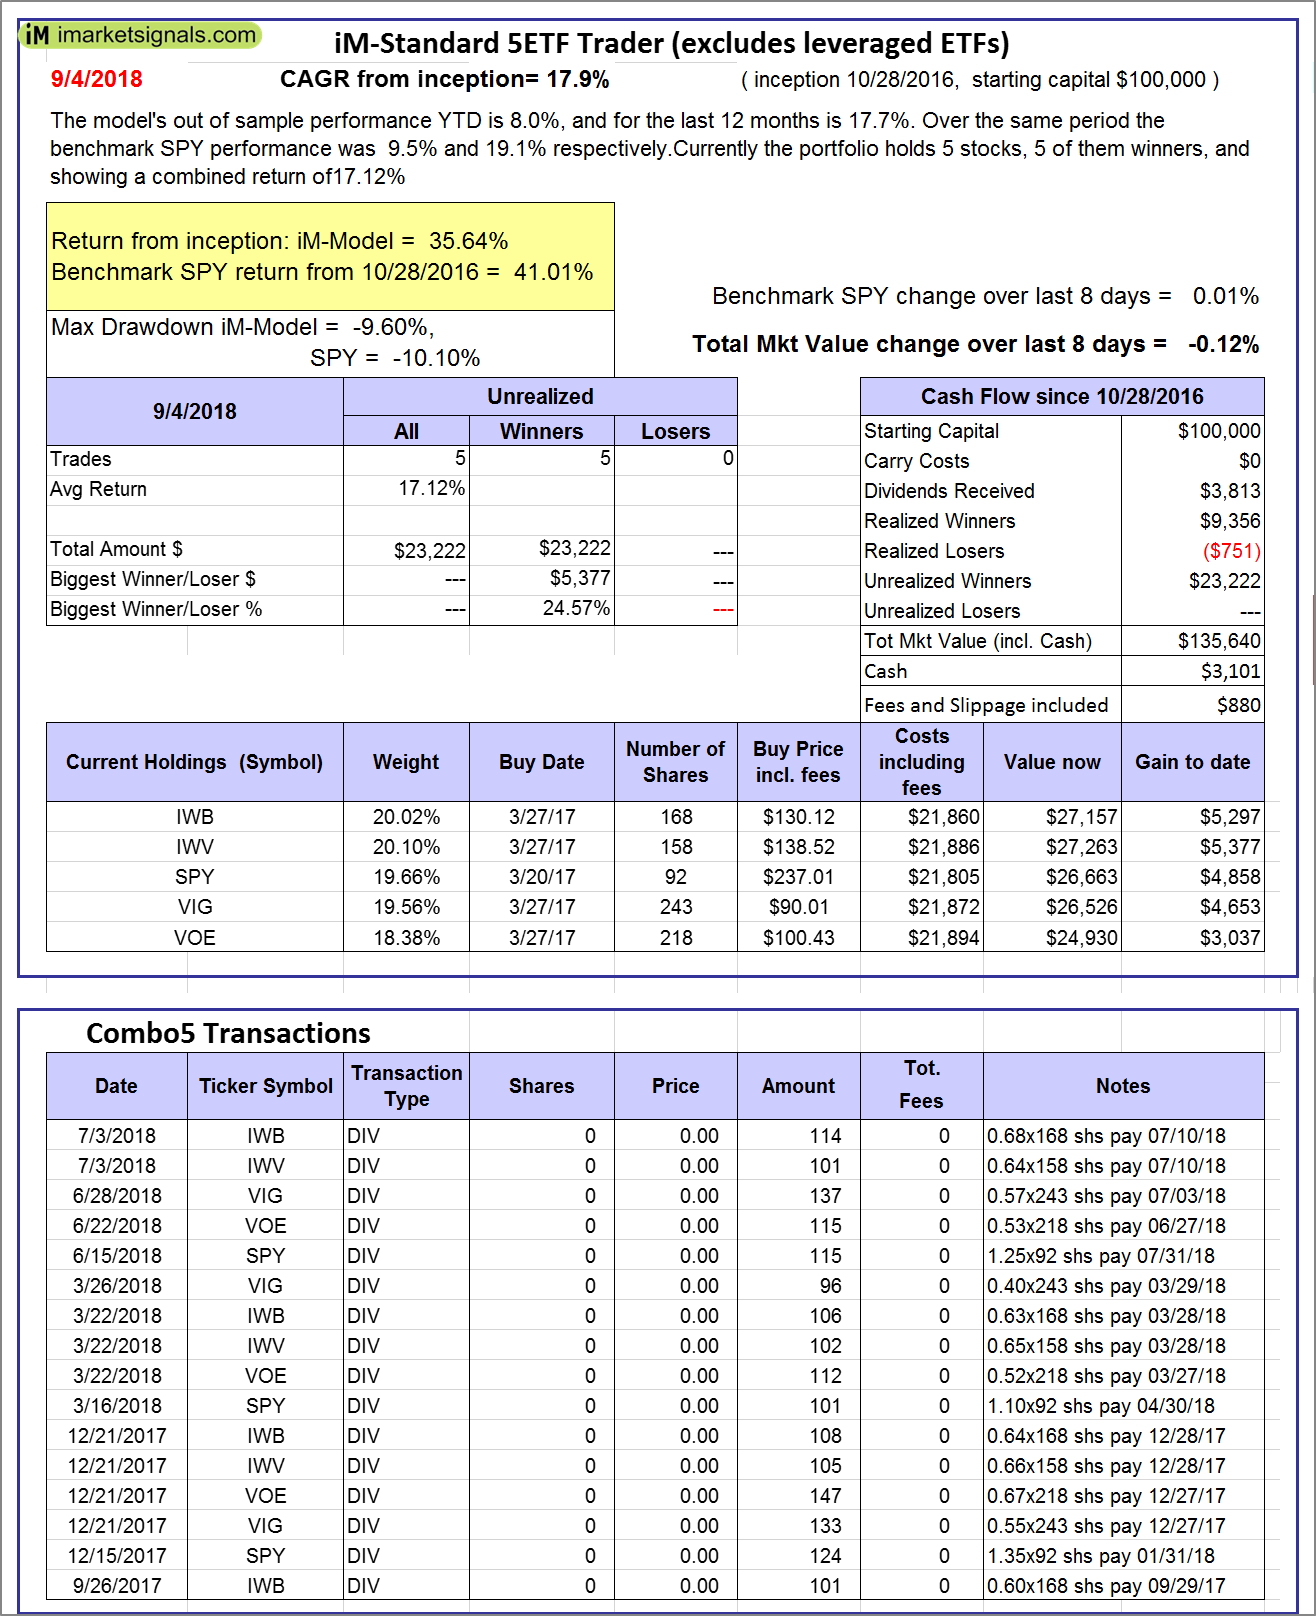 |
iM-Standard 5ETF Trader (excludes leveraged ETFs): The model’s out of sample performance YTD is 8.0%, and for the last 12 months is 17.7%. Over the same period the benchmark SPY performance was 9.5% and 19.1% respectively. Over the previous week the market value of the iM-Standard 5ETF Trader (excludes leveraged ETFs) gained -0.12% at a time when SPY gained 0.01%. A starting capital of $100,000 at inception on 10/30/2016 would have grown to $135,640 which includes $3,101 cash and excludes $880 spent on fees and slippage. |
iM-Best Reports – 9/4/2018
Posted in pmp SPY-SH
Leave a Reply
You must be logged in to post a comment.