
  |
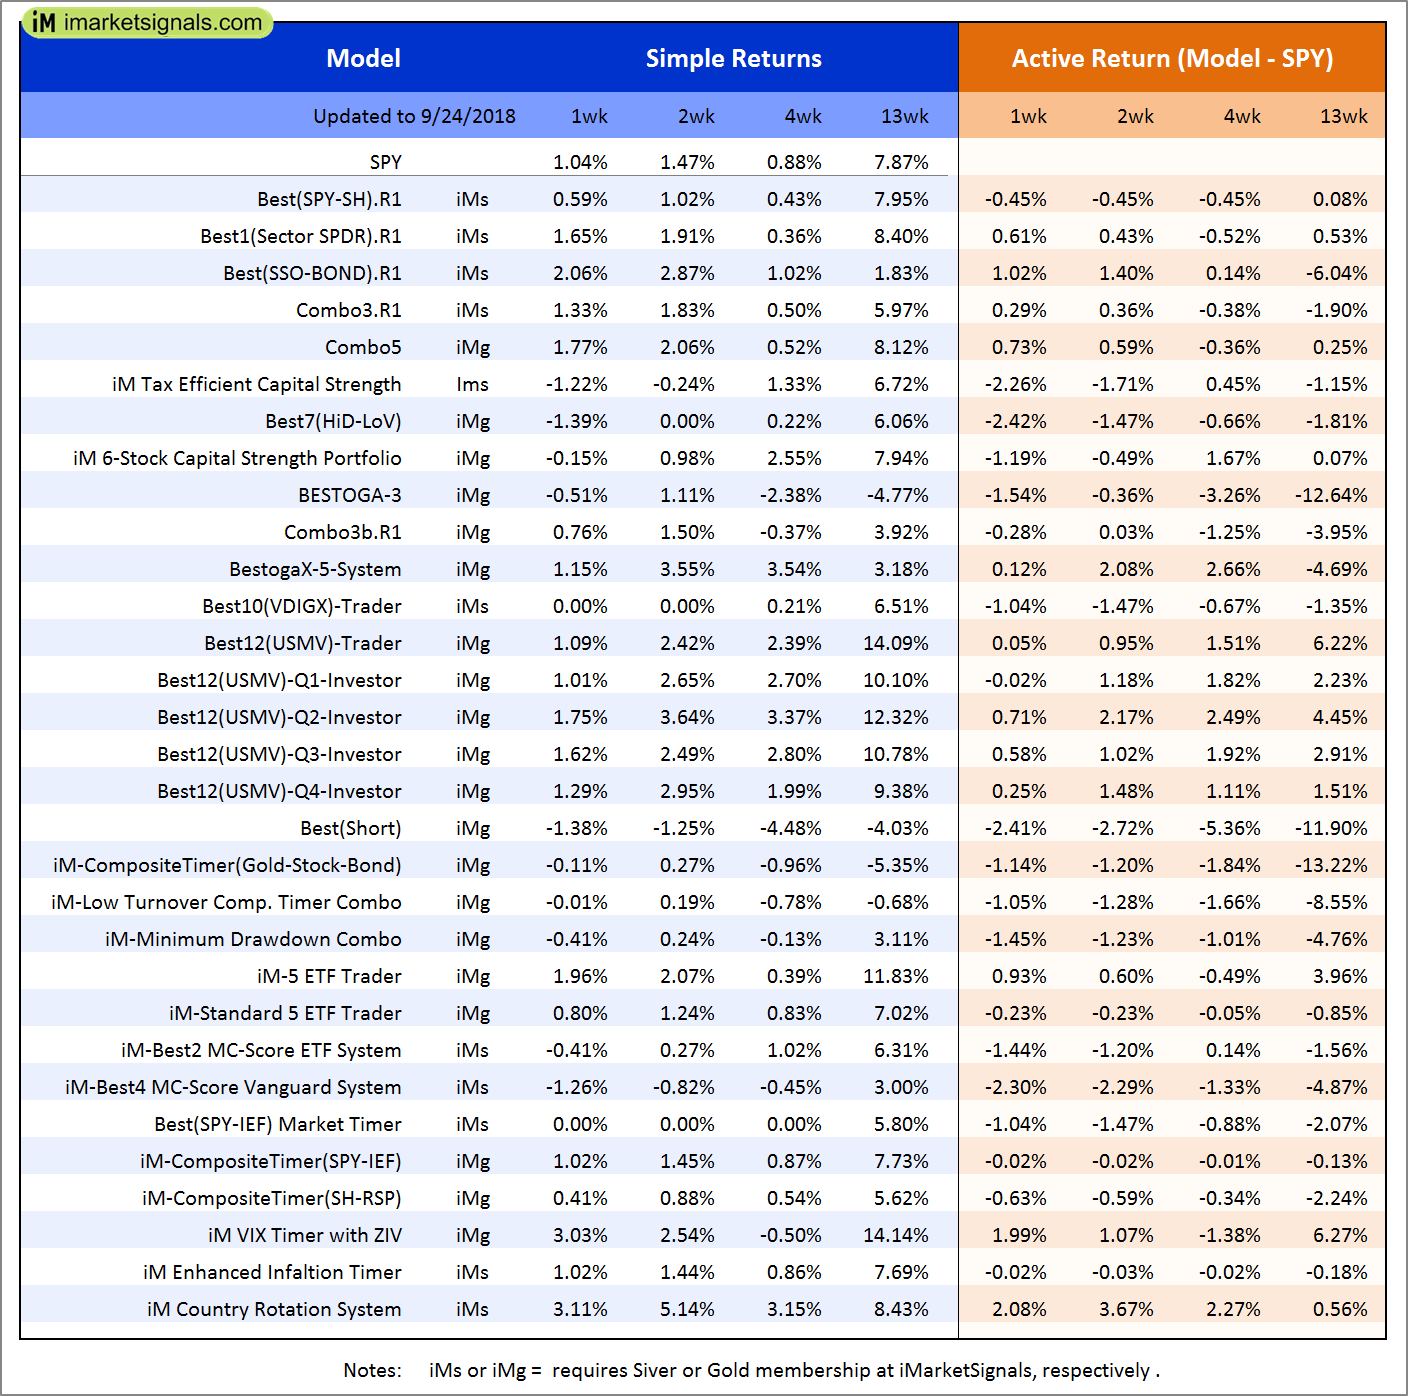
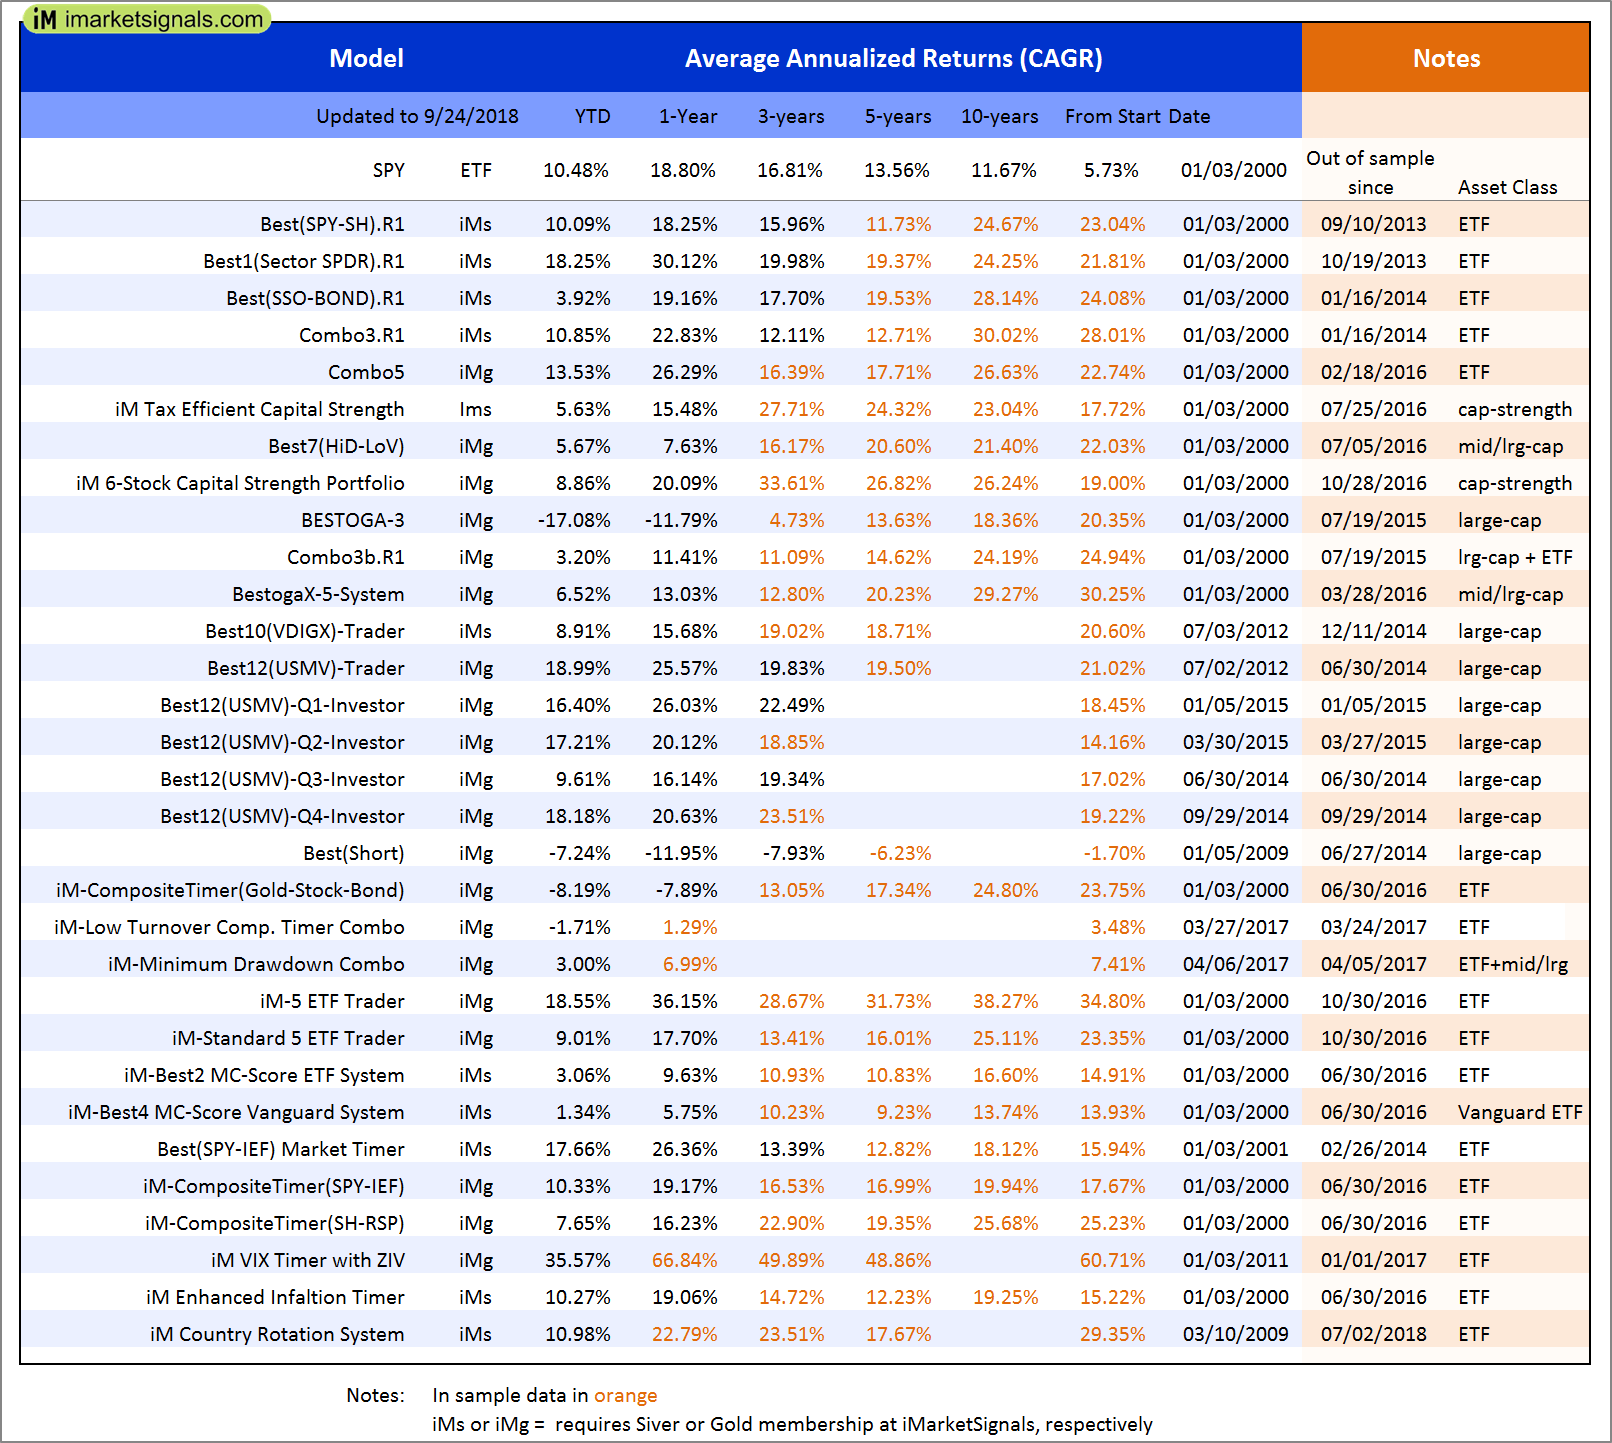
Out of sample performance summary of our models for the past 1, 2, 4 and 13 week periods. The active active return indicates how the models over- or underperformed the benchmark ETF SPY. Also the YTD, and the 1-, 3-, 5- and 10-year annualized returns are shown in the second table |
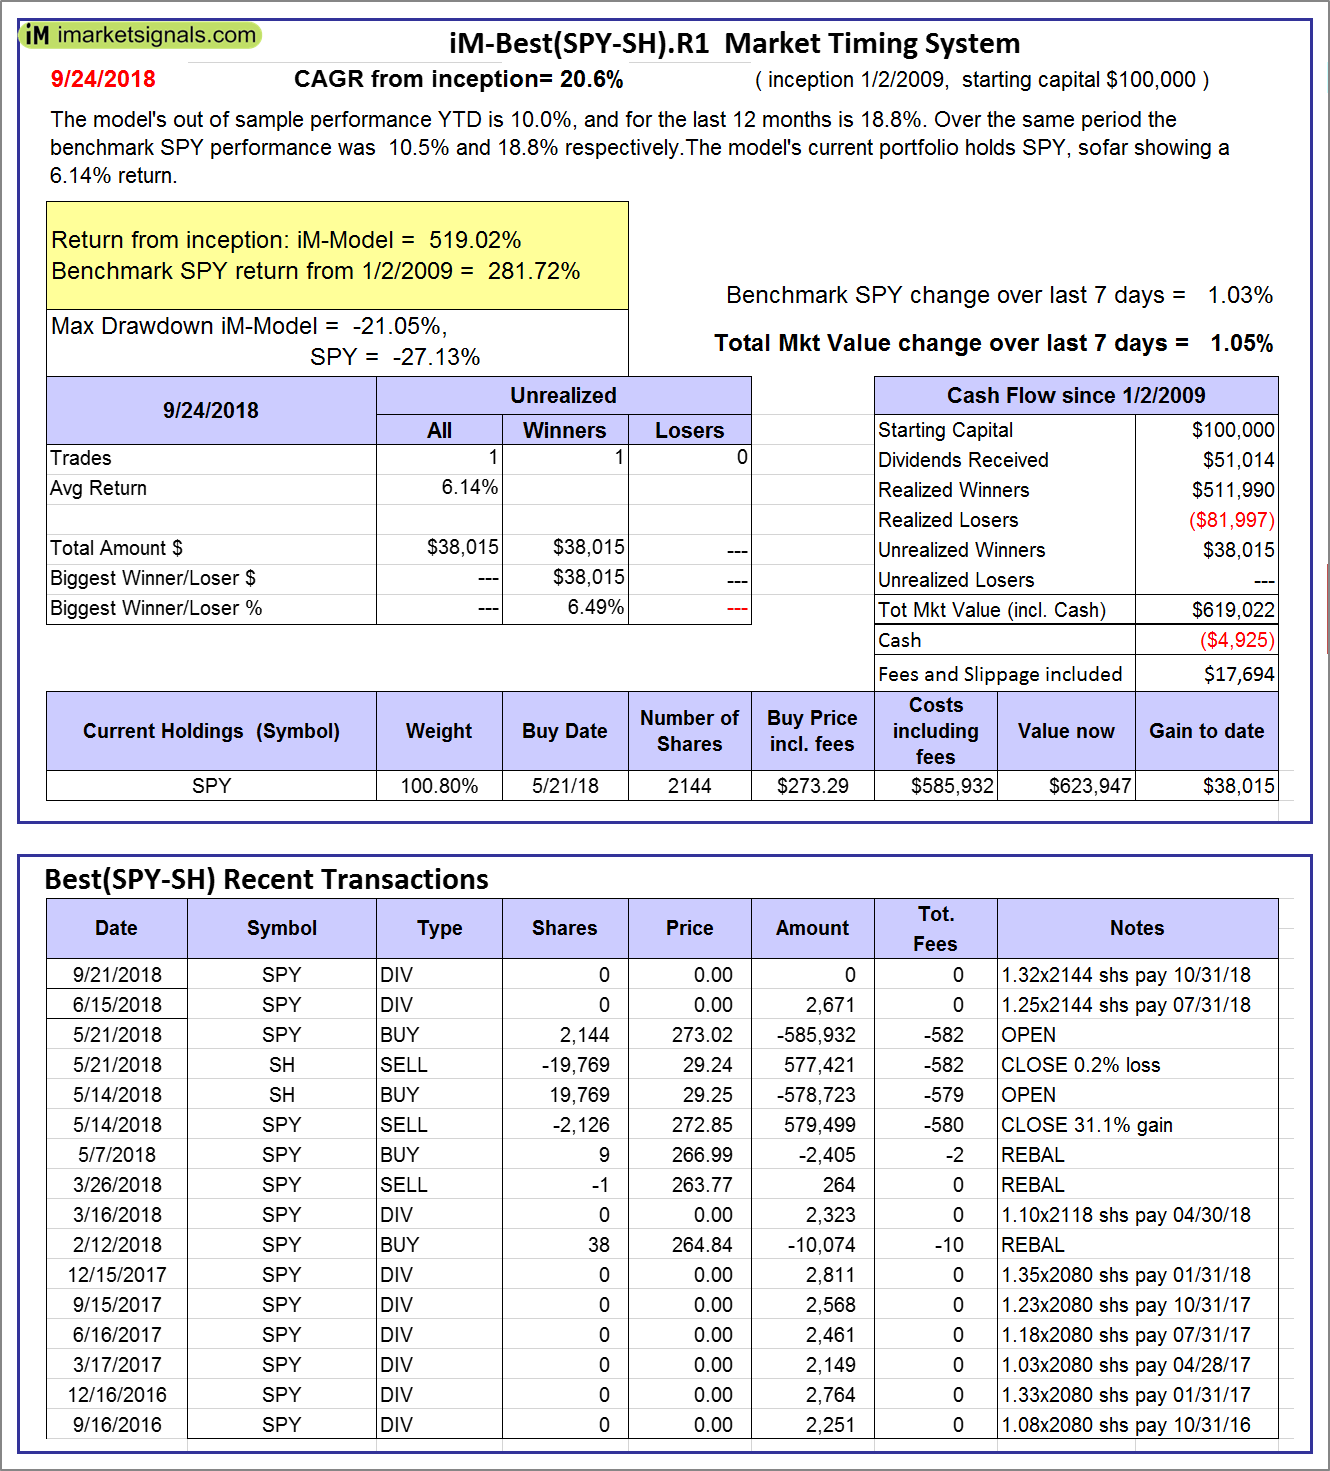 |
iM-Best(SPY-SH).R1: The model’s out of sample performance YTD is 10.0%, and for the last 12 months is 18.8%. Over the same period the benchmark SPY performance was 10.5% and 18.8% respectively. Over the previous week the market value of Best(SPY-SH) gained 1.05% at a time when SPY gained 1.03%. A starting capital of $100,000 at inception on 1/2/2009 would have grown to $619,022 which includes -$4,925 cash and excludes $17,694 spent on fees and slippage. |
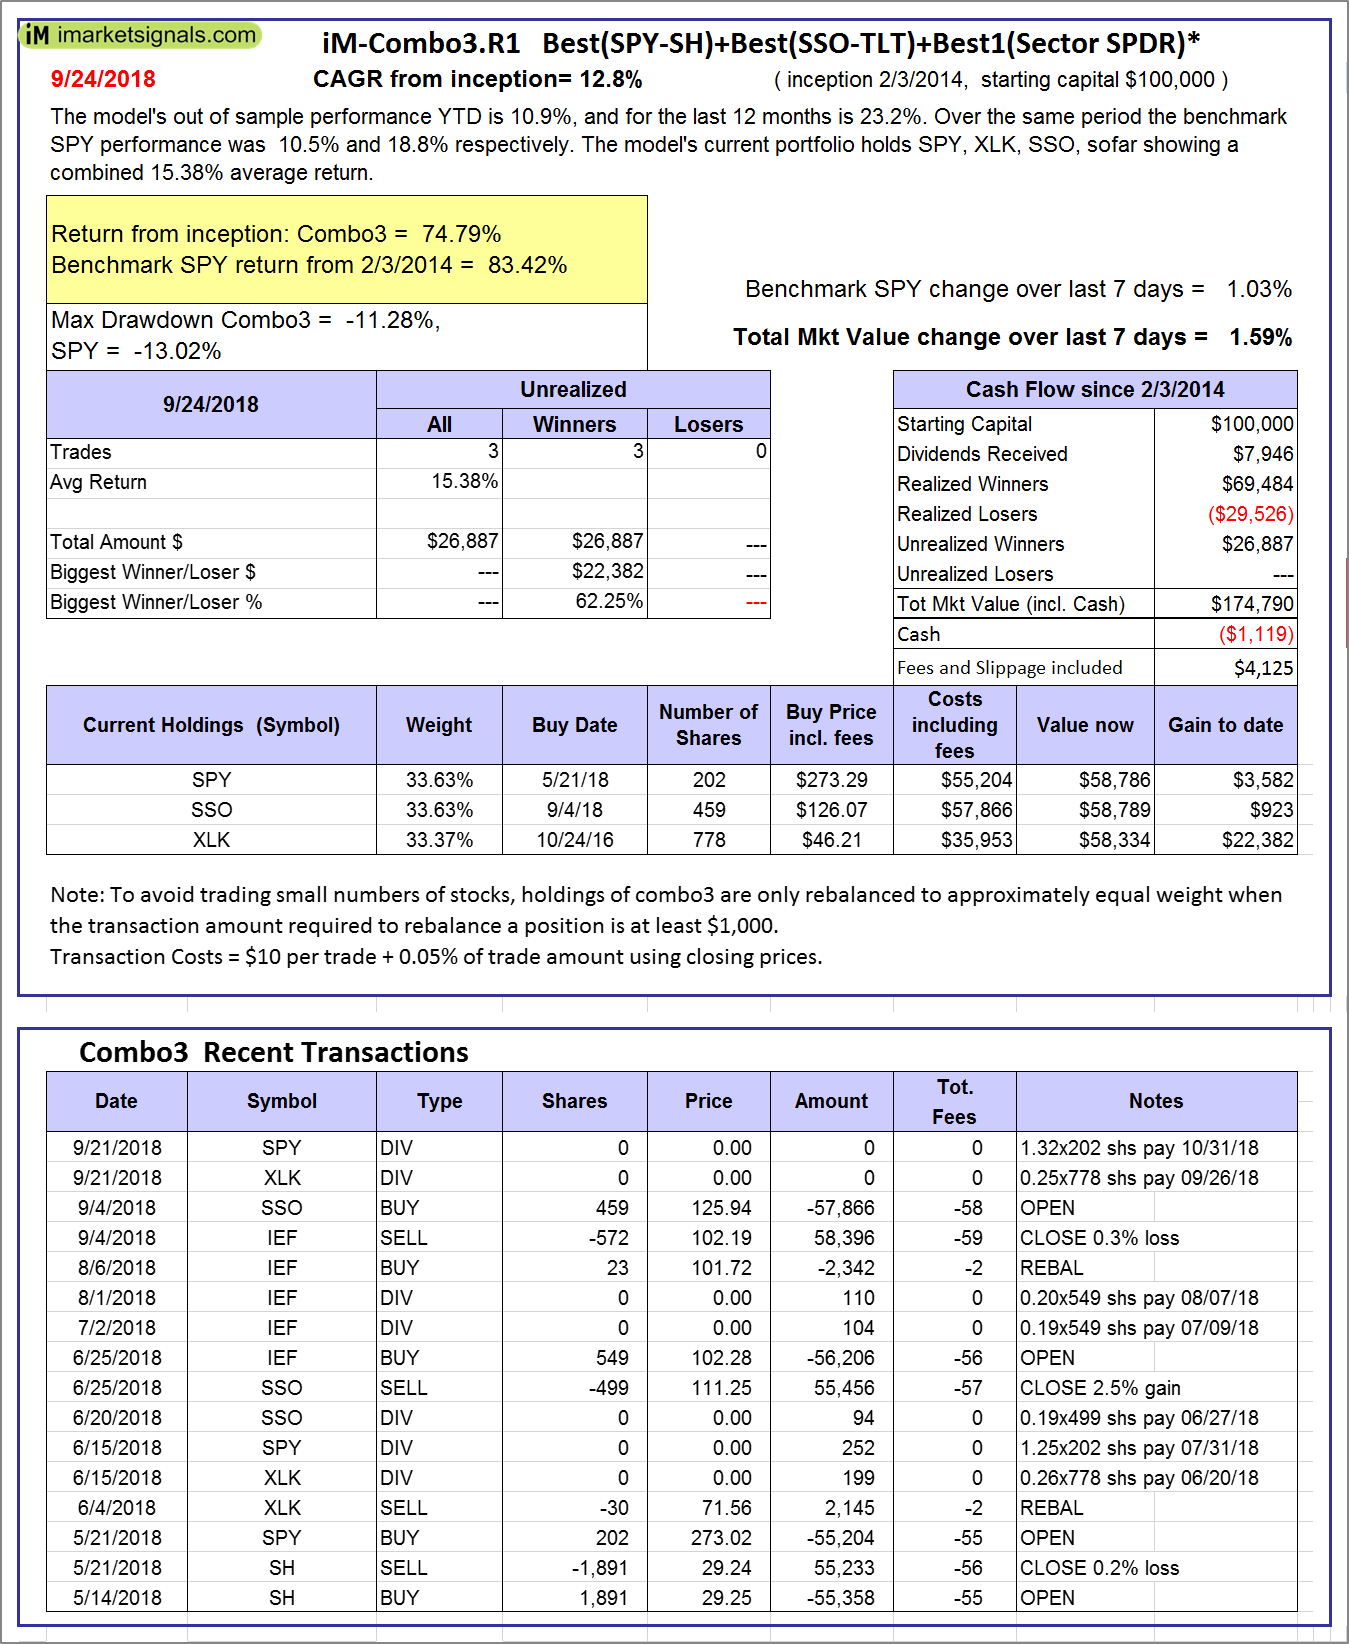 |
iM-Combo3.R1: The model’s out of sample performance YTD is 10.9%, and for the last 12 months is 23.2%. Over the same period the benchmark SPY performance was 10.5% and 18.8% respectively. Over the previous week the market value of iM-Combo3.R1 gained 1.59% at a time when SPY gained 1.03%. A starting capital of $100,000 at inception on 2/3/2014 would have grown to $174,790 which includes -$1,119 cash and excludes $4,125 spent on fees and slippage. |
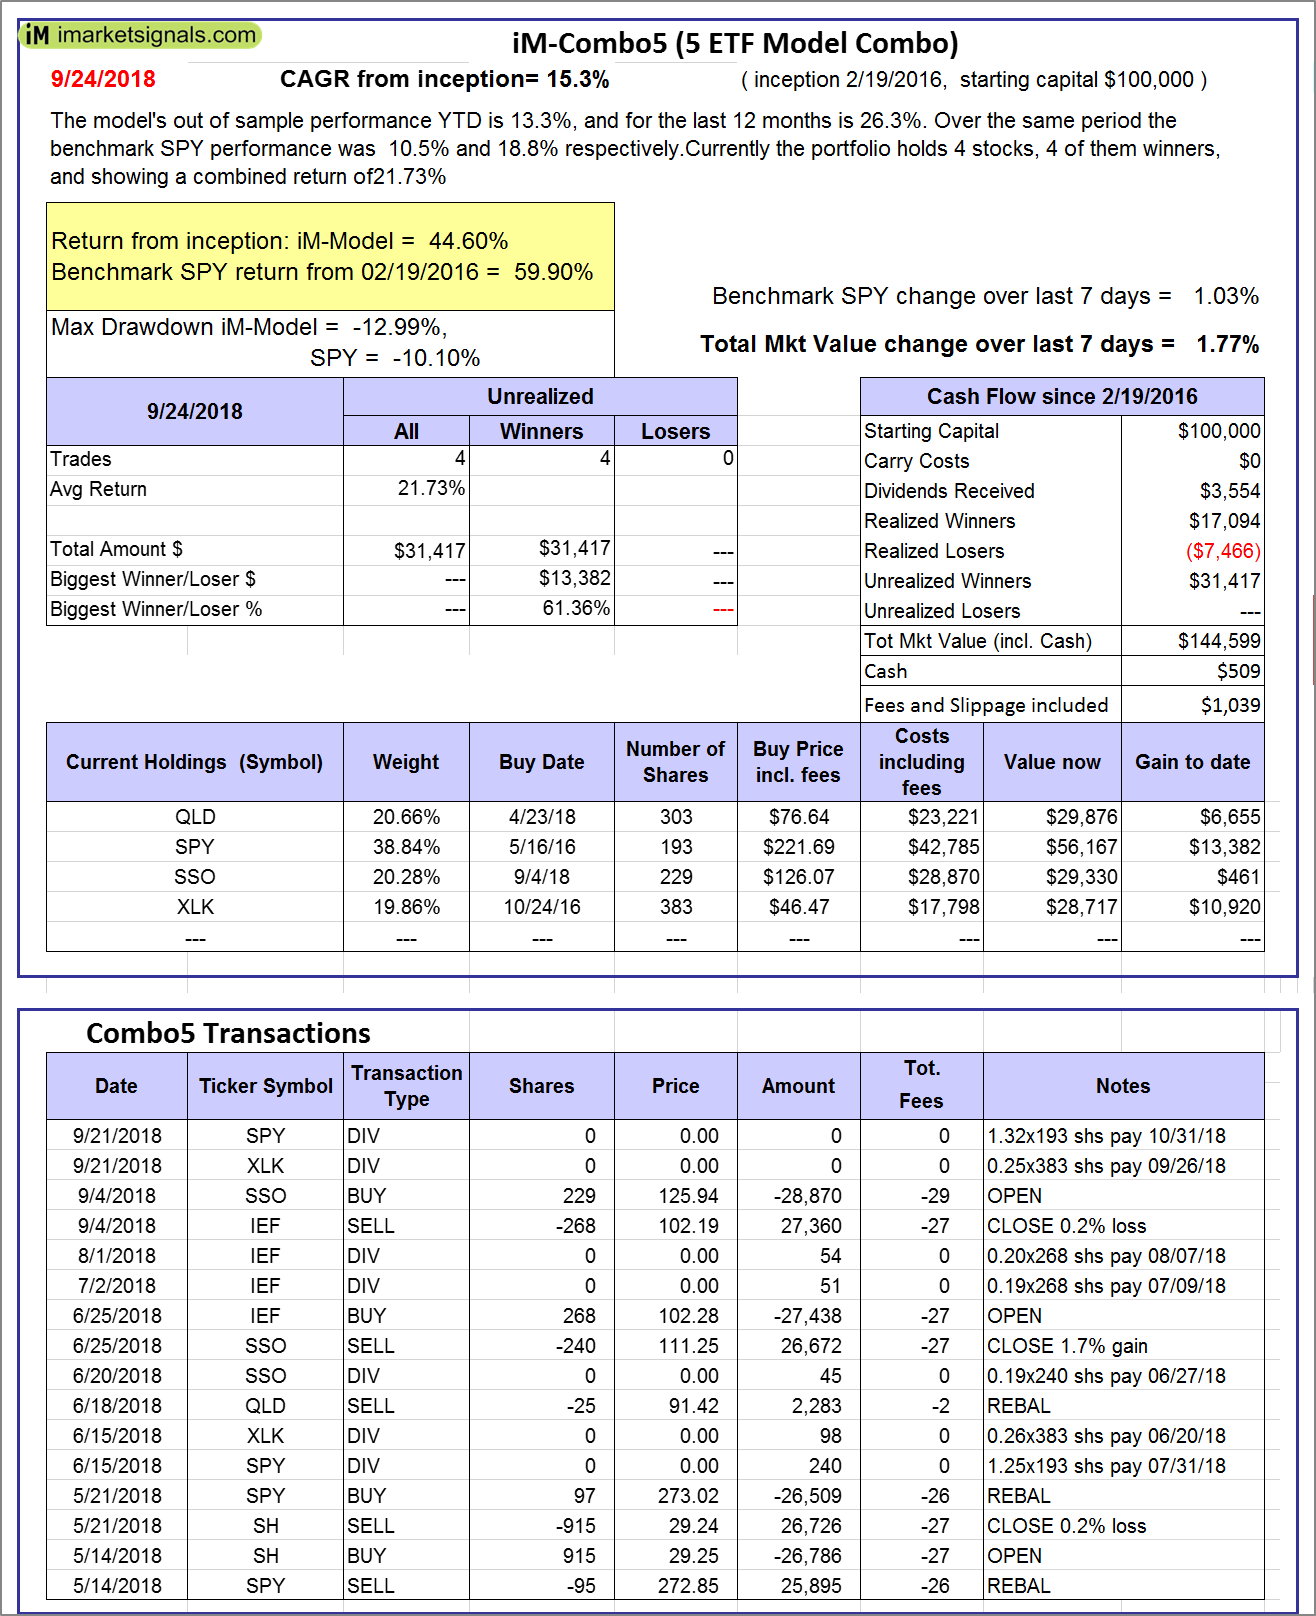 |
iM-Combo5: The model’s out of sample performance YTD is 13.3%, and for the last 12 months is 26.3%. Over the same period the benchmark SPY performance was 10.5% and 18.8% respectively. Over the previous week the market value of iM-Combo5 gained 1.77% at a time when SPY gained 1.03%. A starting capital of $100,000 at inception on 2/22/2016 would have grown to $144,599 which includes $509 cash and excludes $1,039 spent on fees and slippage. |
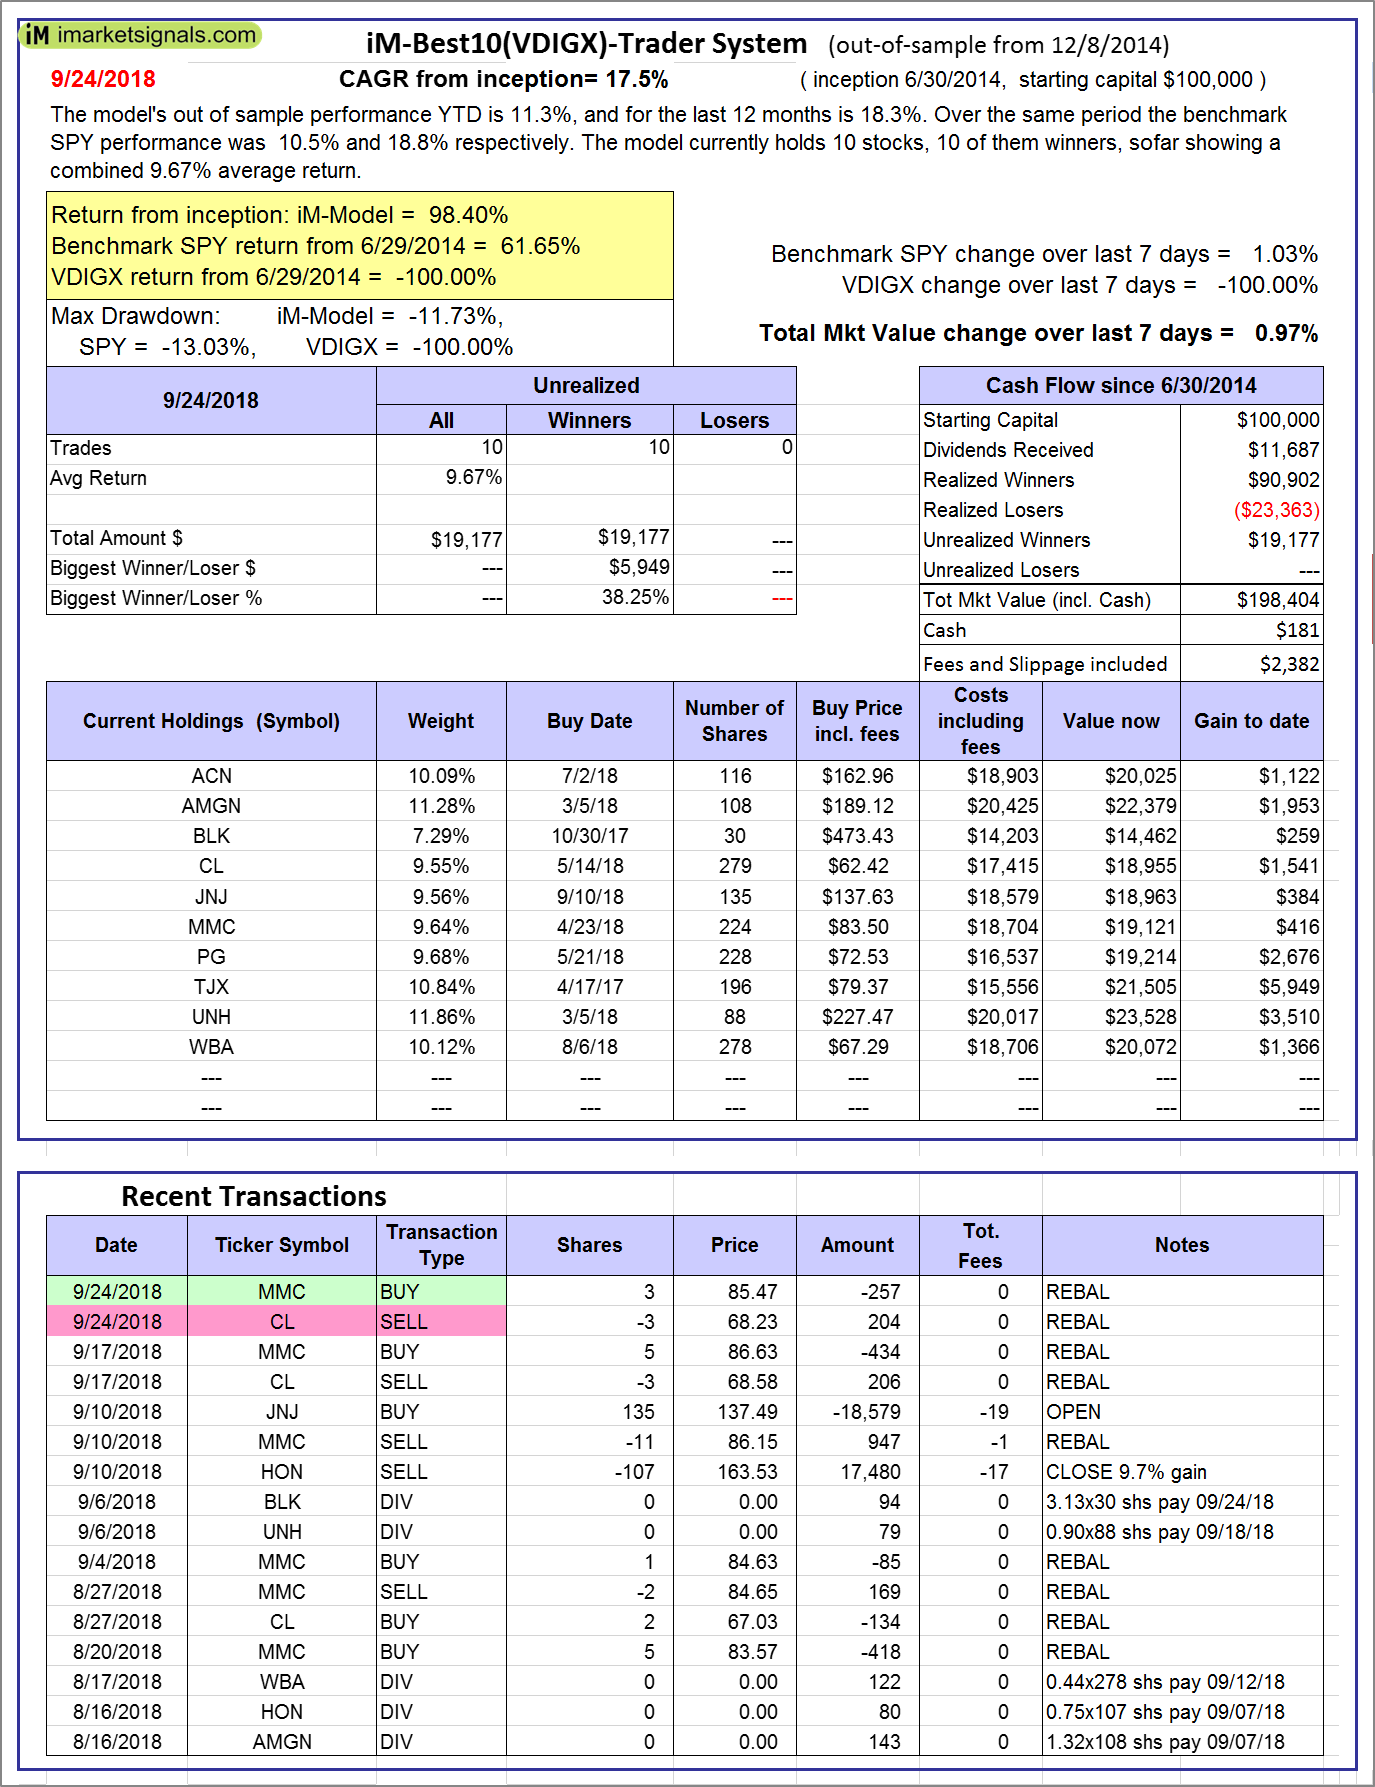 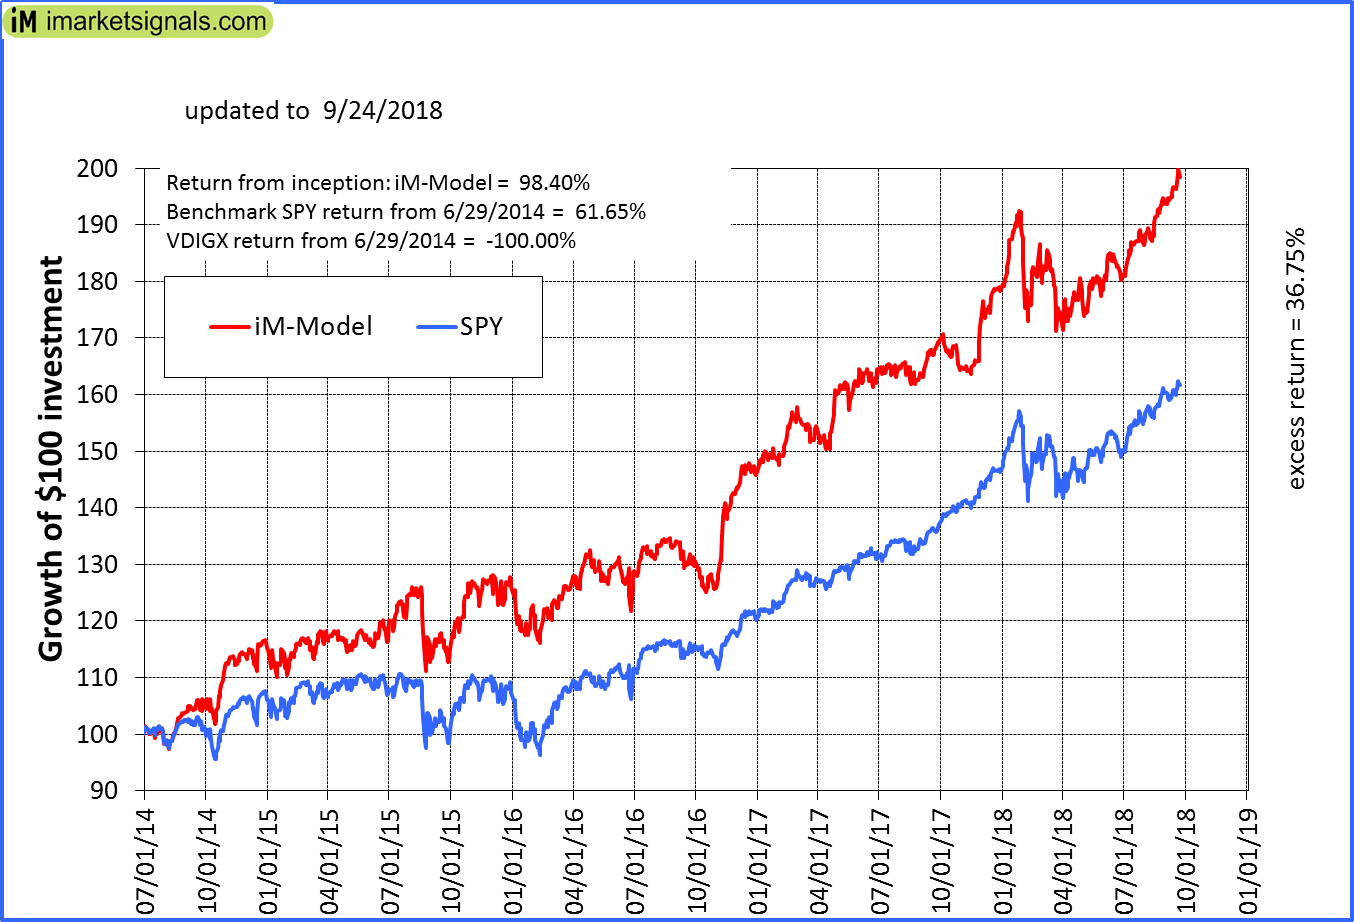 |
iM-Best10(VDIGX)-Trader: The model’s out of sample performance YTD is 11.3%, and for the last 12 months is 18.3%. Over the same period the benchmark SPY performance was 10.5% and 18.8% respectively. Since inception, on 7/1/2014, the model gained 98.40% while the benchmark SPY gained 61.65% and VDIGX gained -100.00% over the same period. Over the previous week the market value of iM-Best10(VDIGX) gained 0.97% at a time when SPY gained 1.03%. A starting capital of $100,000 at inception on 7/1/2014 would have grown to $198,404 which includes $181 cash and excludes $2,382 spent on fees and slippage. |
 |
iM-BESTOGA-3: The model’s out of sample performance YTD is -17.4%, and for the last 12 months is -11.8%. Over the same period the benchmark SPY performance was 10.5% and 18.8% respectively. Over the previous week the market value of iM-BESTOGA-3 gained -0.94% at a time when SPY gained 1.03%. A starting capital of $100,000 at inception on 2/3/2014 would have grown to $190,709 which includes $785 cash and excludes $2,946 spent on fees and slippage. |
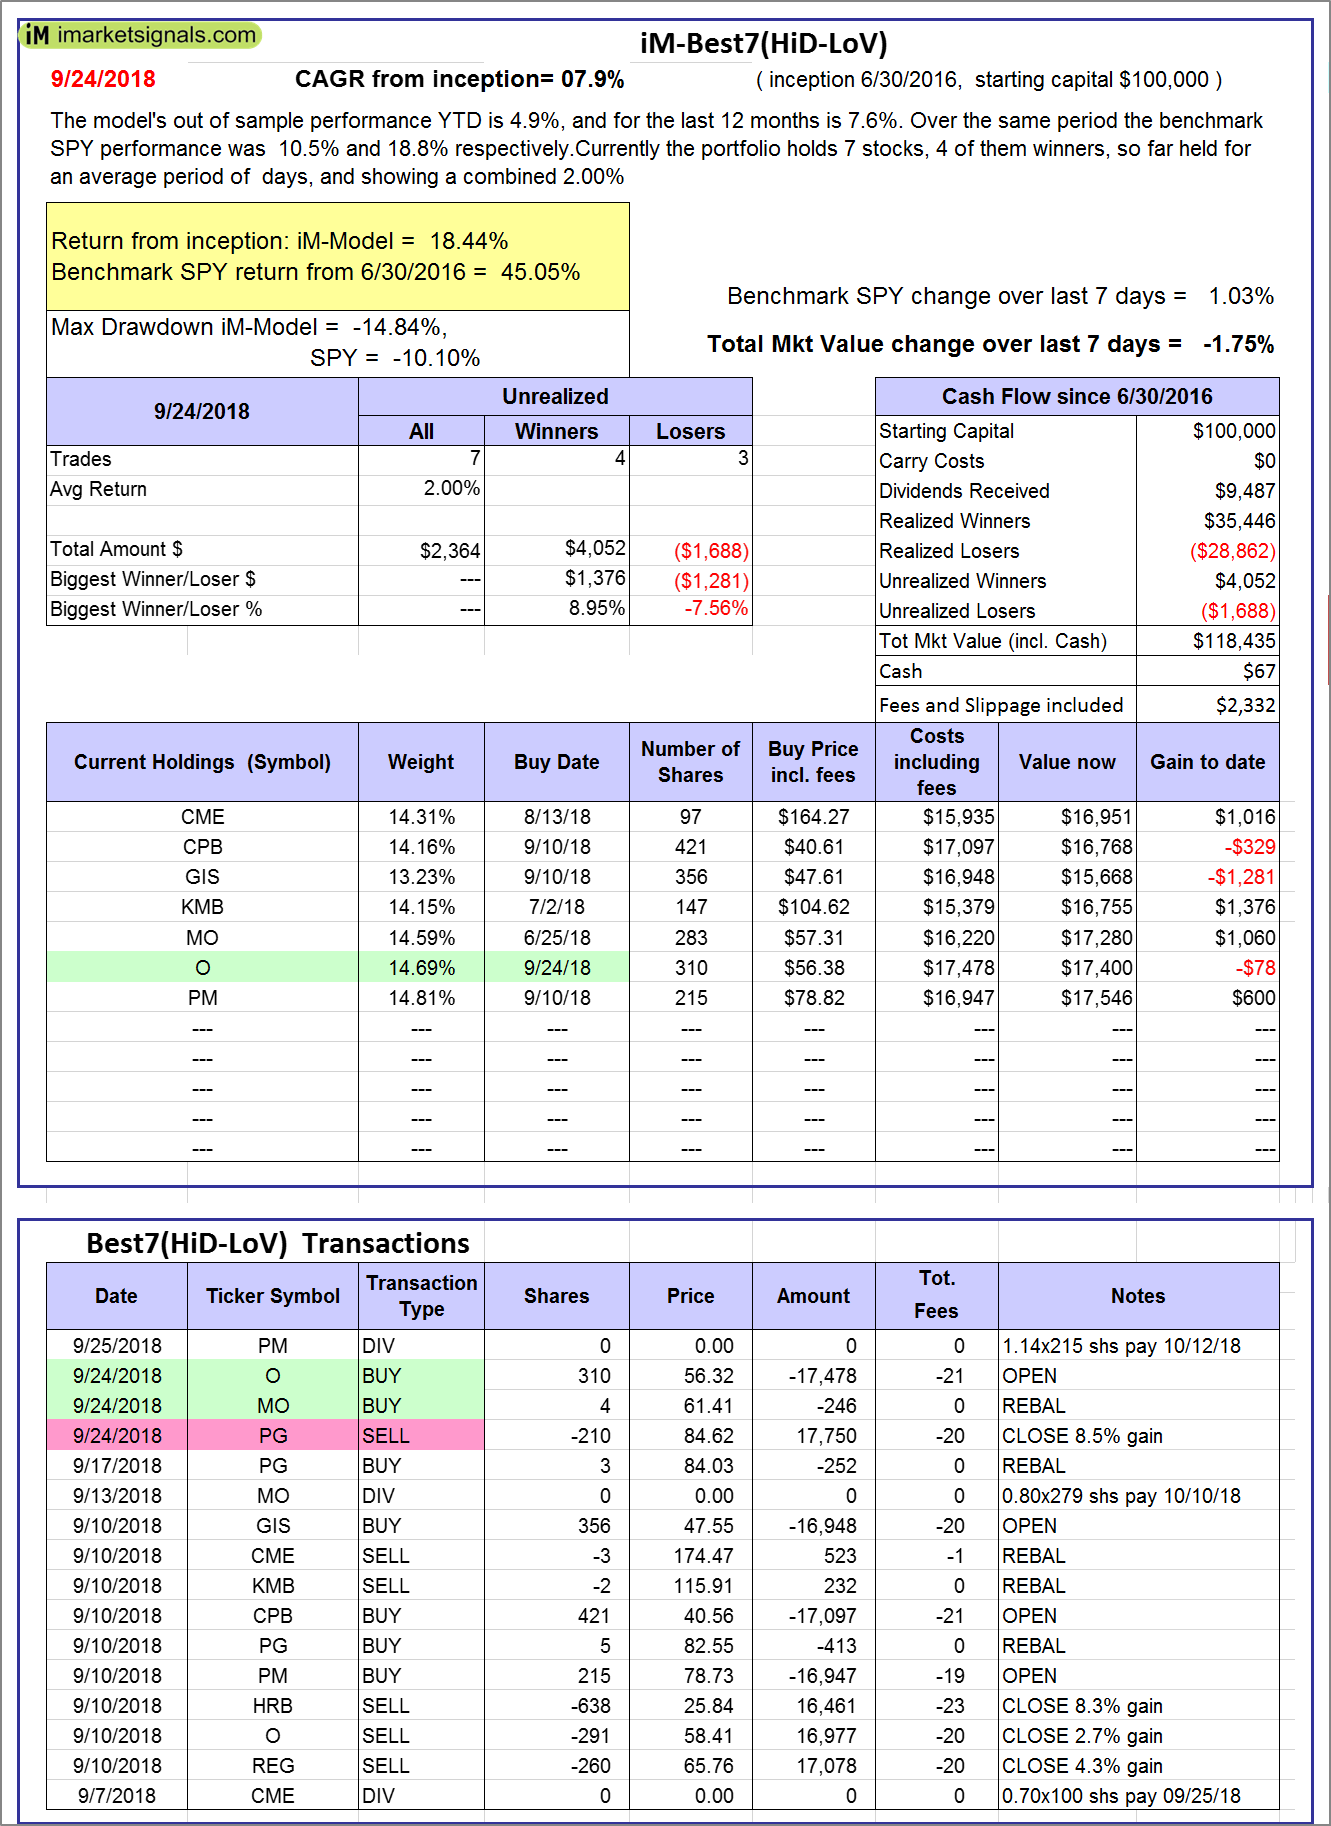 |
iM-Best7(HiD-LoV): The model’s out of sample performance YTD is 4.9%, and for the last 12 months is 7.6%. Over the same period the benchmark SPY performance was 10.5% and 18.8% respectively. Over the previous week the market value of iM-BESTOGA-3 gained -1.75% at a time when SPY gained 1.03%. A starting capital of $100,000 at inception on 6/30/2016 would have grown to $118,435 which includes $67 cash and excludes $2,332 spent on fees and slippage. |
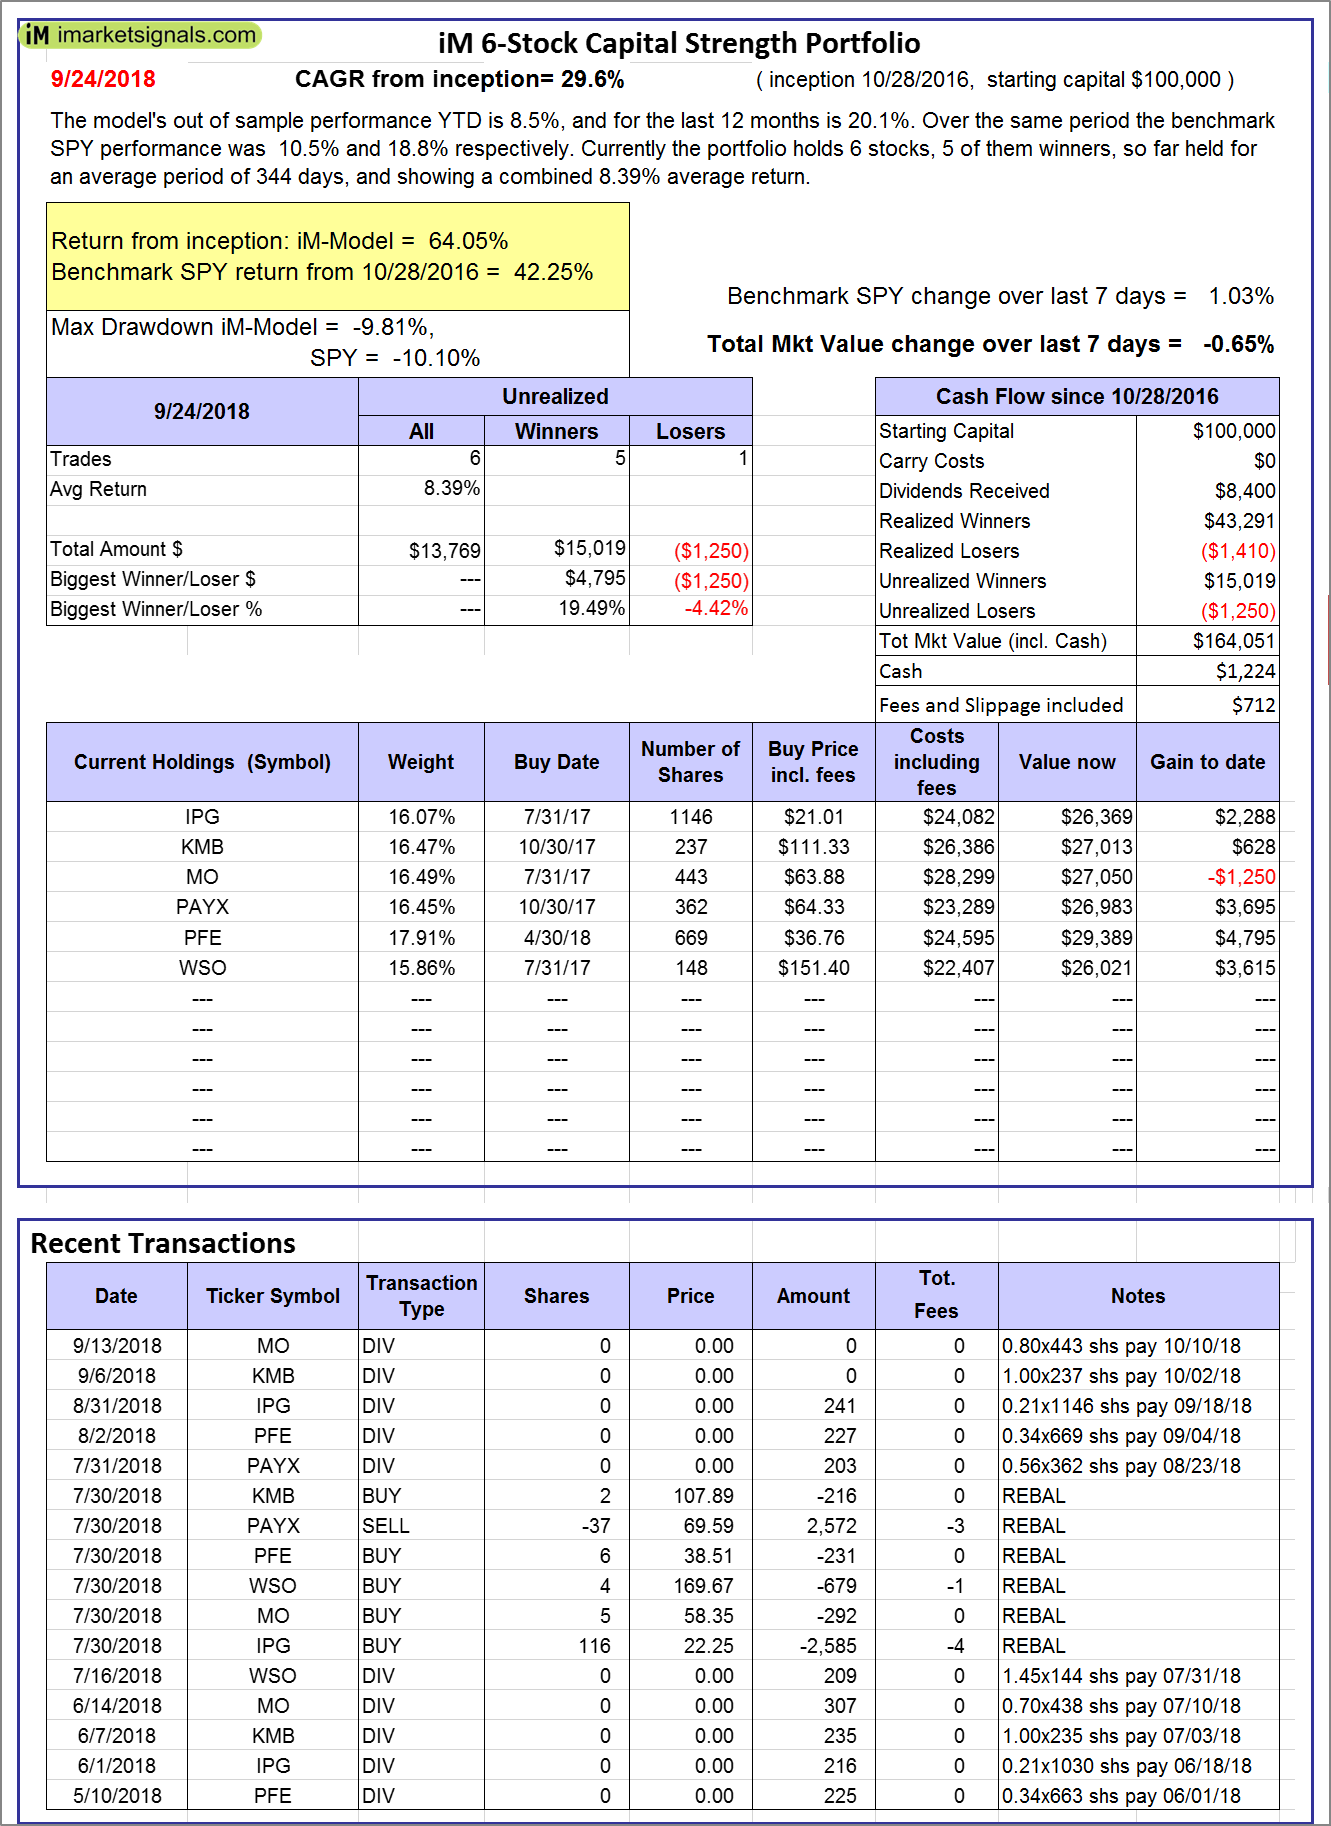 |
iM 6-Stock Capital Strength Portfolio: The model’s out of sample performance YTD is 8.5%, and for the last 12 months is 20.1%. Over the same period the benchmark SPY performance was 10.5% and 18.8% respectively. Over the previous week the market value of the iM 6-Stock Capital Strength Portfolio gained -0.65% at a time when SPY gained 1.03%. A starting capital of $100,000 at inception on 10/28/2016 would have grown to $164,051 which includes $1,224 cash and excludes $712 spent on fees and slippage. |
 |
iM-BestogaX5-System: The model’s out of sample performance YTD is 5.7%, and for the last 12 months is 13.0%. Over the same period the benchmark SPY performance was 10.5% and 18.8% respectively. Over the previous week the market value of iM-BestogaX5-System gained 0.44% at a time when SPY gained 1.03%. A starting capital of $100,000 at inception on 3/28/2016 would have grown to $117,966 which includes $639 cash and excludes $1,256 spent on fees and slippage. |
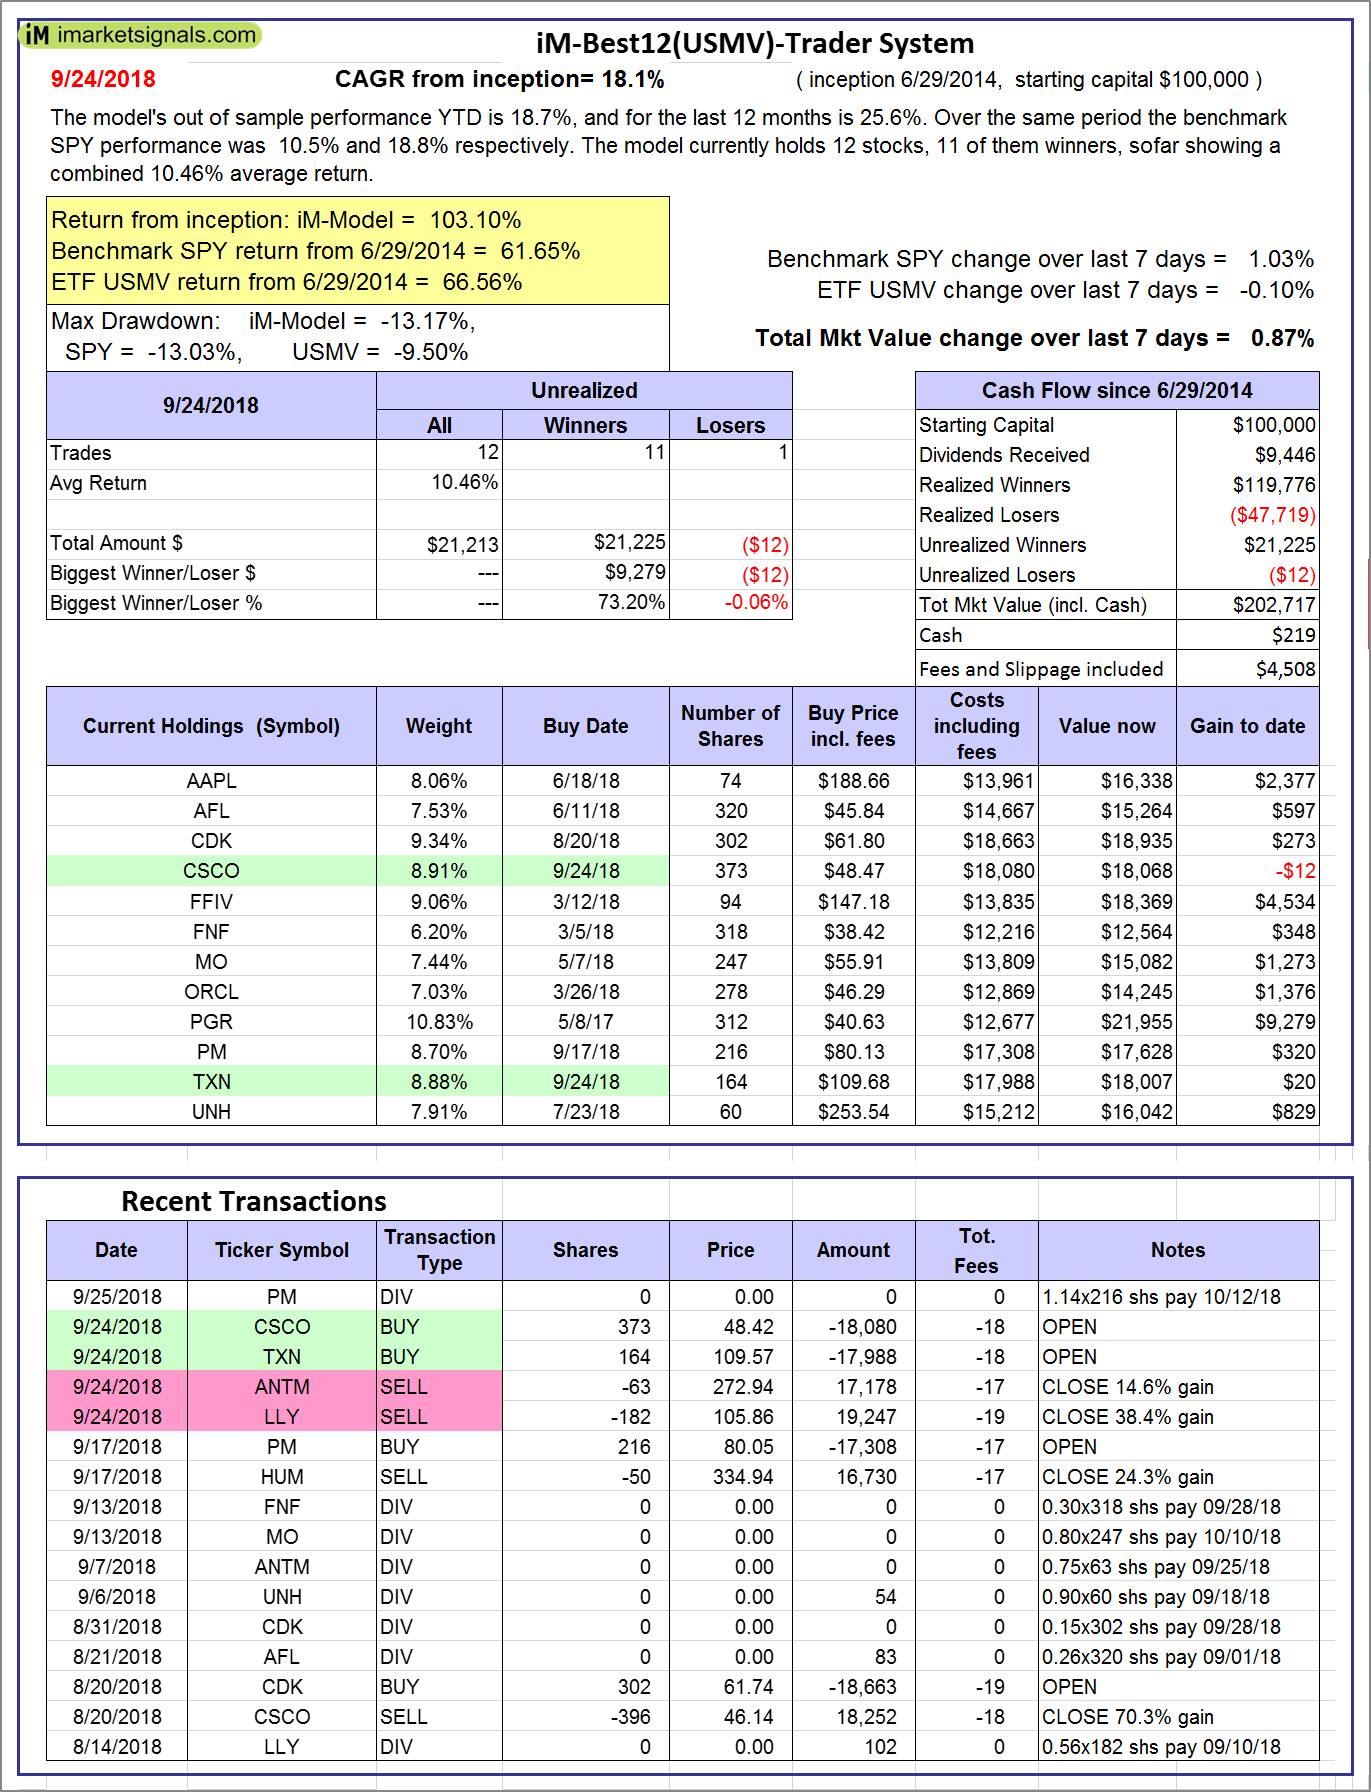 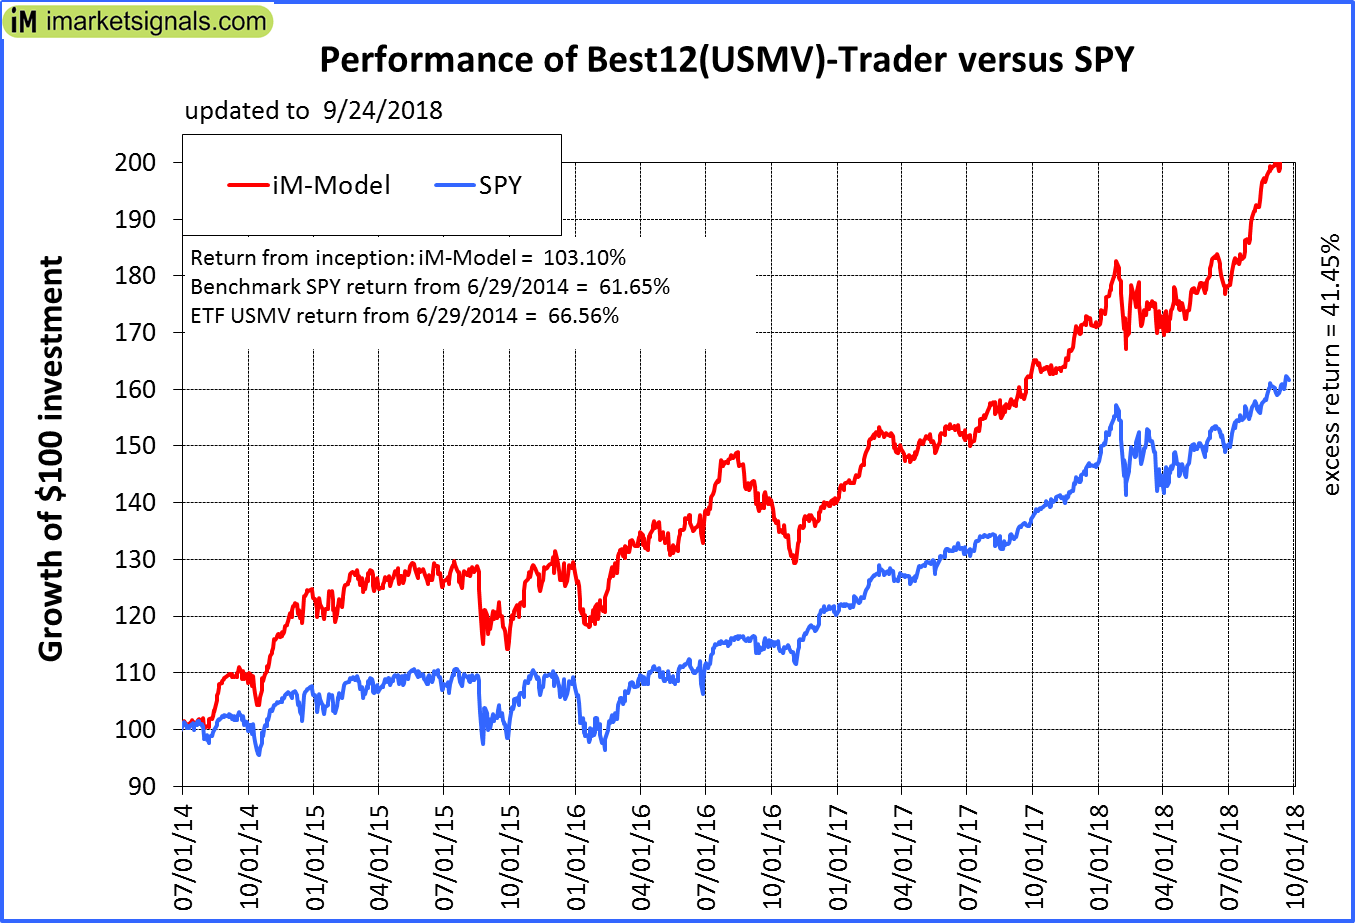 |
iM-Best12(USMV)-Trader: The model’s out of sample performance YTD is 18.7%, and for the last 12 months is 25.6%. Over the same period the benchmark SPY performance was 10.5% and 18.8% respectively. Since inception, on 6/30/2014, the model gained 103.10% while the benchmark SPY gained 61.65% and the ETF USMV gained 66.56% over the same period. Over the previous week the market value of iM-Best12(USMV)-Trader gained 0.87% at a time when SPY gained 1.03%. A starting capital of $100,000 at inception on 6/30/2014 would have grown to $202,717 which includes $219 cash and excludes $4,508 spent on fees and slippage. |
 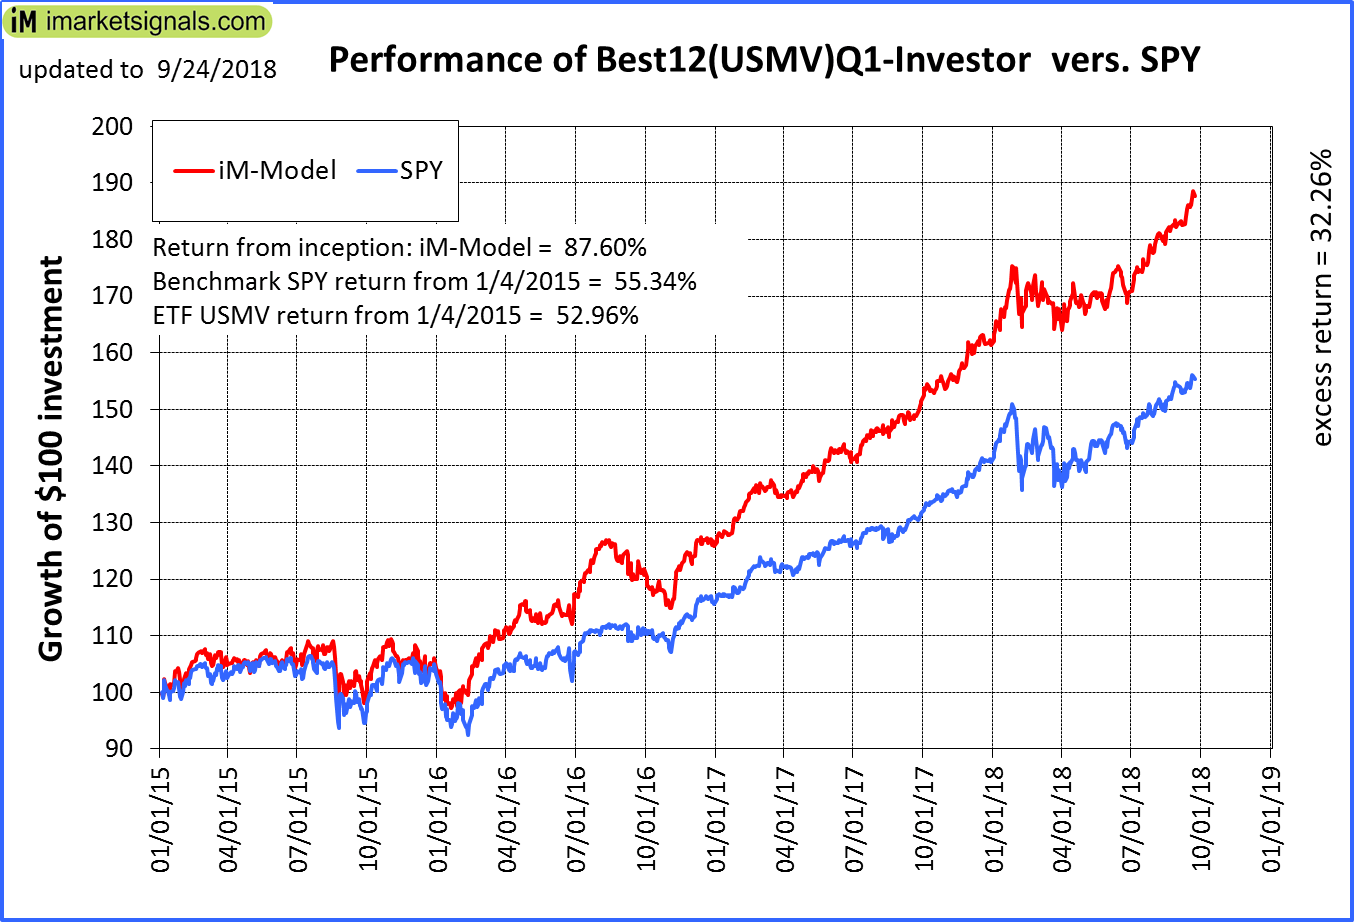 |
iM-Best12(USMV)Q1-Investor: The model’s out of sample performance YTD is 16.2%, and for the last 12 months is 26.0%. Over the same period the benchmark SPY performance was 10.5% and 18.8% respectively. Since inception, on 1/5/2015, the model gained 87.60% while the benchmark SPY gained 55.34% and the ETF USMV gained 52.96% over the same period. Over the previous week the market value of iM-Best12(USMV)Q1 gained 1.01% at a time when SPY gained 1.03%. A starting capital of $100,000 at inception on 1/5/2015 would have grown to $187,079 which includes $209 cash and excludes $1,252 spent on fees and slippage. |
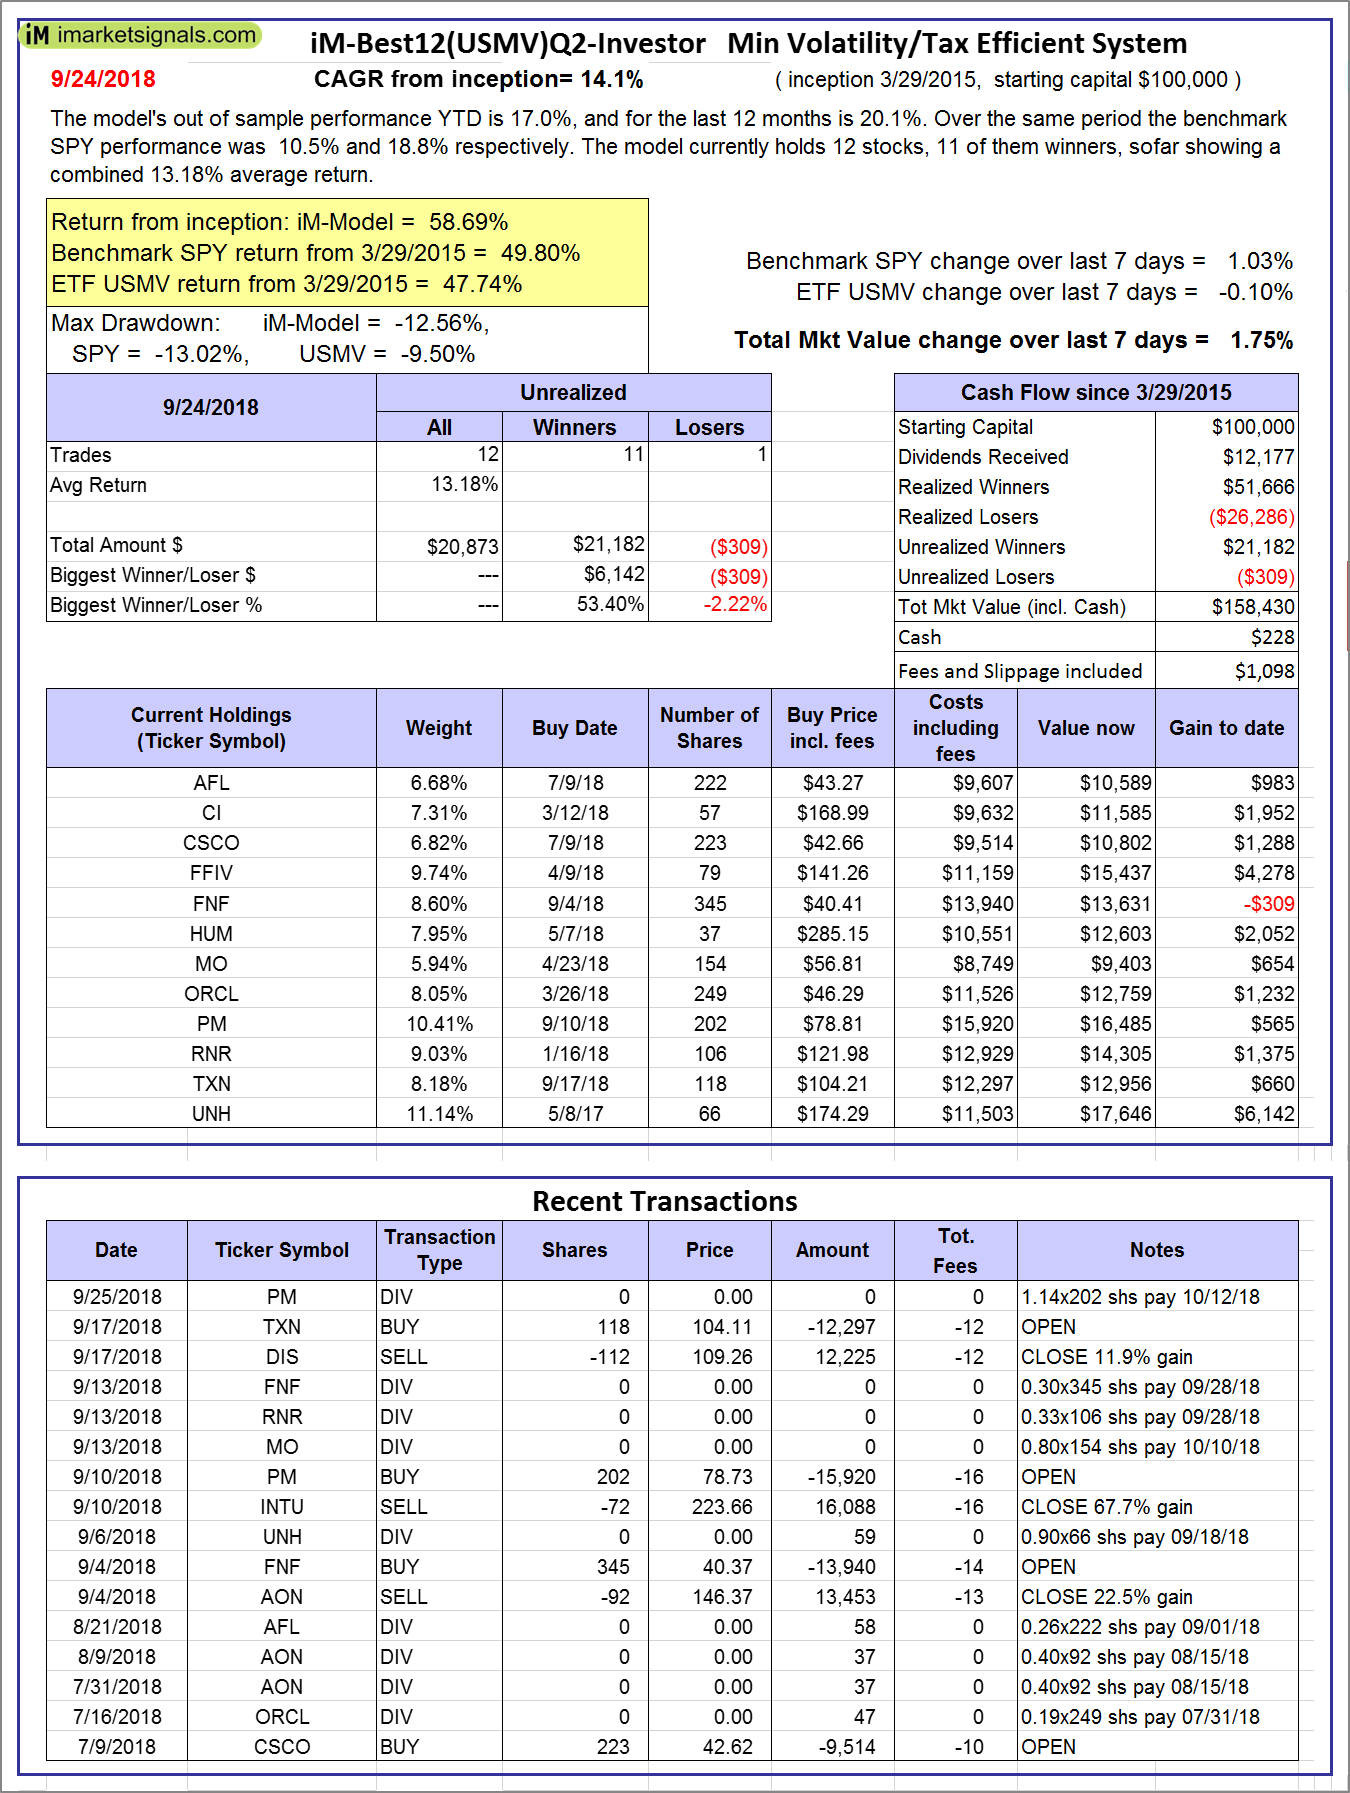  |
iM-Best12(USMV)Q2-Investor: The model’s out of sample performance YTD is 17.0%, and for the last 12 months is 20.1%. Over the same period the benchmark SPY performance was 10.5% and 18.8% respectively. Since inception, on 3/30/2015, the model gained 58.69% while the benchmark SPY gained 49.80% and the ETF USMV gained 47.74% over the same period. Over the previous week the market value of iM-Best12(USMV)Q2 gained 1.75% at a time when SPY gained 1.03%. A starting capital of $100,000 at inception on 3/30/2015 would have grown to $158,430 which includes $228 cash and excludes $1,098 spent on fees and slippage. |
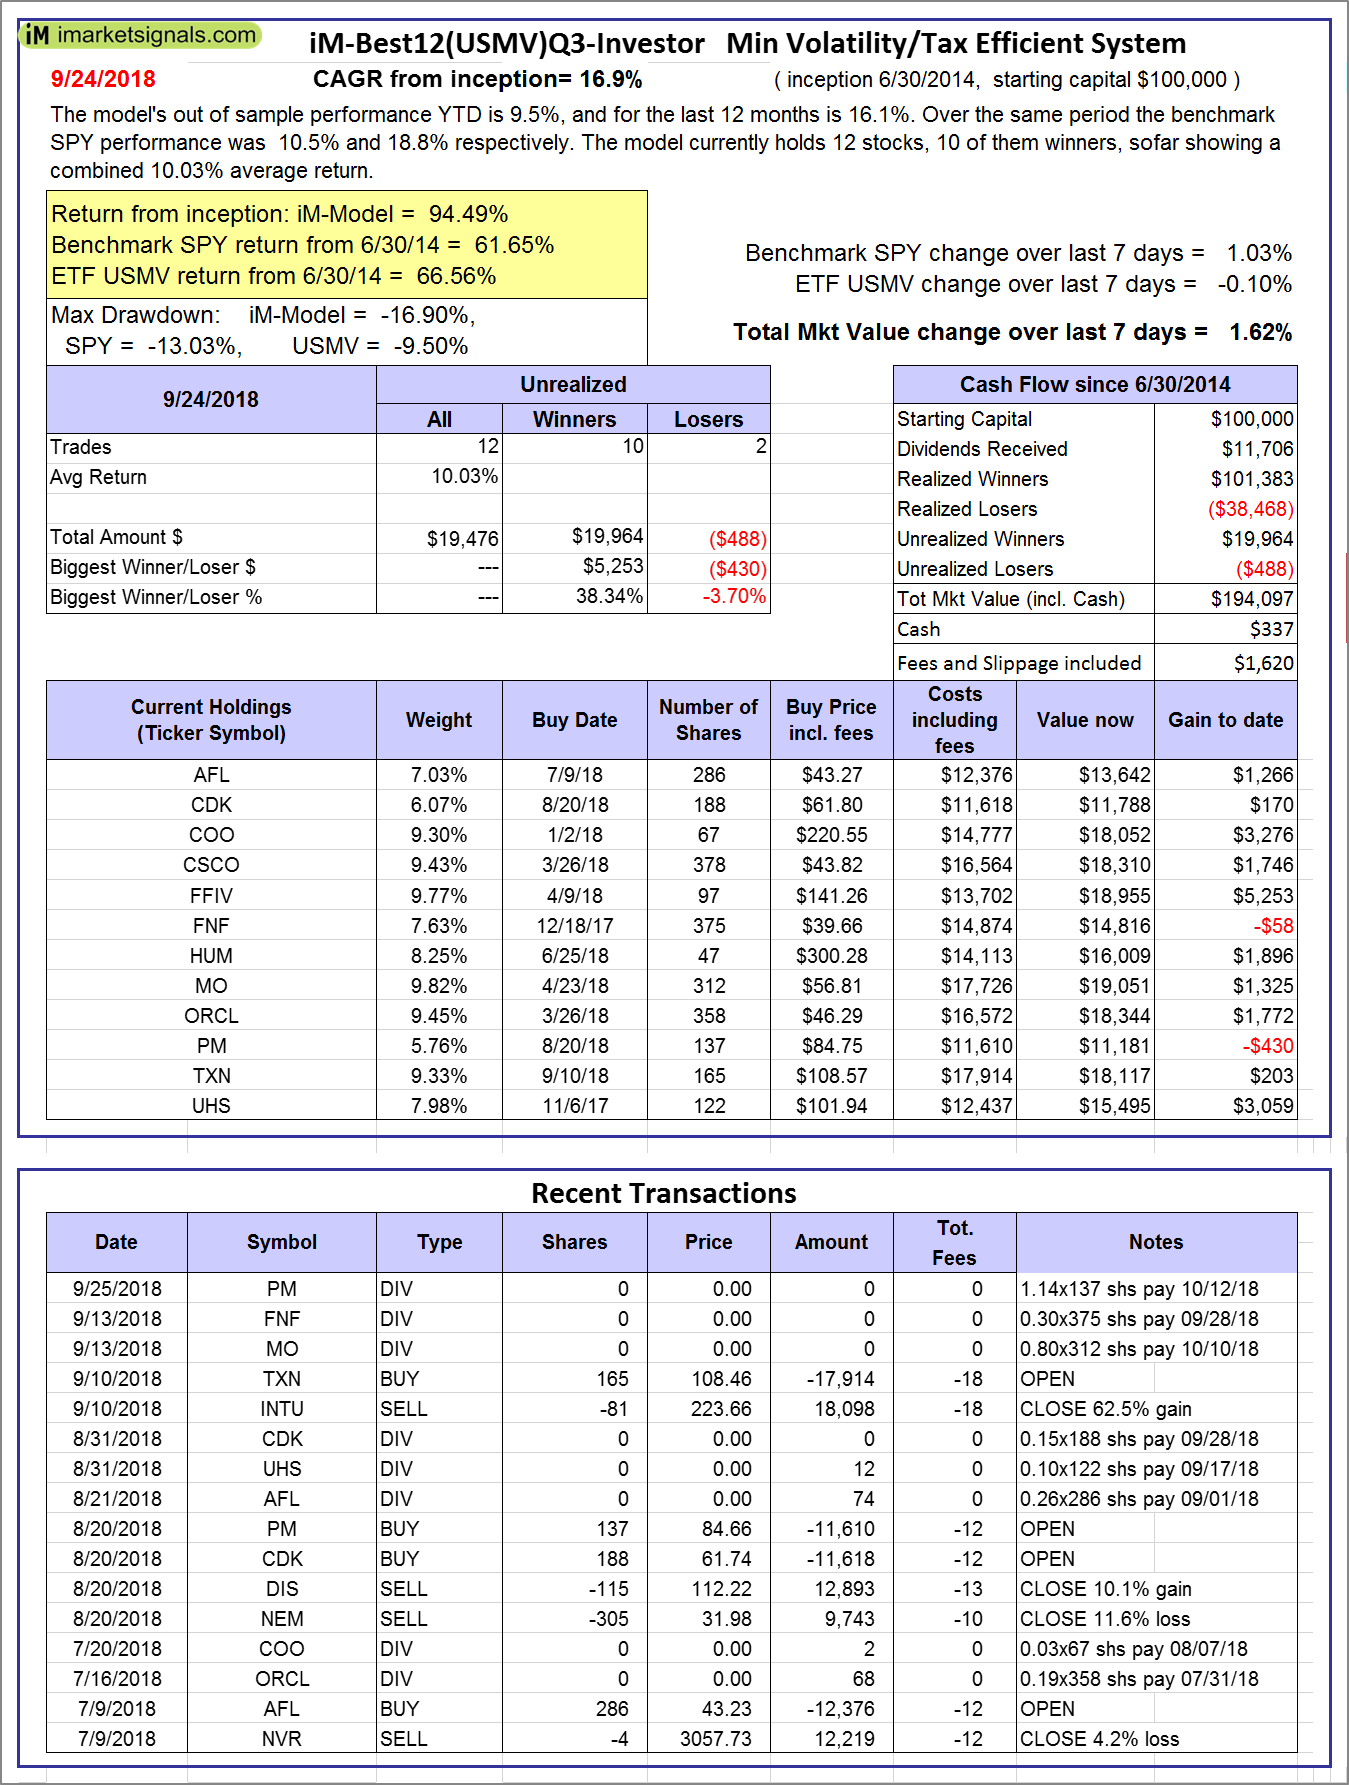 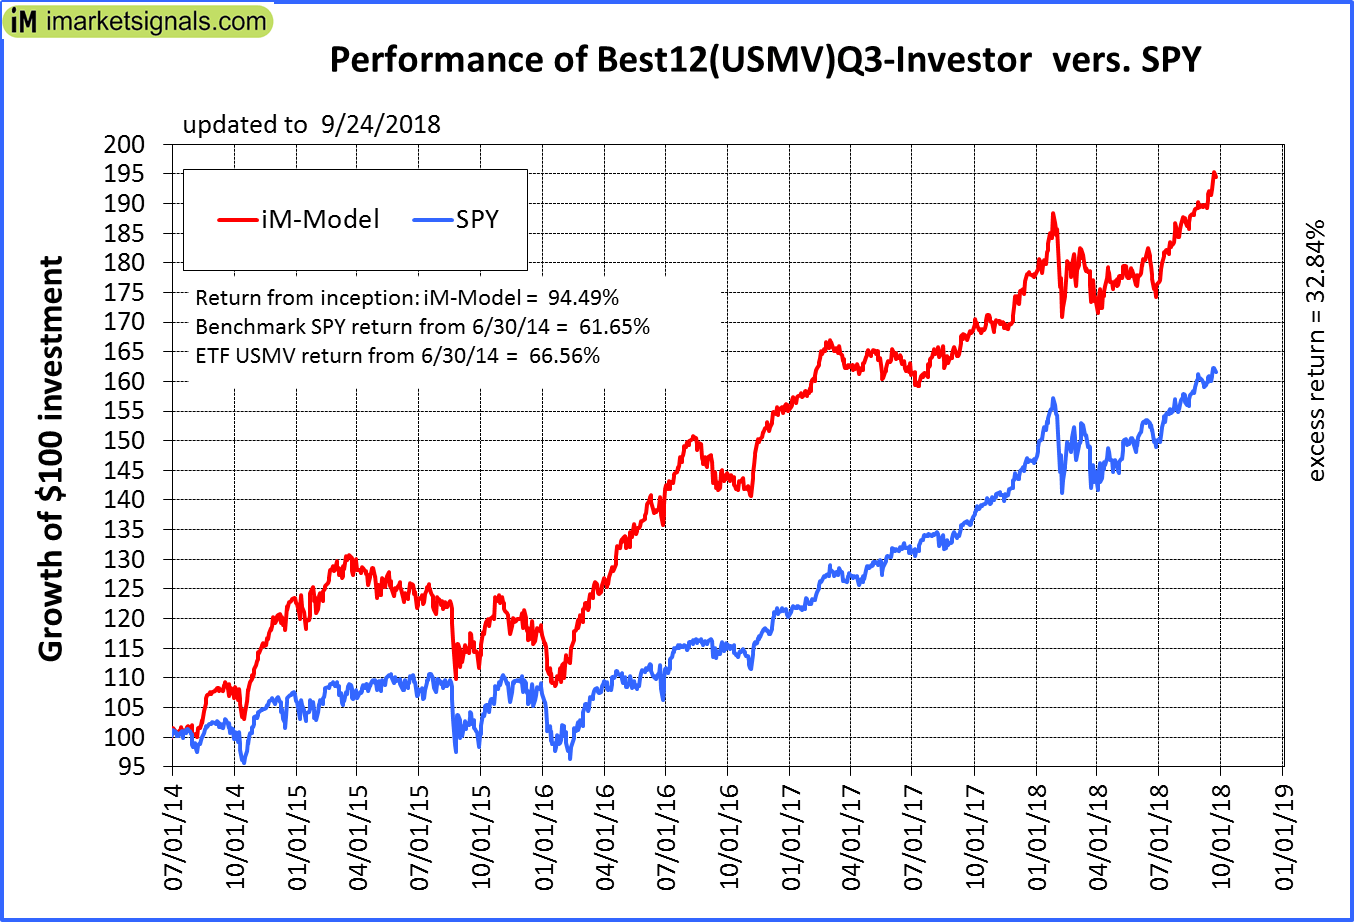 |
iM-Best12(USMV)Q3-Investor: The model’s out of sample performance YTD is 9.5%, and for the last 12 months is 16.1%. Over the same period the benchmark SPY performance was 10.5% and 18.8% respectively. Since inception, on 7/1/2014, the model gained 94.49% while the benchmark SPY gained 61.65% and the ETF USMV gained 66.56% over the same period. Over the previous week the market value of iM-Best12(USMV)Q3 gained 1.62% at a time when SPY gained 1.03%. A starting capital of $100,000 at inception on 7/1/2014 would have grown to $194,097 which includes $337 cash and excludes $1,620 spent on fees and slippage. |
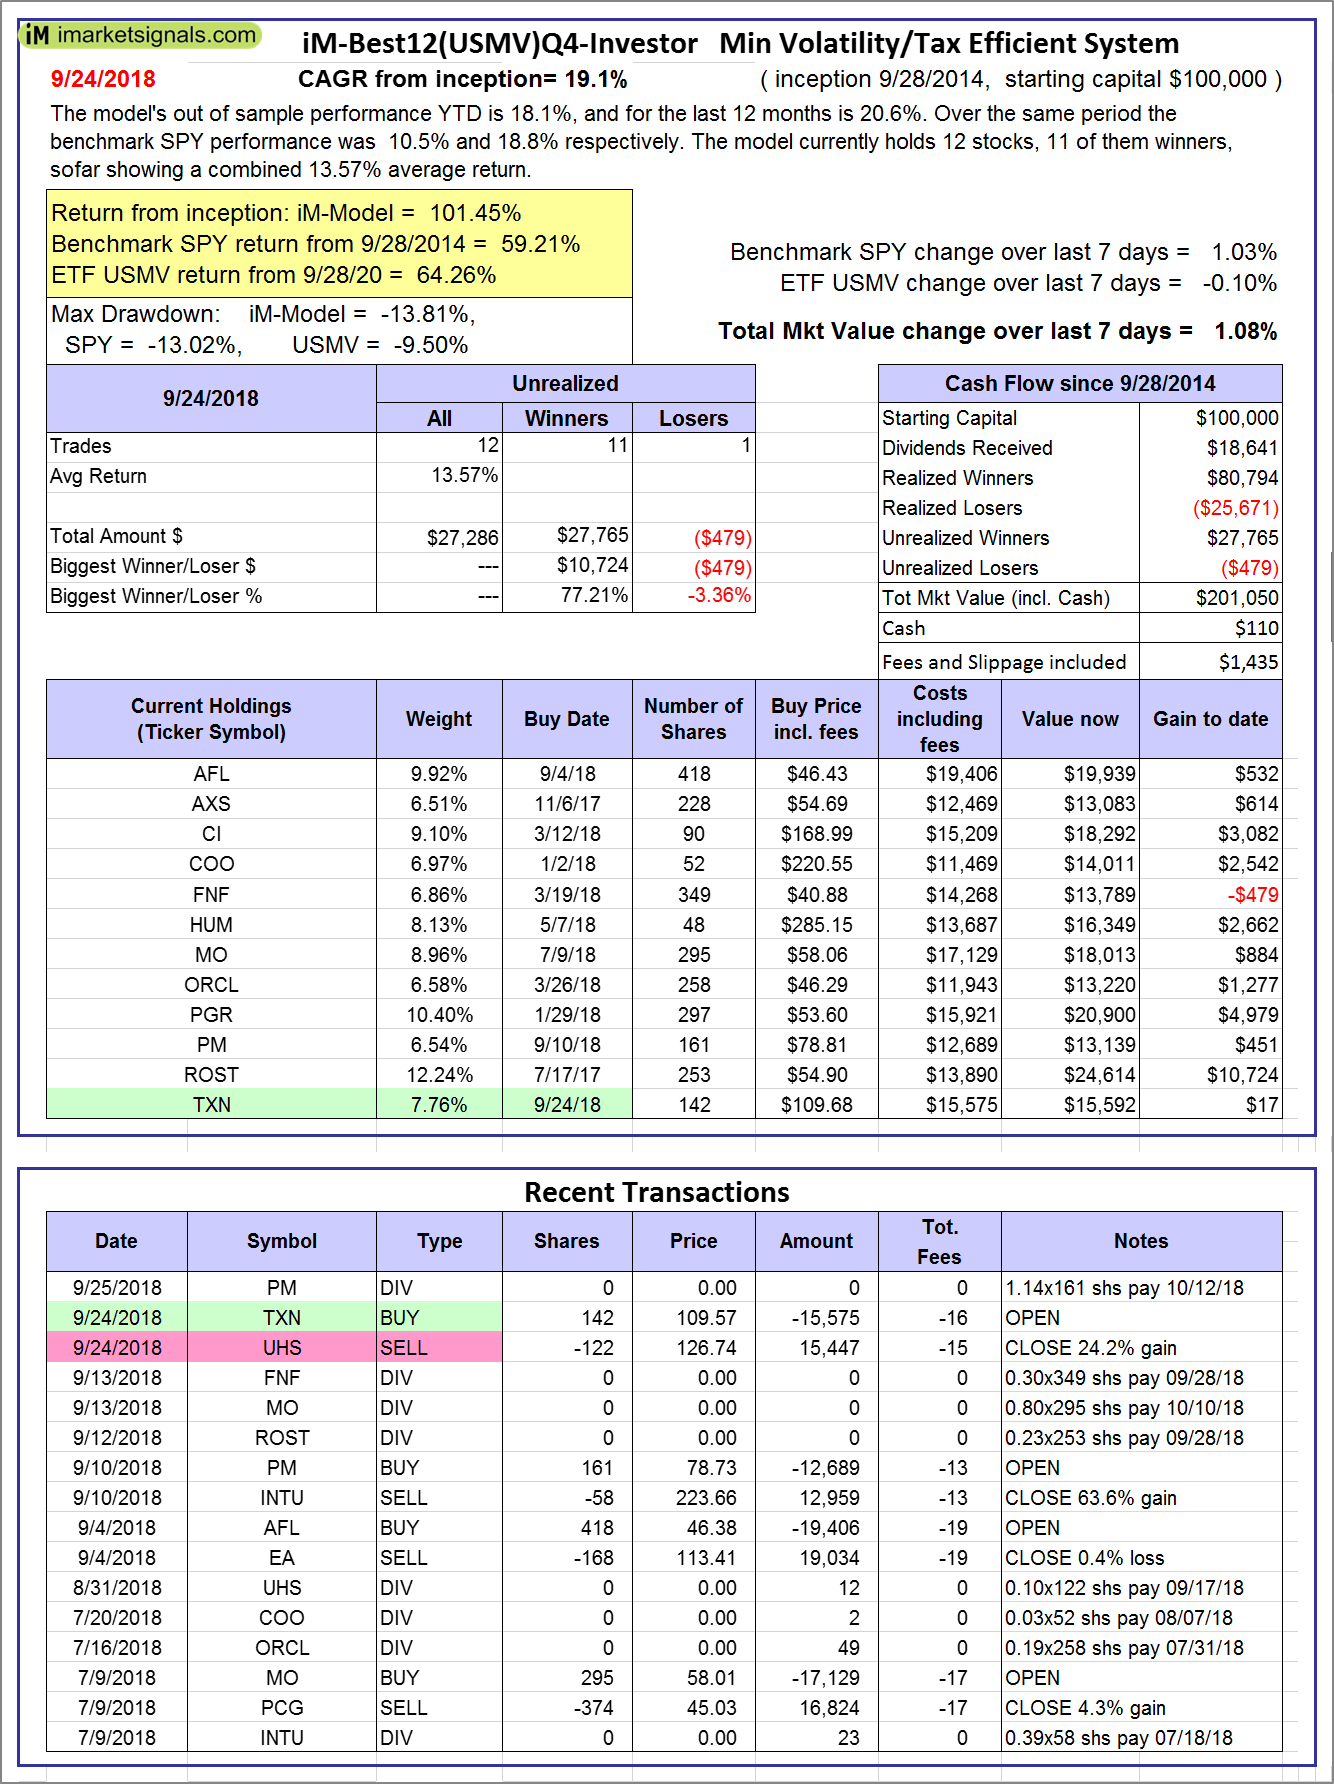 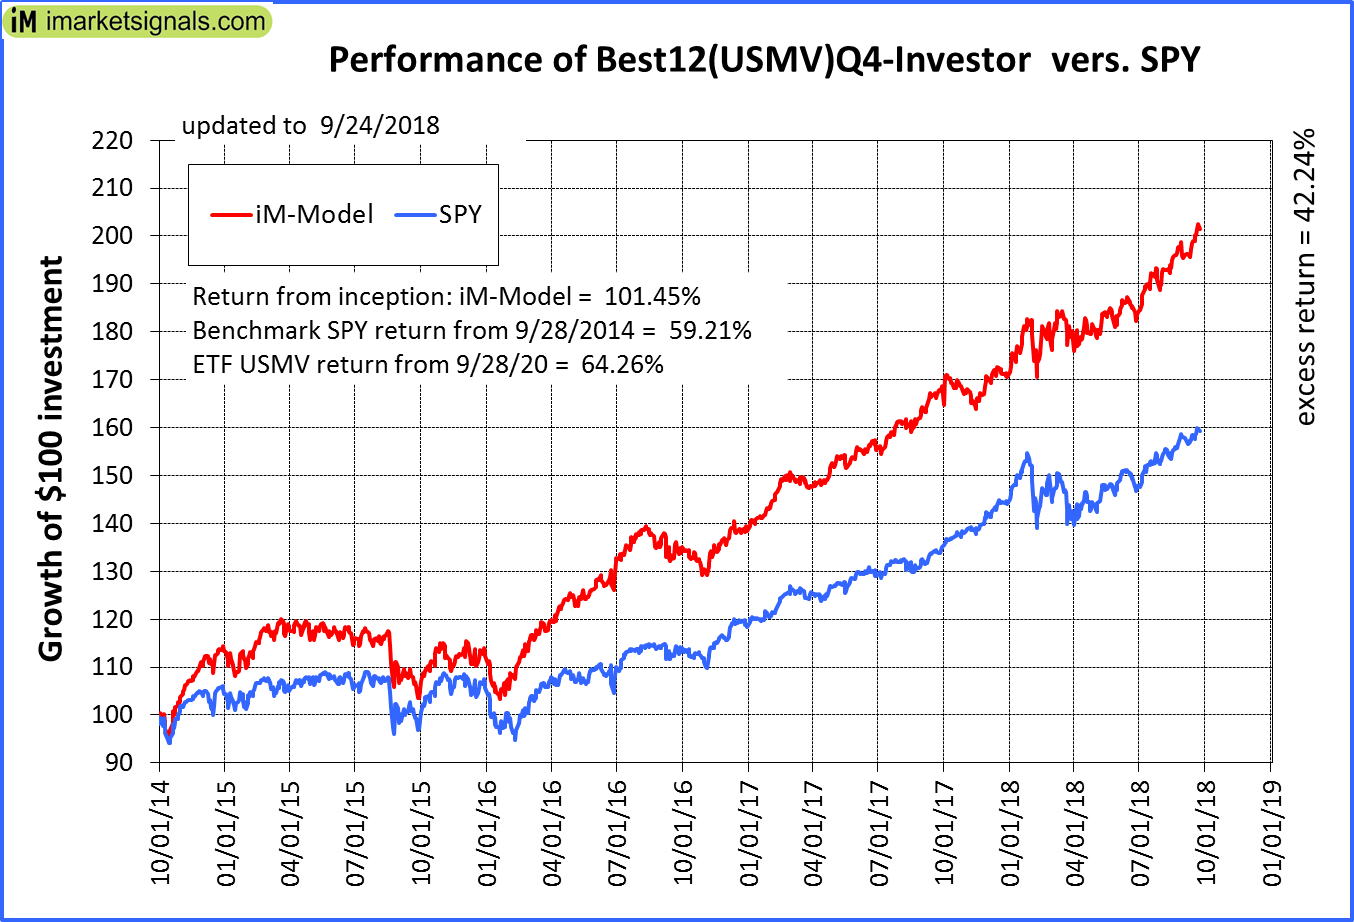 |
iM-Best12(USMV)Q4-Investor: Since inception, on 9/29/2014, the model gained 101.45% while the benchmark SPY gained 59.21% and the ETF USMV gained 64.26% over the same period. Over the previous week the market value of iM-Best12(USMV)Q4 gained 1.08% at a time when SPY gained 1.03%. A starting capital of $100,000 at inception on 9/29/2014 would have grown to $201,050 which includes $110 cash and excludes $1,435 spent on fees and slippage. |
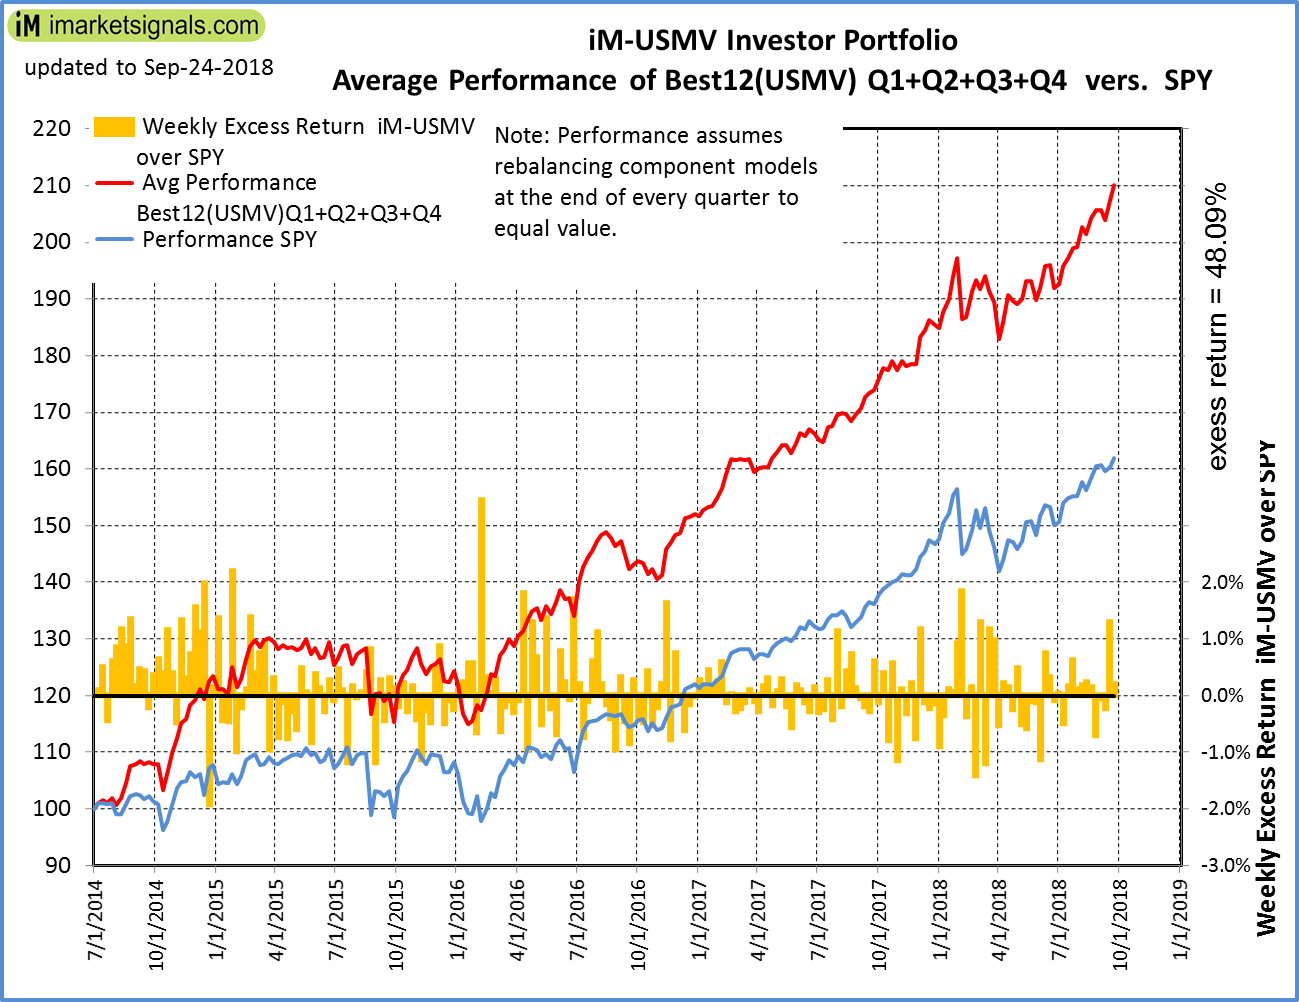 |
Average Performance of iM-Best12(USMV)Q1+Q2+Q3+Q4-Investor resulted in an excess return of 48.09% over SPY. (see iM-USMV Investor Portfolio) |
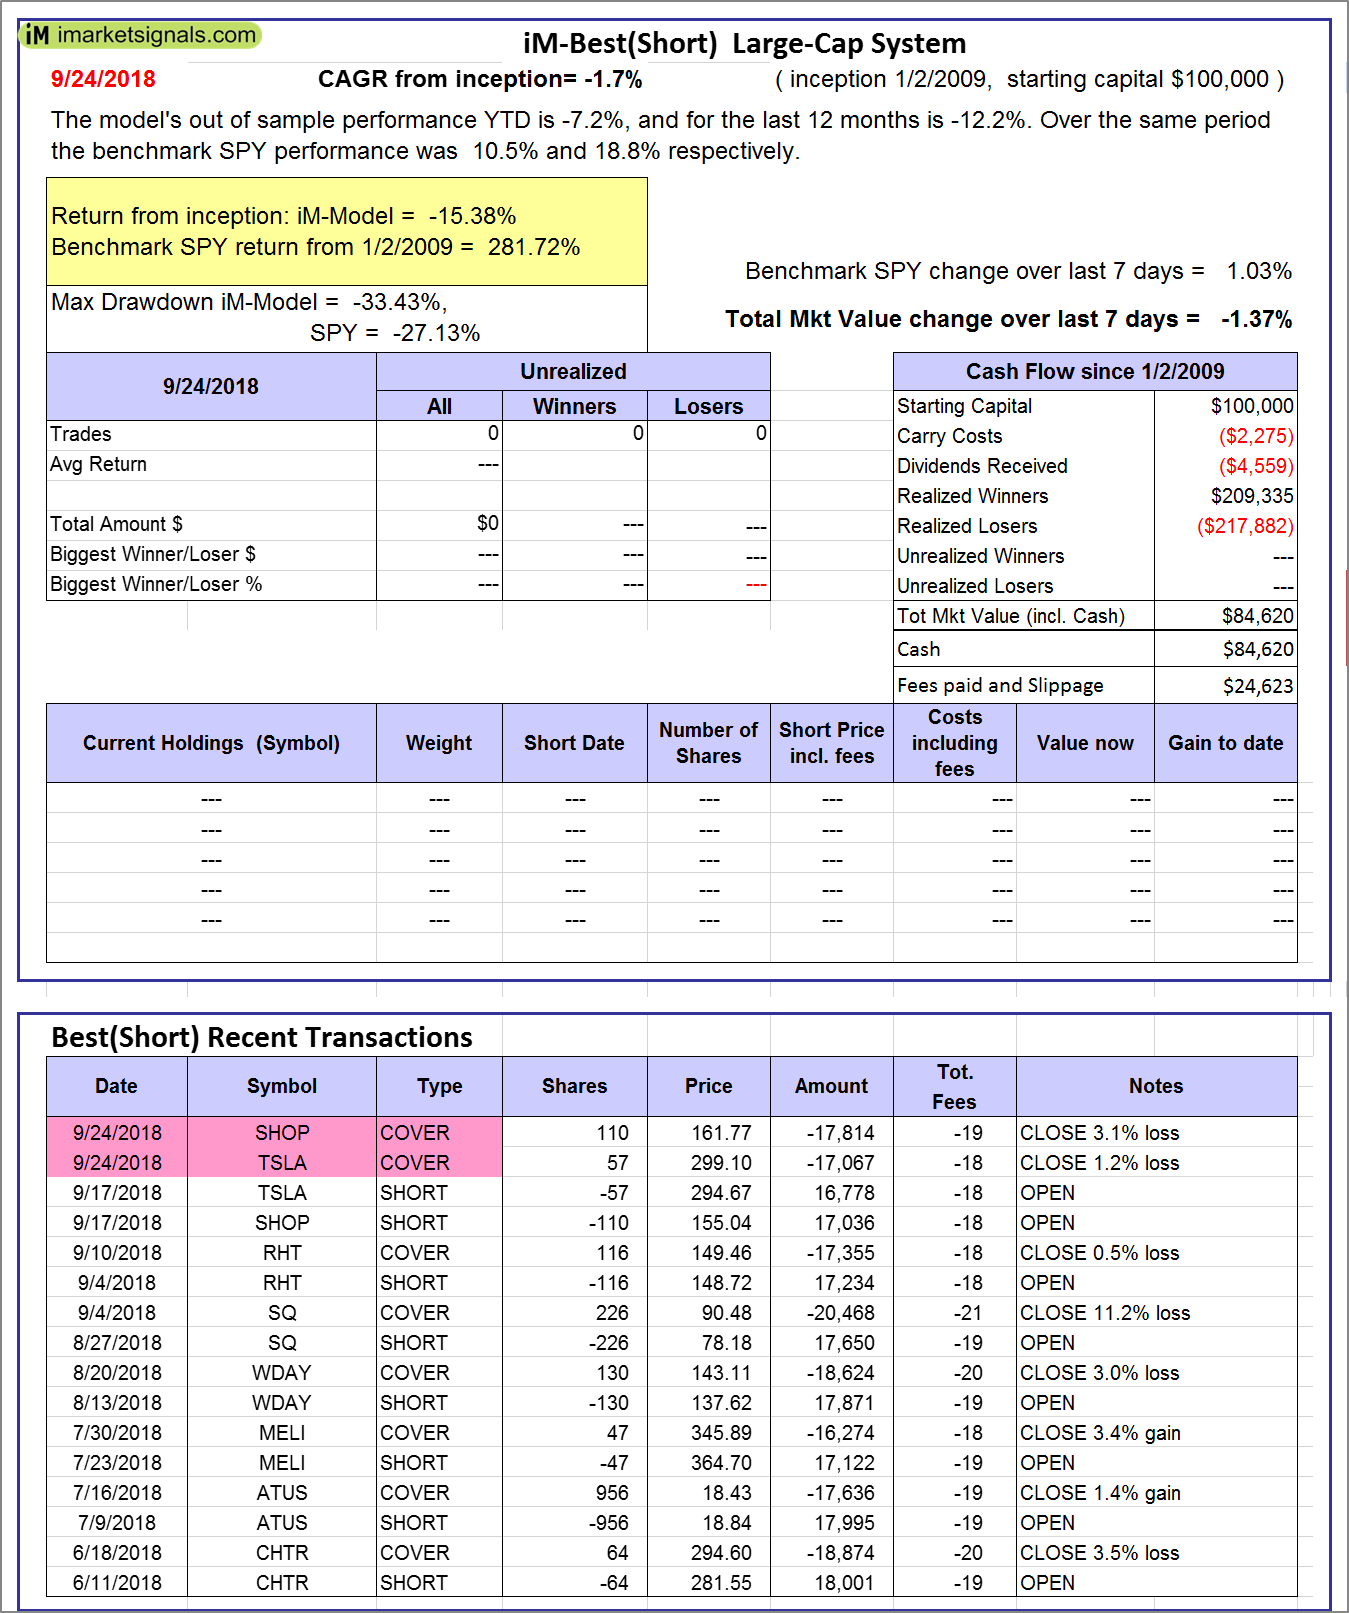 |
iM-Best(Short): The model’s out of sample performance YTD is -7.2%, and for the last 12 months is -12.2%. Over the same period the benchmark SPY performance was 10.5% and 18.8% respectively. Over the previous week the market value of iM-Best(Short) gained -1.37% at a time when SPY gained 1.03%. Over the period 1/2/2009 to 9/24/2018 the starting capital of $100,000 would have grown to $84,620 which includes $84,620 cash and excludes $24,623 spent on fees and slippage. |
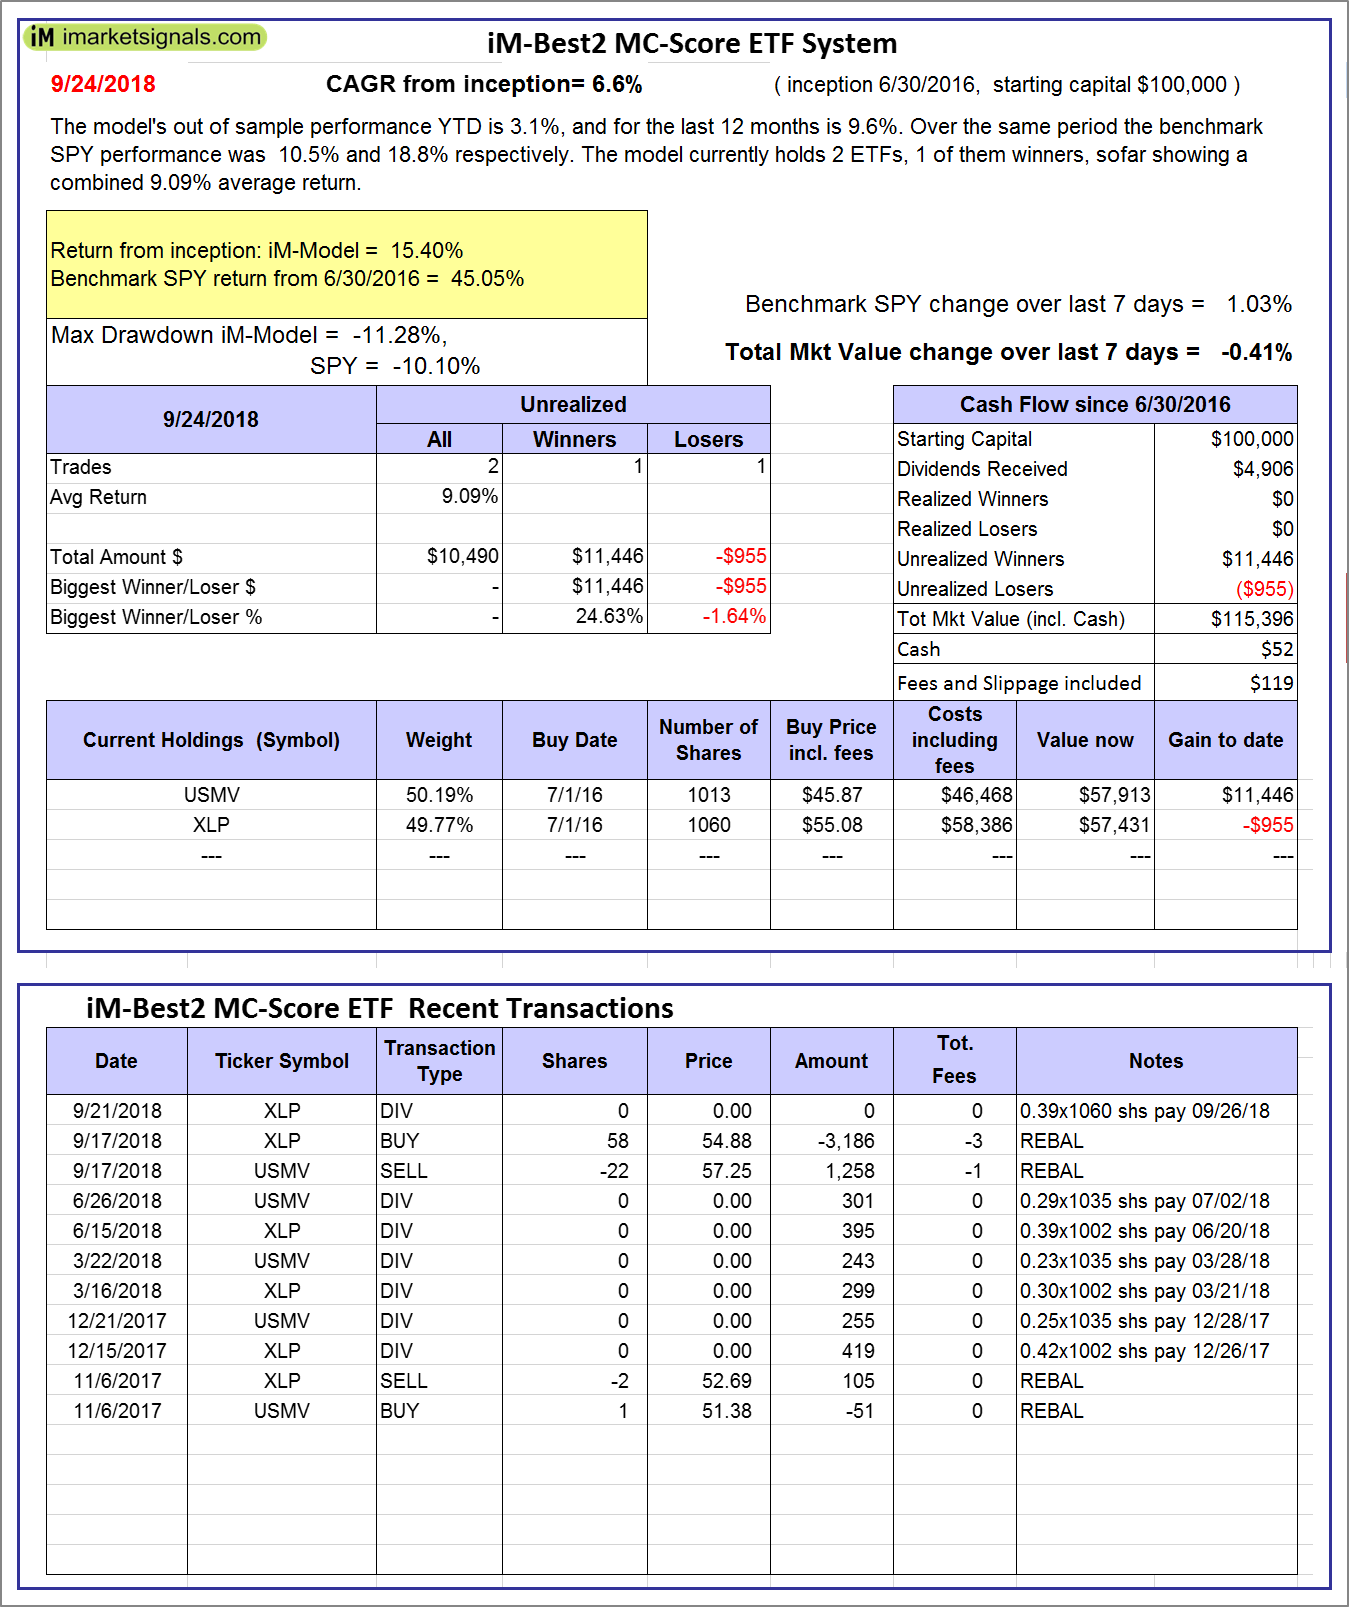 |
iM-Best2 MC-Score ETF System: The model’s out of sample performance YTD is 3.1%, and for the last 12 months is 9.6%. Over the same period the benchmark SPY performance was 10.5% and 18.8% respectively. Over the previous week the market value of the iM-Best2 MC-Score ETF System gained -0.41% at a time when SPY gained 1.03%. A starting capital of $100,000 at inception on 6/30/2016 would have grown to $115,396 which includes $52 cash and excludes $119 spent on fees and slippage. |
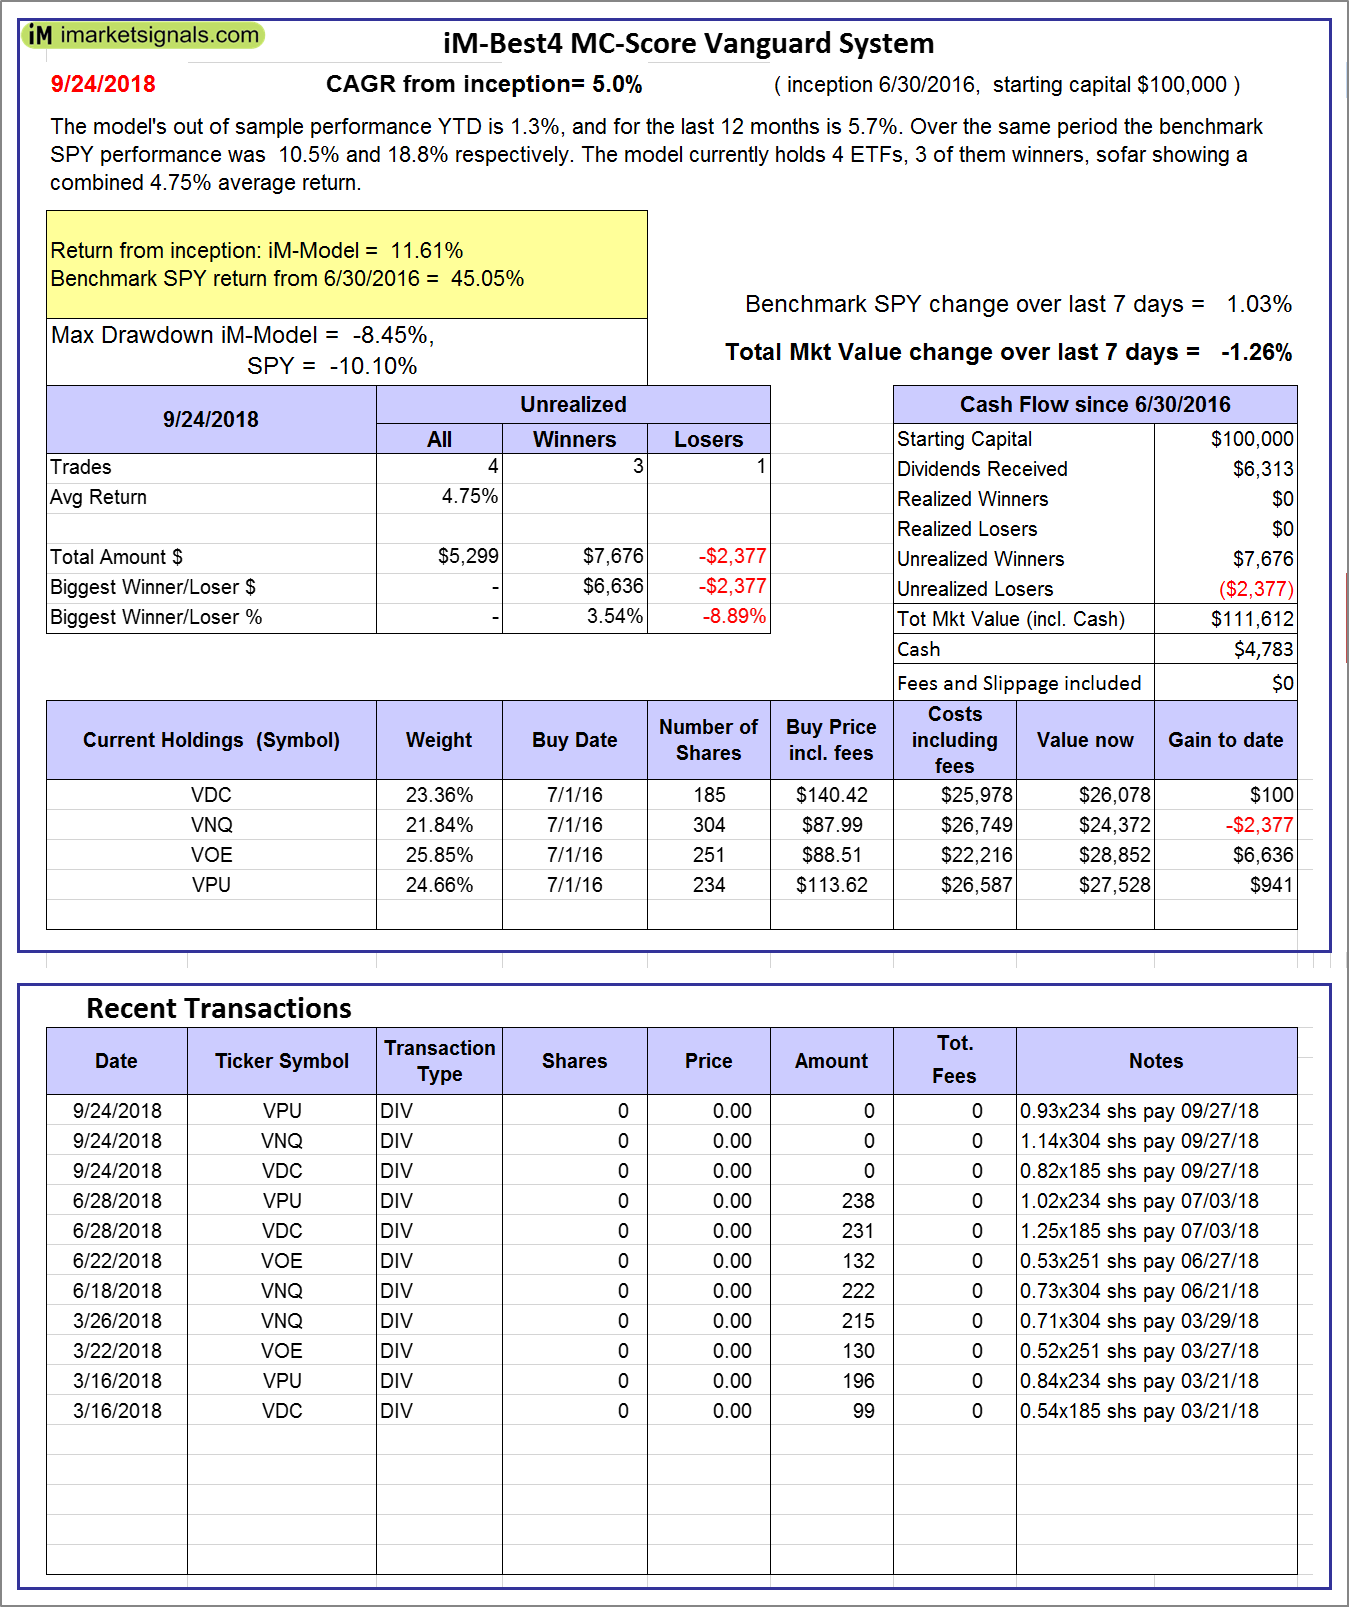 |
iM-Best4 MC-Score Vanguard System: The model’s out of sample performance YTD is 1.3%, and for the last 12 months is 5.7%. Over the same period the benchmark SPY performance was 10.5% and 18.8% respectively. Over the previous week the market value of the iM-Best4 MC-Score Vanguard System gained -1.26% at a time when SPY gained 1.03%. A starting capital of $100,000 at inception on 6/30/2016 would have grown to $111,612 which includes $4,783 cash and excludes $00 spent on fees and slippage. |
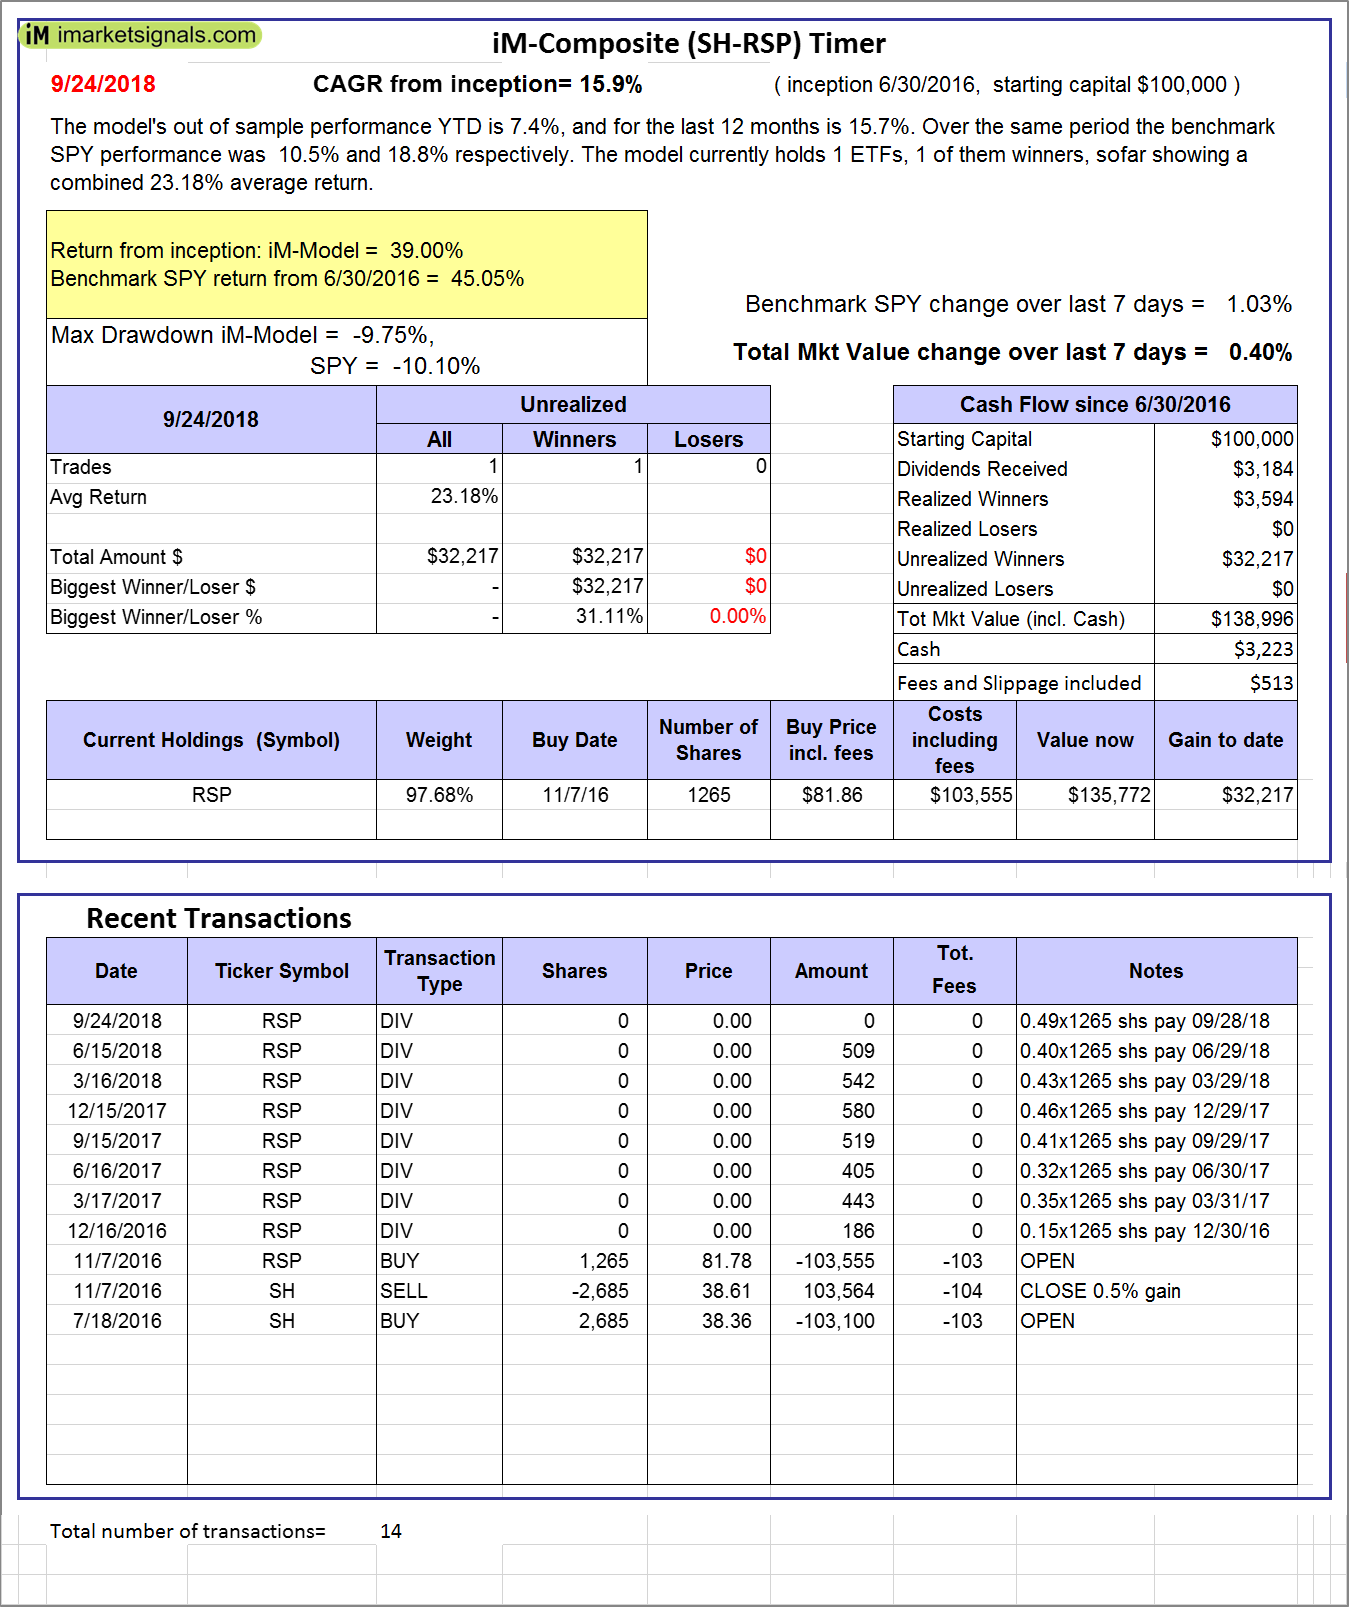 |
iM-Composite (SH-RSP) Timer: The model’s out of sample performance YTD is 7.4%, and for the last 12 months is 15.7%. Over the same period the benchmark SPY performance was 10.5% and 18.8% respectively. Over the previous week the market value of the iM-Composite (SH-RSP) Timer gained 0.40% at a time when SPY gained 1.03%. A starting capital of $100,000 at inception on 6/30/2016 would have grown to $138,996 which includes $3,223 cash and excludes $513 spent on fees and slippage. |
 |
iM-Composite (SPY-IEF) Timer: The model’s out of sample performance YTD is 10.3%, and for the last 12 months is 19.1%. Over the same period the benchmark SPY performance was 10.5% and 18.8% respectively. Over the previous week the market value of the iM-Composite (SPY-IEF) Timer gained 1.02% at a time when SPY gained 1.03%. A starting capital of $100,000 at inception on 6/30/2016 would have grown to $146,421 which includes $2,658 cash and excludes $1,390 spent on fees and slippage. |
 |
iM-VIX Timer with ZIV: The model’s out of sample performance YTD is 35.6%, and for the last 12 months is 66.8%. Over the same period the benchmark SPY performance was 10.5% and 18.8% respectively. Over the previous week the market value of the iM-VIX Timer with ZIV gained 3.03% at a time when SPY gained 1.03%. A starting capital of $100,000 at inception on 6/30/2016 would have grown to $238,591 which includes $77 cash and excludes $2,429 spent on fees and slippage. |
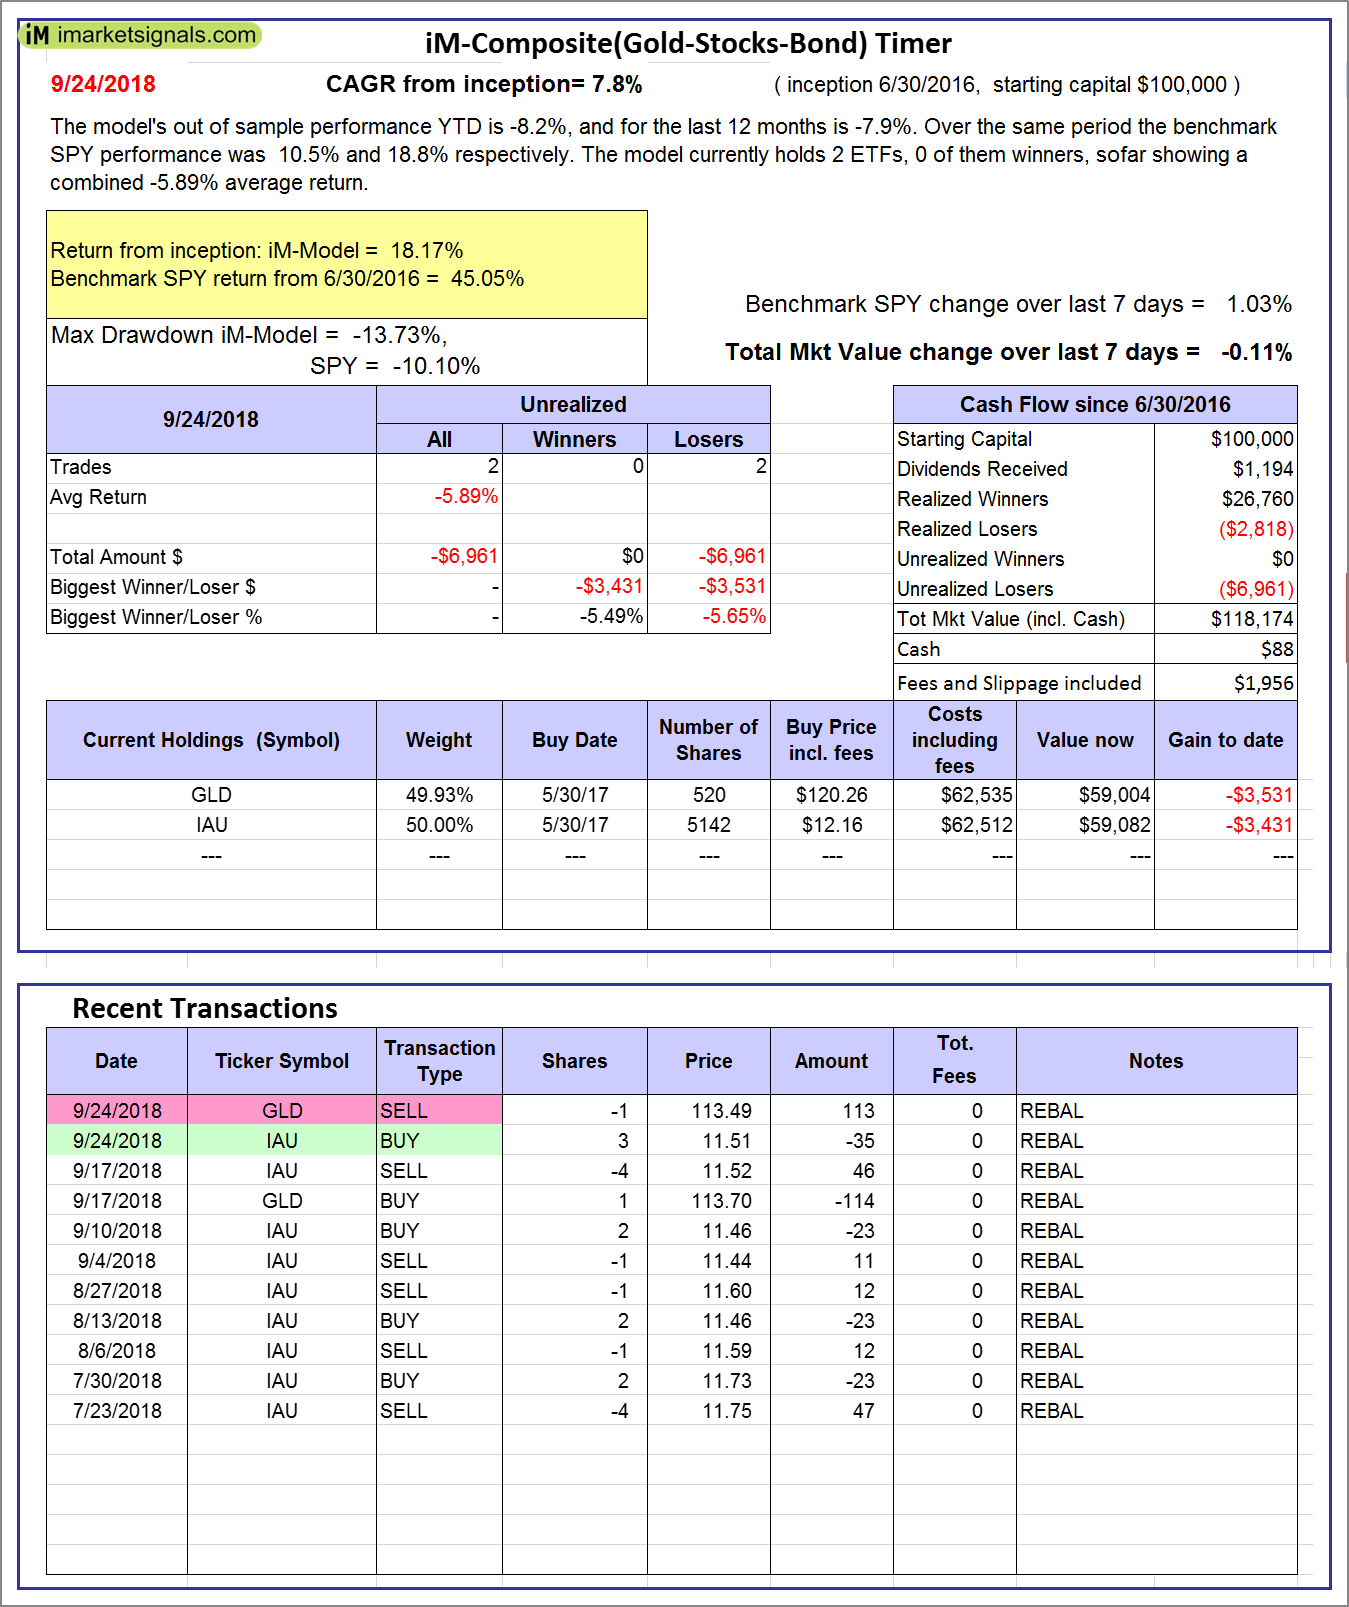 |
iM-Composite(Gold-Stocks-Bond) Timer: The model’s out of sample performance YTD is -8.2%, and for the last 12 months is -7.9%. Over the same period the benchmark SPY performance was 10.5% and 18.8% respectively. Over the previous week the market value of the iM-Composite(Gold-Stocks-Bond) Timer gained -0.11% at a time when SPY gained 1.03%. A starting capital of $100,000 at inception on 6/30/2016 would have grown to $118,174 which includes $88 cash and excludes $1,956 spent on fees and slippage. |
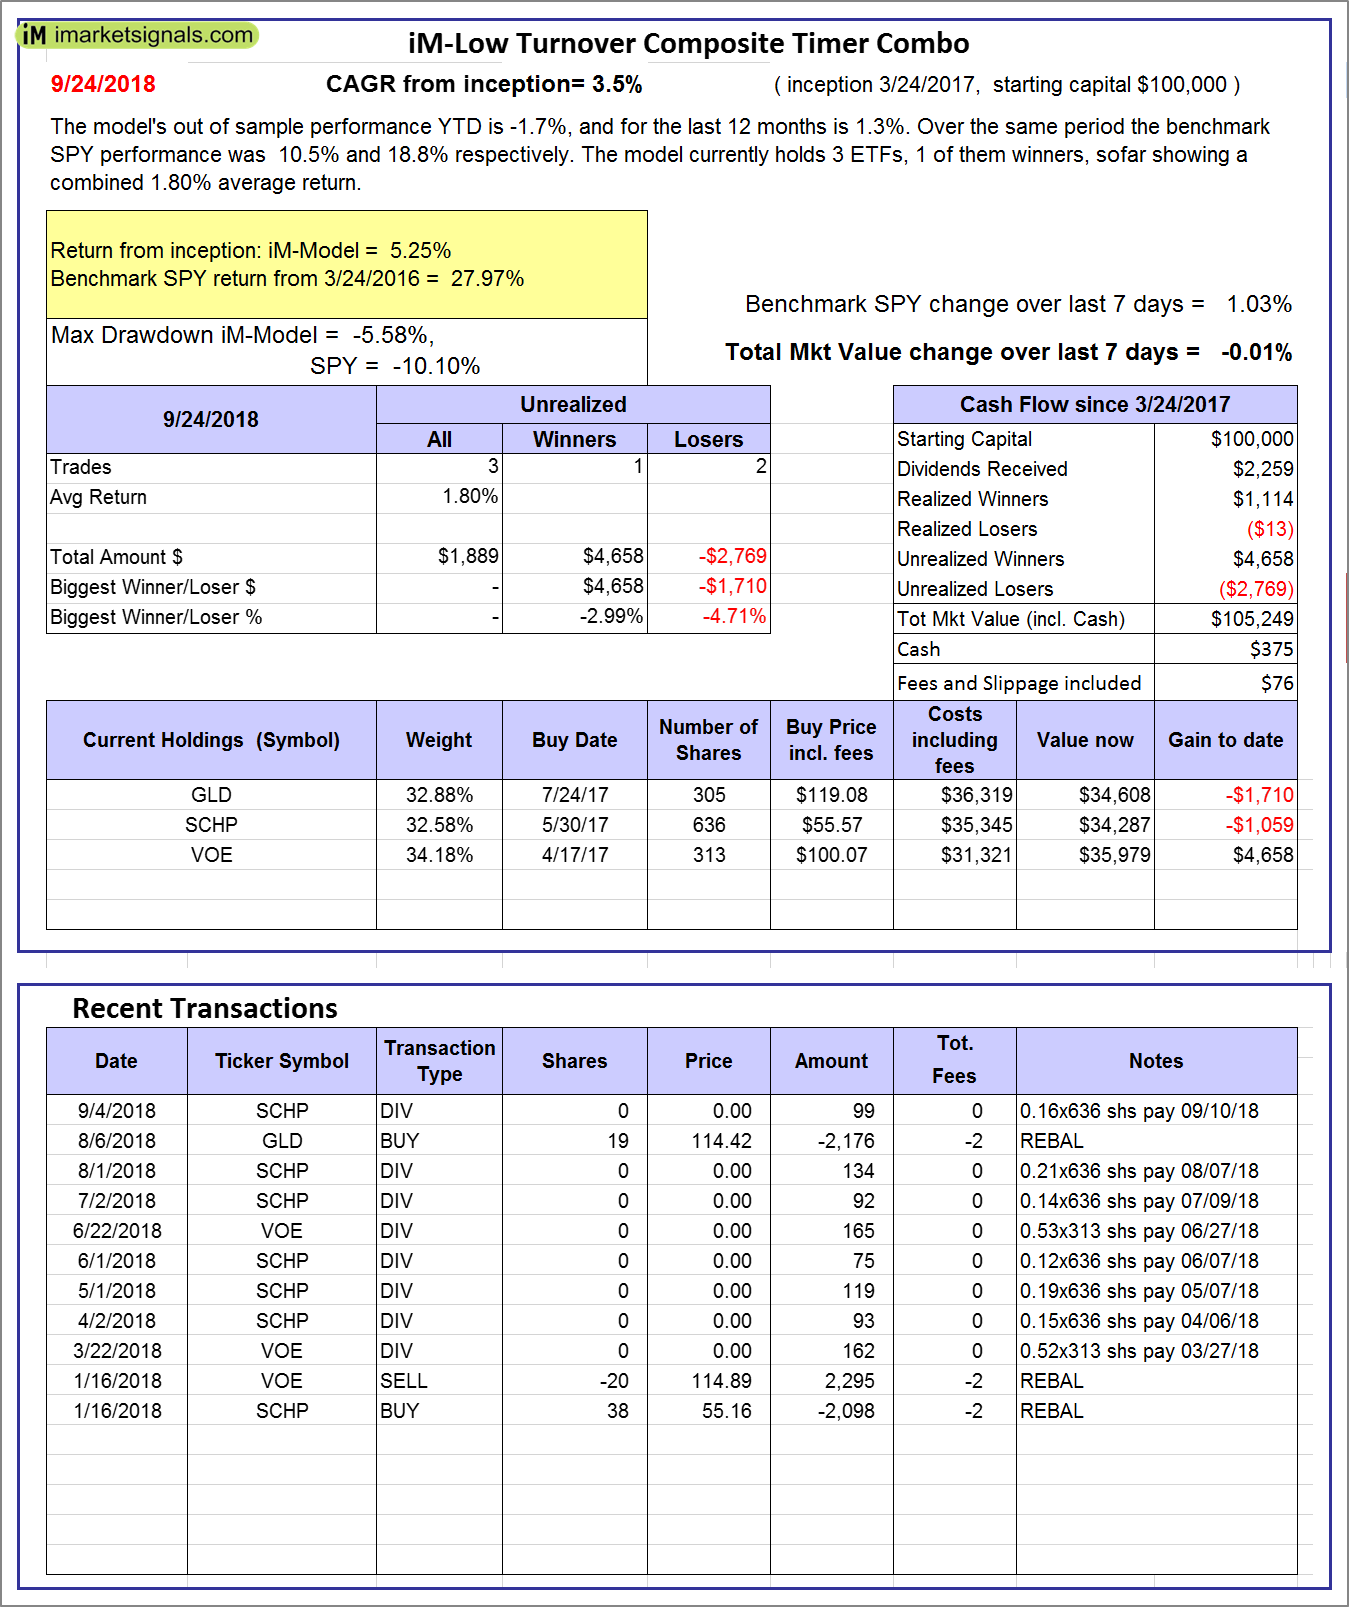 |
iM-Low Turnover Composite Timer Combo: The model’s out of sample performance YTD is -1.7%, and for the last 12 months is 1.3%. Over the same period the benchmark SPY performance was 10.5% and 18.8% respectively. Over the previous week the market value of the iM-Low Turnover Composite Timer Combo gained -0.01% at a time when SPY gained 1.03%. A starting capital of $100,000 at inception on 3/24/27 would have grown to $105,249 which includes $375 cash and excludes $76 spent on fees and slippage. |
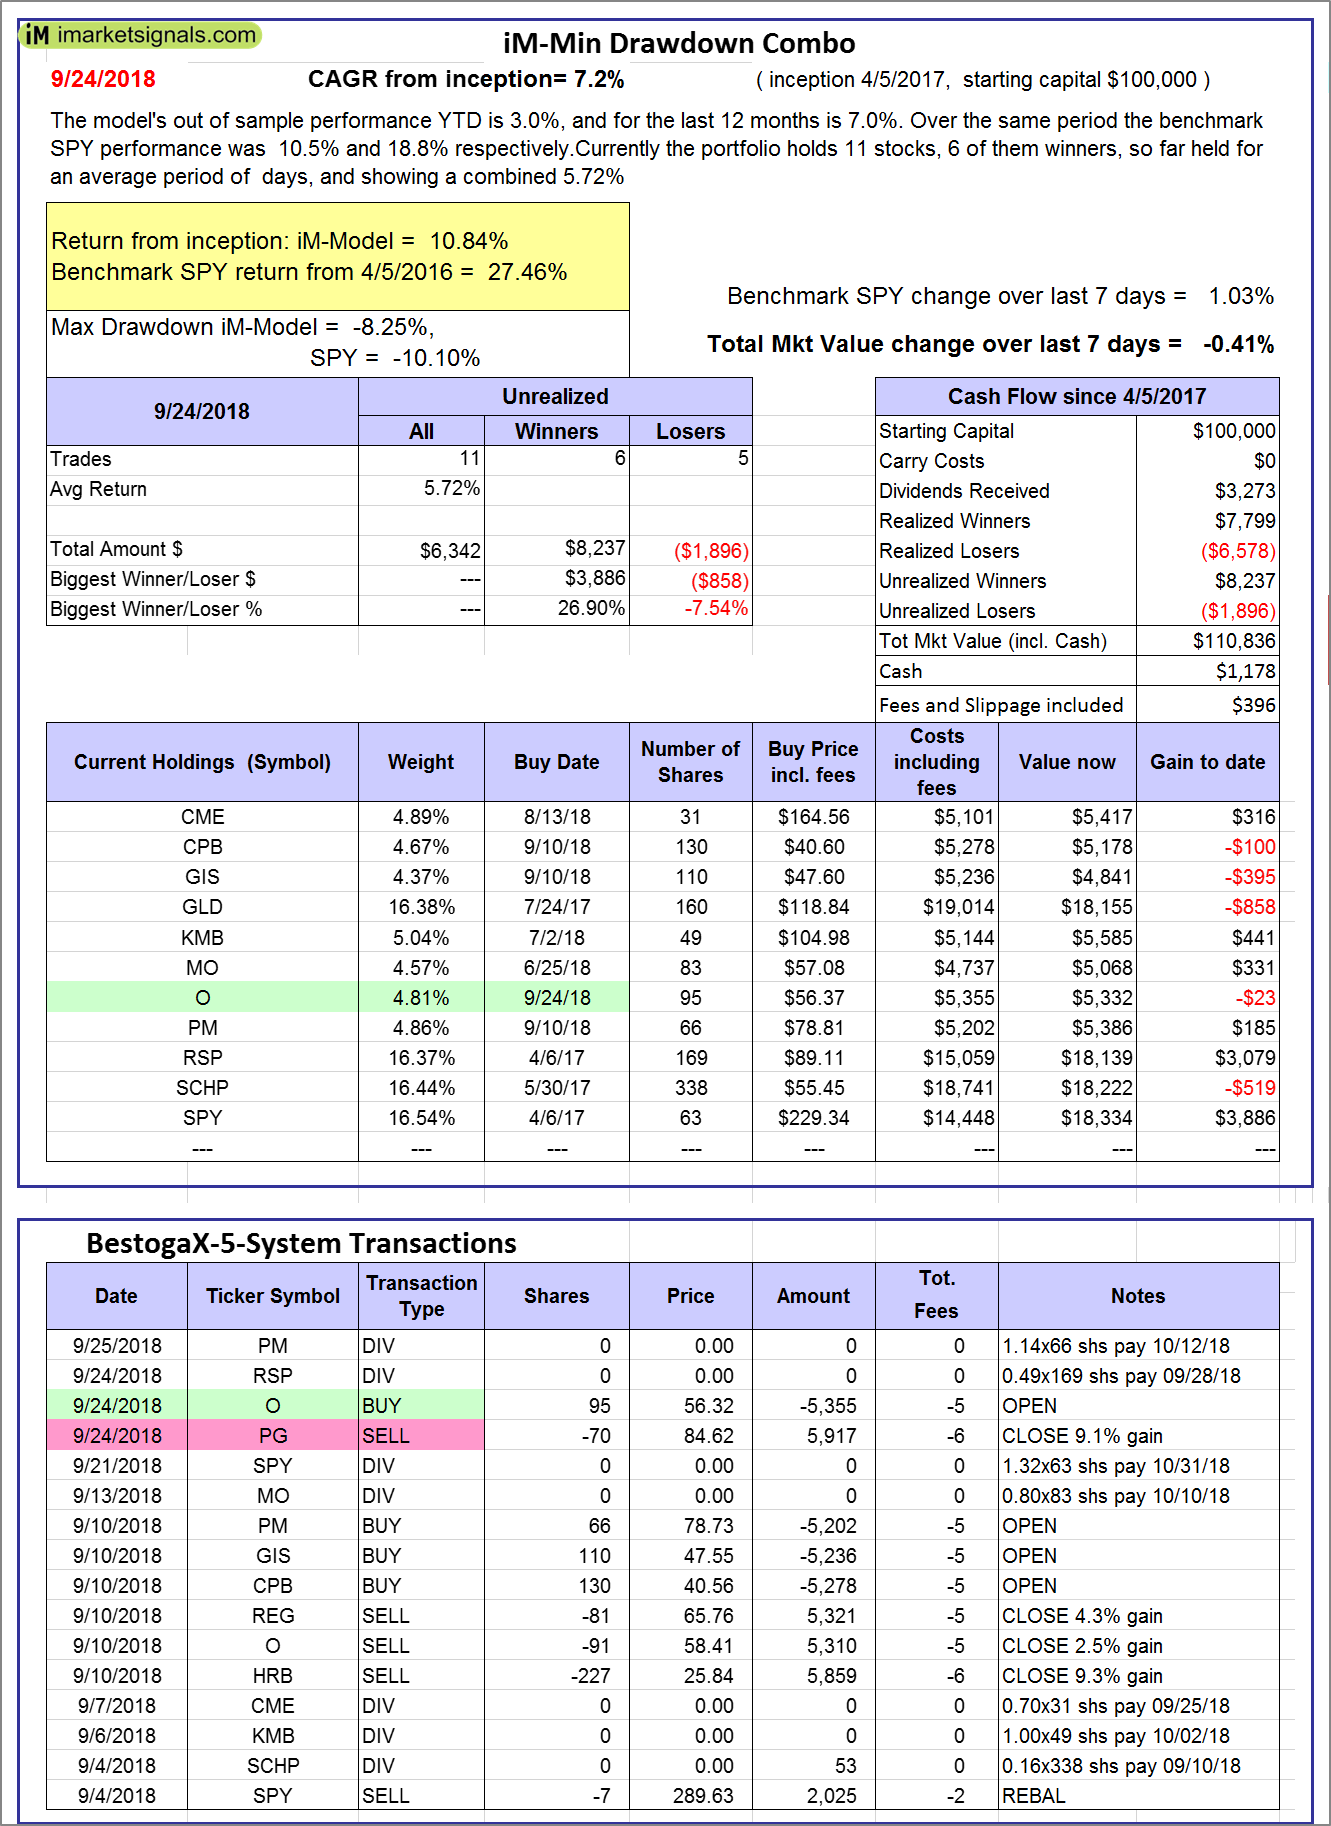 |
iM-Min Drawdown Combo: The model’s out of sample performance YTD is 3.0%, and for the last 12 months is 7.0%. Over the same period the benchmark SPY performance was 10.5% and 18.8% respectively. Over the previous week the market value of the iM-Min Drawdown Combo gained -0.41% at a time when SPY gained 1.03%. A starting capital of $100,000 at inception on 4/5/2017 would have grown to $110,836 which includes $1,178 cash and excludes $396 spent on fees and slippage. |
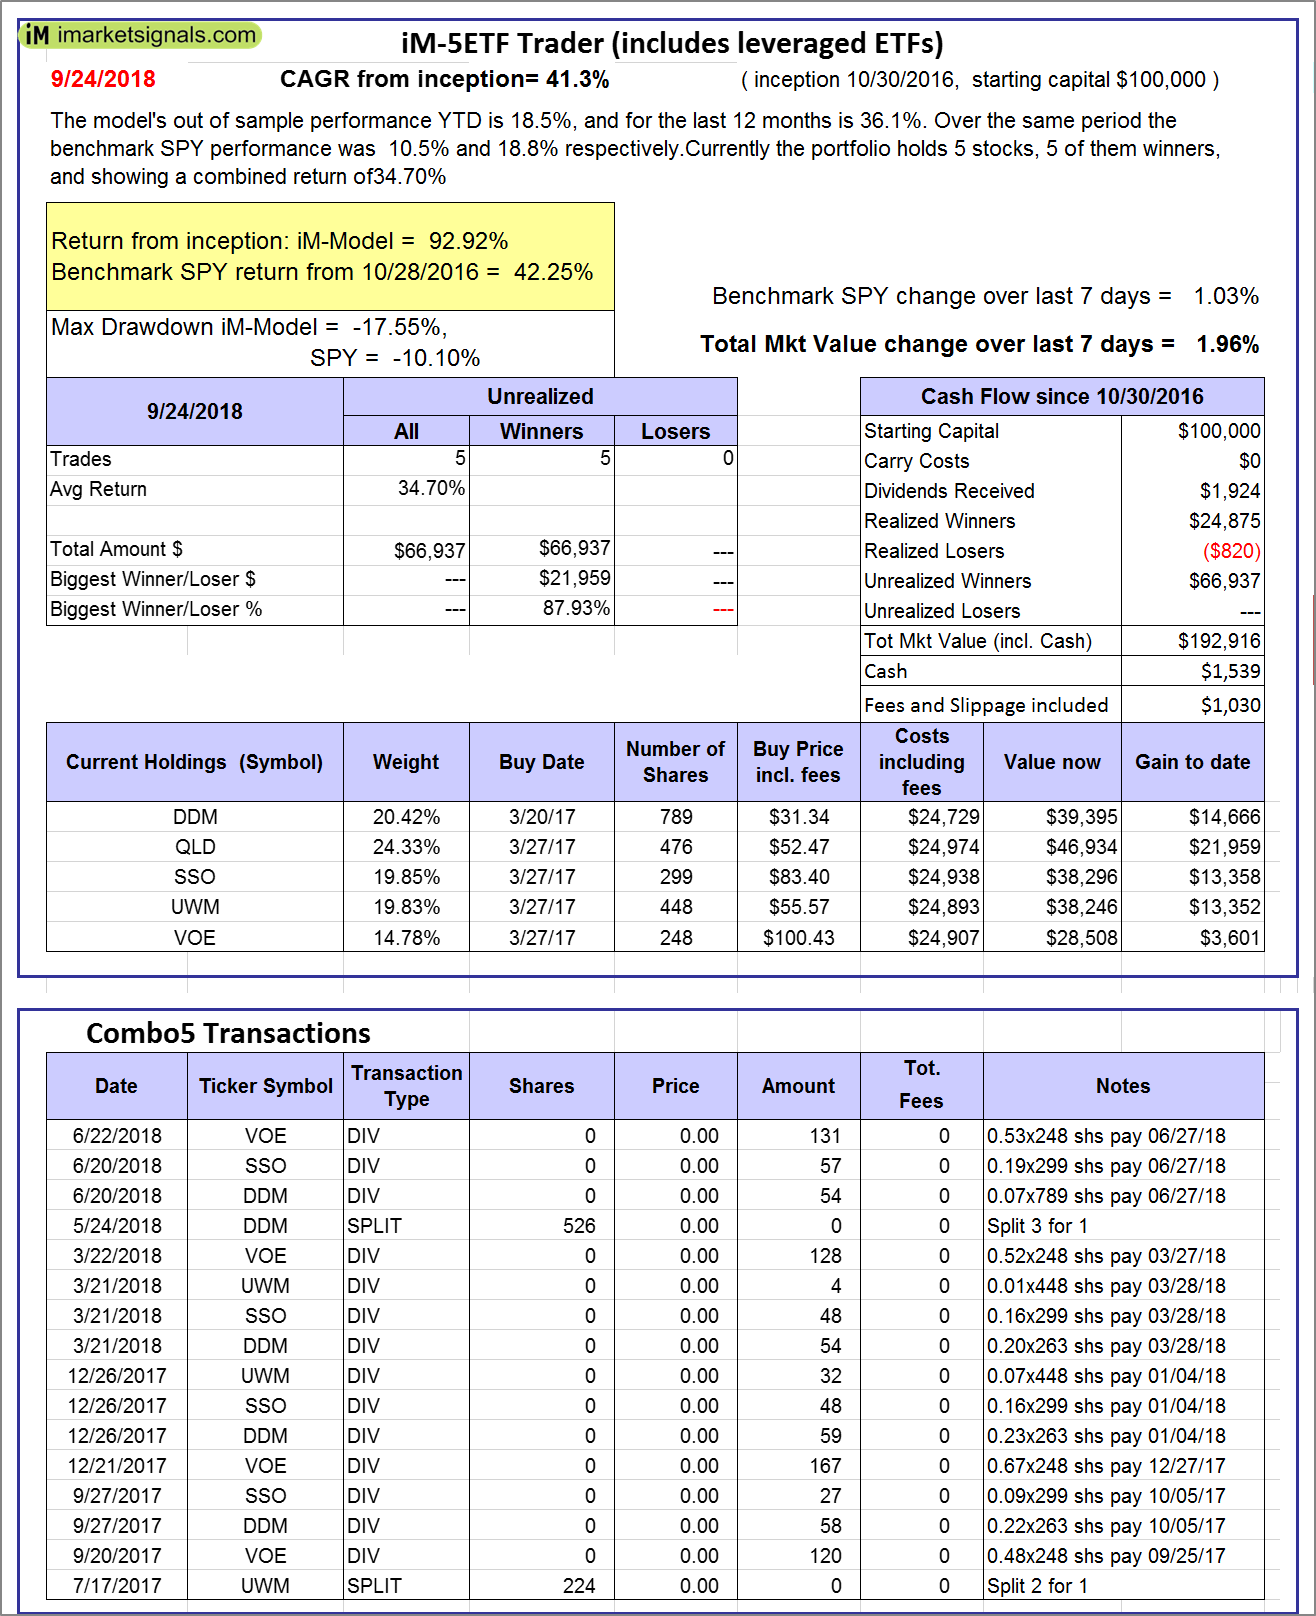 |
iM-5ETF Trader (includes leveraged ETFs): The model’s out of sample performance YTD is 18.5%, and for the last 12 months is 36.1%. Over the same period the benchmark SPY performance was 10.5% and 18.8% respectively. Over the previous week the market value of the iM-5ETF Trader (includes leveraged ETFs) gained 1.96% at a time when SPY gained 1.03%. A starting capital of $100,000 at inception on 10/30/2016 would have grown to $192,916 which includes $1,539 cash and excludes $1,030 spent on fees and slippage. |
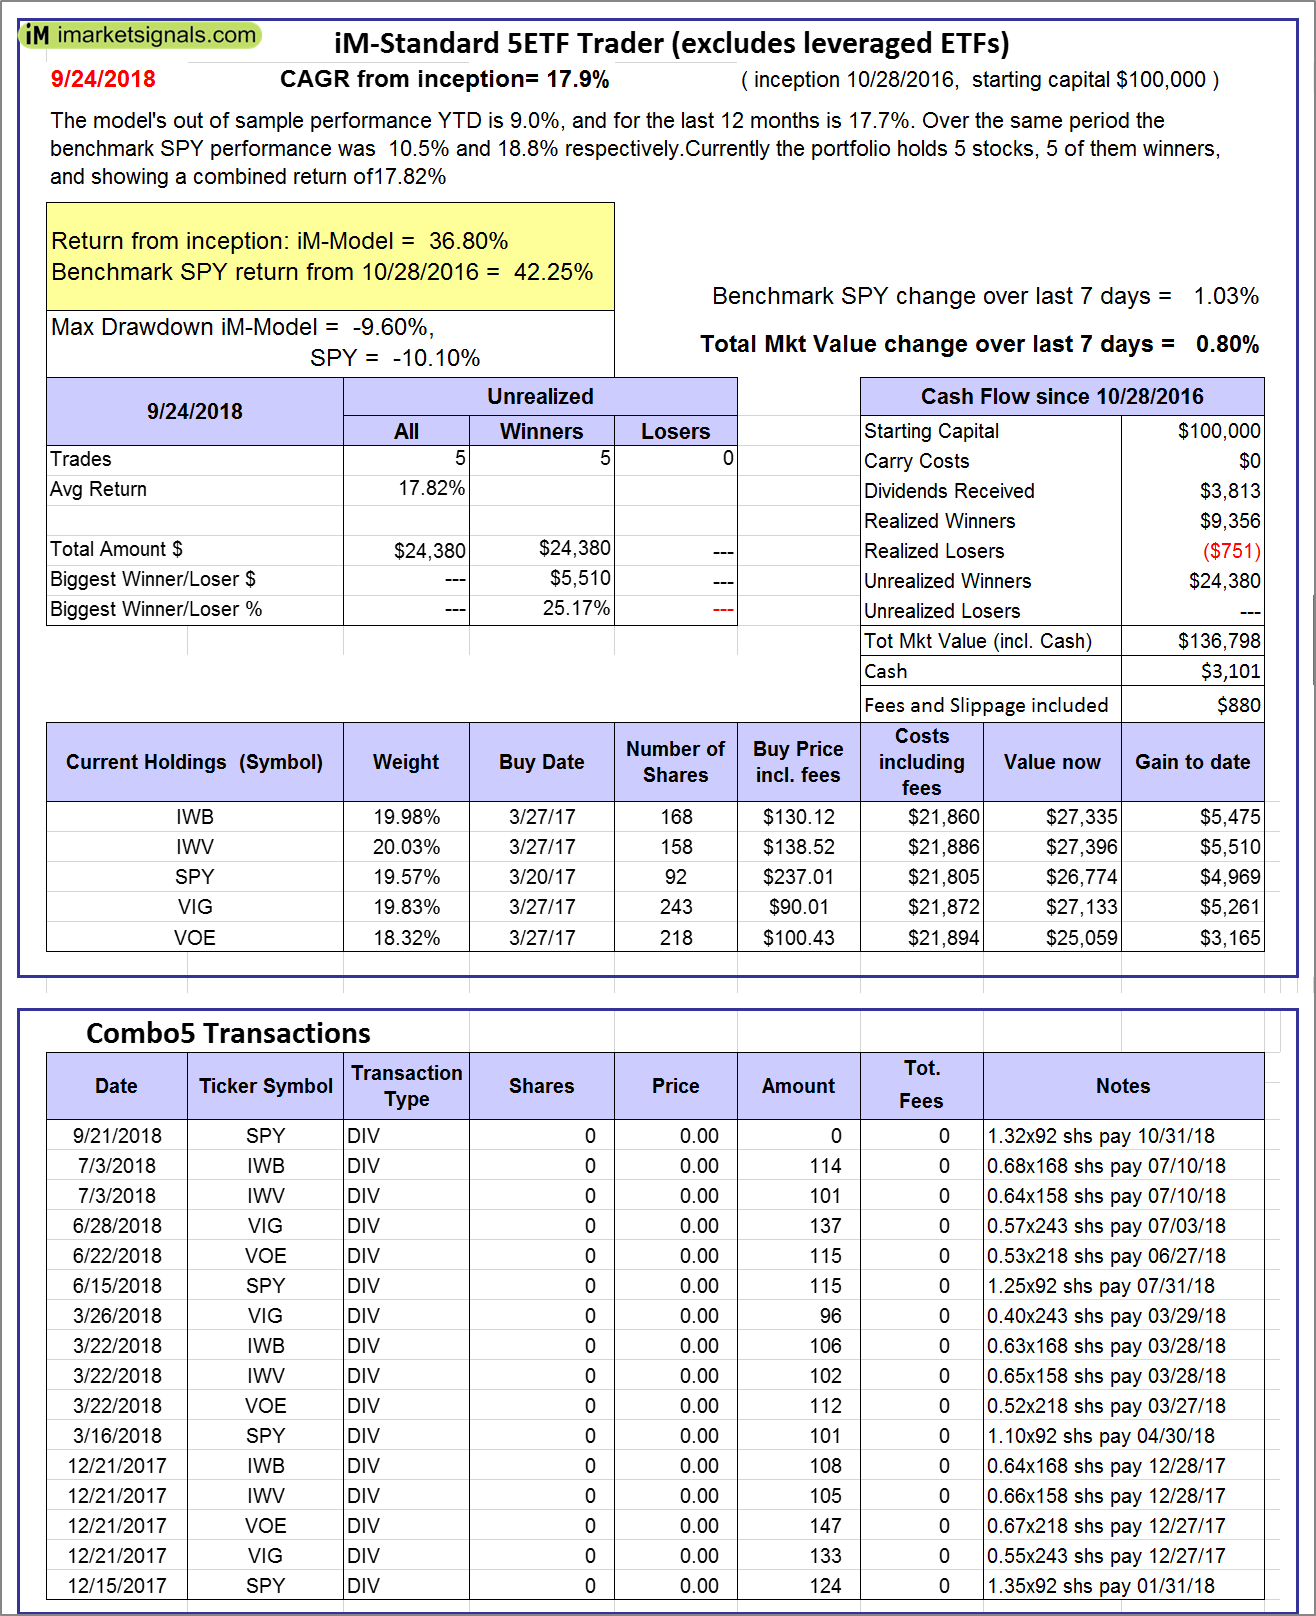 |
iM-Standard 5ETF Trader (excludes leveraged ETFs): The model’s out of sample performance YTD is 9.0%, and for the last 12 months is 17.7%. Over the same period the benchmark SPY performance was 10.5% and 18.8% respectively. Over the previous week the market value of the iM-Standard 5ETF Trader (excludes leveraged ETFs) gained 0.80% at a time when SPY gained 1.03%. A starting capital of $100,000 at inception on 10/30/2016 would have grown to $136,798 which includes $3,101 cash and excludes $880 spent on fees and slippage. |
iM-Best Reports – 9/24/2018
Posted in pmp SPY-SH
Leave a Reply
You must be logged in to post a comment.