
  |
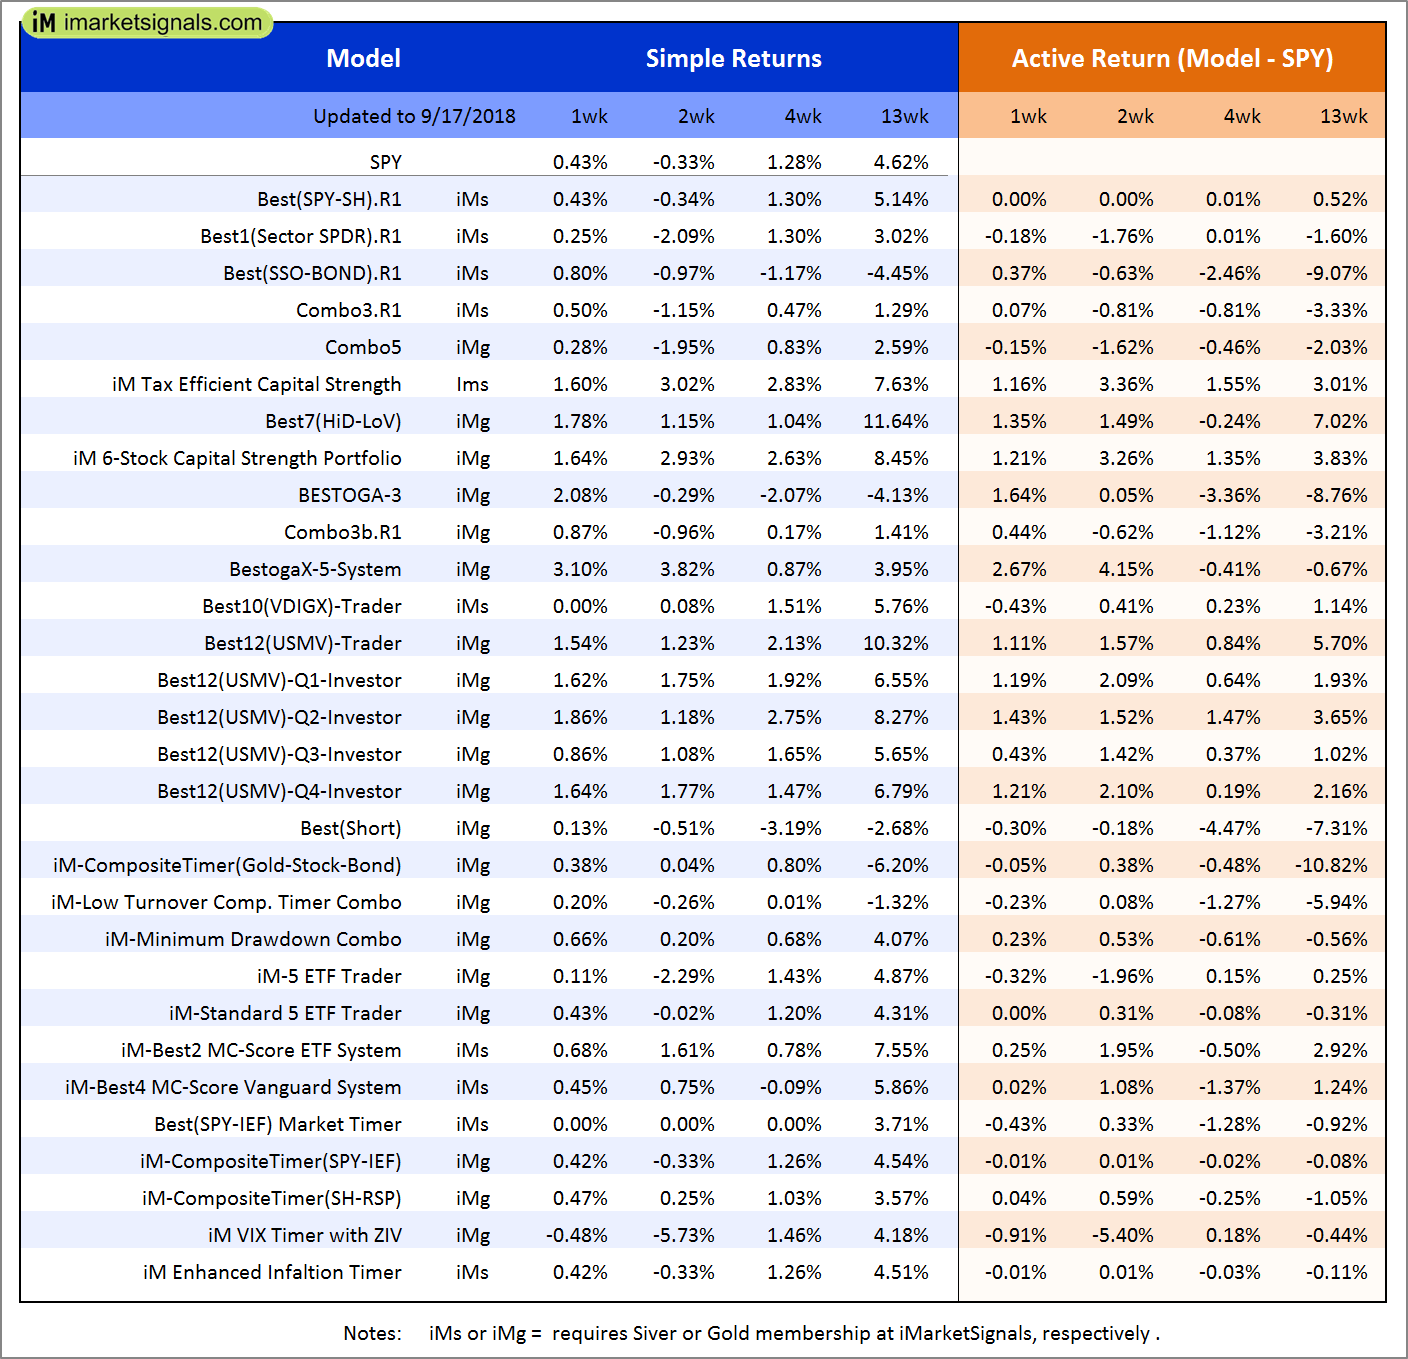
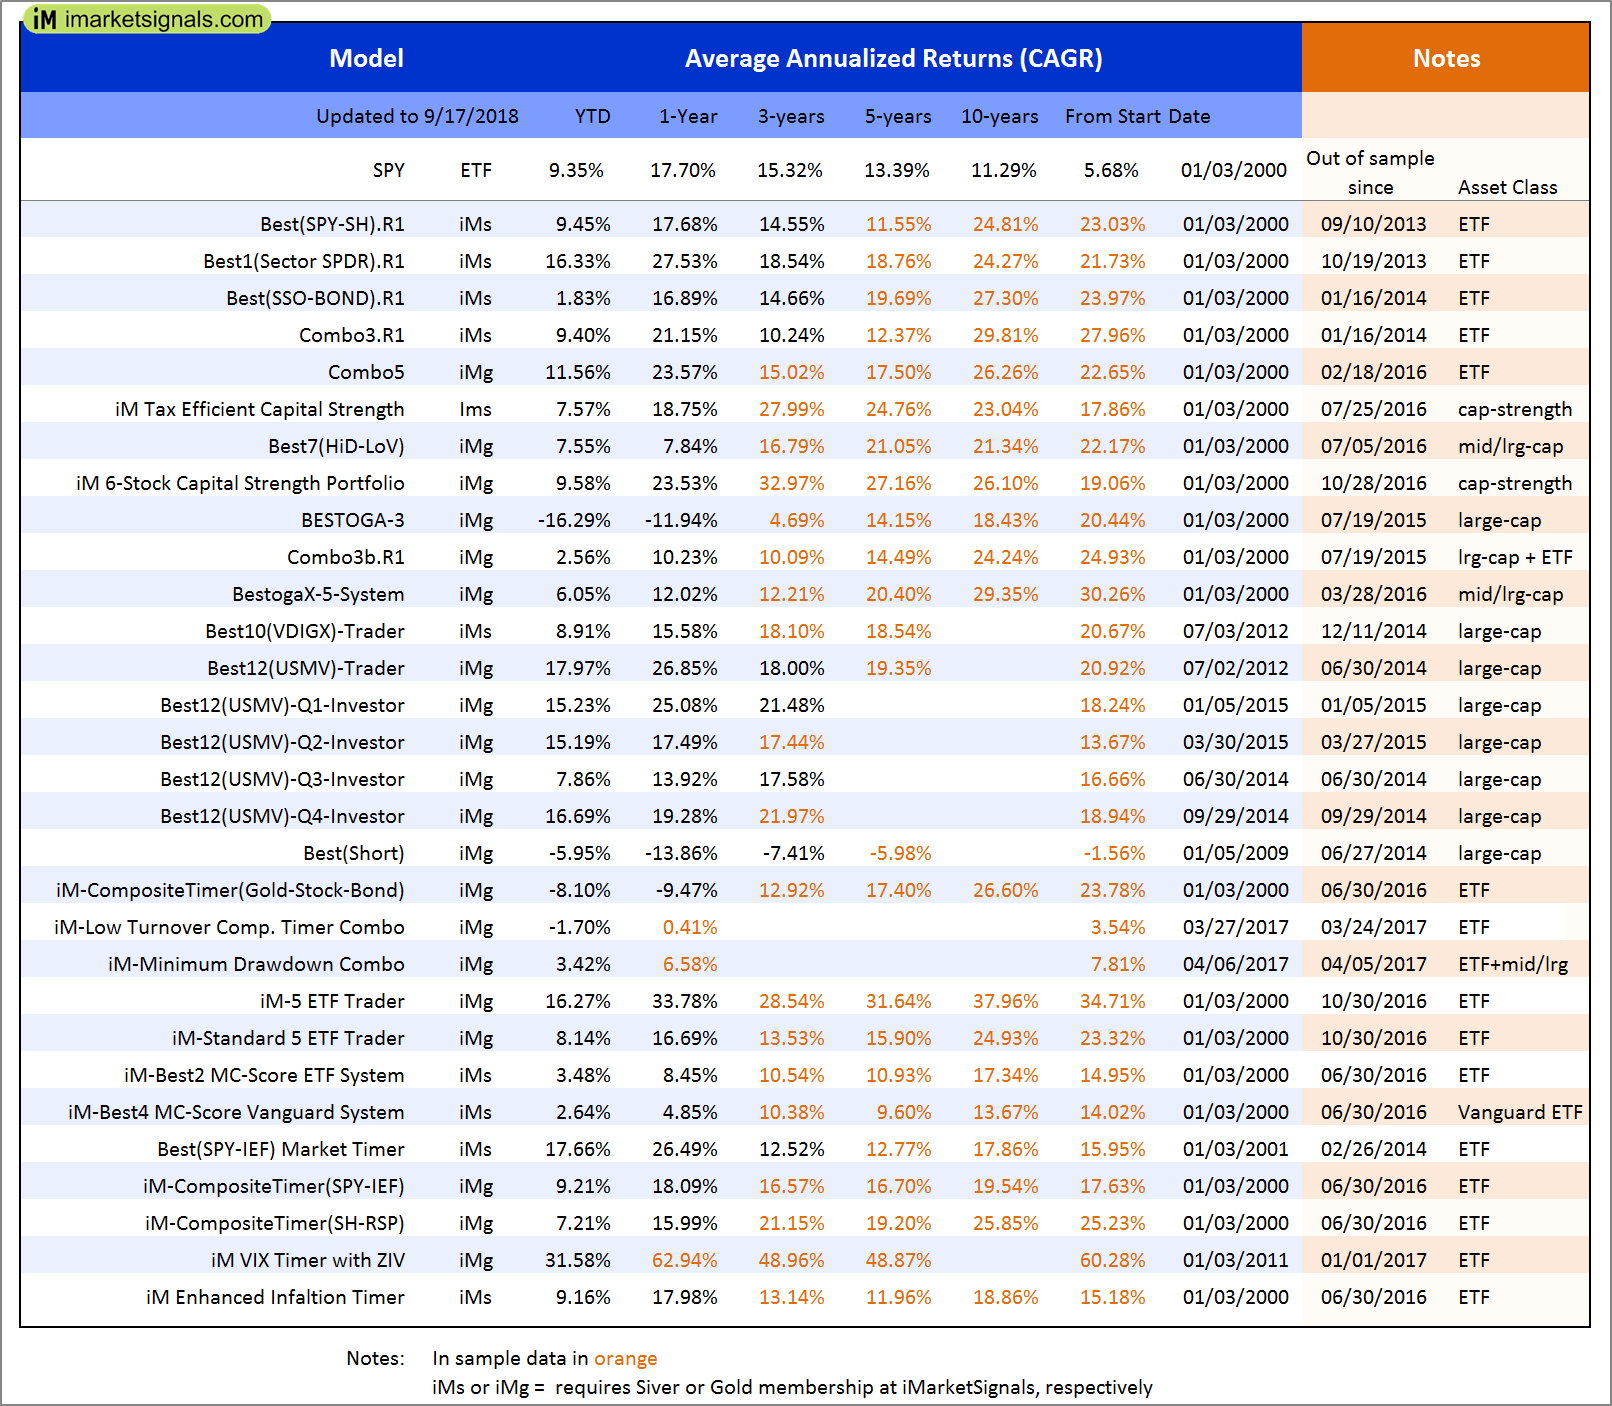
Out of sample performance summary of our models for the past 1, 2, 4 and 13 week periods. The active active return indicates how the models over- or underperformed the benchmark ETF SPY. Also the YTD, and the 1-, 3-, 5- and 10-year annualized returns are shown in the second table |
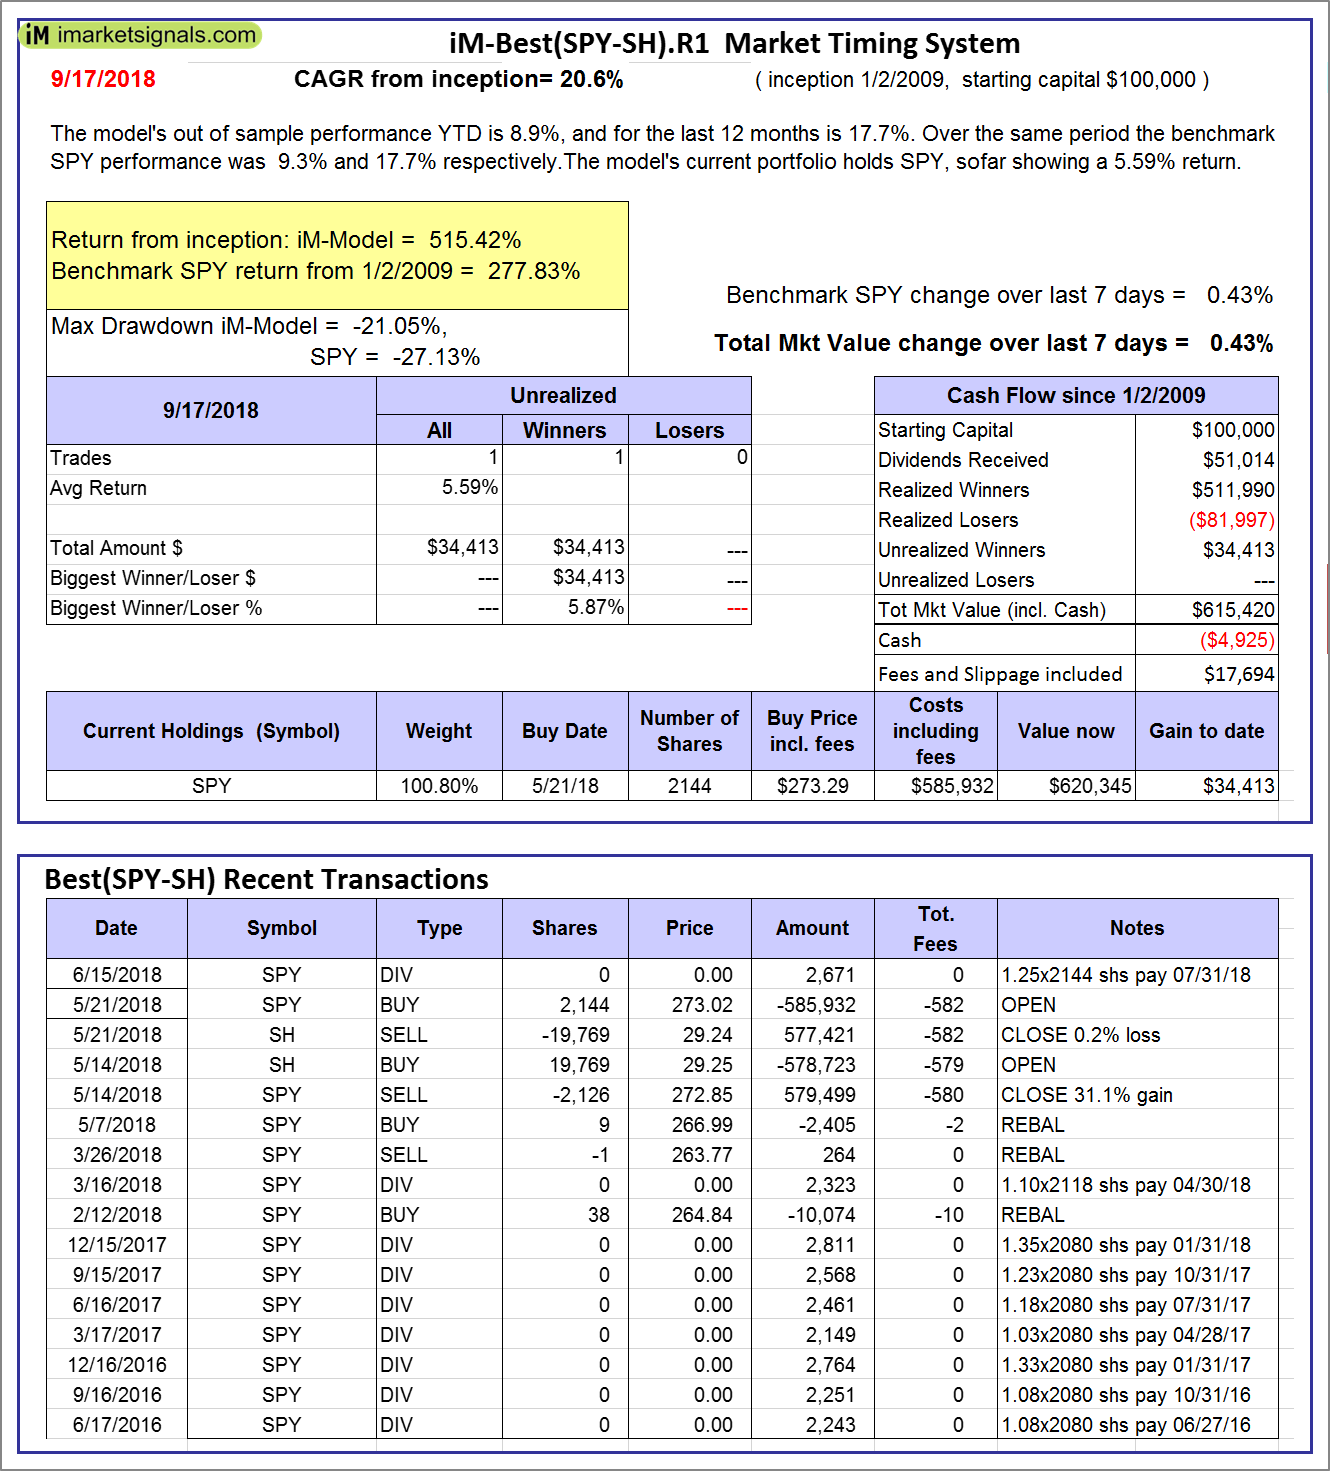 |
iM-Best(SPY-SH).R1: The model’s out of sample performance YTD is 8.9%, and for the last 12 months is 17.7%. Over the same period the benchmark SPY performance was 9.3% and 17.7% respectively. Over the previous week the market value of Best(SPY-SH) gained 0.43% at a time when SPY gained 0.43%. A starting capital of $100,000 at inception on 1/2/2009 would have grown to $615,420 which includes -$4,925 cash and excludes $17,694 spent on fees and slippage. |
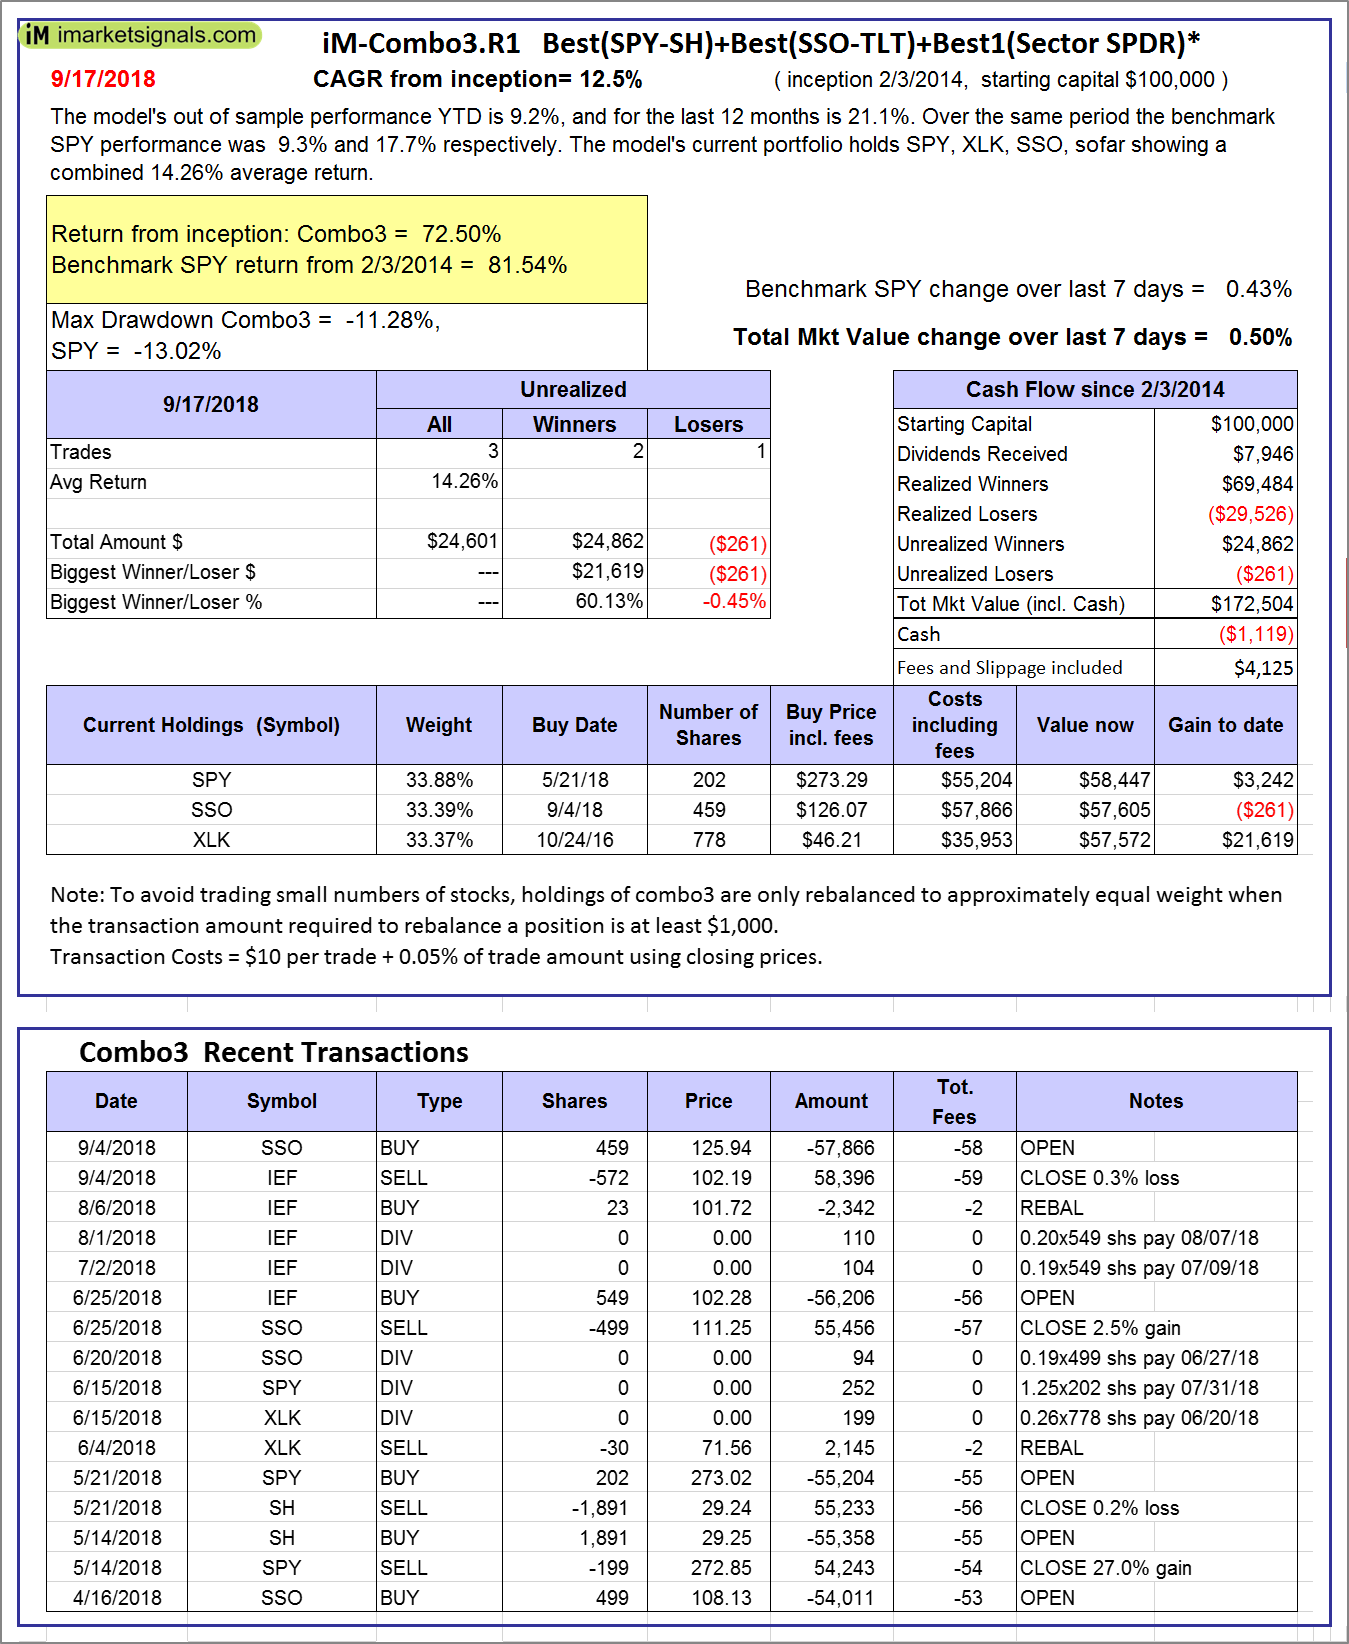 |
iM-Combo3.R1: The model’s out of sample performance YTD is 9.2%, and for the last 12 months is 21.1%. Over the same period the benchmark SPY performance was 9.3% and 17.7% respectively. Over the previous week the market value of iM-Combo3.R1 gained 0.50% at a time when SPY gained 0.43%. A starting capital of $100,000 at inception on 2/3/2014 would have grown to $172,504 which includes -$1,119 cash and excludes $4,125 spent on fees and slippage. |
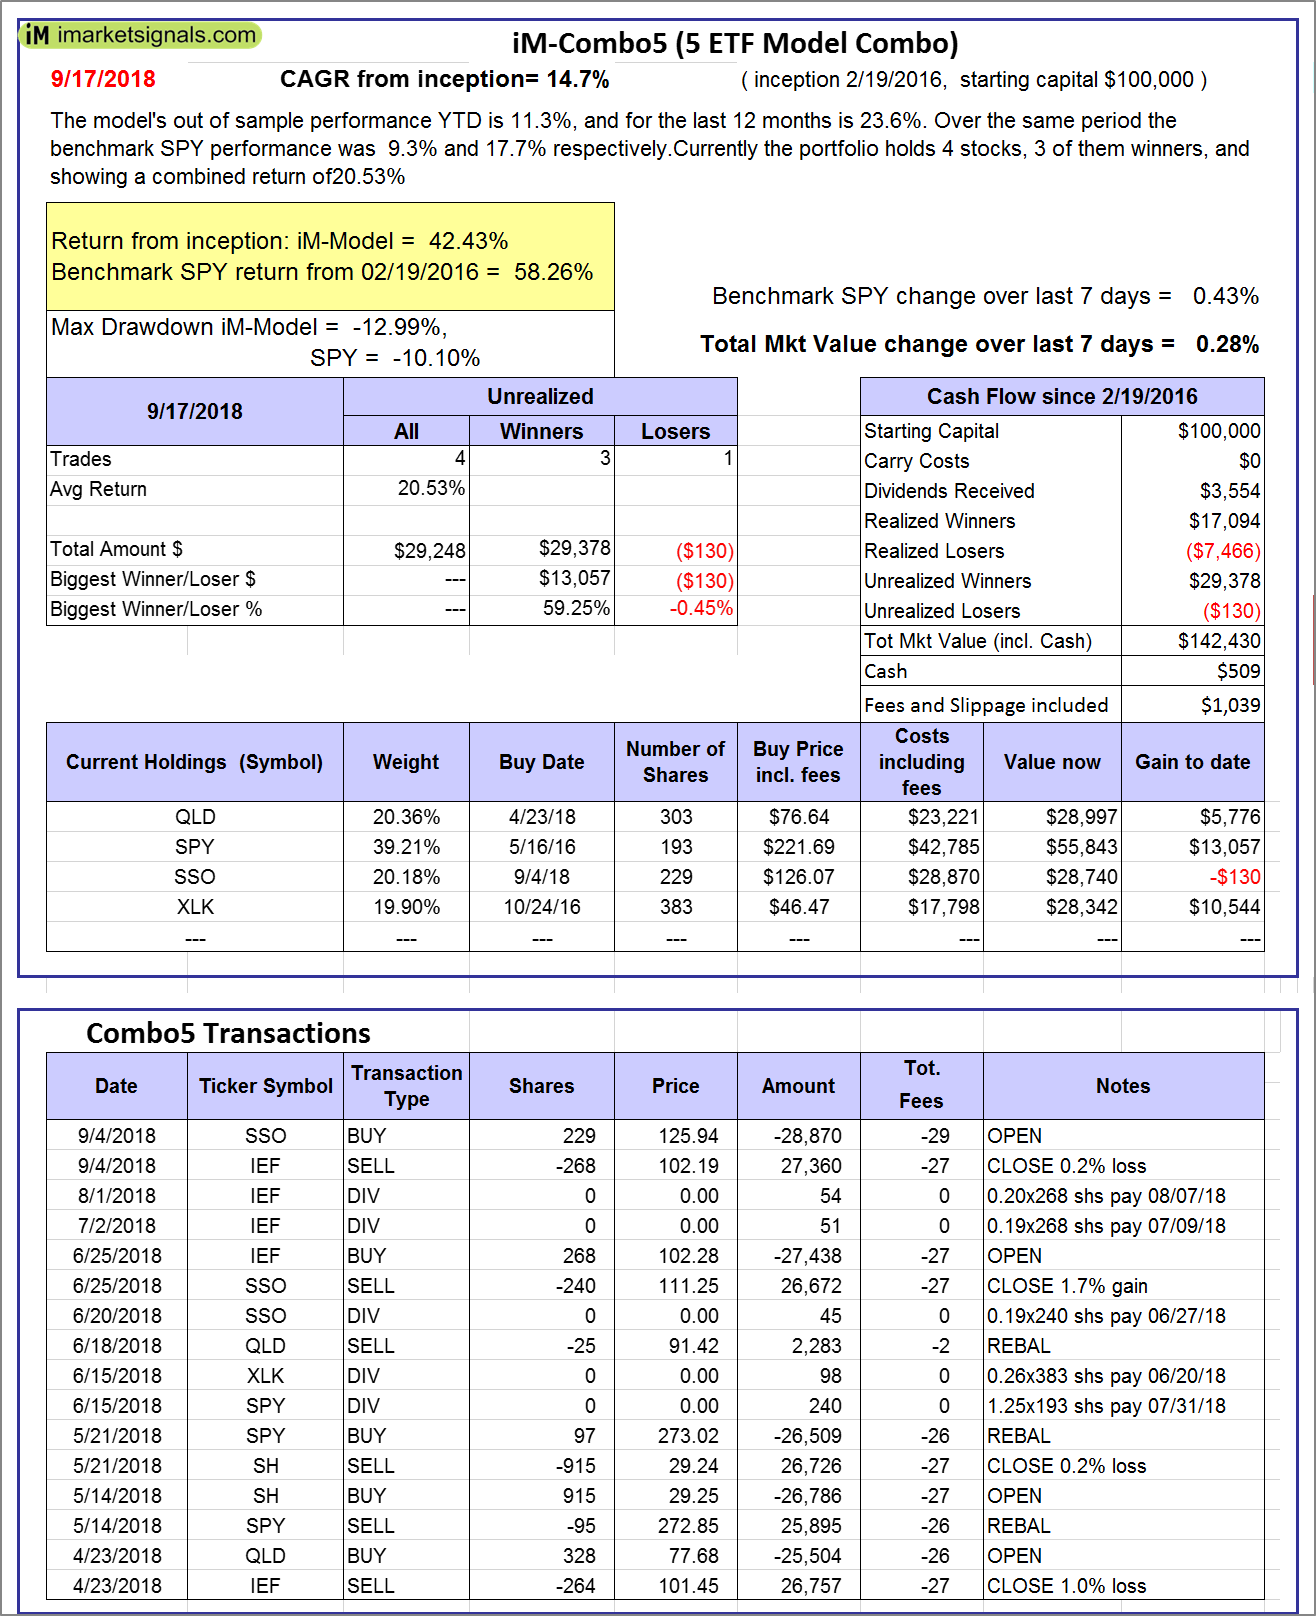 |
iM-Combo5: The model’s out of sample performance YTD is 11.3%, and for the last 12 months is 23.6%. Over the same period the benchmark SPY performance was 9.3% and 17.7% respectively. Over the previous week the market value of iM-Combo5 gained 0.28% at a time when SPY gained 0.43%. A starting capital of $100,000 at inception on 2/22/2016 would have grown to $142,430 which includes $509 cash and excludes $1,039 spent on fees and slippage. |
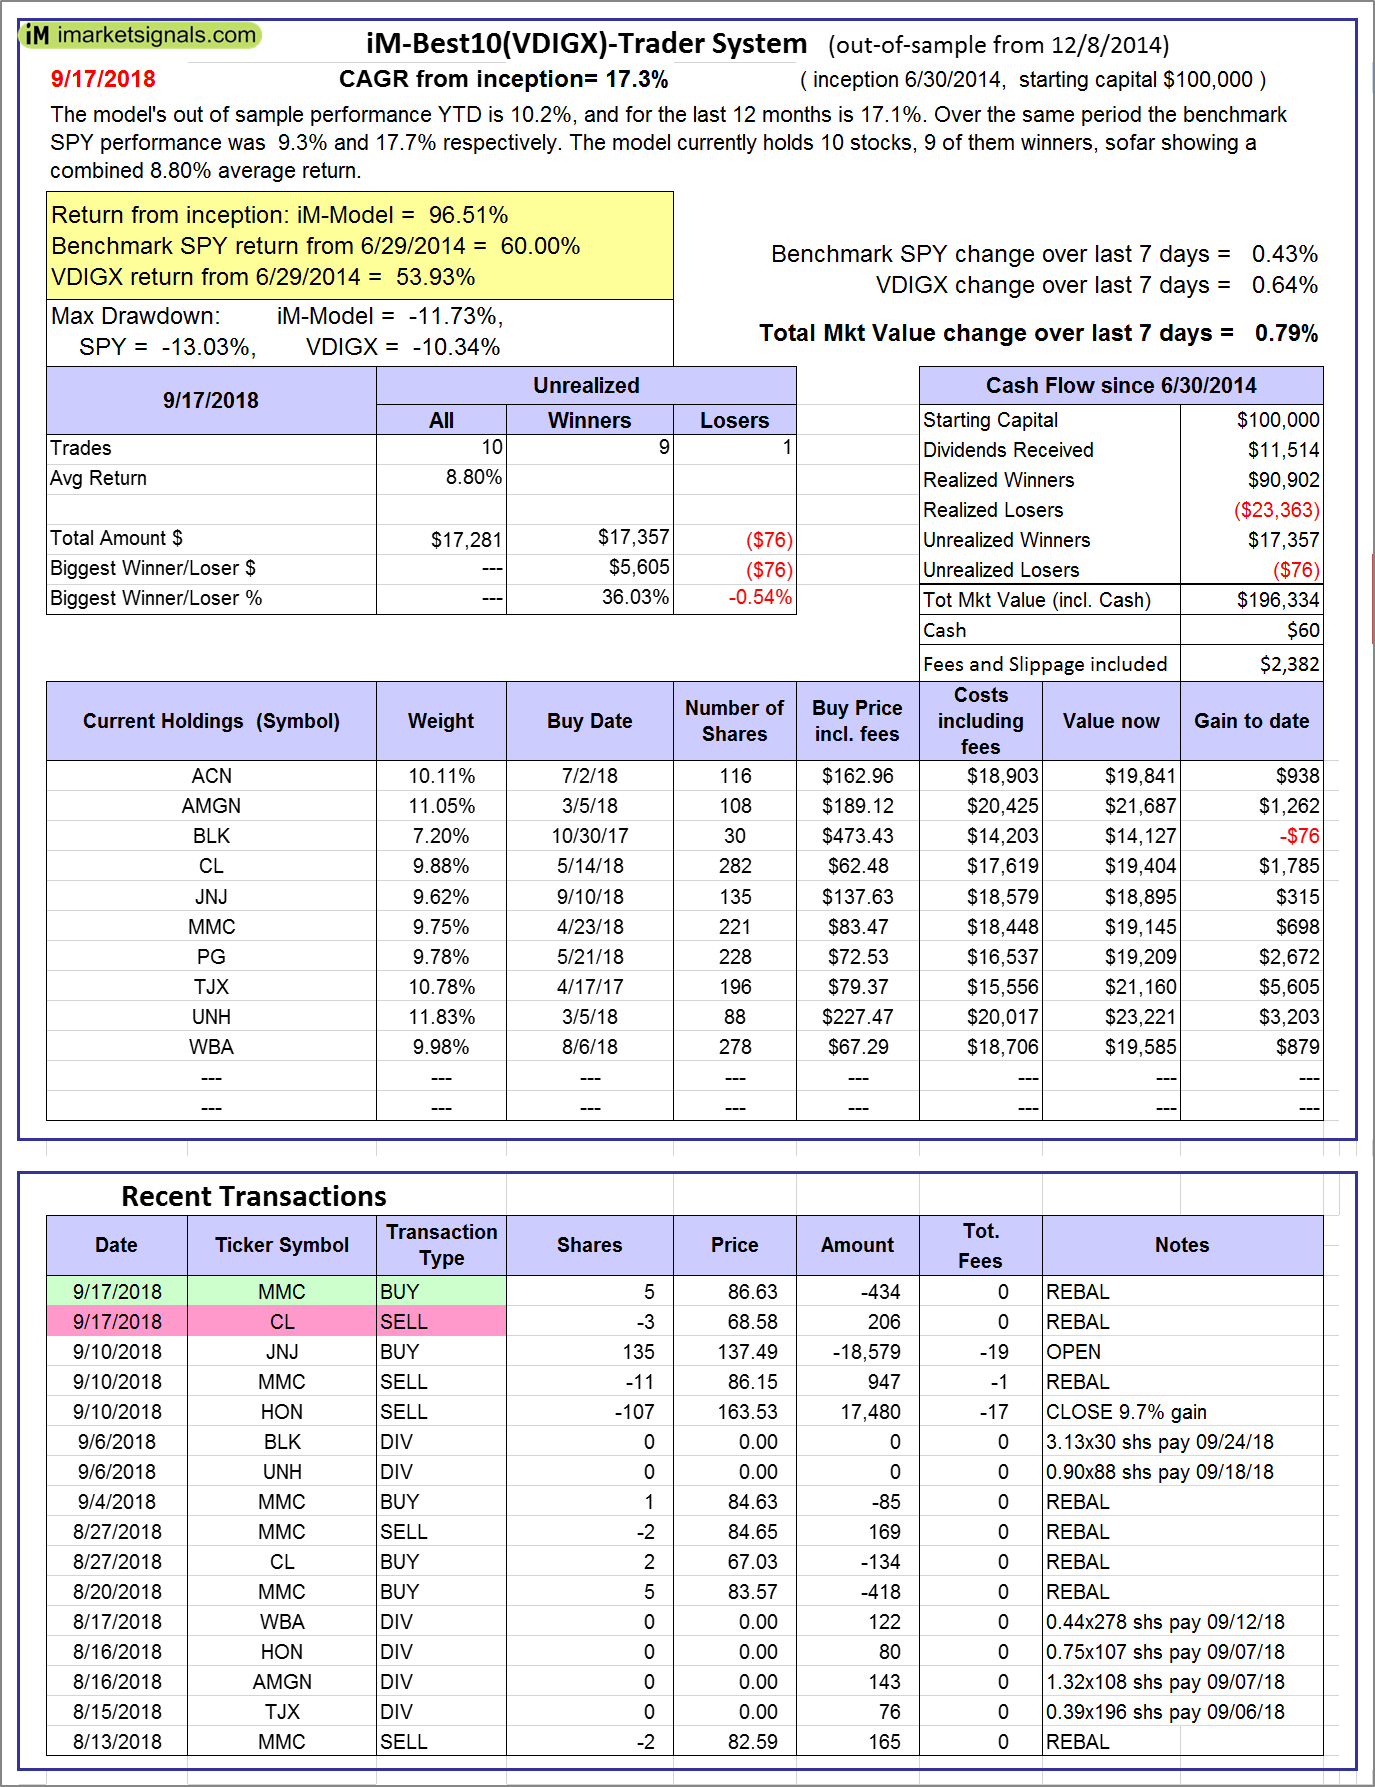 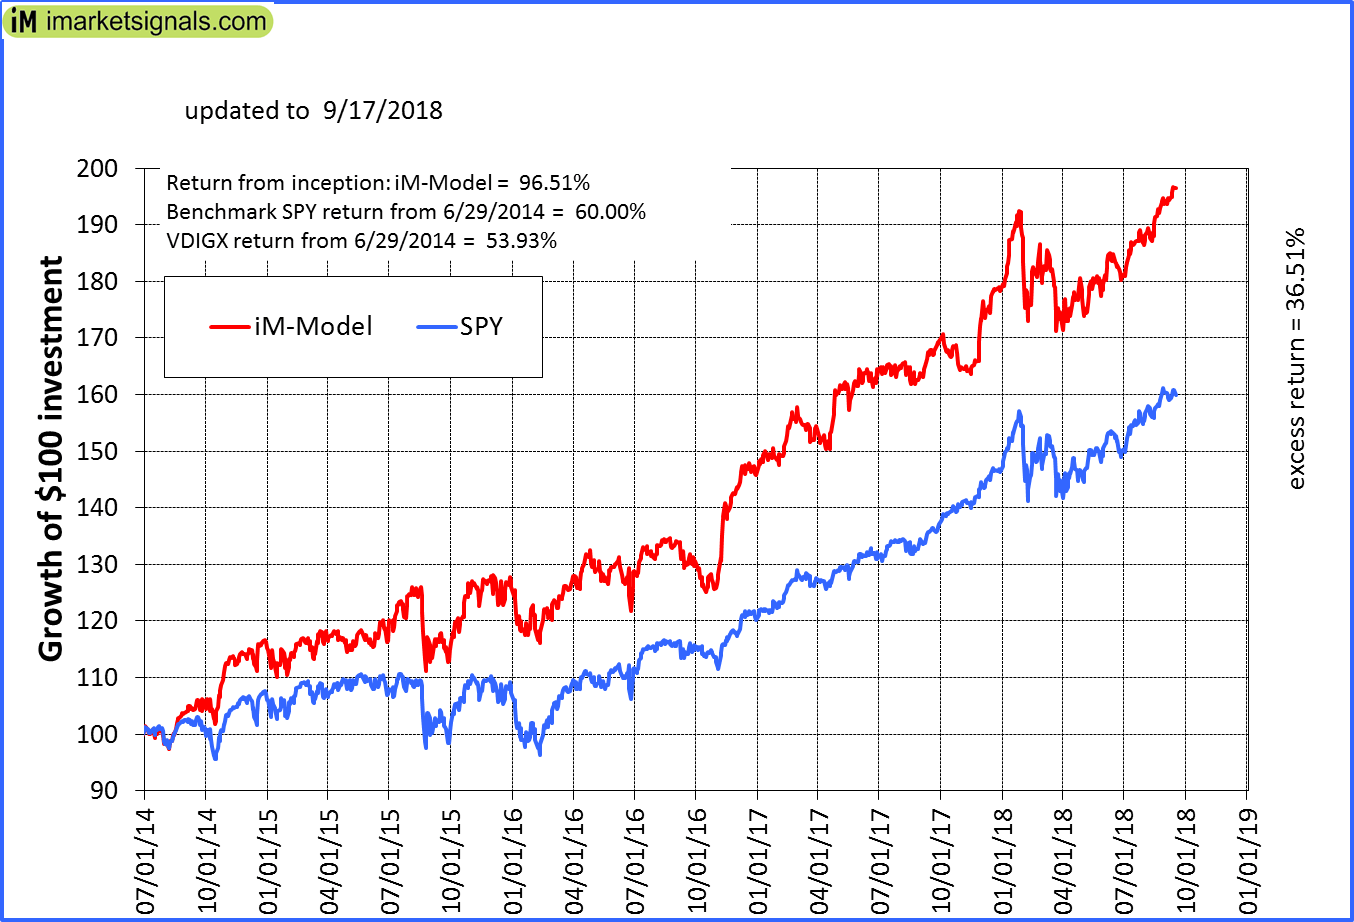 |
iM-Best10(VDIGX)-Trader: The model’s out of sample performance YTD is 10.2%, and for the last 12 months is 17.1%. Over the same period the benchmark SPY performance was 9.3% and 17.7% respectively. Since inception, on 7/1/2014, the model gained 96.51% while the benchmark SPY gained 60.00% and VDIGX gained 53.93% over the same period. Over the previous week the market value of iM-Best10(VDIGX) gained 0.79% at a time when SPY gained 0.43%. A starting capital of $100,000 at inception on 7/1/2014 would have grown to $196,334 which includes $60 cash and excludes $2,382 spent on fees and slippage. |
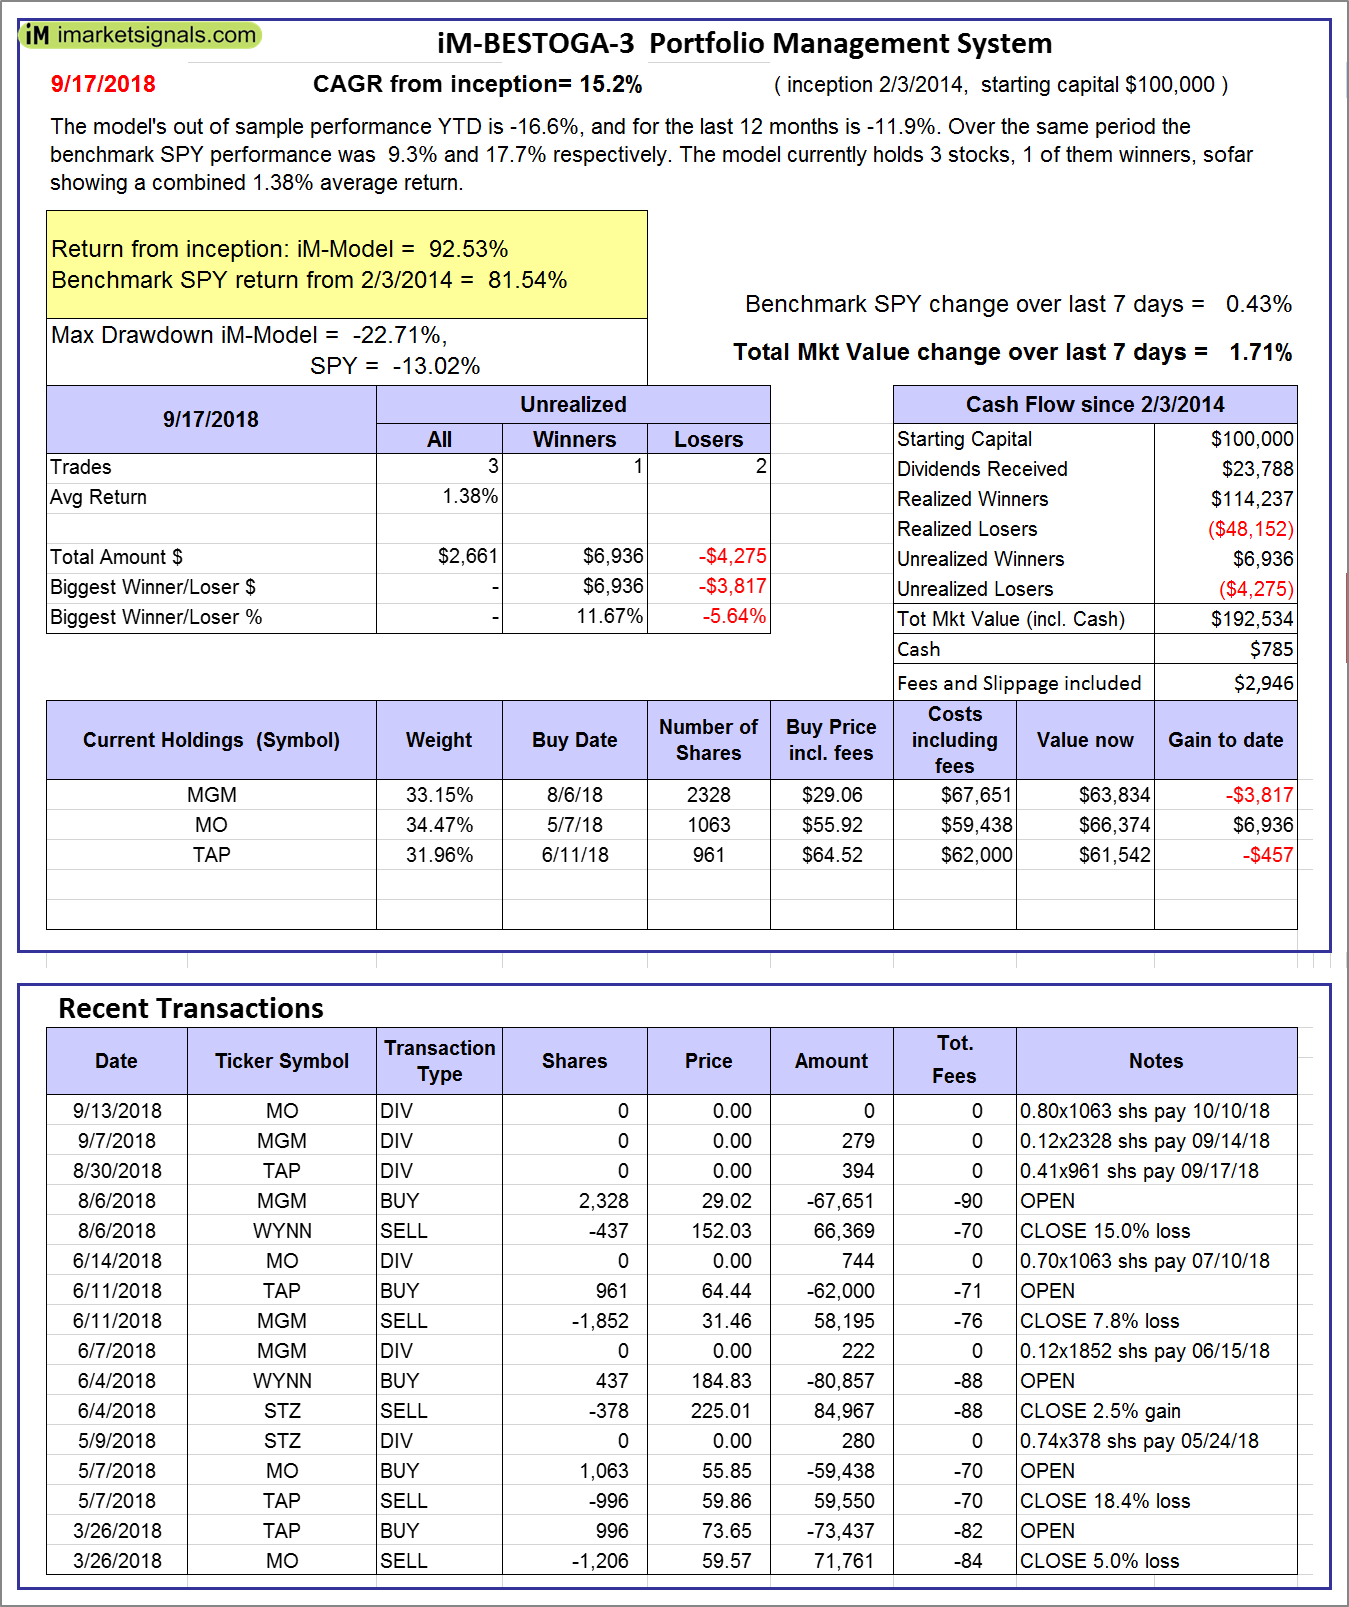 |
iM-BESTOGA-3: The model’s out of sample performance YTD is -16.6%, and for the last 12 months is -11.9%. Over the same period the benchmark SPY performance was 9.3% and 17.7% respectively. Over the previous week the market value of iM-BESTOGA-3 gained 1.71% at a time when SPY gained 0.43%. A starting capital of $100,000 at inception on 2/3/2014 would have grown to $192,534 which includes $785 cash and excludes $2,946 spent on fees and slippage. |
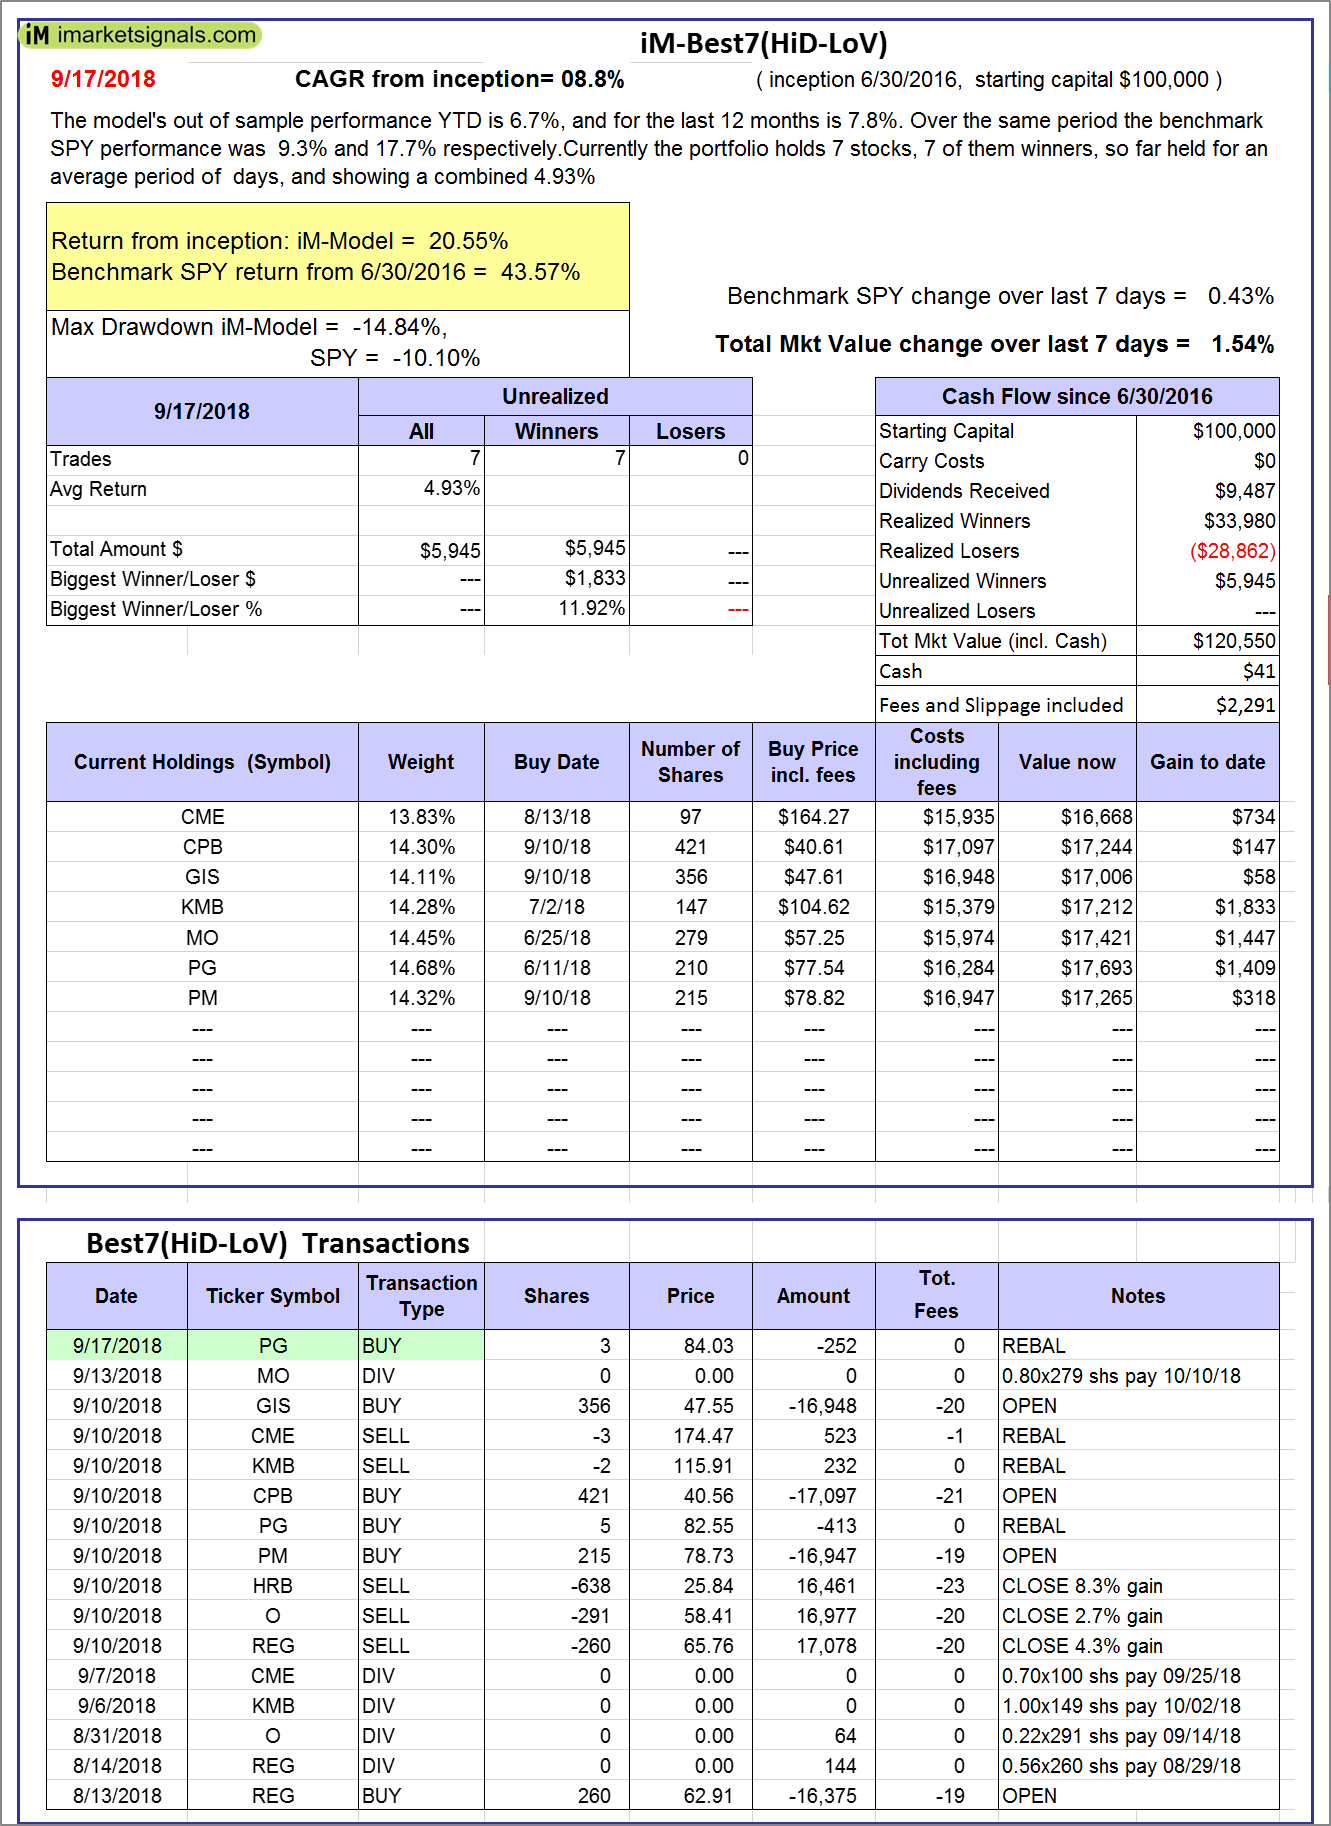 |
iM-Best7(HiD-LoV): The model’s out of sample performance YTD is 6.7%, and for the last 12 months is 7.8%. Over the same period the benchmark SPY performance was 9.3% and 17.7% respectively. Over the previous week the market value of iM-BESTOGA-3 gained 1.54% at a time when SPY gained 0.43%. A starting capital of $100,000 at inception on 6/30/2016 would have grown to $120,550 which includes $41 cash and excludes $2,291 spent on fees and slippage. |
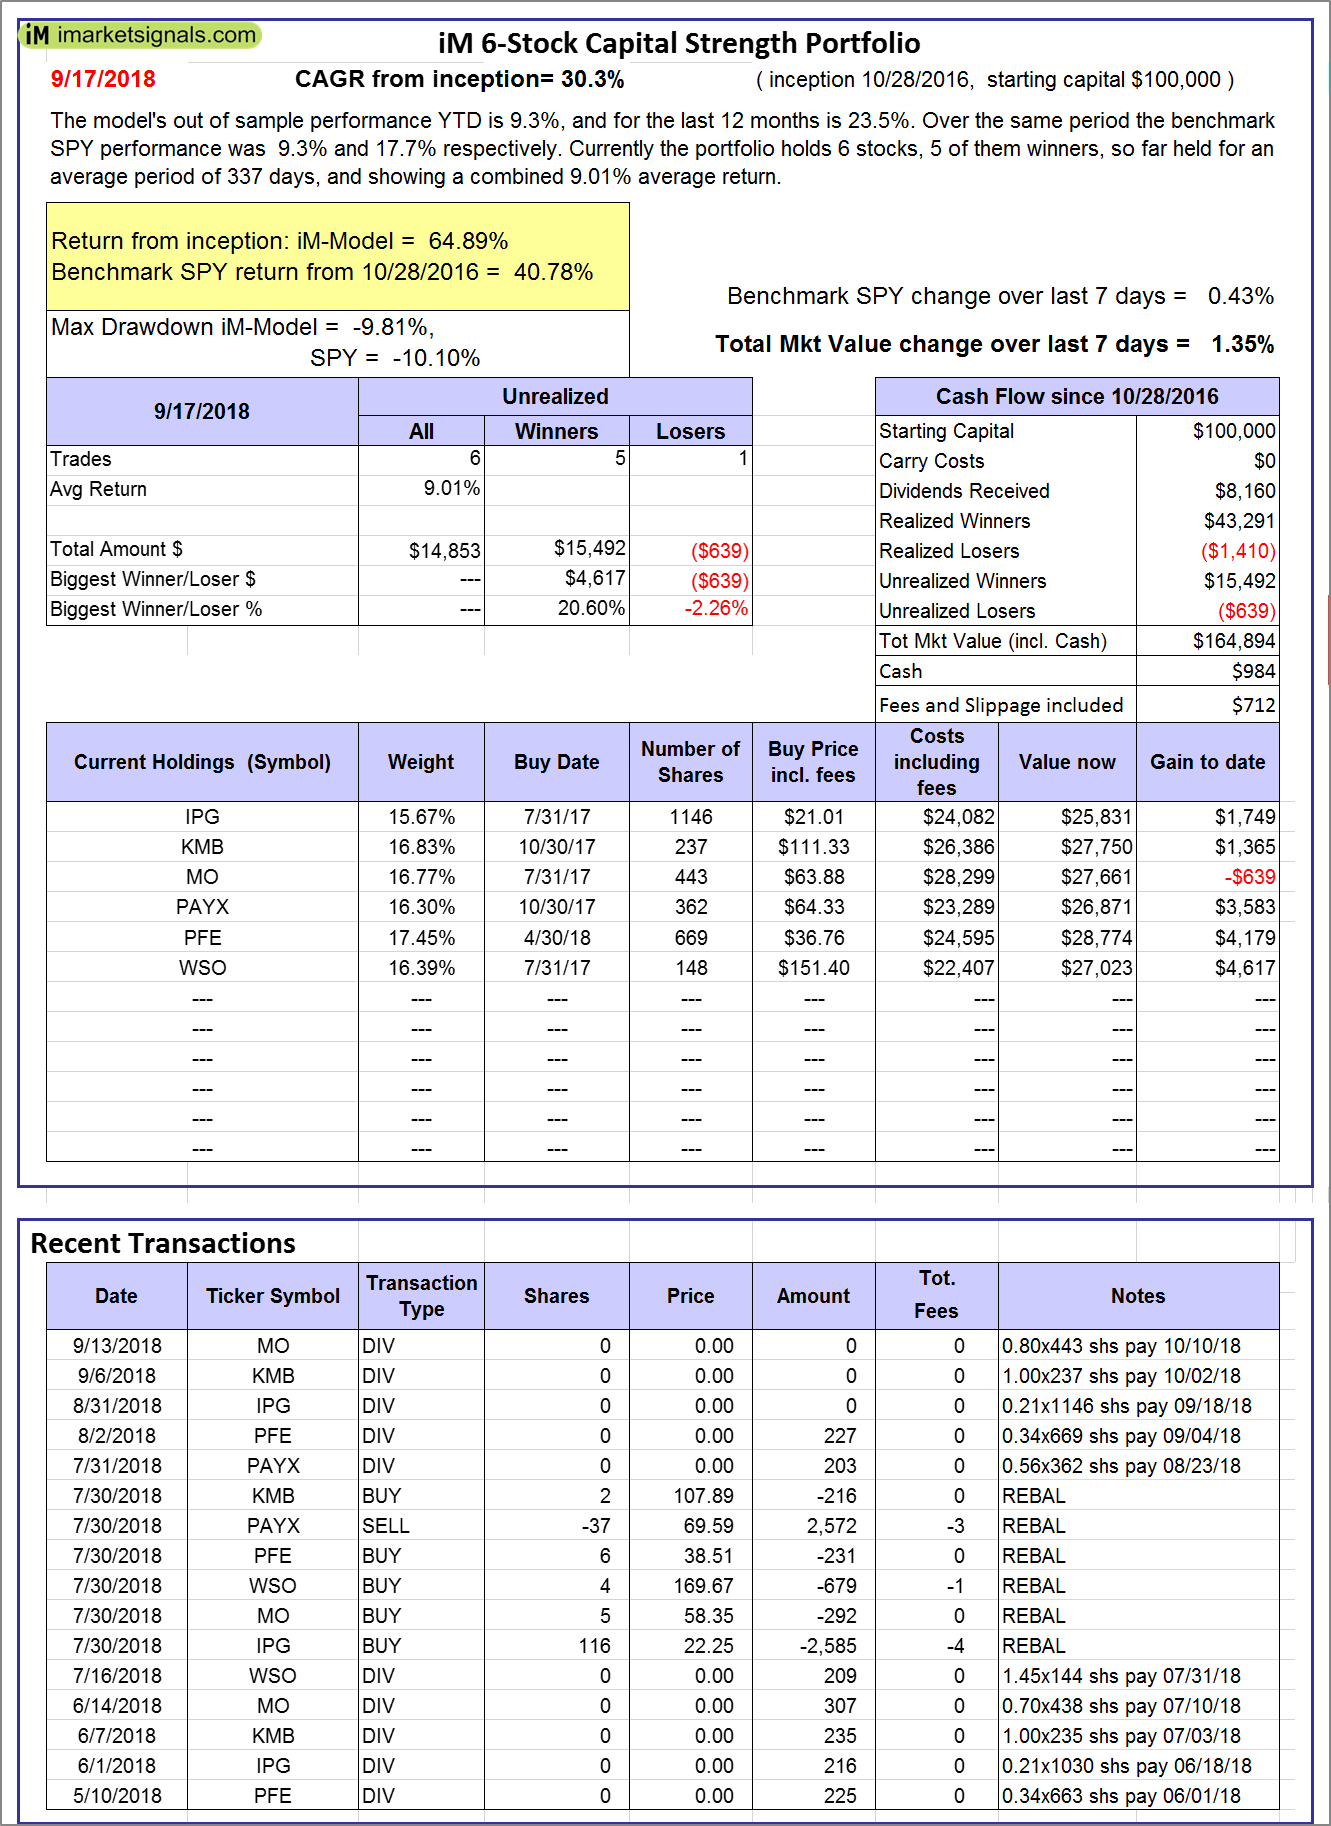 |
iM 6-Stock Capital Strength Portfolio: The model’s out of sample performance YTD is 9.3%, and for the last 12 months is 23.5%. Over the same period the benchmark SPY performance was 9.3% and 17.7% respectively. Over the previous week the market value of the iM 6-Stock Capital Strength Portfolio gained 1.35% at a time when SPY gained 0.43%. A starting capital of $100,000 at inception on 10/28/2016 would have grown to $164,894 which includes $984 cash and excludes $712 spent on fees and slippage. |
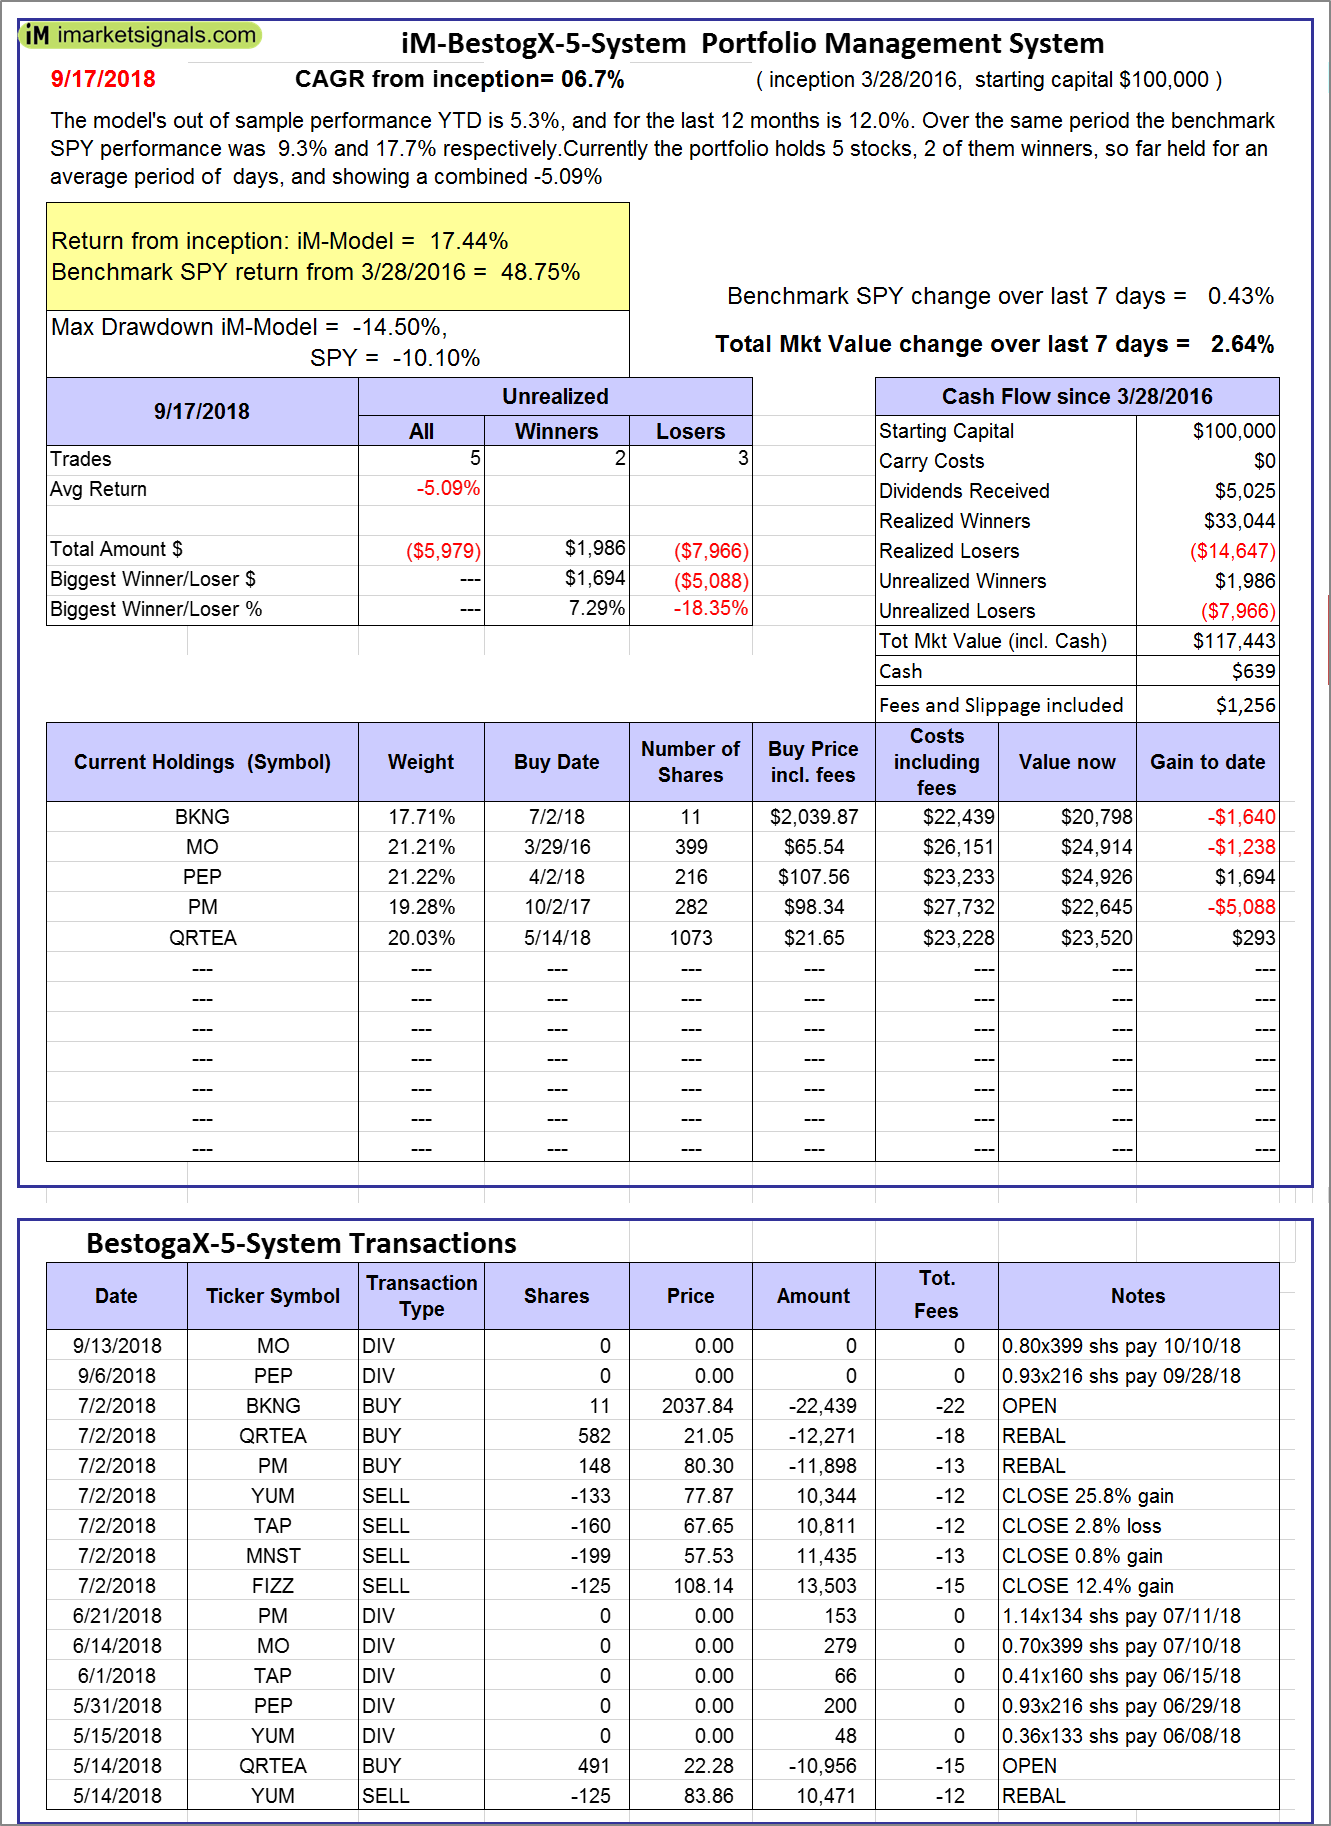 |
iM-BestogaX5-System: The model’s out of sample performance YTD is 5.3%, and for the last 12 months is 12.0%. Over the same period the benchmark SPY performance was 9.3% and 17.7% respectively. Over the previous week the market value of iM-BestogaX5-System gained 2.64% at a time when SPY gained 0.43%. A starting capital of $100,000 at inception on 3/28/2016 would have grown to $117,443 which includes $639 cash and excludes $1,256 spent on fees and slippage. |
 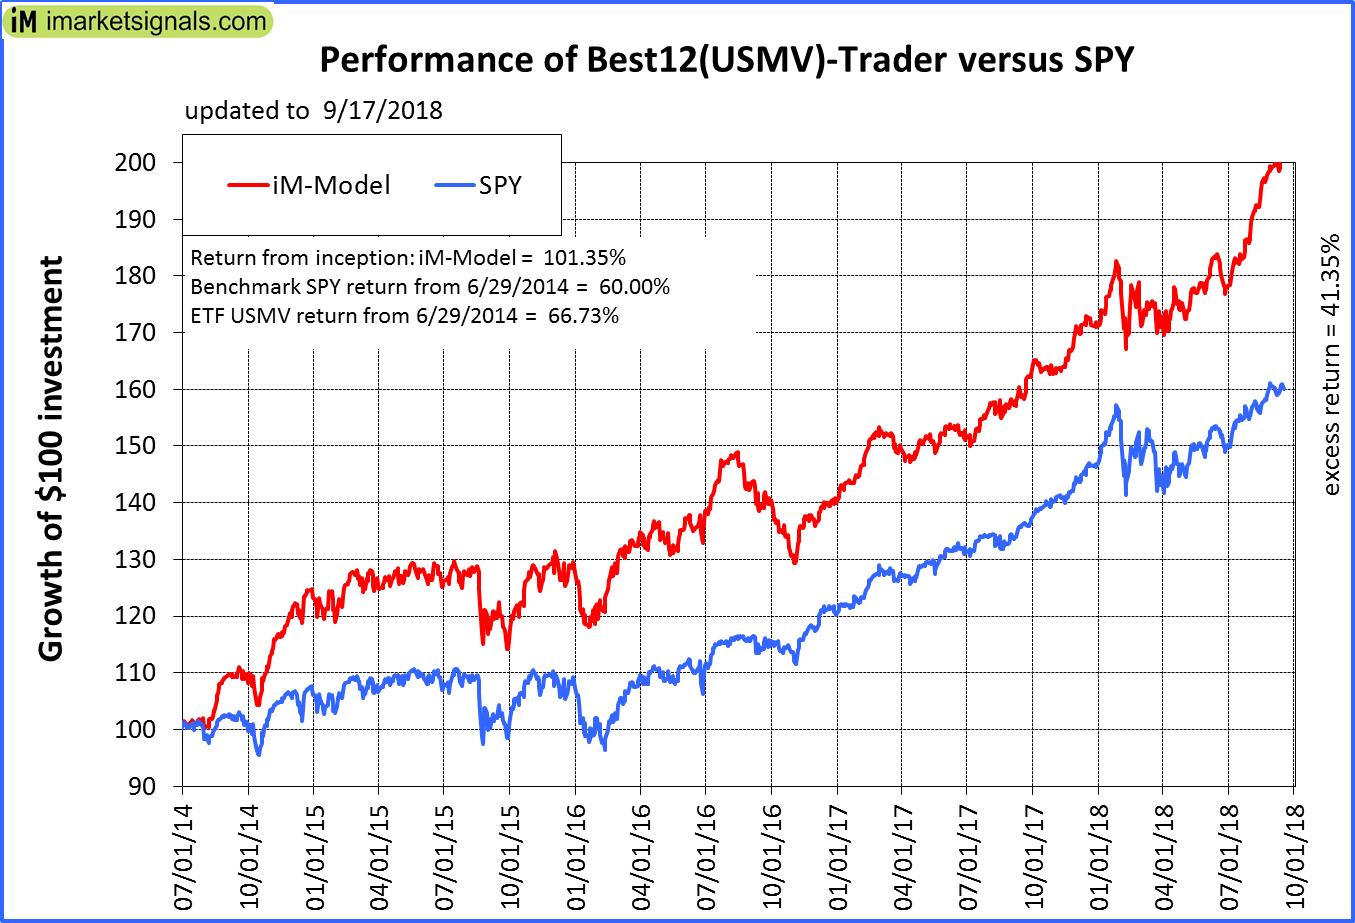 |
iM-Best12(USMV)-Trader: The model’s out of sample performance YTD is 17.7%, and for the last 12 months is 26.9%. Over the same period the benchmark SPY performance was 9.3% and 17.7% respectively. Since inception, on 6/30/2014, the model gained 101.35% while the benchmark SPY gained 60.00% and the ETF USMV gained 66.73% over the same period. Over the previous week the market value of iM-Best12(USMV)-Trader gained 1.46% at a time when SPY gained 0.43%. A starting capital of $100,000 at inception on 6/30/2014 would have grown to $200,911 which includes -$193 cash and excludes $4,435 spent on fees and slippage. |
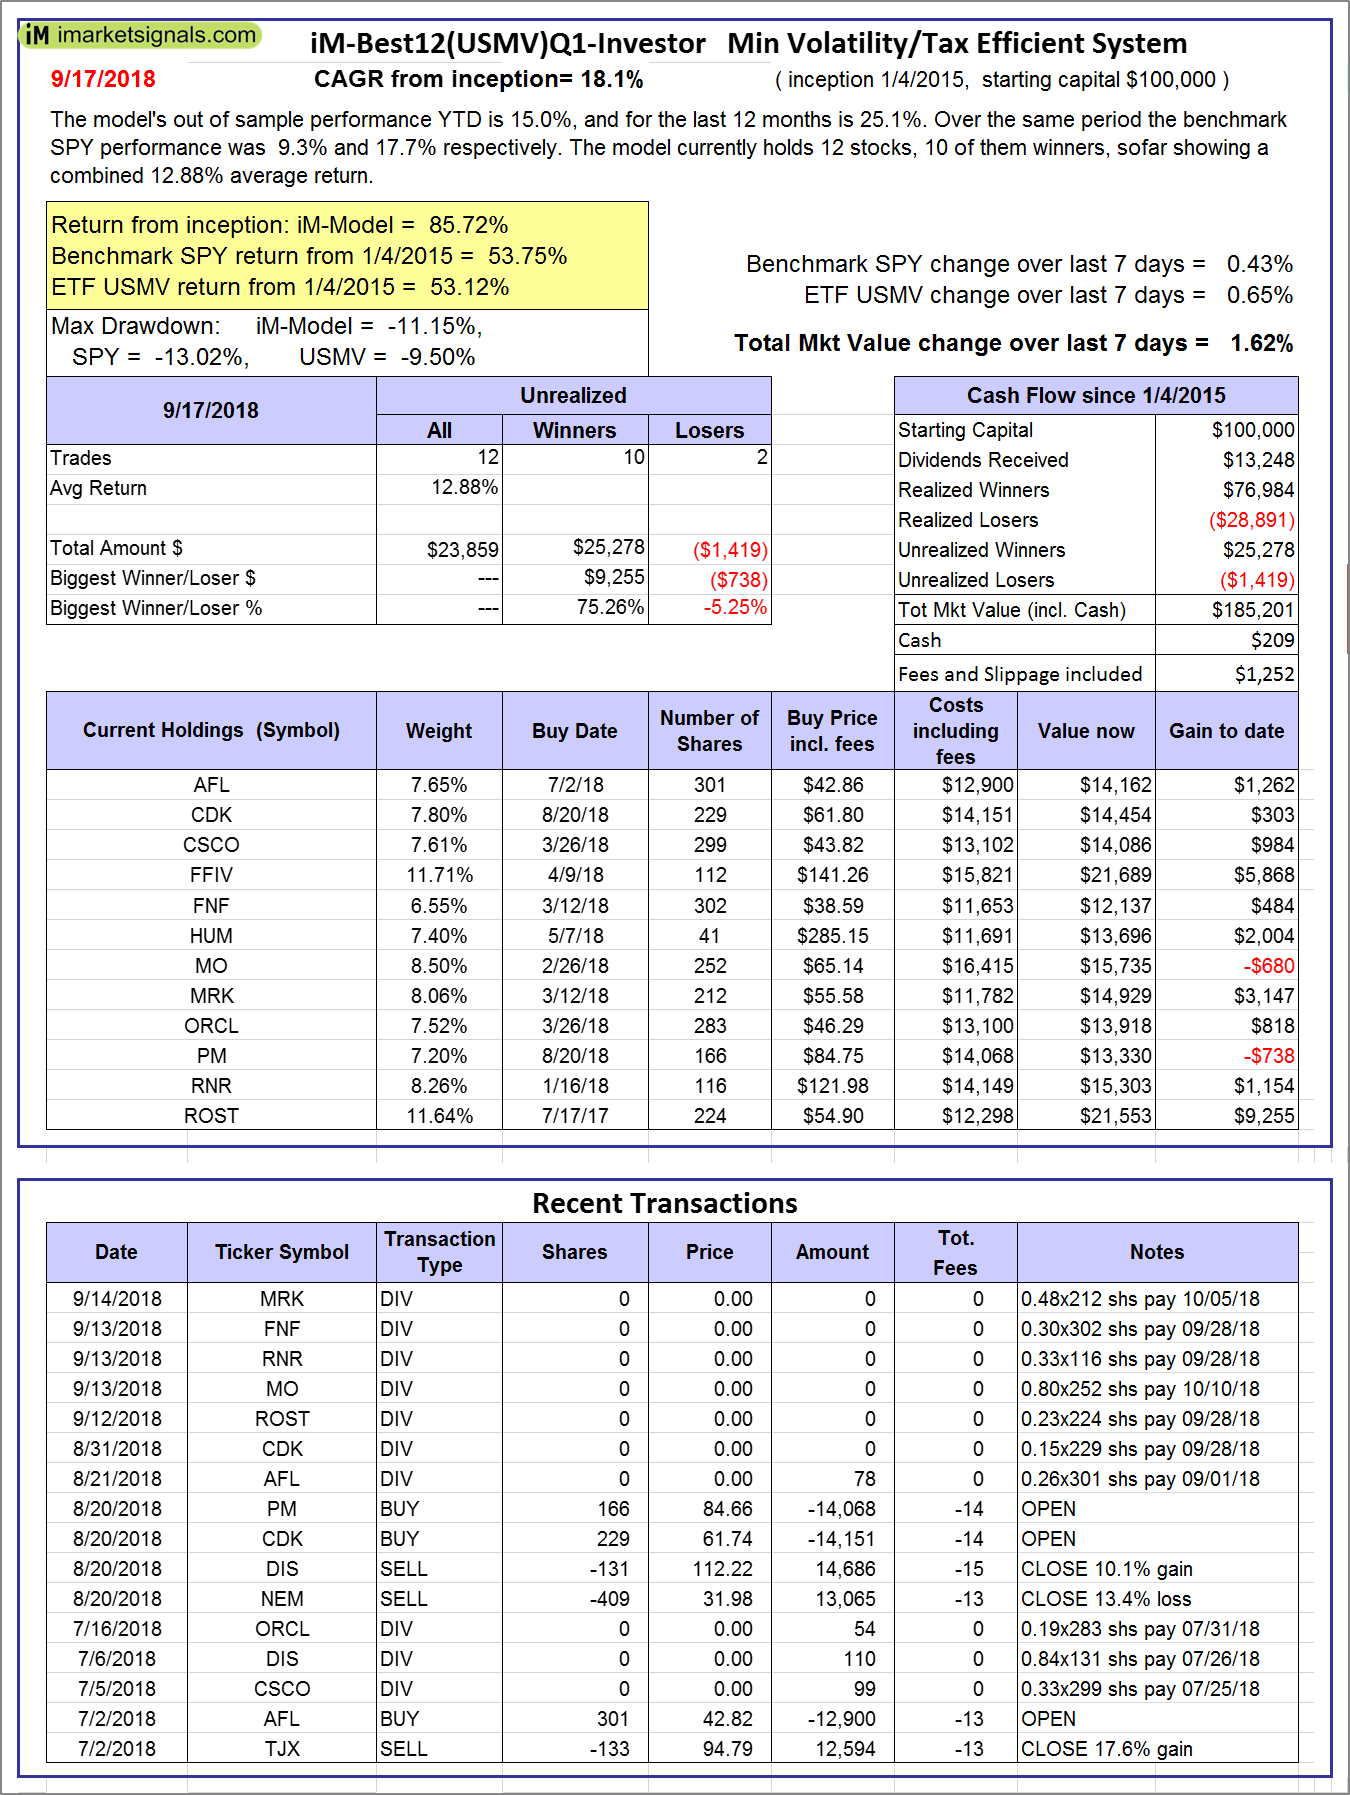 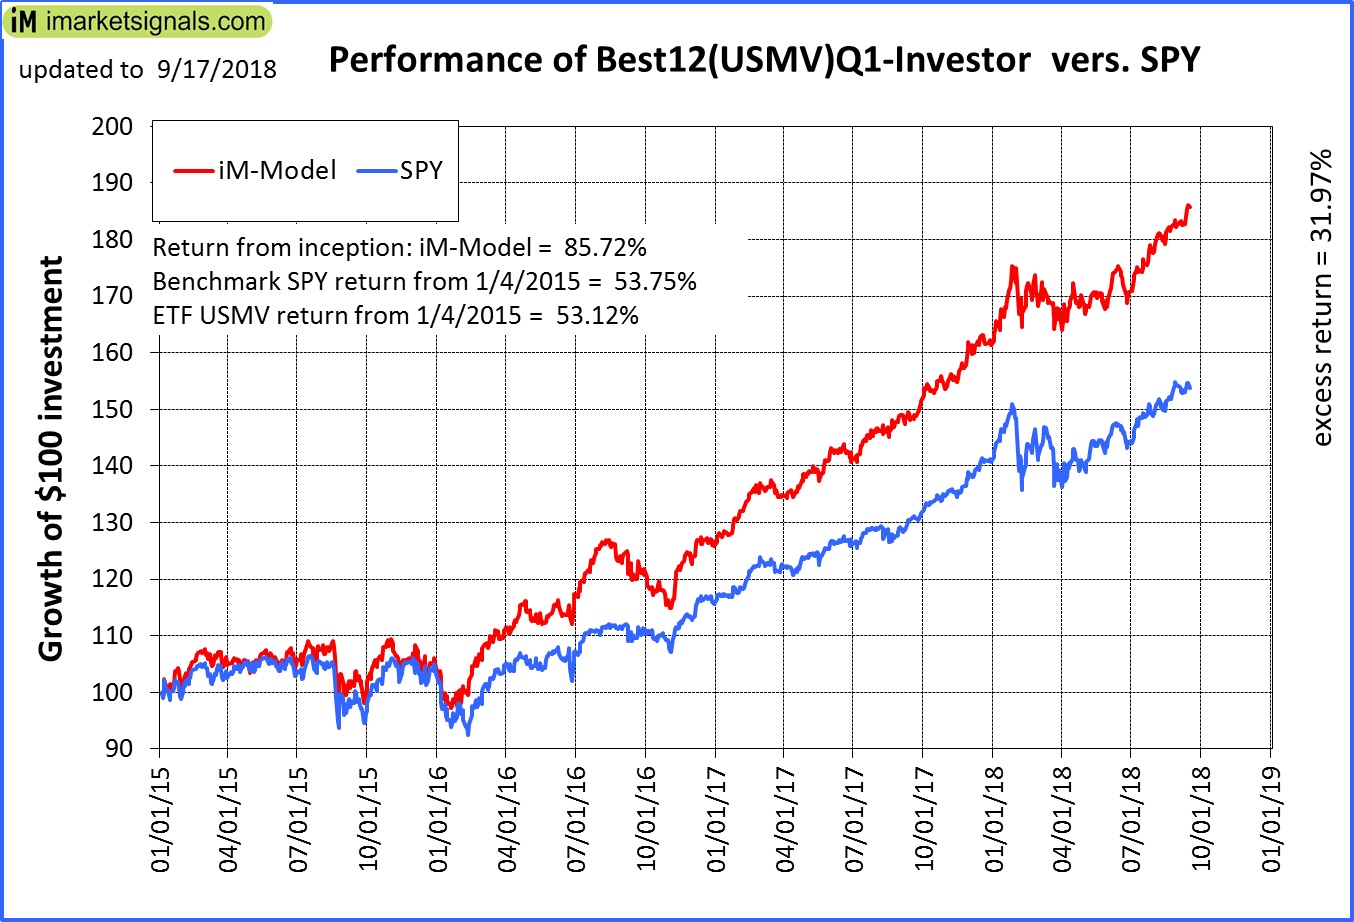 |
iM-Best12(USMV)Q1-Investor: The model’s out of sample performance YTD is 15.0%, and for the last 12 months is 25.1%. Over the same period the benchmark SPY performance was 9.3% and 17.7% respectively. Since inception, on 1/5/2015, the model gained 85.72% while the benchmark SPY gained 53.75% and the ETF USMV gained 53.12% over the same period. Over the previous week the market value of iM-Best12(USMV)Q1 gained 1.62% at a time when SPY gained 0.43%. A starting capital of $100,000 at inception on 1/5/2015 would have grown to $185,201 which includes $209 cash and excludes $1,252 spent on fees and slippage. |
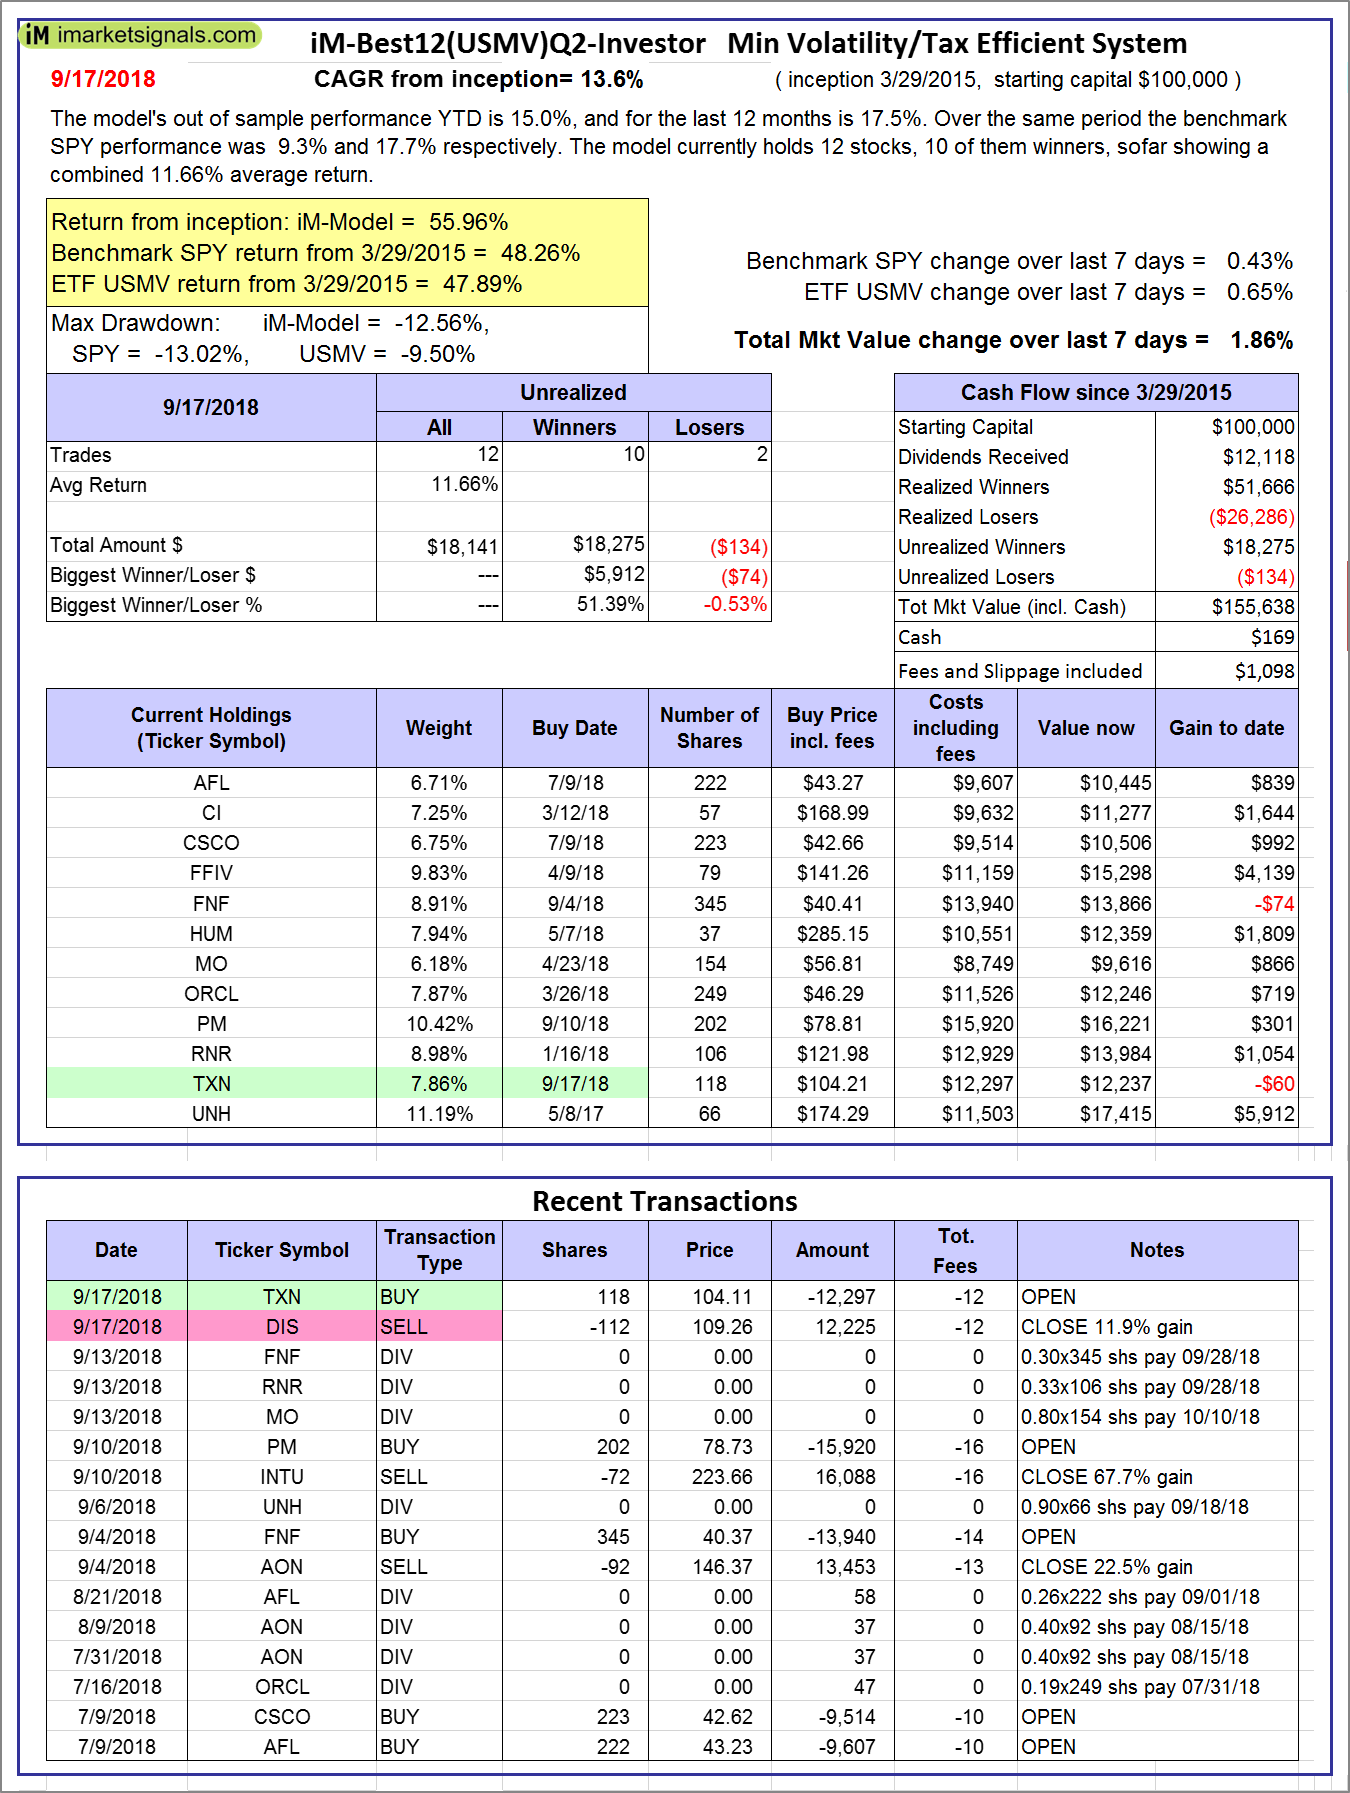 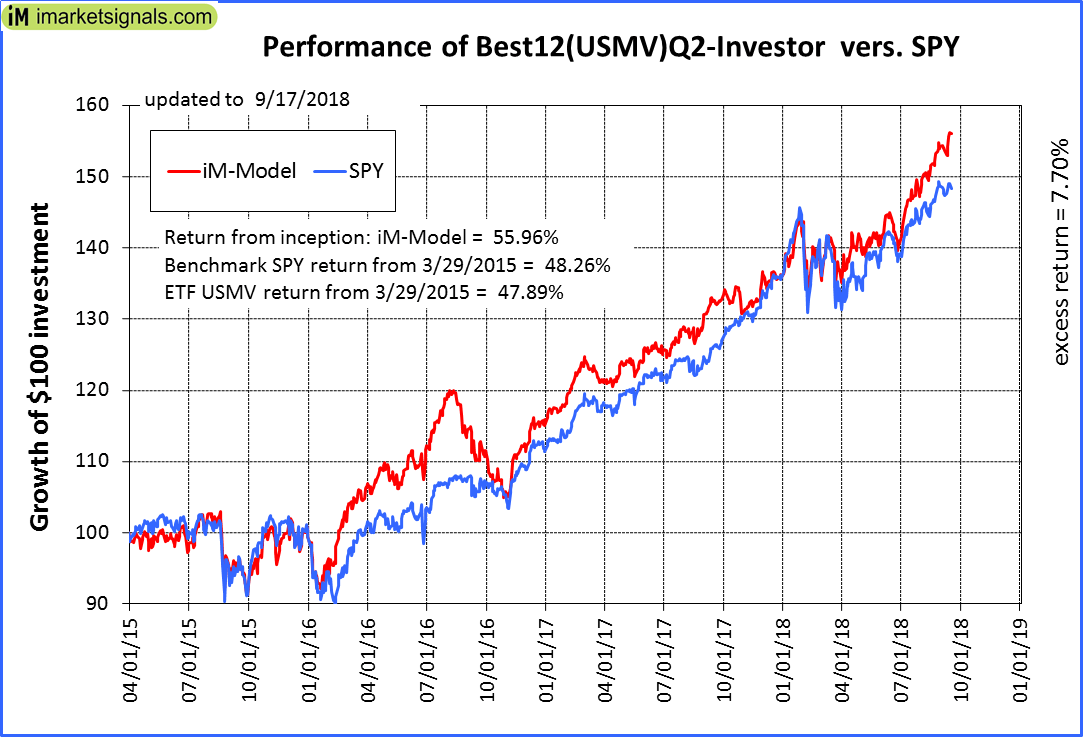 |
iM-Best12(USMV)Q2-Investor: The model’s out of sample performance YTD is 15.0%, and for the last 12 months is 17.5%. Over the same period the benchmark SPY performance was 9.3% and 17.7% respectively. Since inception, on 3/30/2015, the model gained 55.96% while the benchmark SPY gained 48.26% and the ETF USMV gained 47.89% over the same period. Over the previous week the market value of iM-Best12(USMV)Q2 gained 1.86% at a time when SPY gained 0.43%. A starting capital of $100,000 at inception on 3/30/2015 would have grown to $155,638 which includes $169 cash and excludes $1,098 spent on fees and slippage. |
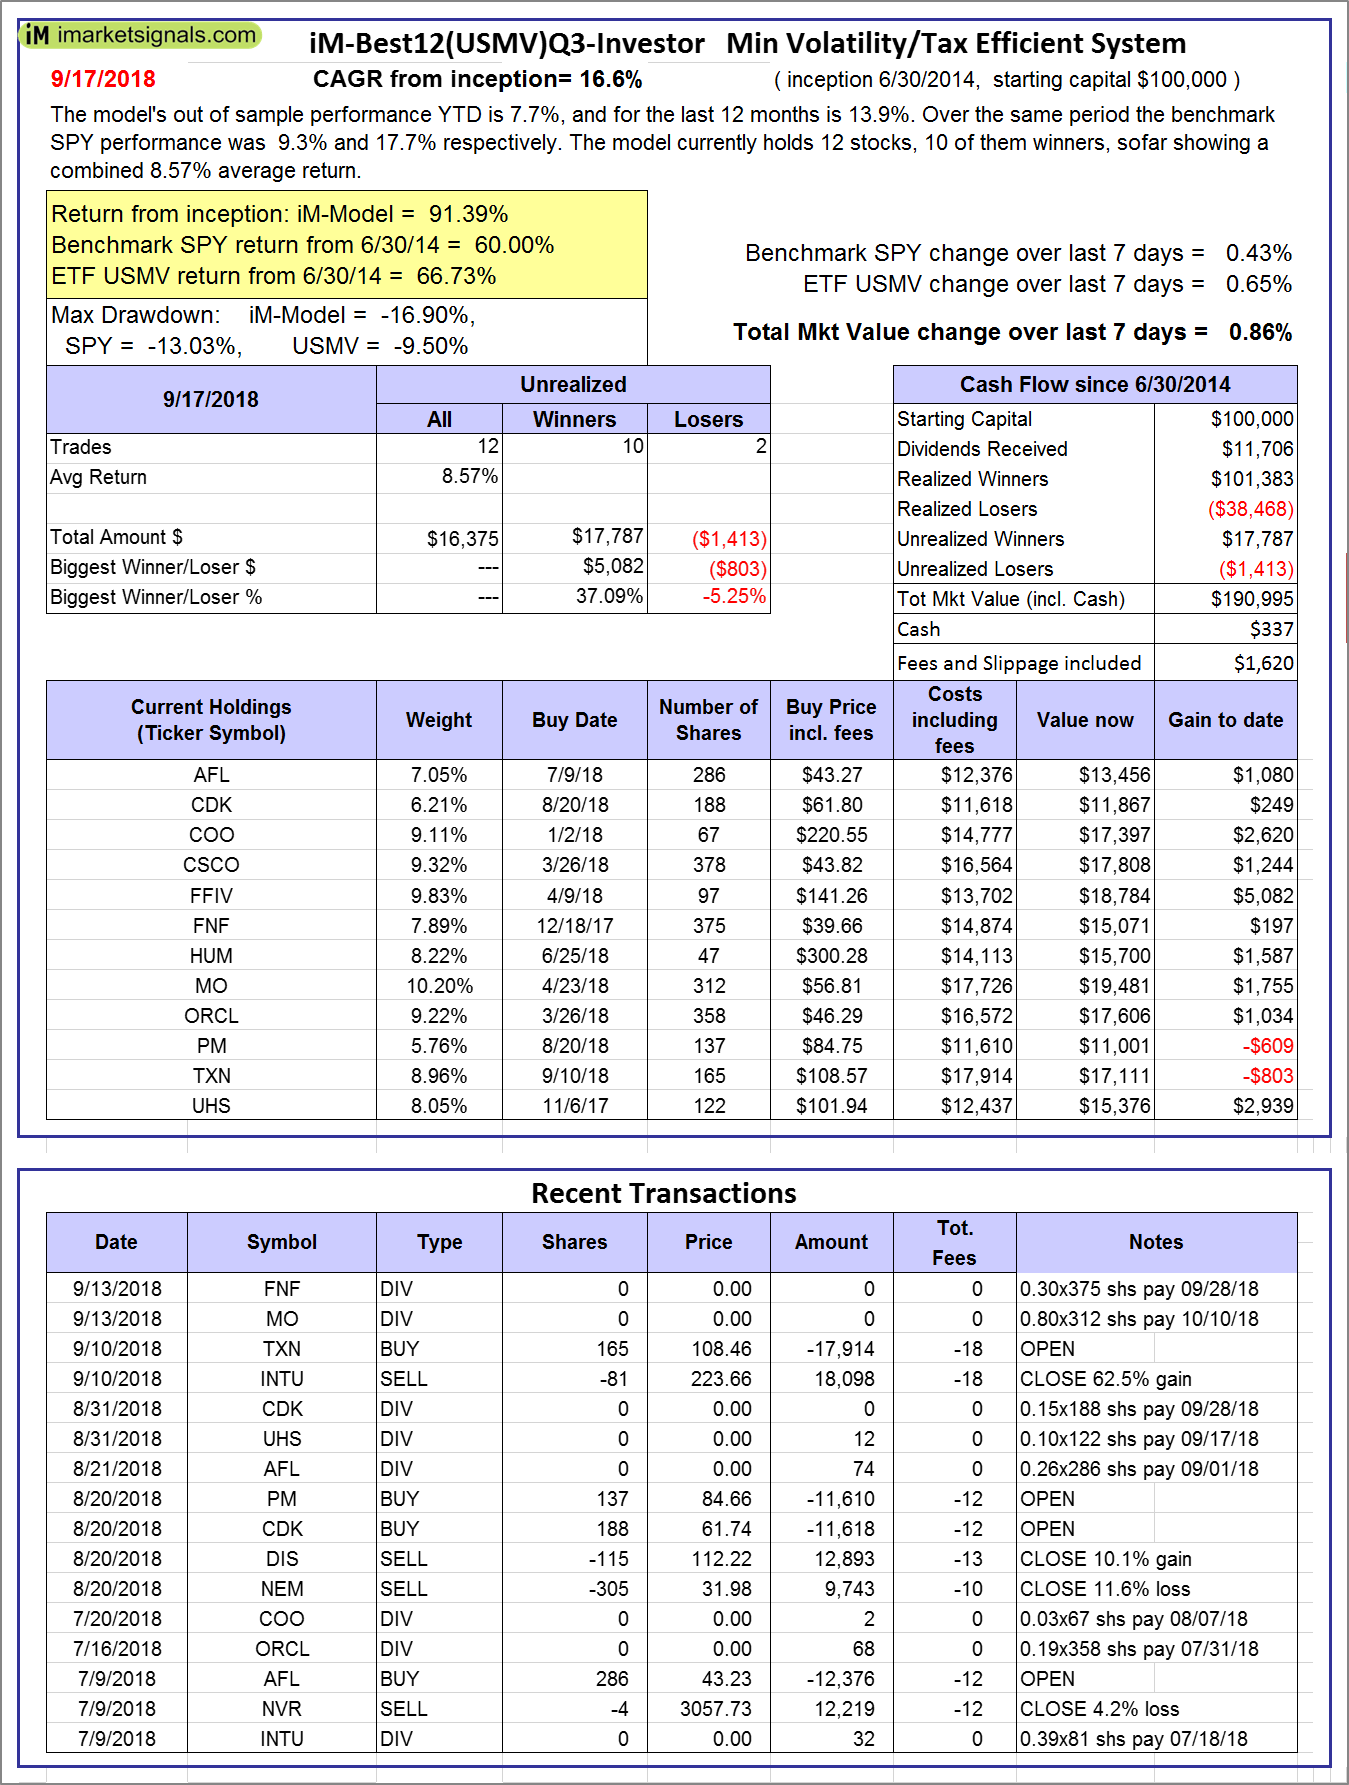 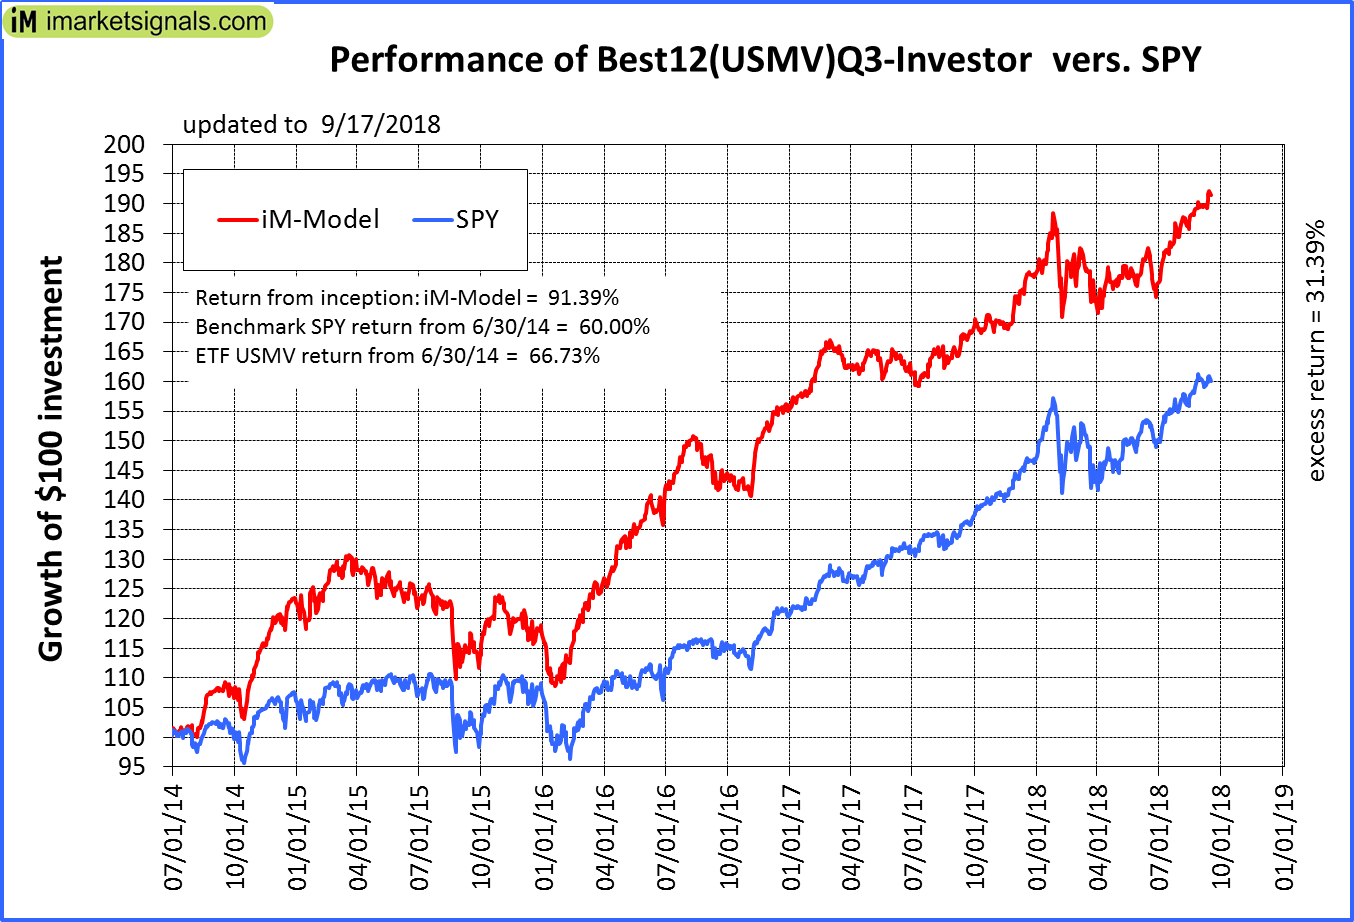 |
iM-Best12(USMV)Q3-Investor: The model’s out of sample performance YTD is 7.7%, and for the last 12 months is 13.9%. Over the same period the benchmark SPY performance was 9.3% and 17.7% respectively. Since inception, on 7/1/2014, the model gained 91.39% while the benchmark SPY gained 60.00% and the ETF USMV gained 66.73% over the same period. Over the previous week the market value of iM-Best12(USMV)Q3 gained 0.86% at a time when SPY gained 0.43%. A starting capital of $100,000 at inception on 7/1/2014 would have grown to $190,995 which includes $337 cash and excludes $1,620 spent on fees and slippage. |
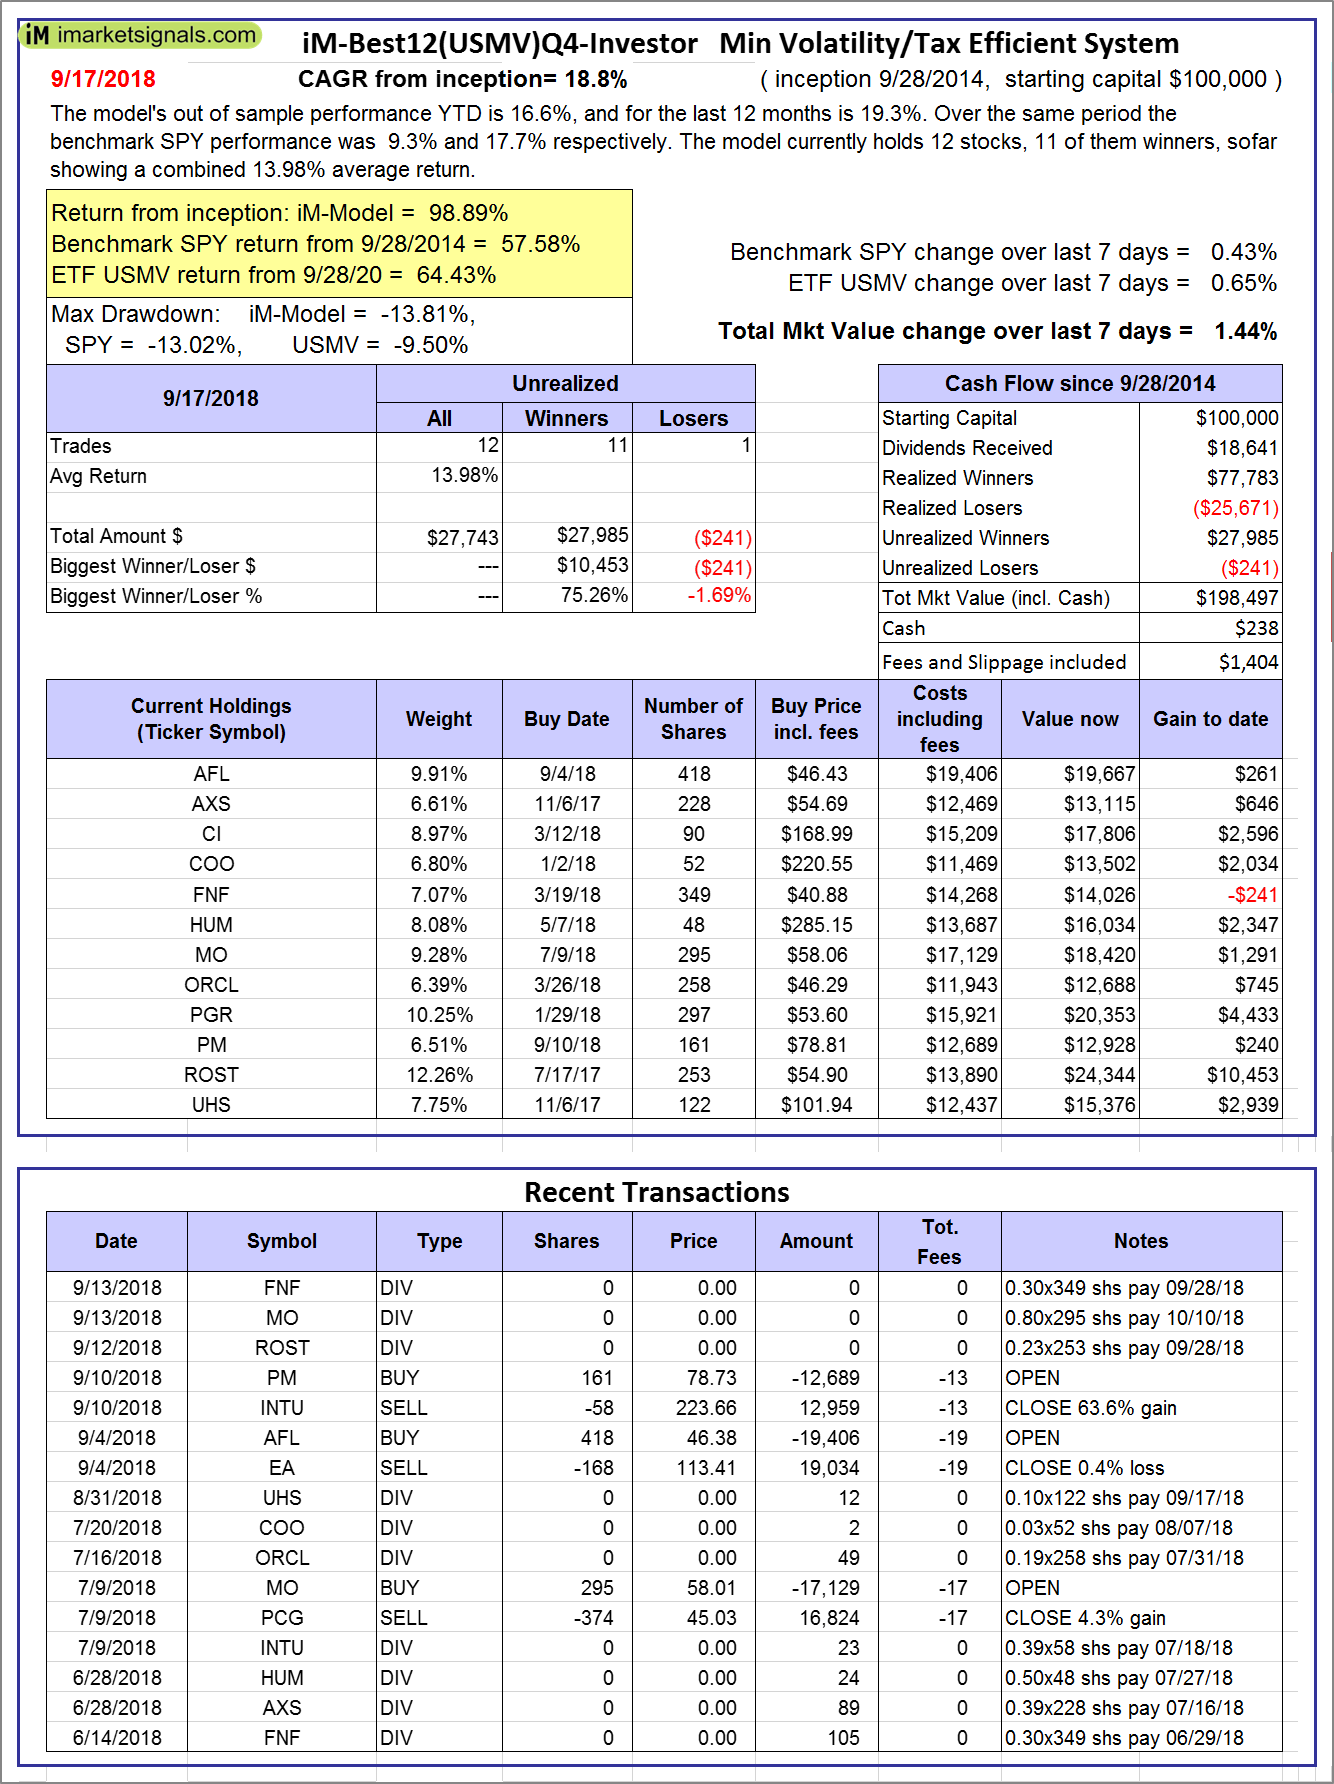 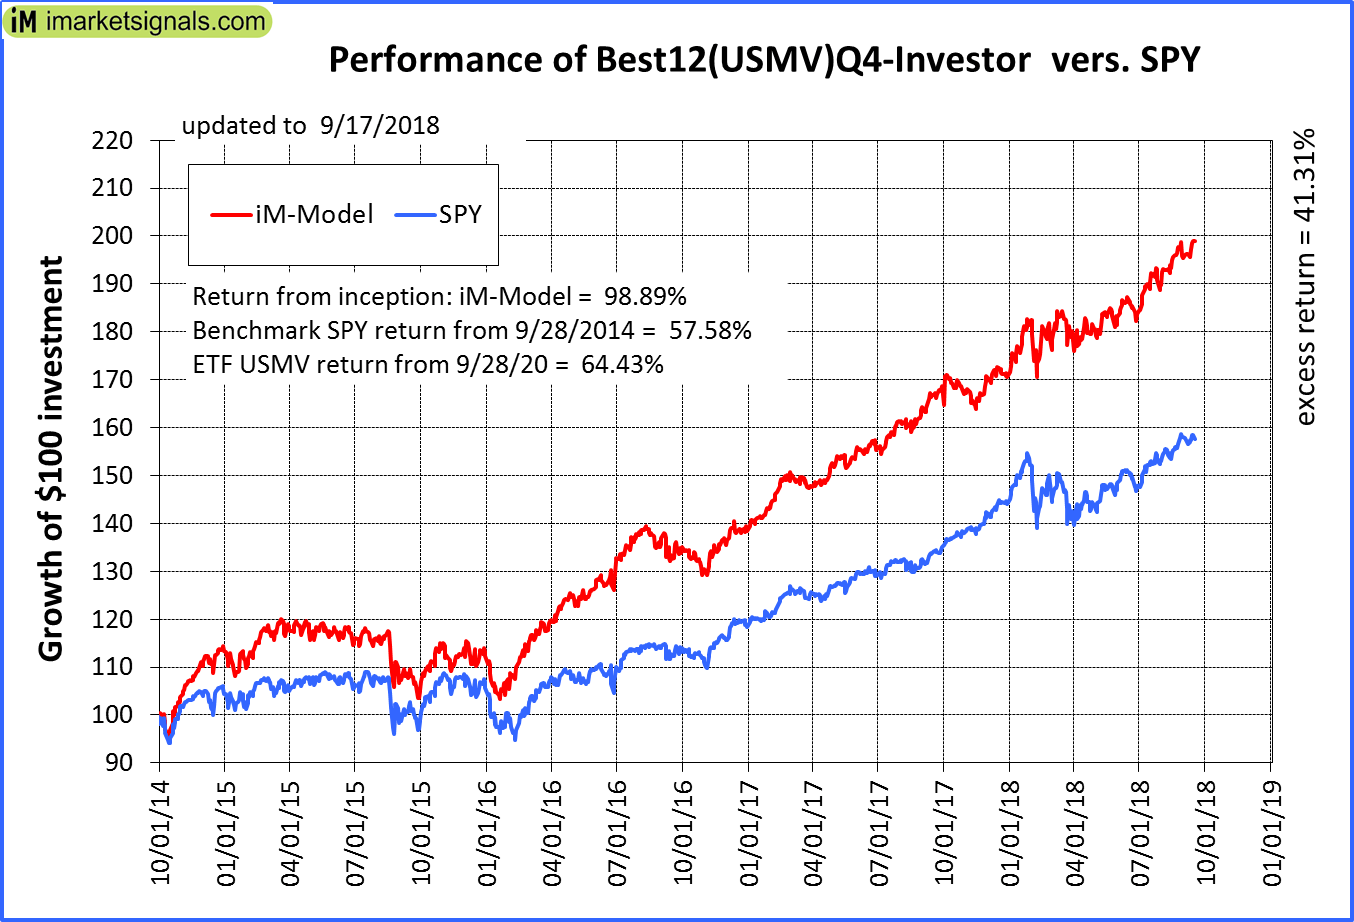 |
iM-Best12(USMV)Q4-Investor: Since inception, on 9/29/2014, the model gained 98.89% while the benchmark SPY gained 57.58% and the ETF USMV gained 64.43% over the same period. Over the previous week the market value of iM-Best12(USMV)Q4 gained 1.44% at a time when SPY gained 0.43%. A starting capital of $100,000 at inception on 9/29/2014 would have grown to $198,497 which includes $238 cash and excludes $1,404 spent on fees and slippage. |
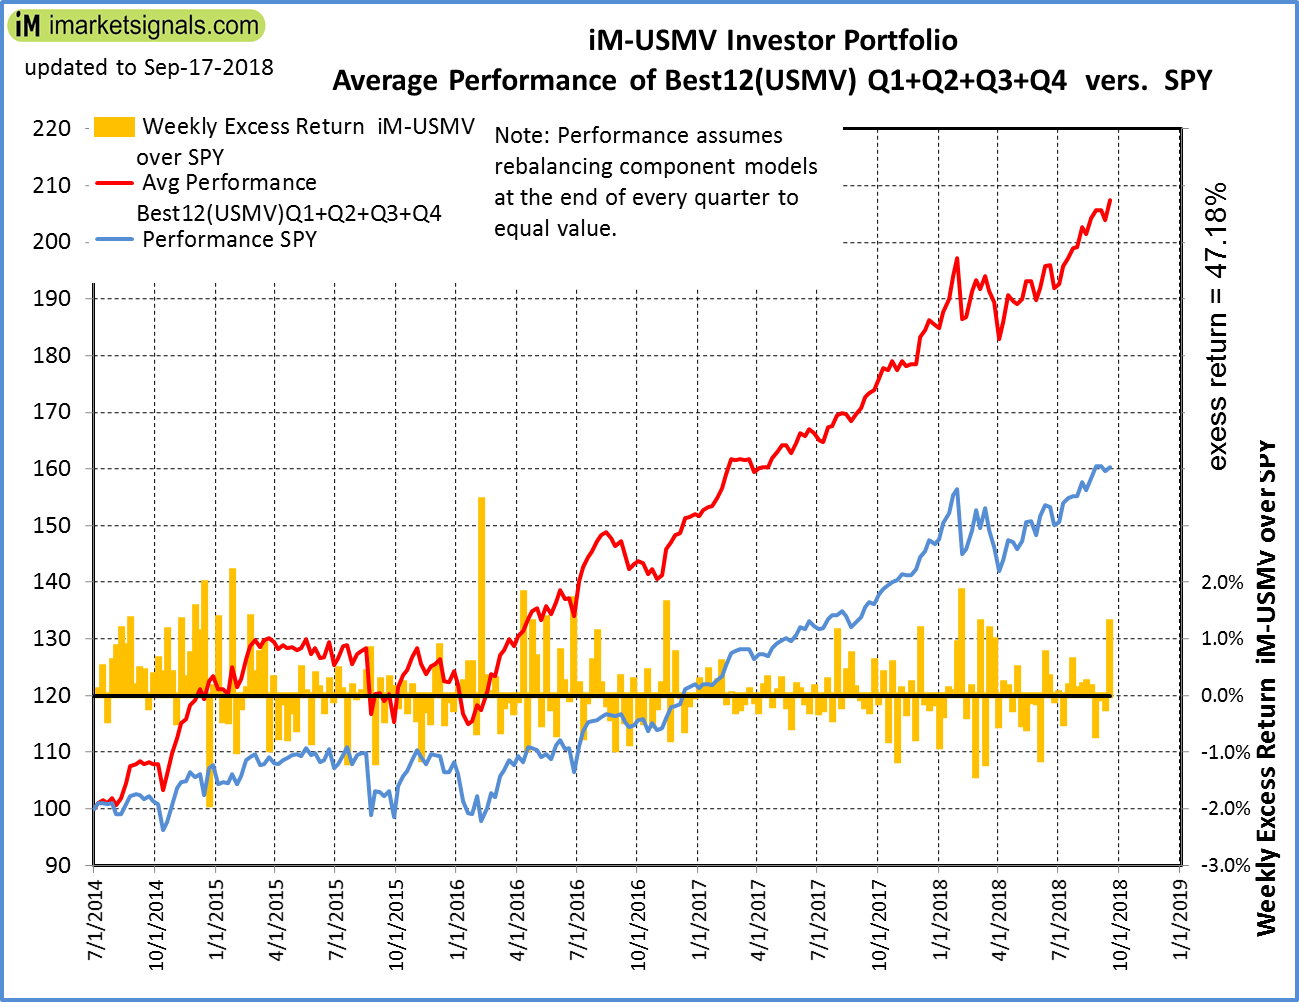 |
Average Performance of iM-Best12(USMV)Q1+Q2+Q3+Q4-Investor resulted in an excess return of 47.18% over SPY. (see iM-USMV Investor Portfolio) |
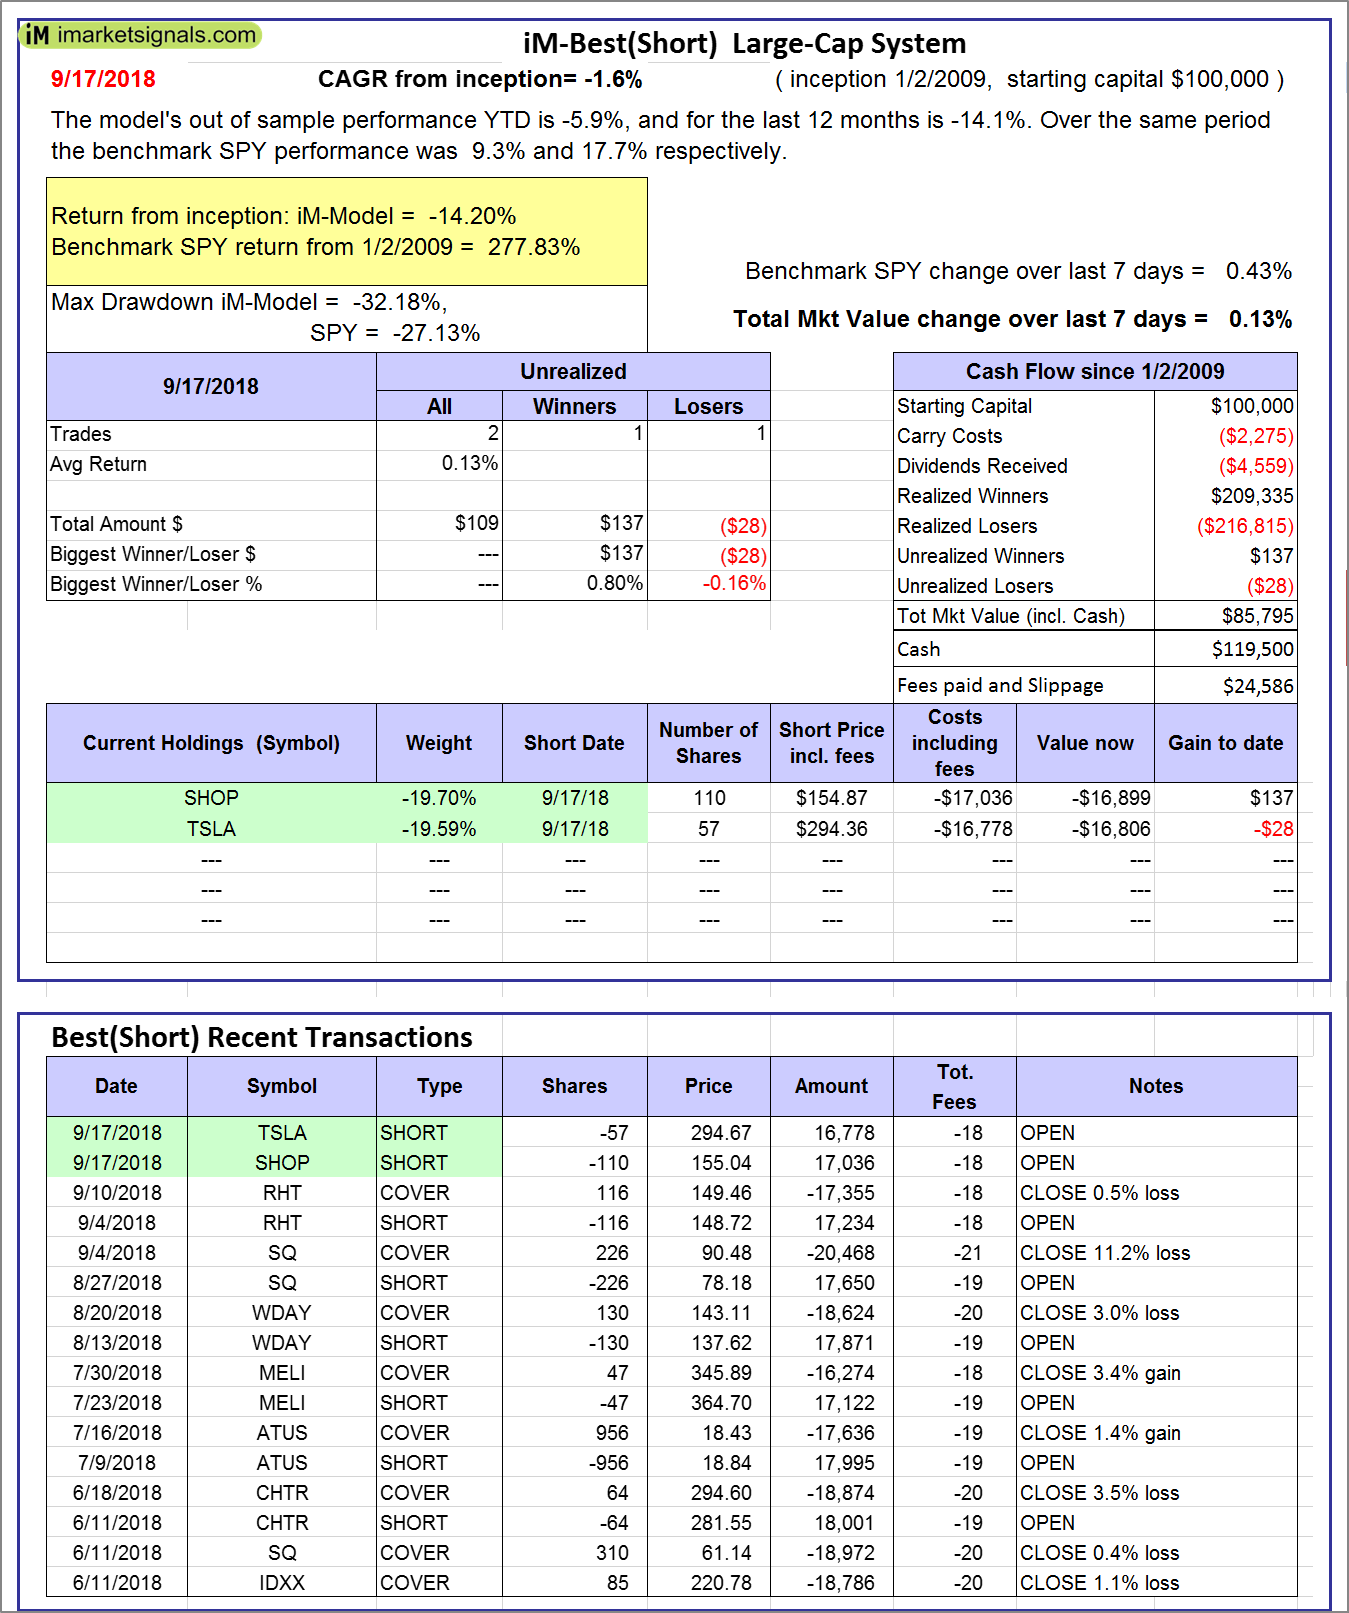 |
iM-Best(Short): The model’s out of sample performance YTD is -5.9%, and for the last 12 months is -14.1%. Over the same period the benchmark SPY performance was 9.3% and 17.7% respectively. Over the previous week the market value of iM-Best(Short) gained 0.13% at a time when SPY gained 0.43%. Over the period 1/2/2009 to 9/17/2018 the starting capital of $100,000 would have grown to $85,795 which includes $119,500 cash and excludes $24,586 spent on fees and slippage. |
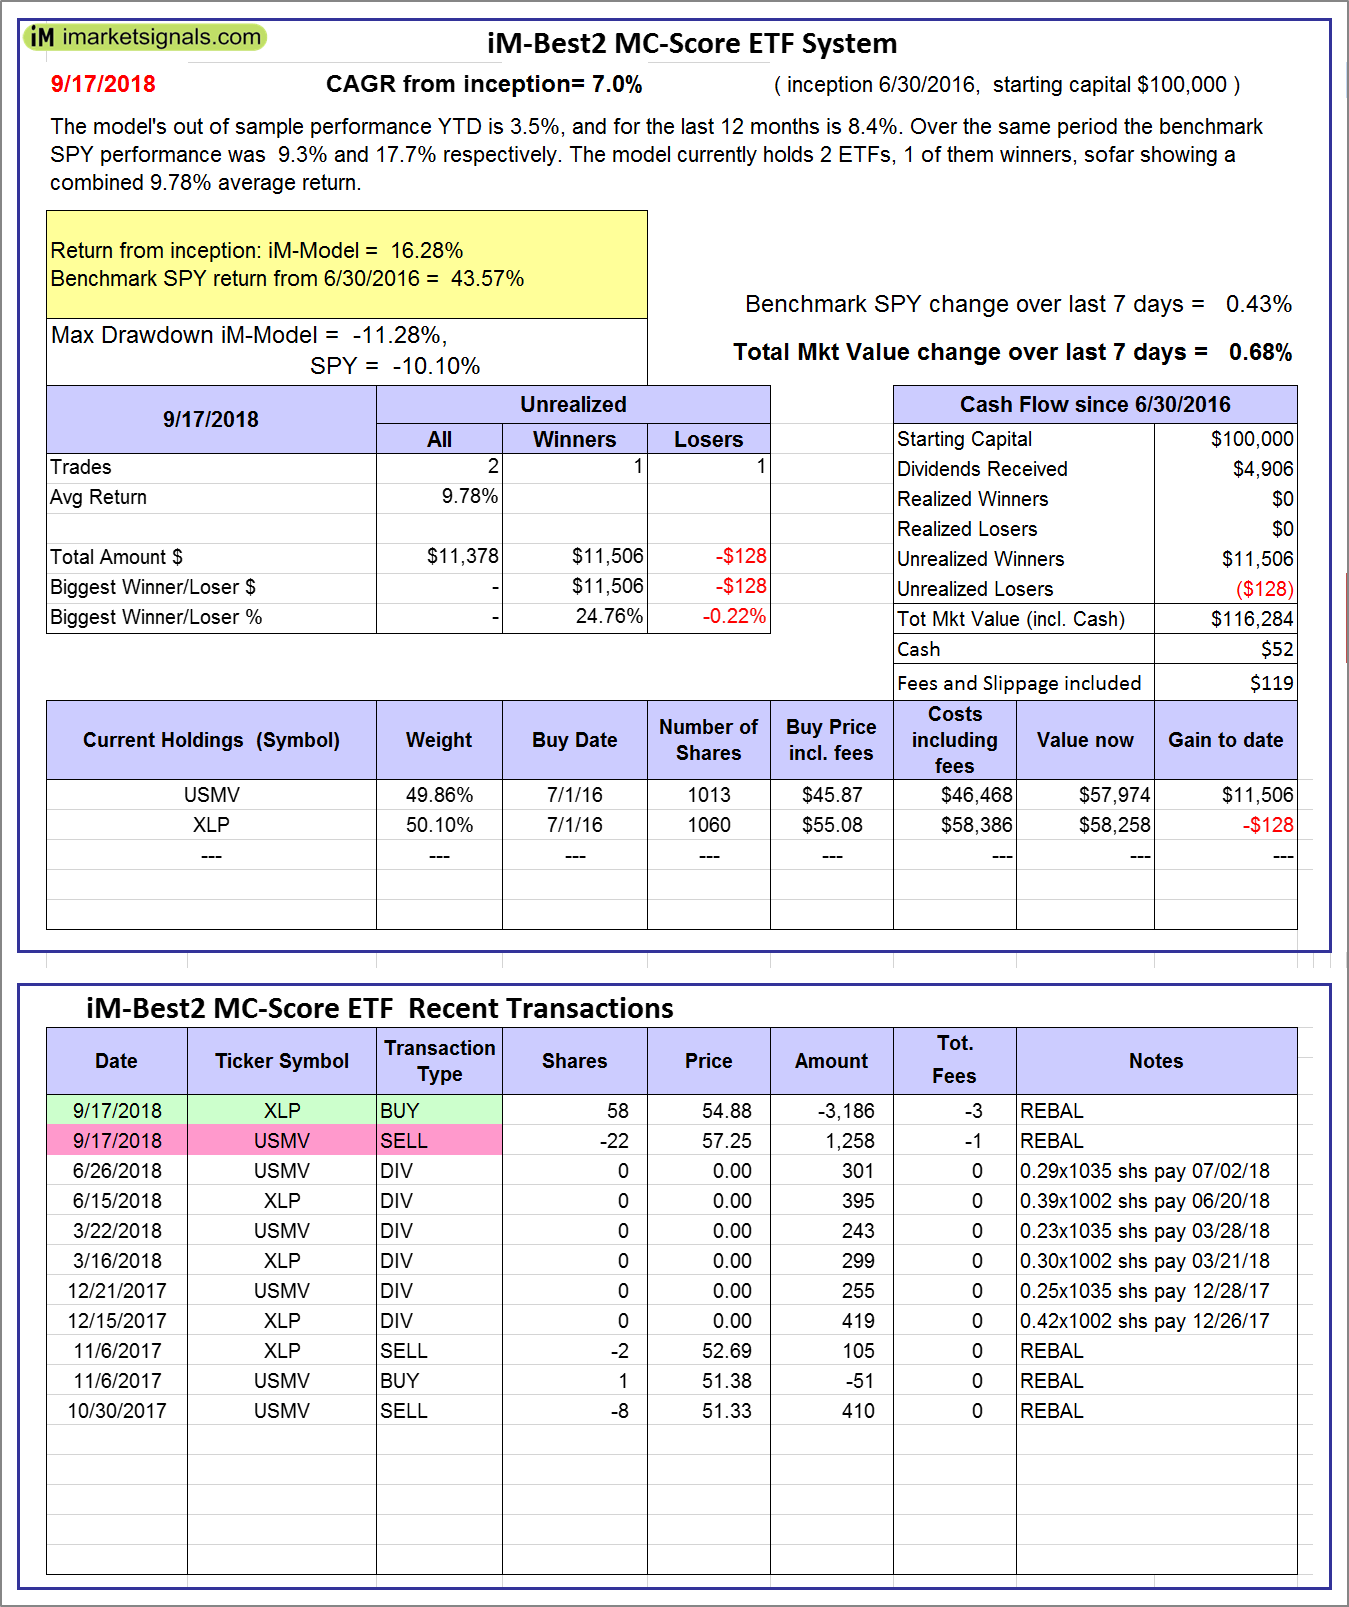 |
iM-Best2 MC-Score ETF System: The model’s out of sample performance YTD is 3.5%, and for the last 12 months is 8.4%. Over the same period the benchmark SPY performance was 9.3% and 17.7% respectively. Over the previous week the market value of the iM-Best2 MC-Score ETF System gained 0.68% at a time when SPY gained 0.43%. A starting capital of $100,000 at inception on 6/30/2016 would have grown to $116,284 which includes $52 cash and excludes $119 spent on fees and slippage. |
 |
iM-Best4 MC-Score Vanguard System: The model’s out of sample performance YTD is 2.6%, and for the last 12 months is 4.8%. Over the same period the benchmark SPY performance was 9.3% and 17.7% respectively. Over the previous week the market value of the iM-Best4 MC-Score Vanguard System gained 0.45% at a time when SPY gained 0.43%. A starting capital of $100,000 at inception on 6/30/2016 would have grown to $42,551 which includes -$66,433 cash and excludes $00 spent on fees and slippage. |
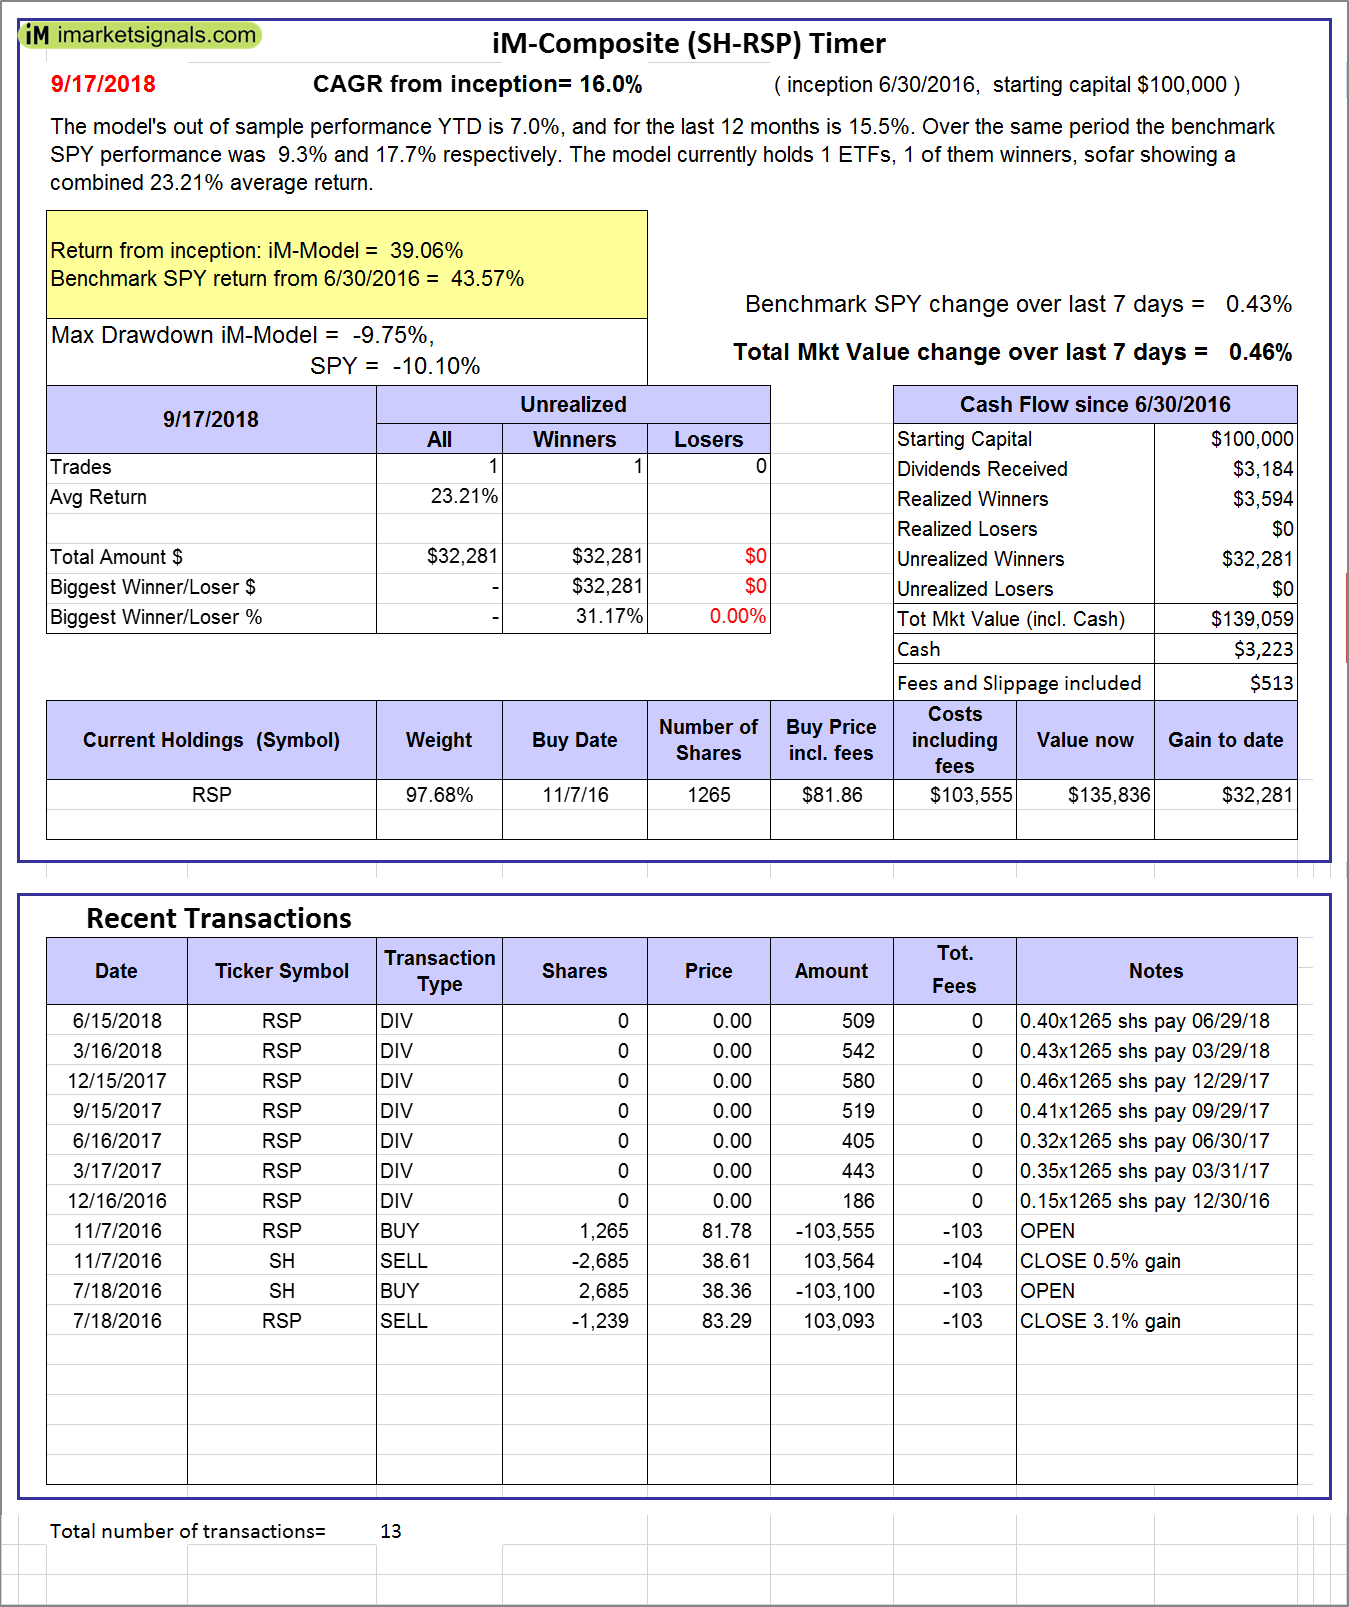 |
iM-Composite (SH-RSP) Timer: The model’s out of sample performance YTD is 7.0%, and for the last 12 months is 15.5%. Over the same period the benchmark SPY performance was 9.3% and 17.7% respectively. Over the previous week the market value of the iM-Composite (SH-RSP) Timer gained 0.46% at a time when SPY gained 0.43%. A starting capital of $100,000 at inception on 6/30/2016 would have grown to $139,059 which includes $3,223 cash and excludes $513 spent on fees and slippage. |
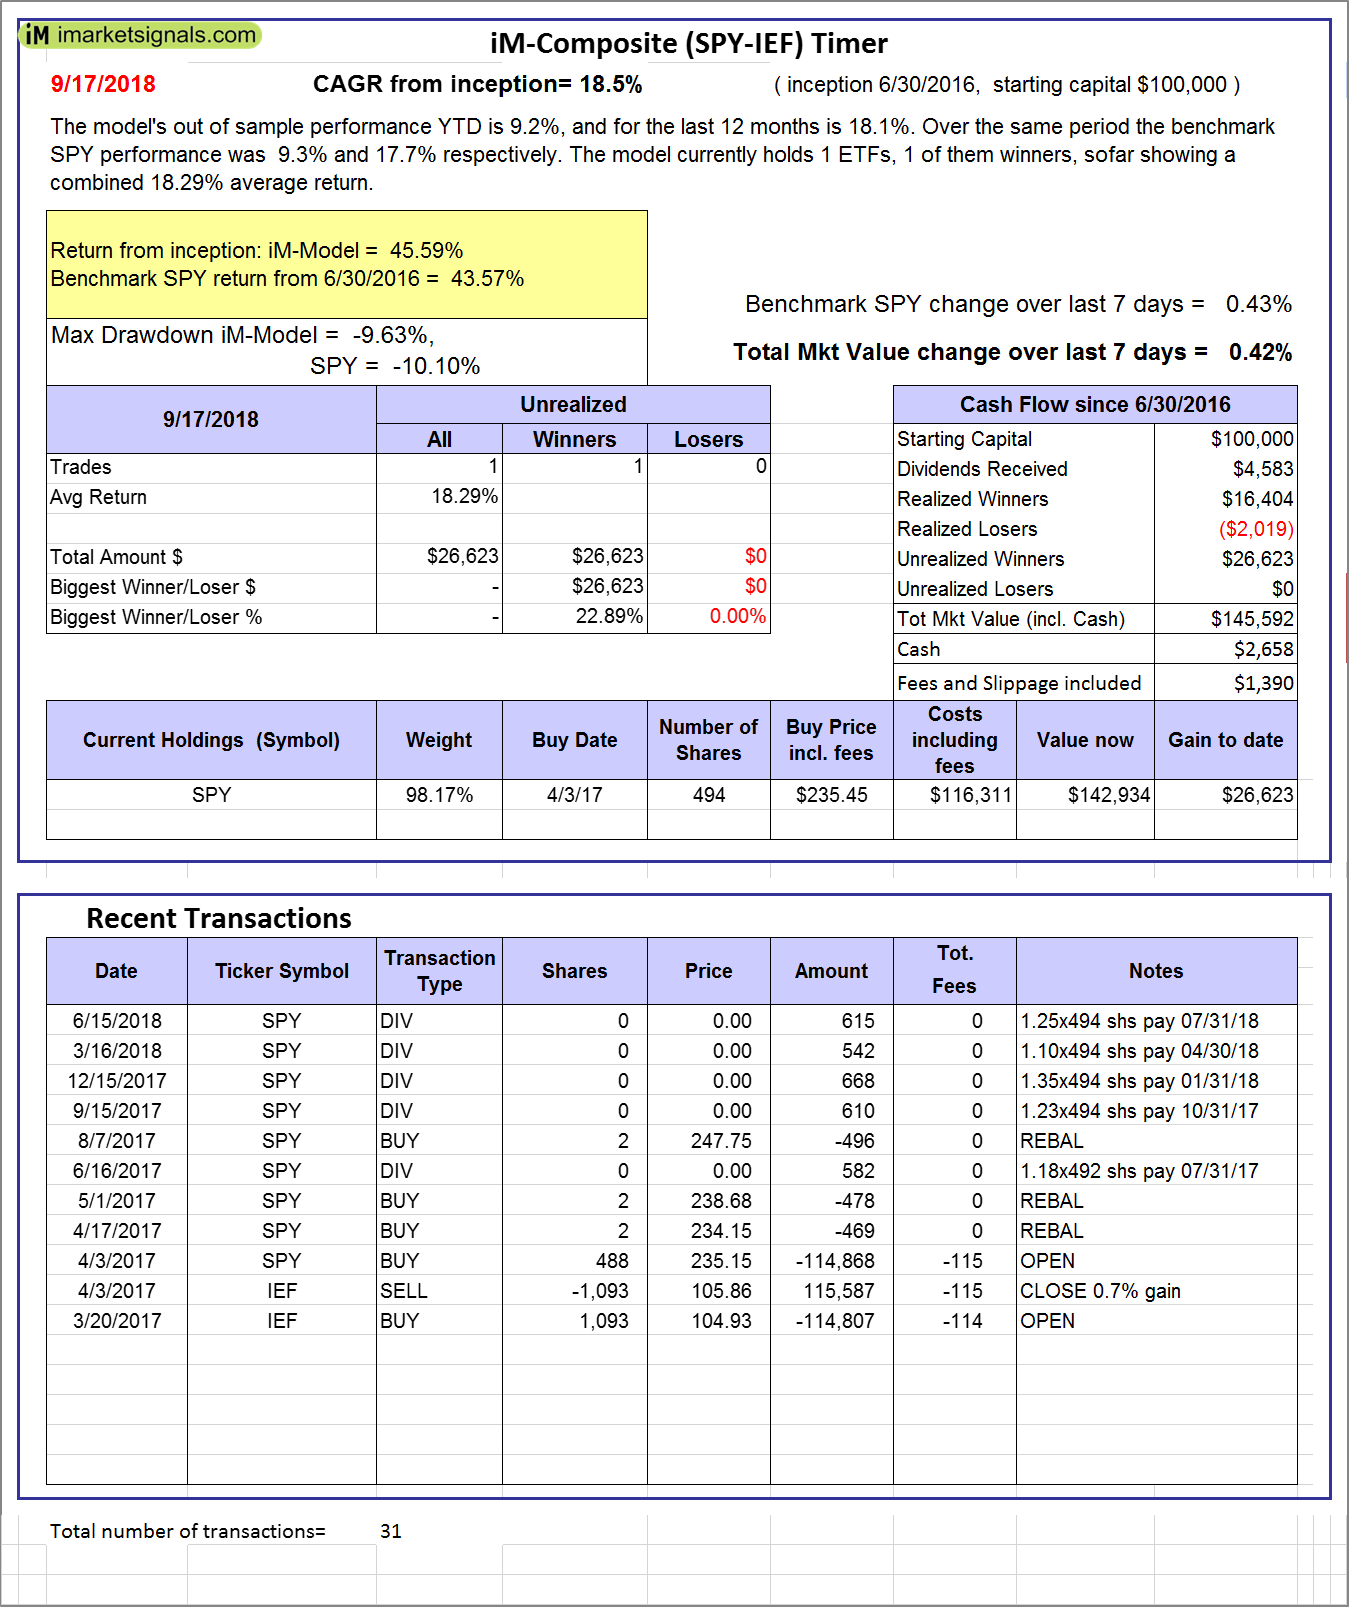 |
iM-Composite (SPY-IEF) Timer: The model’s out of sample performance YTD is 9.2%, and for the last 12 months is 18.1%. Over the same period the benchmark SPY performance was 9.3% and 17.7% respectively. Over the previous week the market value of the iM-Composite (SPY-IEF) Timer gained 0.42% at a time when SPY gained 0.43%. A starting capital of $100,000 at inception on 6/30/2016 would have grown to $145,592 which includes $2,658 cash and excludes $1,390 spent on fees and slippage. |
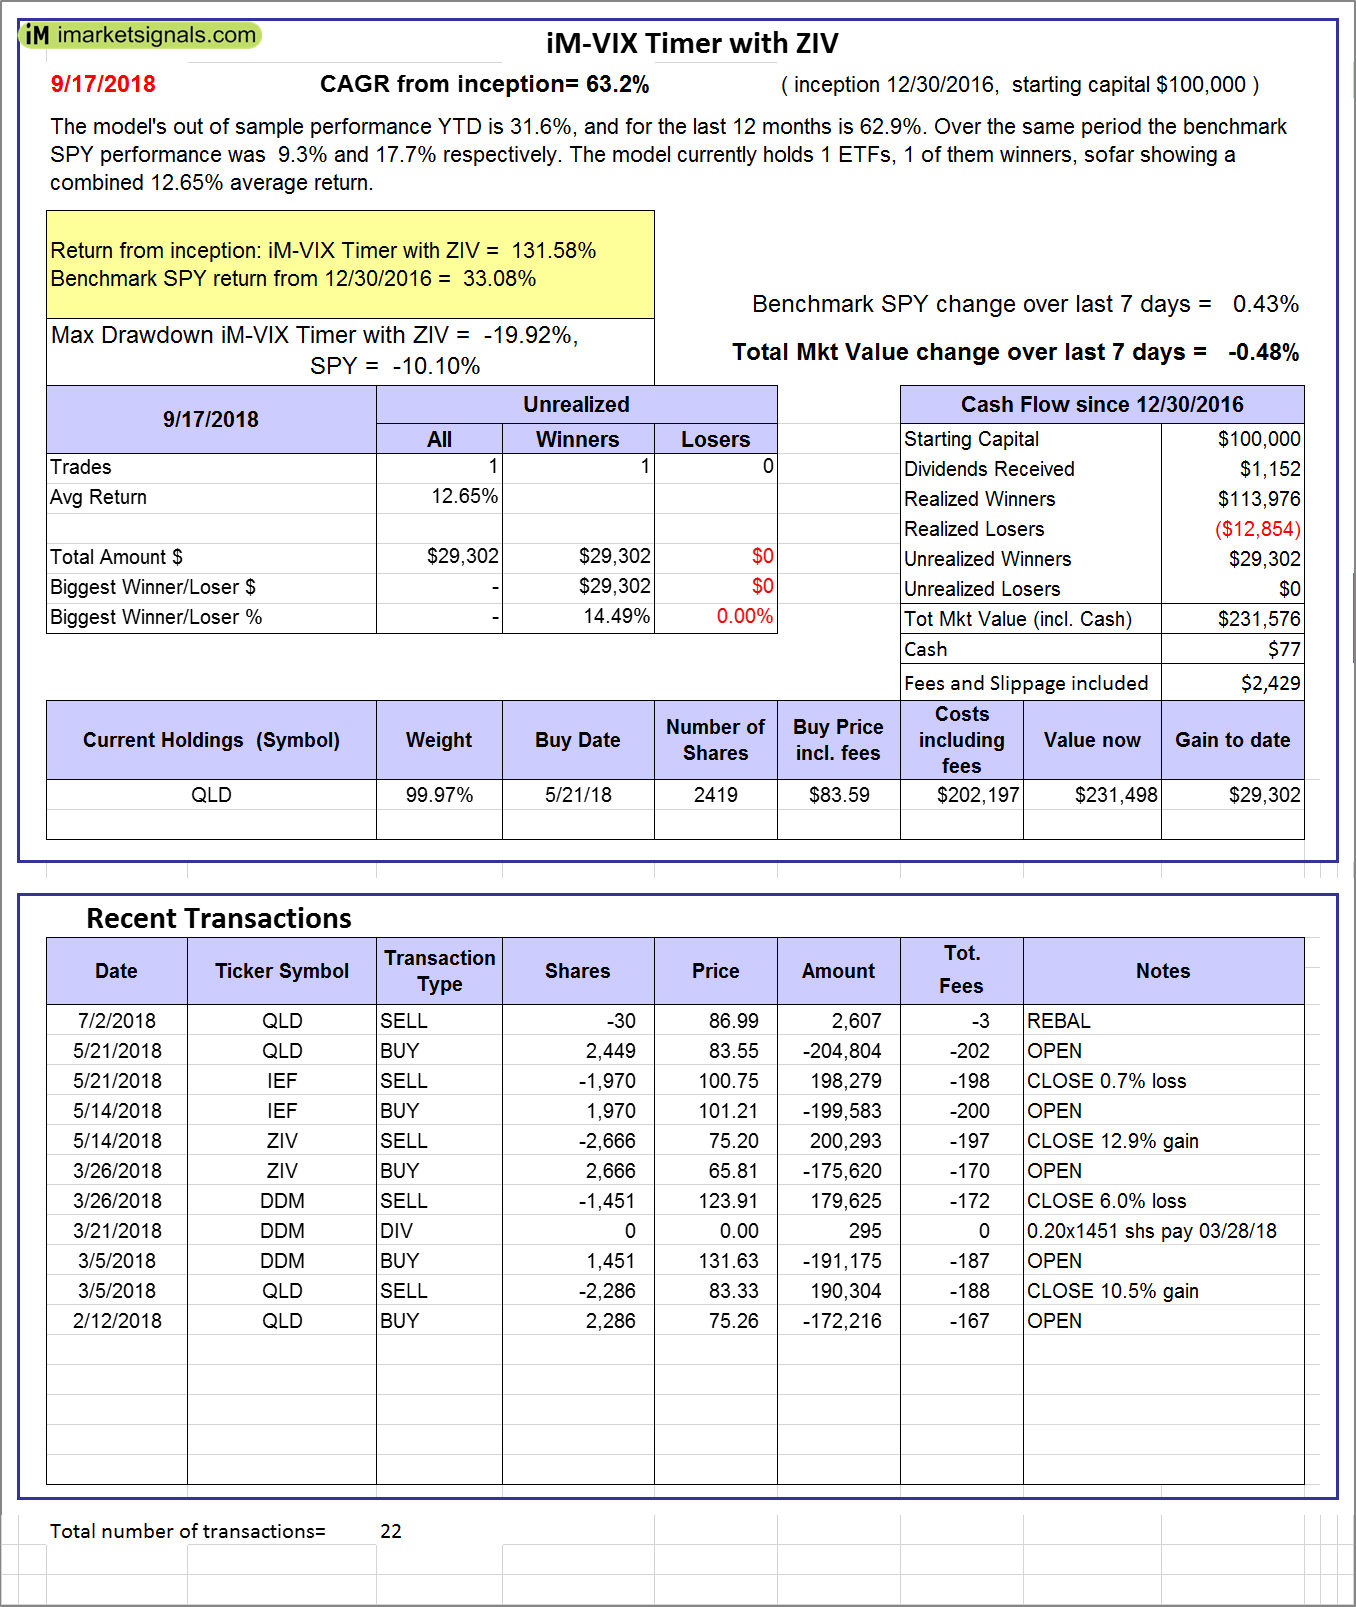 |
iM-VIX Timer with ZIV: The model’s out of sample performance YTD is 31.6%, and for the last 12 months is 62.9%. Over the same period the benchmark SPY performance was 9.3% and 17.7% respectively. Over the previous week the market value of the iM-VIX Timer with ZIV gained -0.48% at a time when SPY gained 0.43%. A starting capital of $100,000 at inception on 6/30/2016 would have grown to $231,576 which includes $77 cash and excludes $2,429 spent on fees and slippage. |
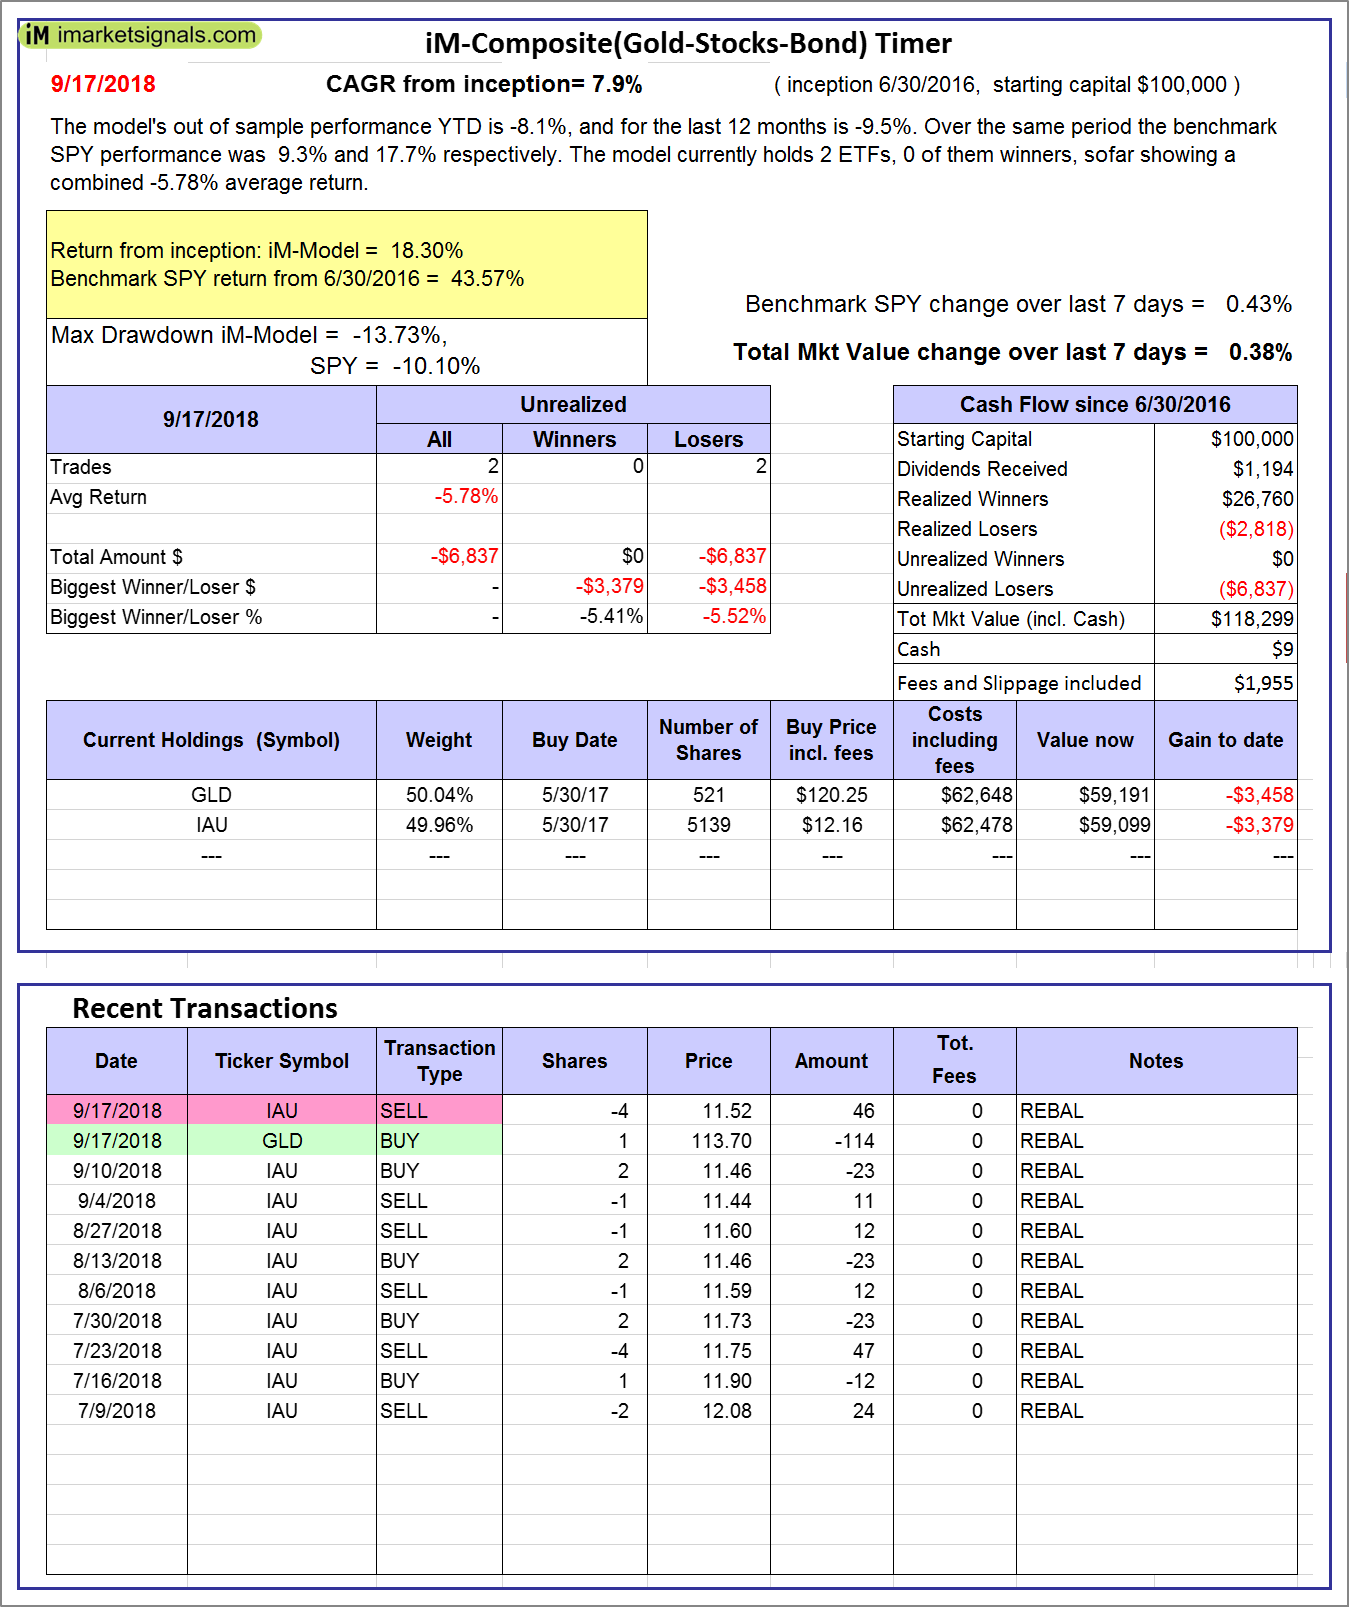 |
iM-Composite(Gold-Stocks-Bond) Timer: The model’s out of sample performance YTD is -8.1%, and for the last 12 months is -9.5%. Over the same period the benchmark SPY performance was 9.3% and 17.7% respectively. Over the previous week the market value of the iM-Composite(Gold-Stocks-Bond) Timer gained 0.38% at a time when SPY gained 0.43%. A starting capital of $100,000 at inception on 6/30/2016 would have grown to $118,299 which includes $9 cash and excludes $1,955 spent on fees and slippage. |
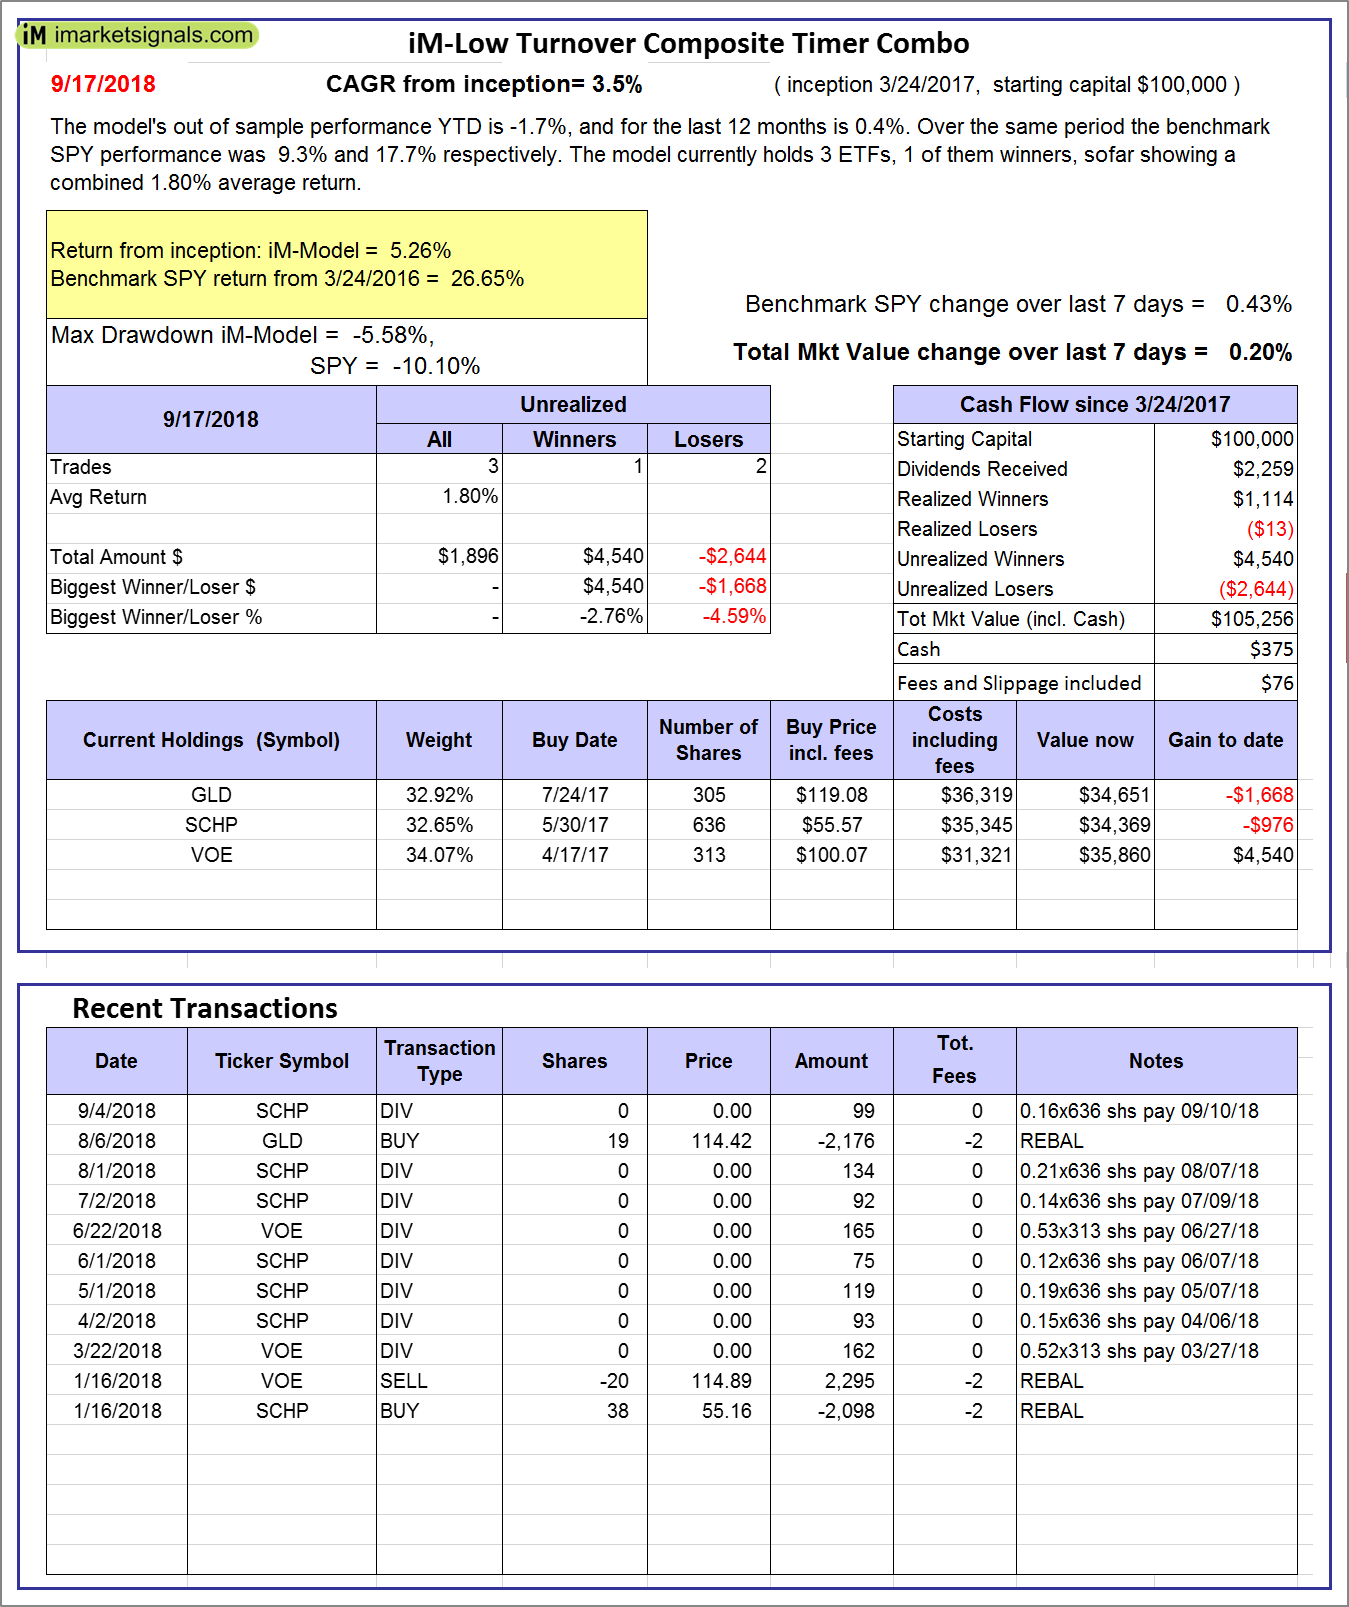 |
iM-Low Turnover Composite Timer Combo: The model’s out of sample performance YTD is -1.7%, and for the last 12 months is 0.4%. Over the same period the benchmark SPY performance was 9.3% and 17.7% respectively. Over the previous week the market value of the iM-Low Turnover Composite Timer Combo gained 0.20% at a time when SPY gained 0.43%. A starting capital of $100,000 at inception on 3/24/27 would have grown to $105,256 which includes $375 cash and excludes $76 spent on fees and slippage. |
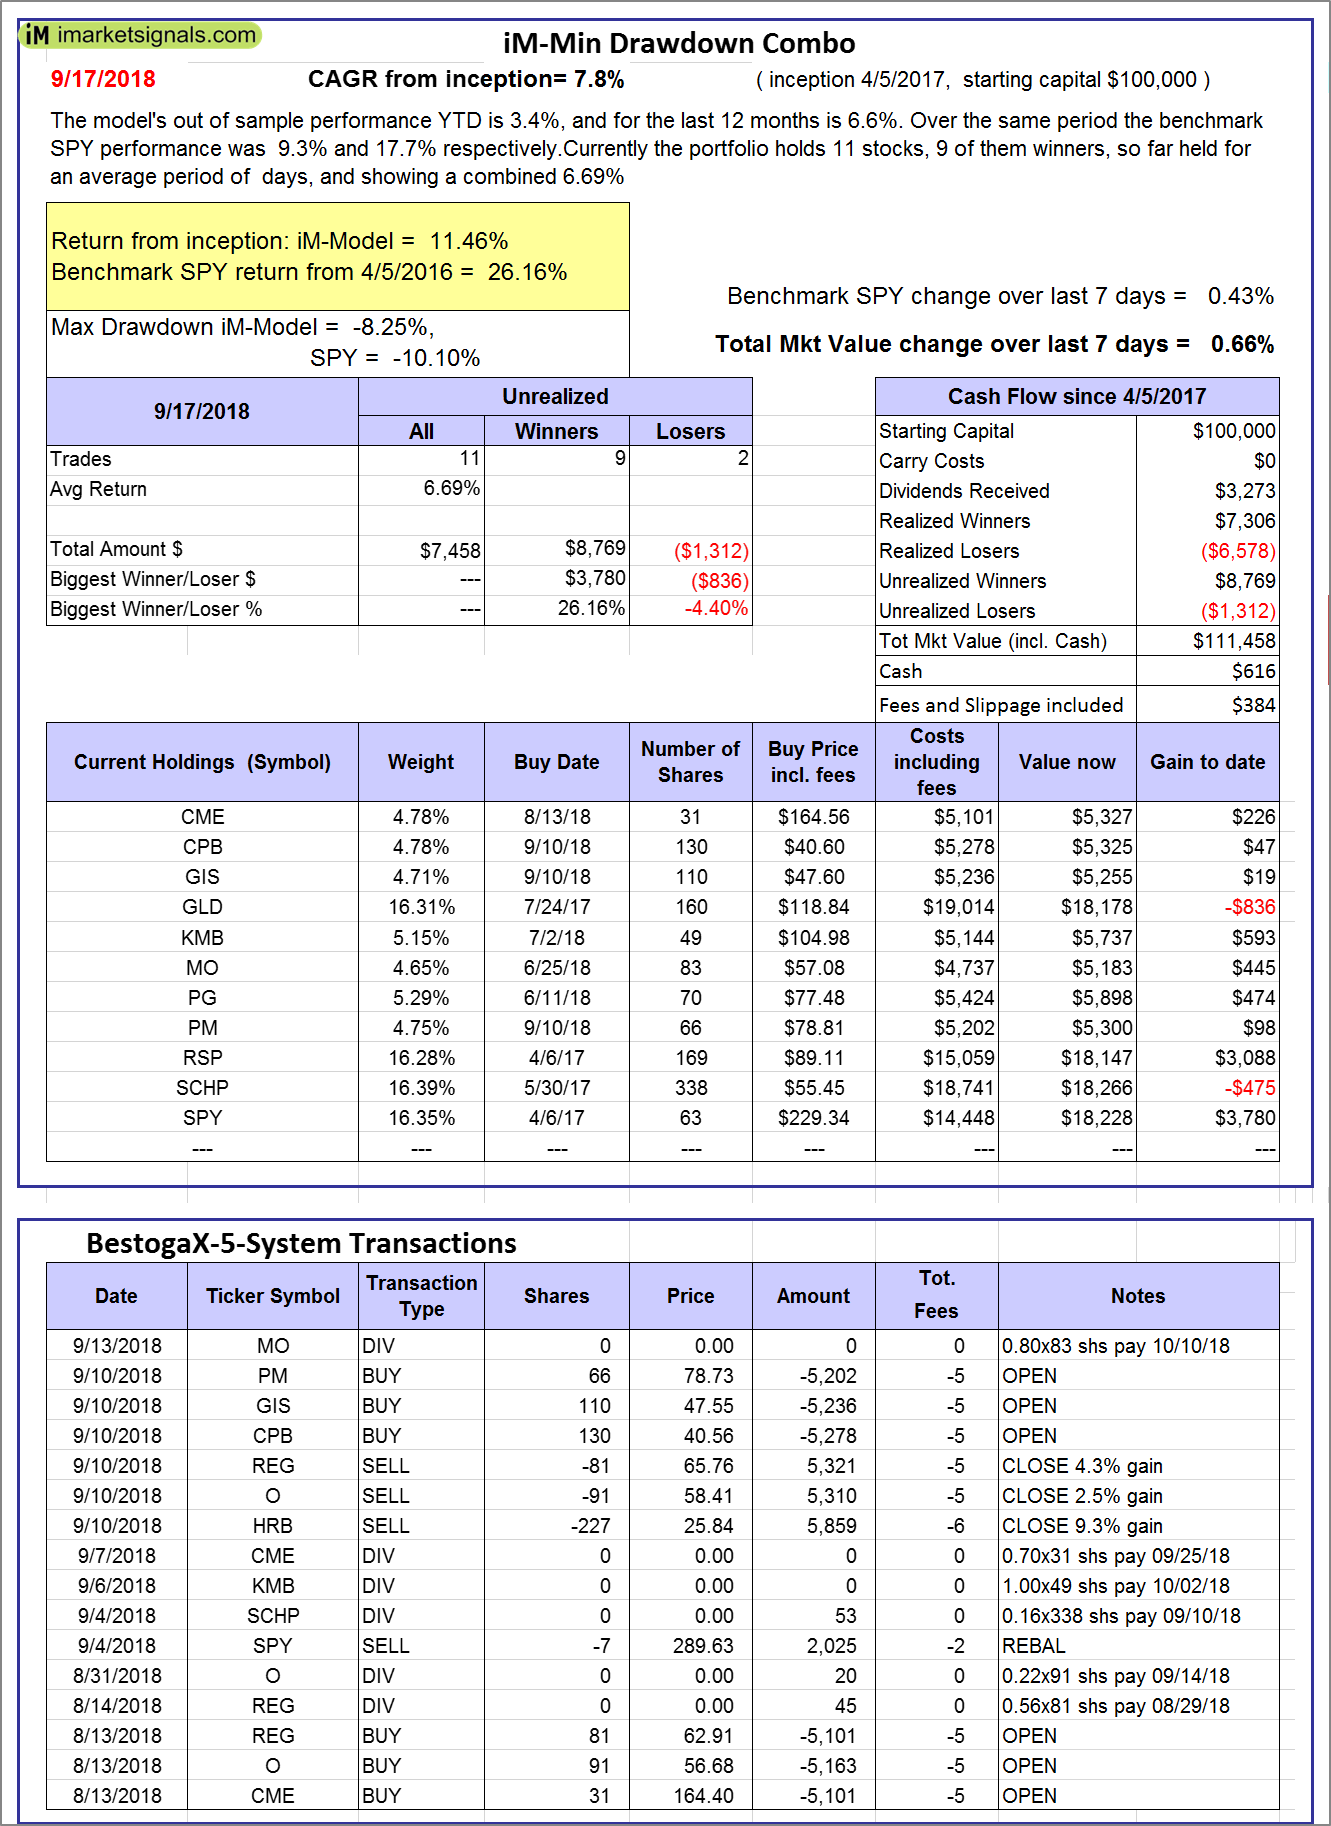 |
iM-Min Drawdown Combo: The model’s out of sample performance YTD is 3.4%, and for the last 12 months is 6.6%. Over the same period the benchmark SPY performance was 9.3% and 17.7% respectively. Over the previous week the market value of the iM-Min Drawdown Combo gained 0.66% at a time when SPY gained 0.43%. A starting capital of $100,000 at inception on 4/5/2017 would have grown to $111,458 which includes $616 cash and excludes $384 spent on fees and slippage. |
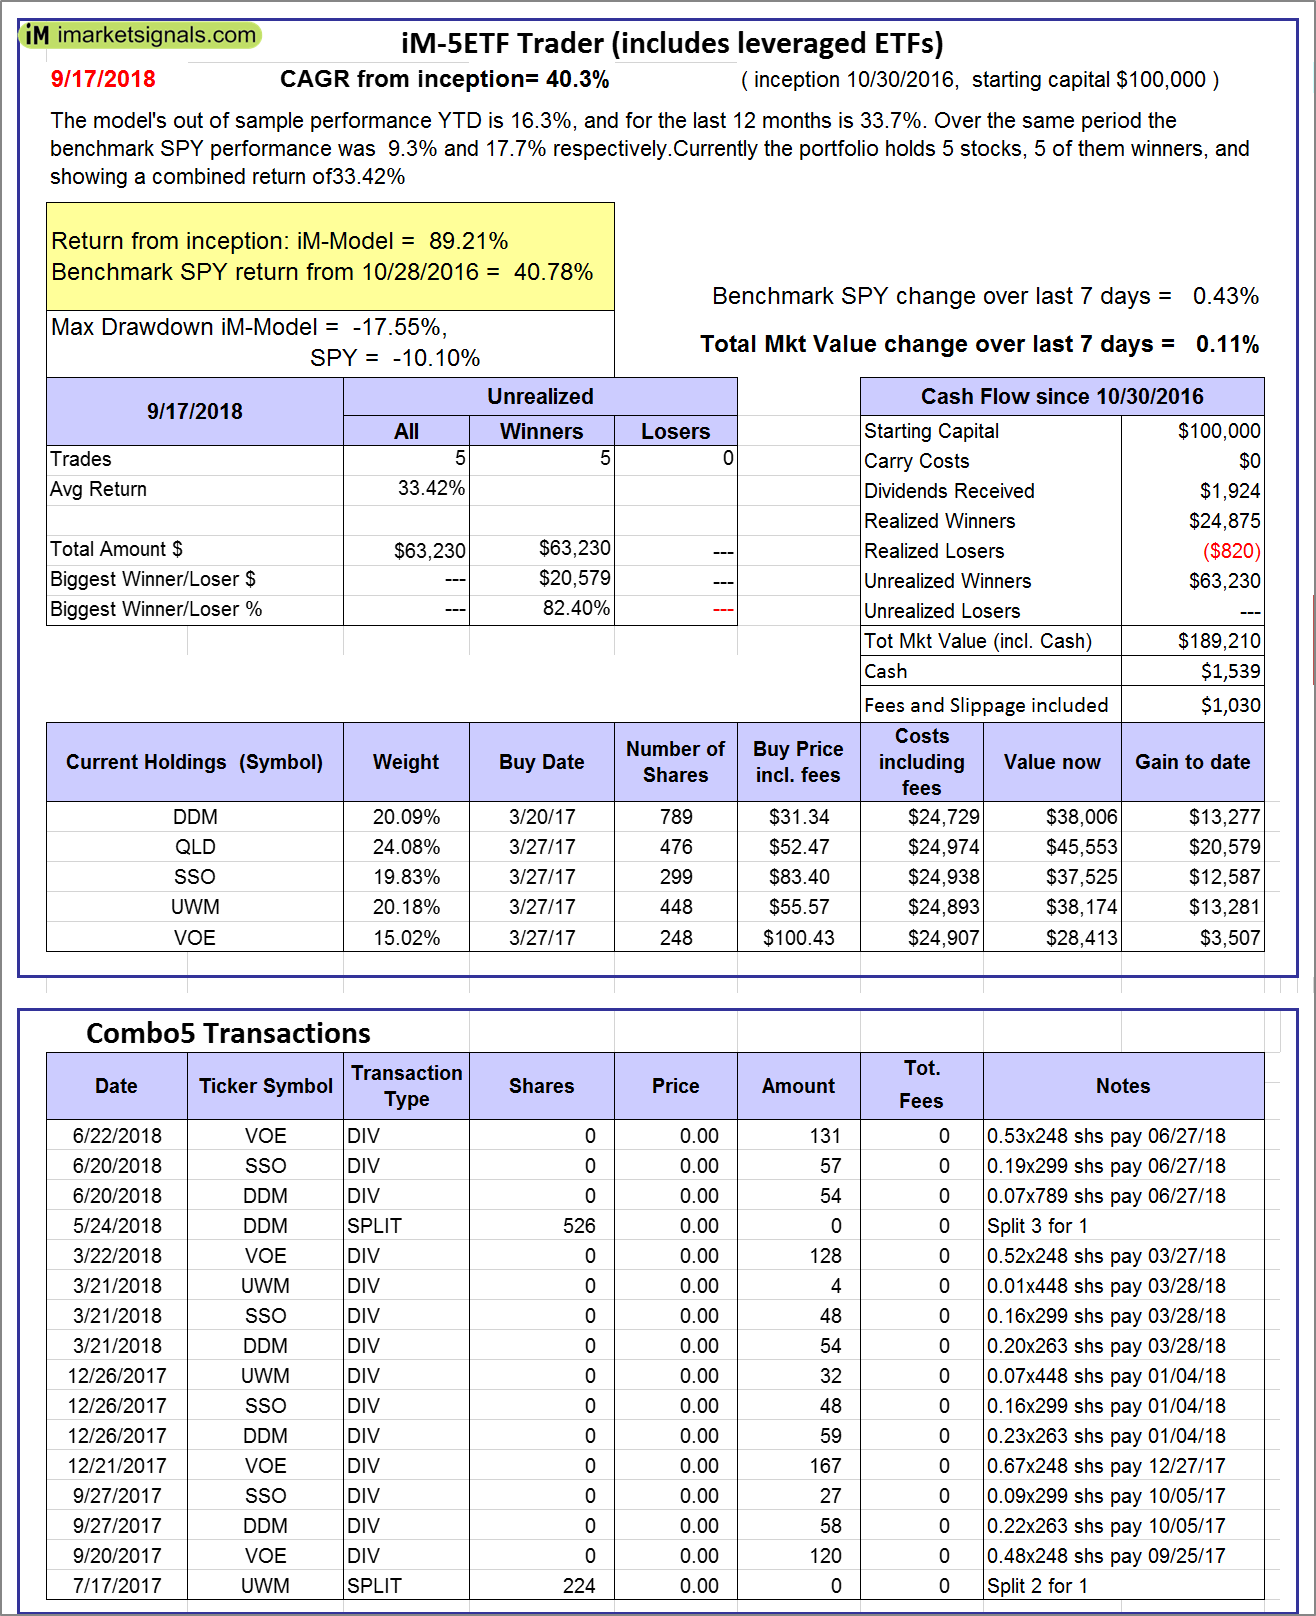 |
iM-5ETF Trader (includes leveraged ETFs): The model’s out of sample performance YTD is 16.3%, and for the last 12 months is 33.7%. Over the same period the benchmark SPY performance was 9.3% and 17.7% respectively. Over the previous week the market value of the iM-5ETF Trader (includes leveraged ETFs) gained 0.11% at a time when SPY gained 0.43%. A starting capital of $100,000 at inception on 10/30/2016 would have grown to $189,210 which includes $1,539 cash and excludes $1,030 spent on fees and slippage. |
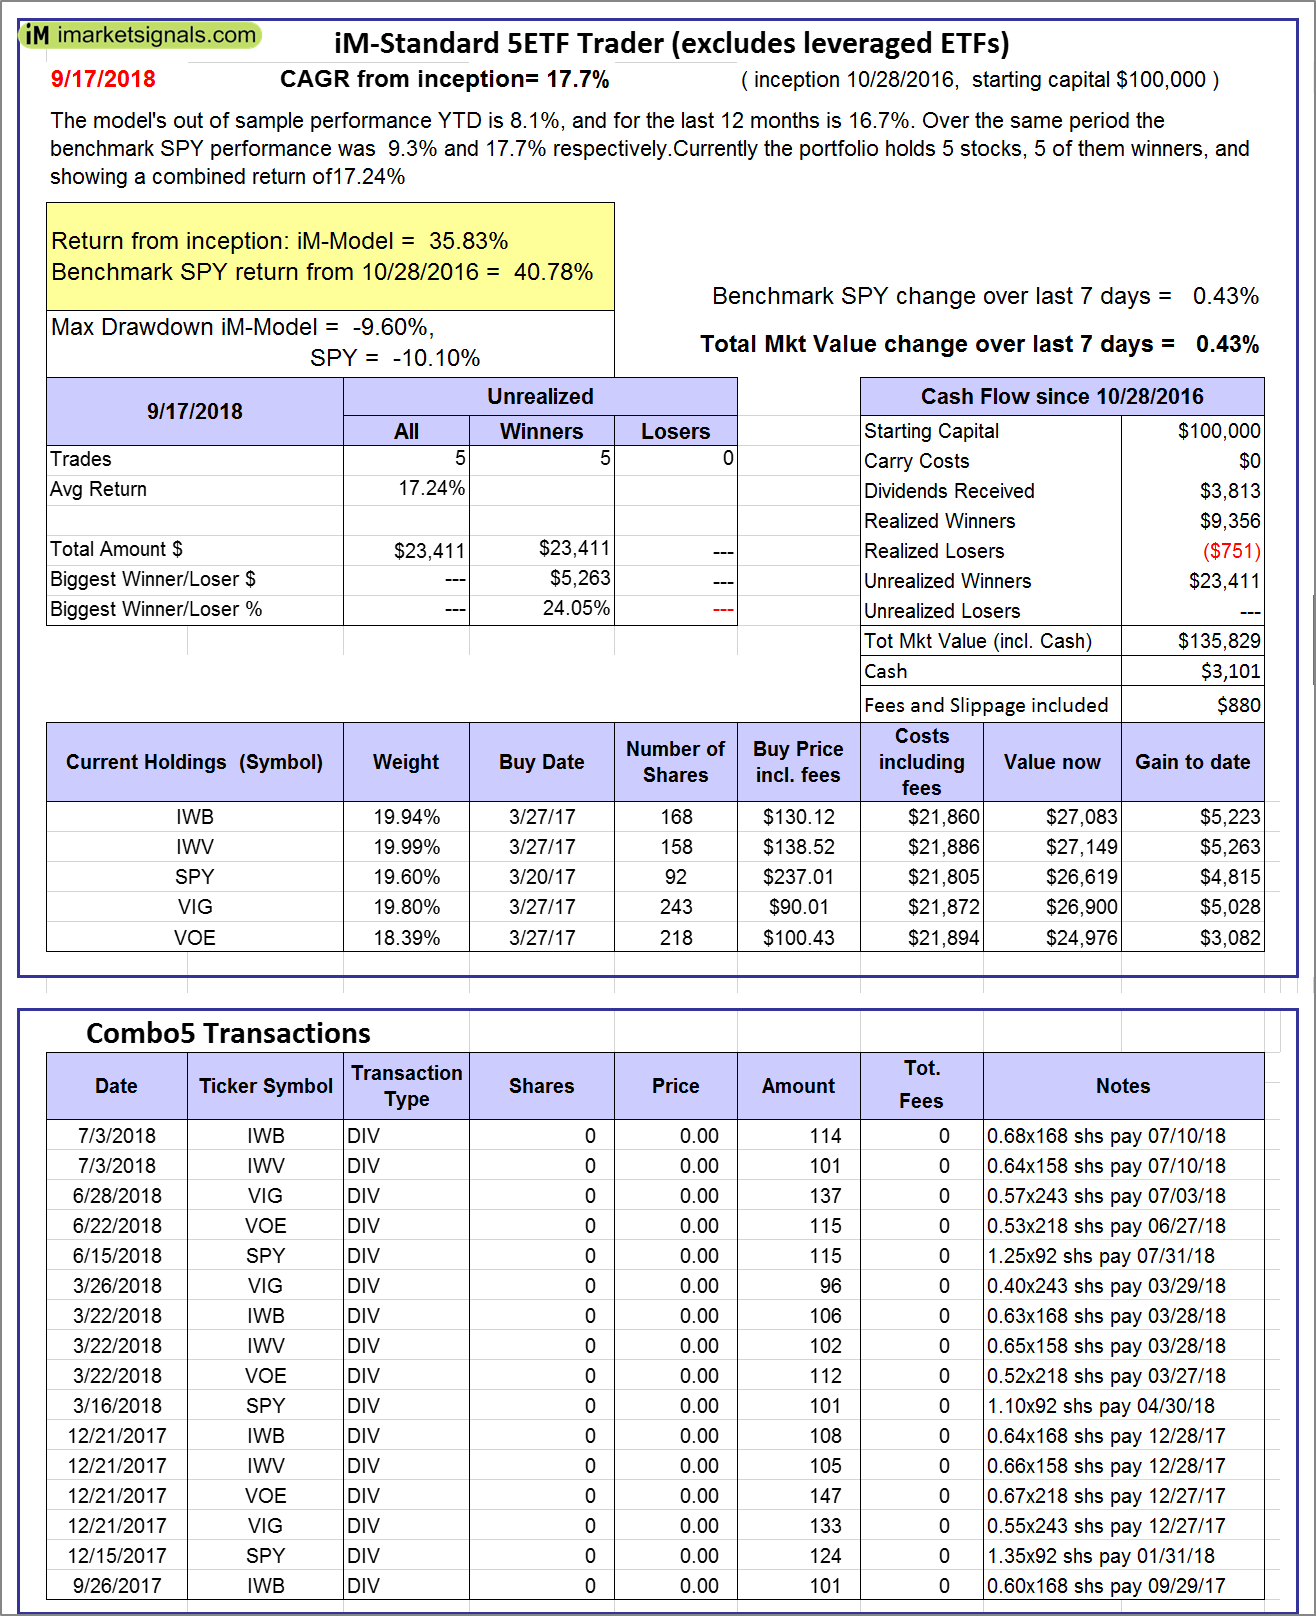 |
iM-Standard 5ETF Trader (excludes leveraged ETFs): The model’s out of sample performance YTD is 8.1%, and for the last 12 months is 16.7%. Over the same period the benchmark SPY performance was 9.3% and 17.7% respectively. Over the previous week the market value of the iM-Standard 5ETF Trader (excludes leveraged ETFs) gained 0.43% at a time when SPY gained 0.43%. A starting capital of $100,000 at inception on 10/30/2016 would have grown to $135,829 which includes $3,101 cash and excludes $880 spent on fees and slippage. |
iM-Best Reports – 9/17/2018
Posted in pmp SPY-SH
Leave a Reply
You must be logged in to post a comment.