  |
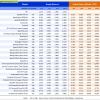
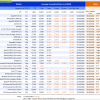
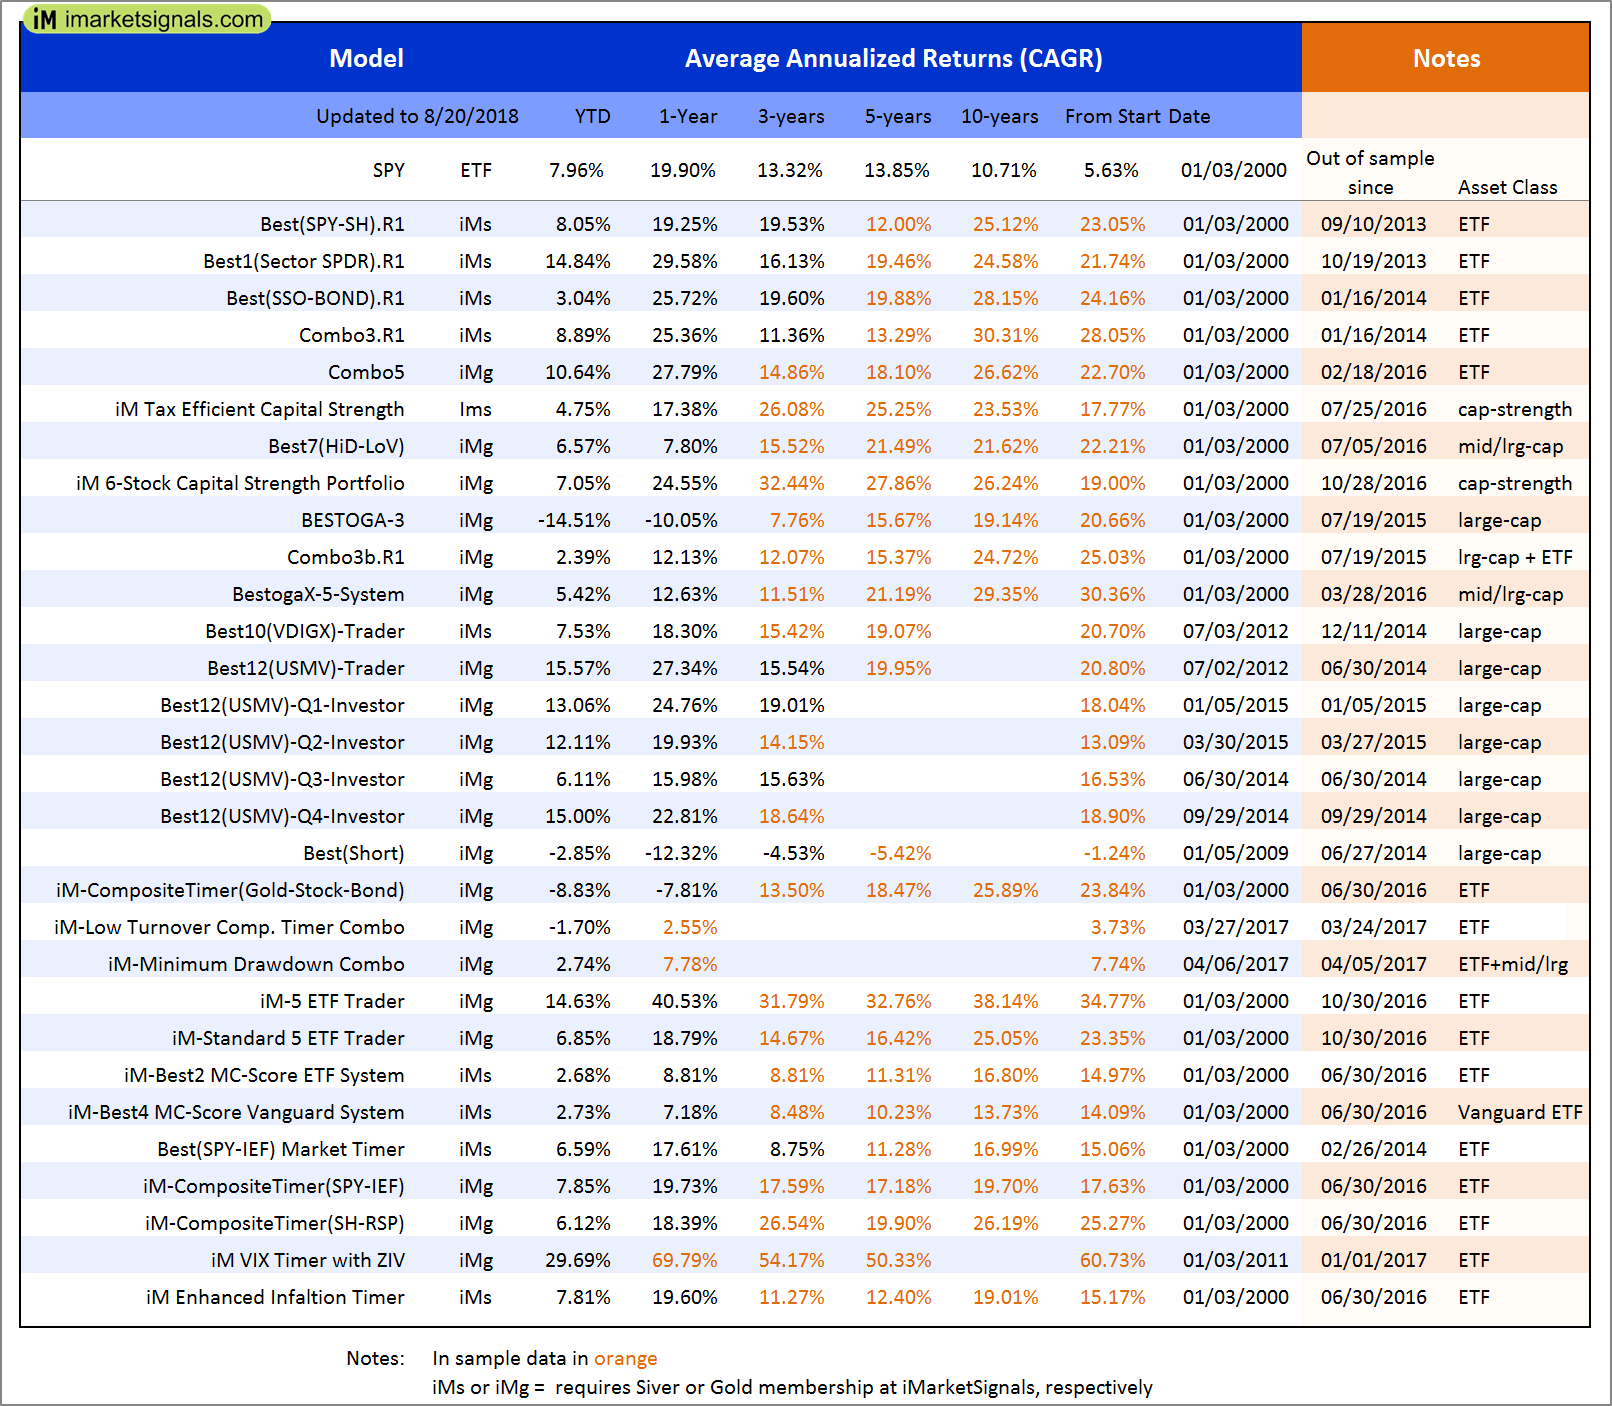
Out of sample performance summary of our models for the past 1, 2, 4 and 13 week periods. The active active return indicates how the models over- or underperformed the benchmark ETF SPY. Also the YTD, and the 1-, 3-, 5- and 10-year annualized returns are shown in the second table |
|
|
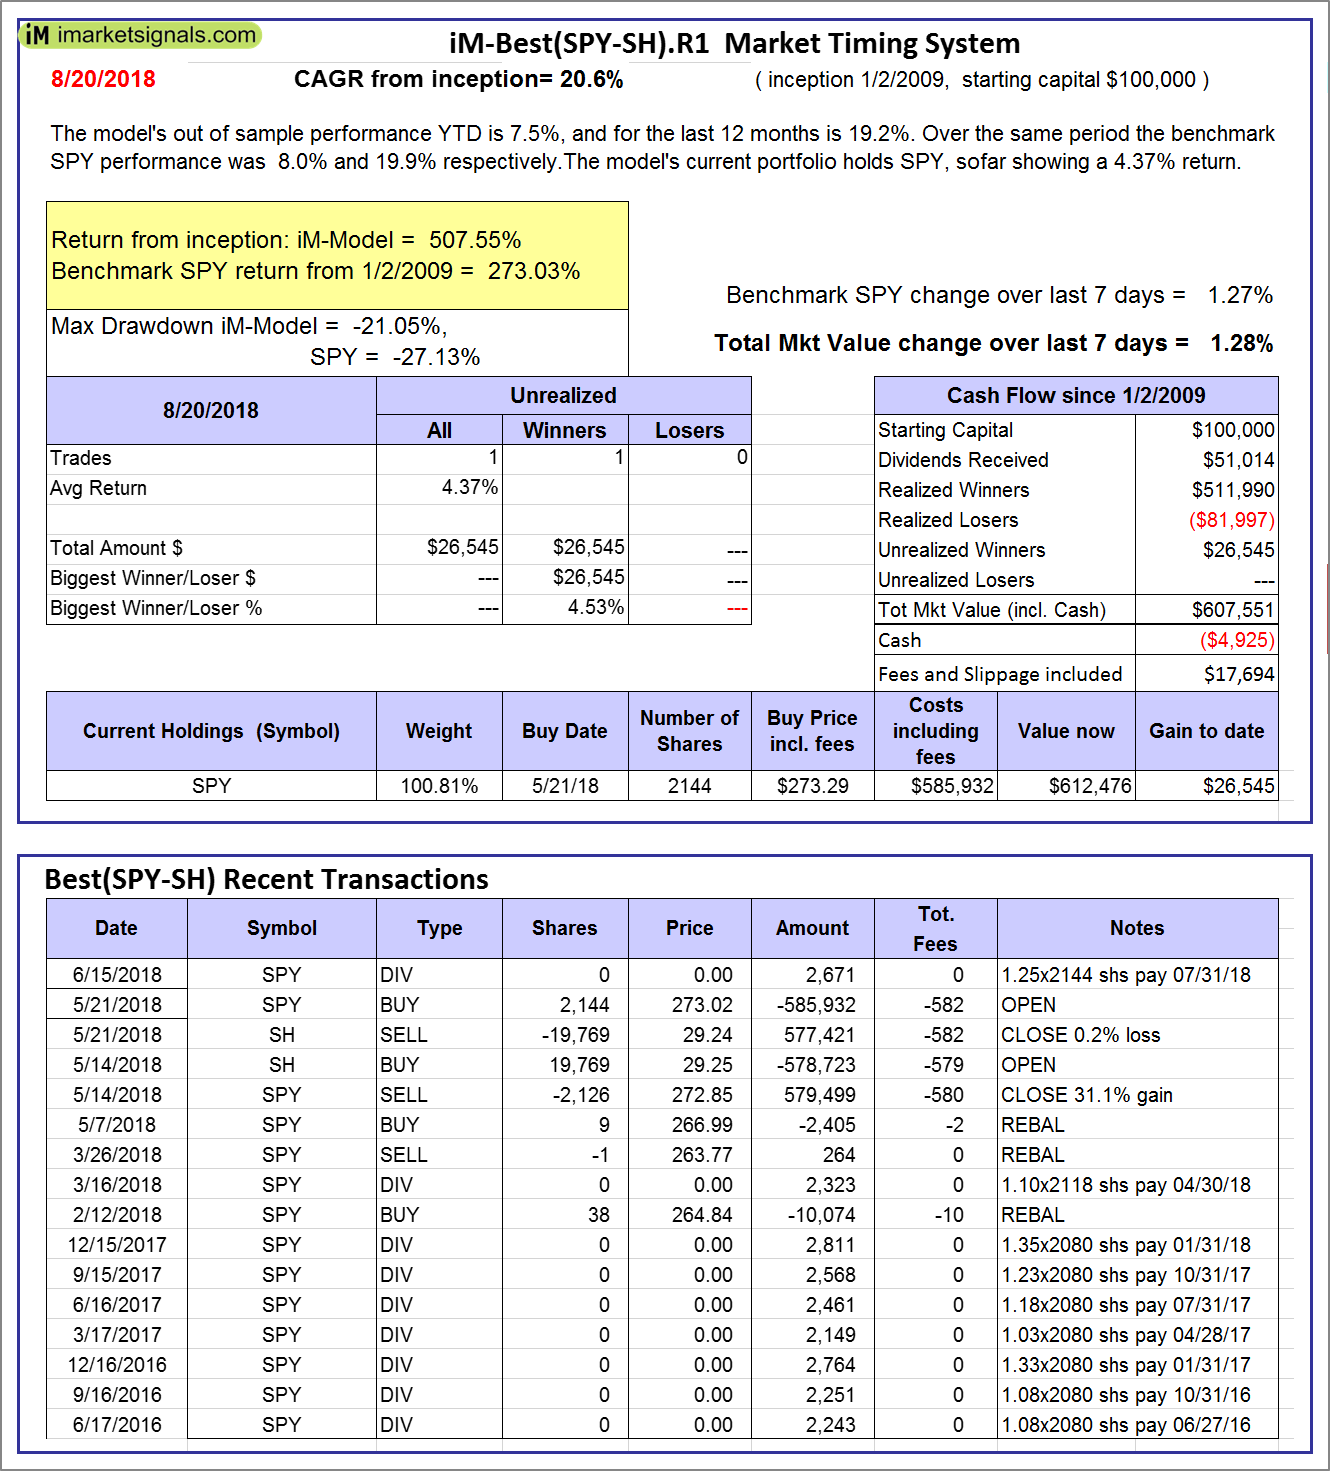
iM-Best(SPY-SH).R1: The model’s out of sample performance YTD is 7.5%, and for the last 12 months is 19.2%. Over the same period the benchmark SPY performance was 8.0% and 19.9% respectively. Over the previous week the market value of Best(SPY-SH) gained 1.28% at a time when SPY gained 1.27%. A starting capital of $100,000 at inception on 1/2/2009 would have grown to $607,551 which includes -$4,925 cash and excludes $17,694 spent on fees and slippage. |
|
|
iM-Combo3.R1: The model’s out of sample performance YTD is 8.7%, and for the last 12 months is 25.4%. Over the same period the benchmark SPY performance was 8.0% and 19.9% respectively. Over the previous week the market value of iM-Combo3.R1 gained 0.63% at a time when SPY gained 1.27%. A starting capital of $100,000 at inception on 2/3/2014 would have grown to $171,694 which includes -$1,649 cash and excludes $4,008 spent on fees and slippage. |
|
|
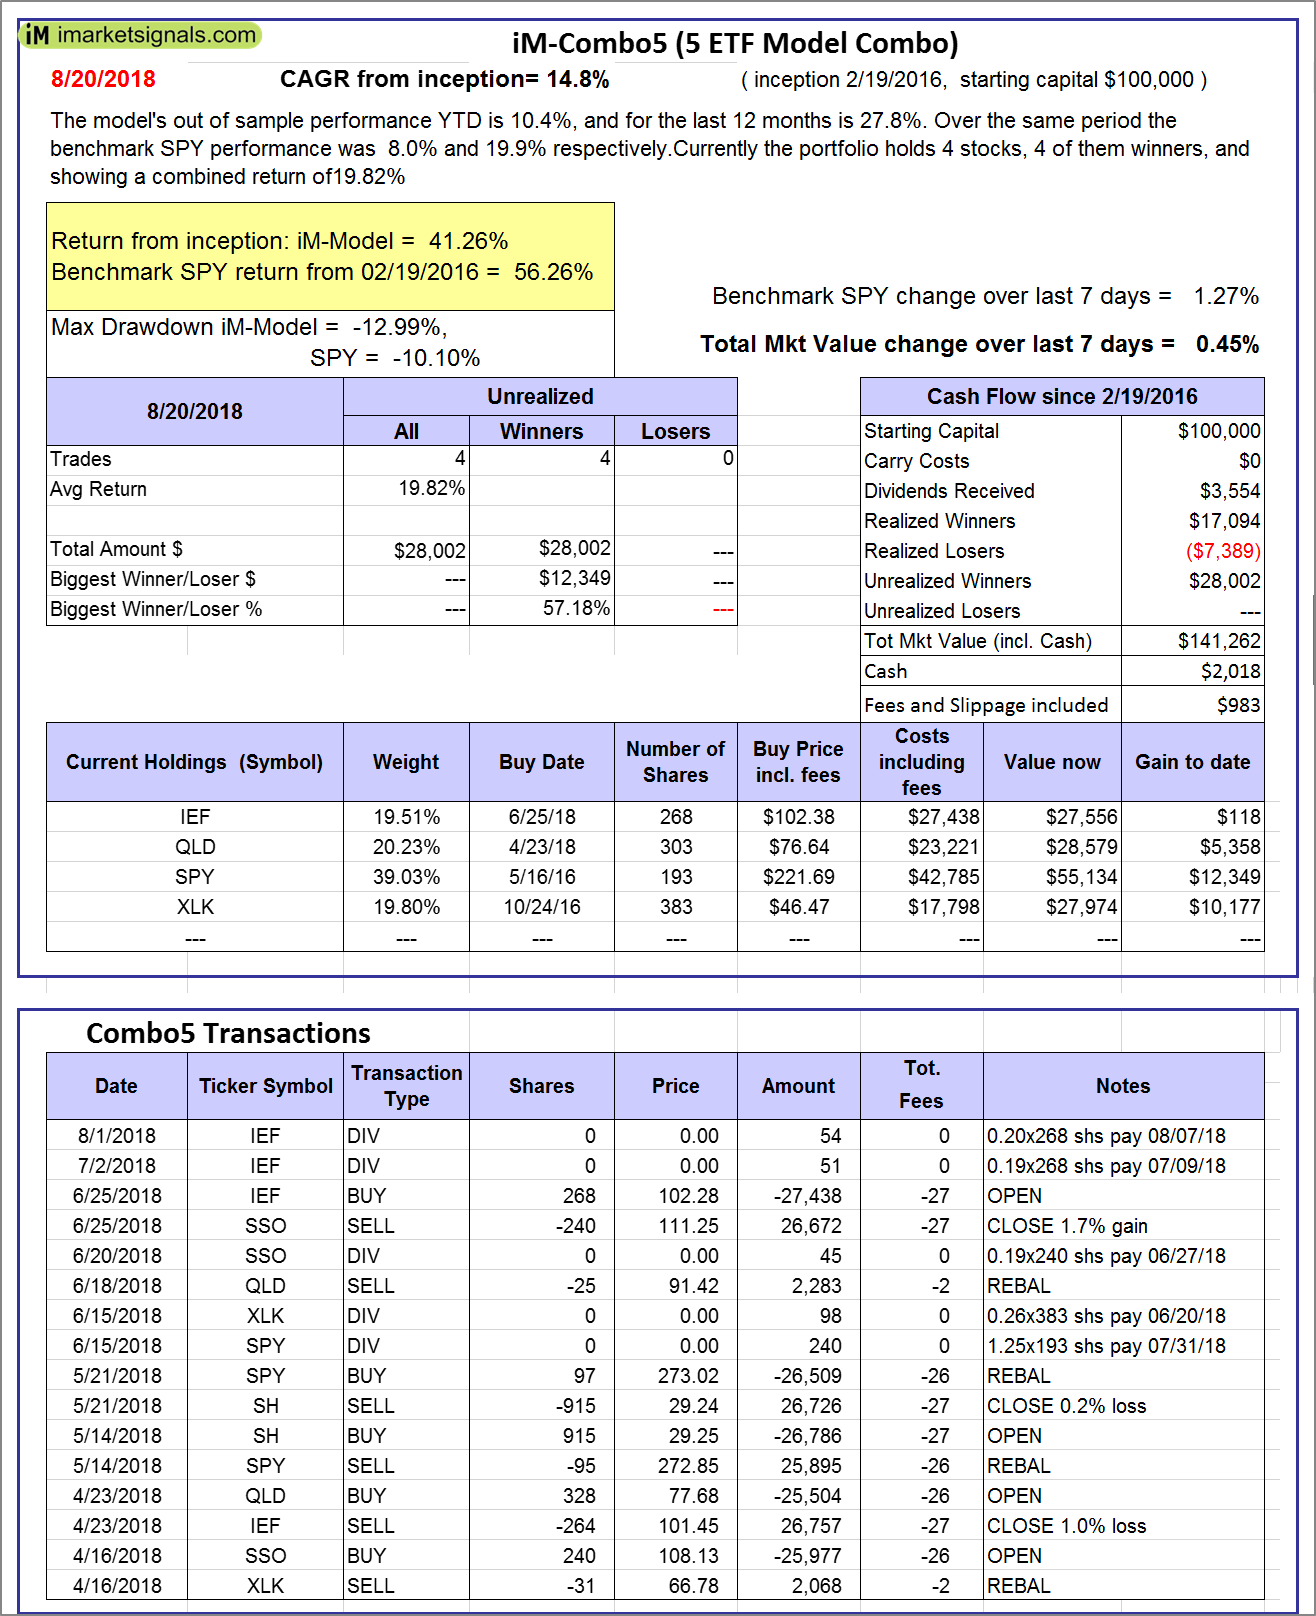
iM-Combo5: The model’s out of sample performance YTD is 10.4%, and for the last 12 months is 27.8%. Over the same period the benchmark SPY performance was 8.0% and 19.9% respectively. Over the previous week the market value of iM-Combo5 gained 0.45% at a time when SPY gained 1.27%. A starting capital of $100,000 at inception on 2/22/2016 would have grown to $141,262 which includes $2,018 cash and excludes $983 spent on fees and slippage. |
|
|
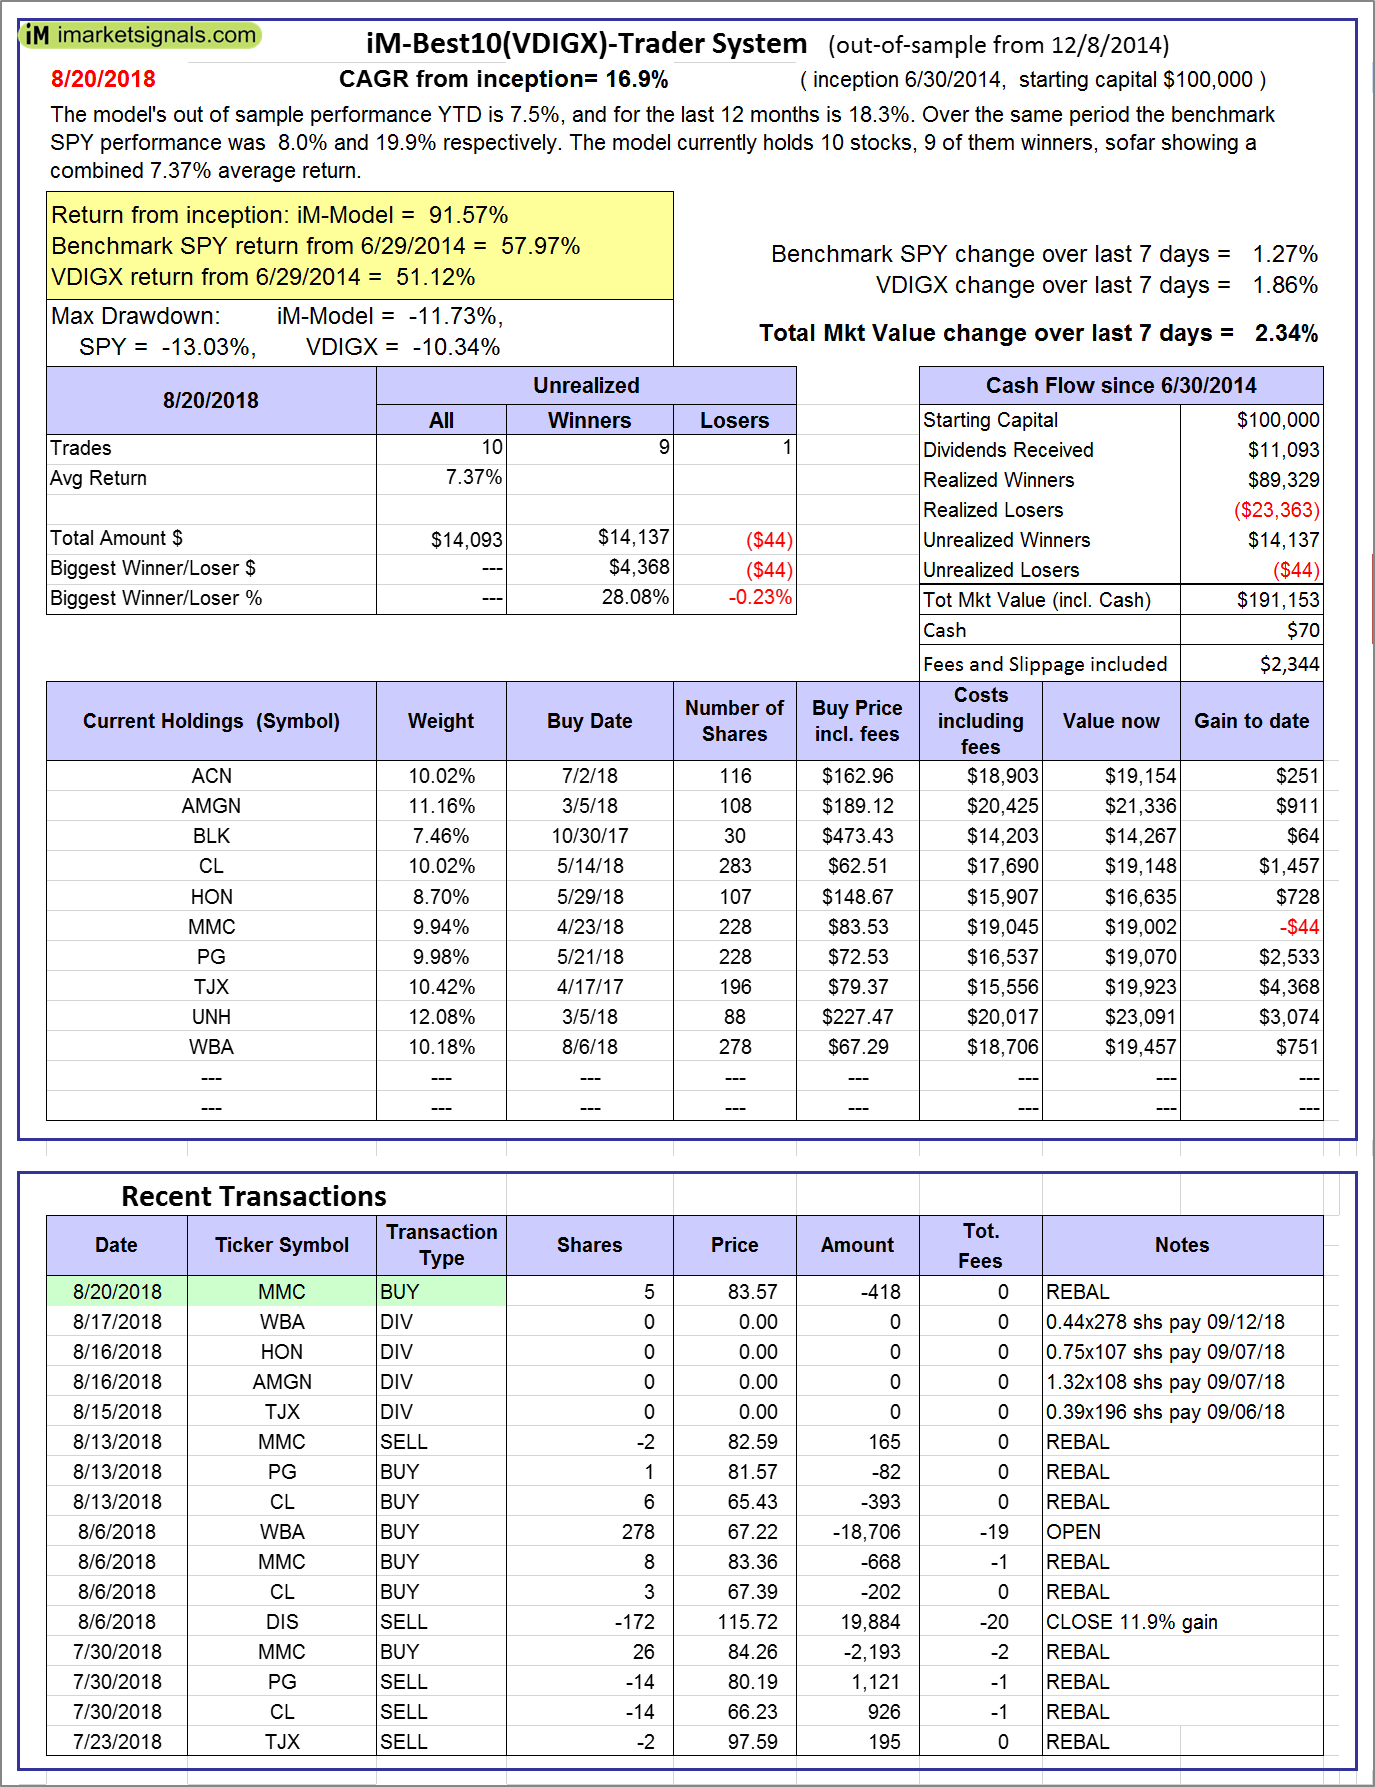
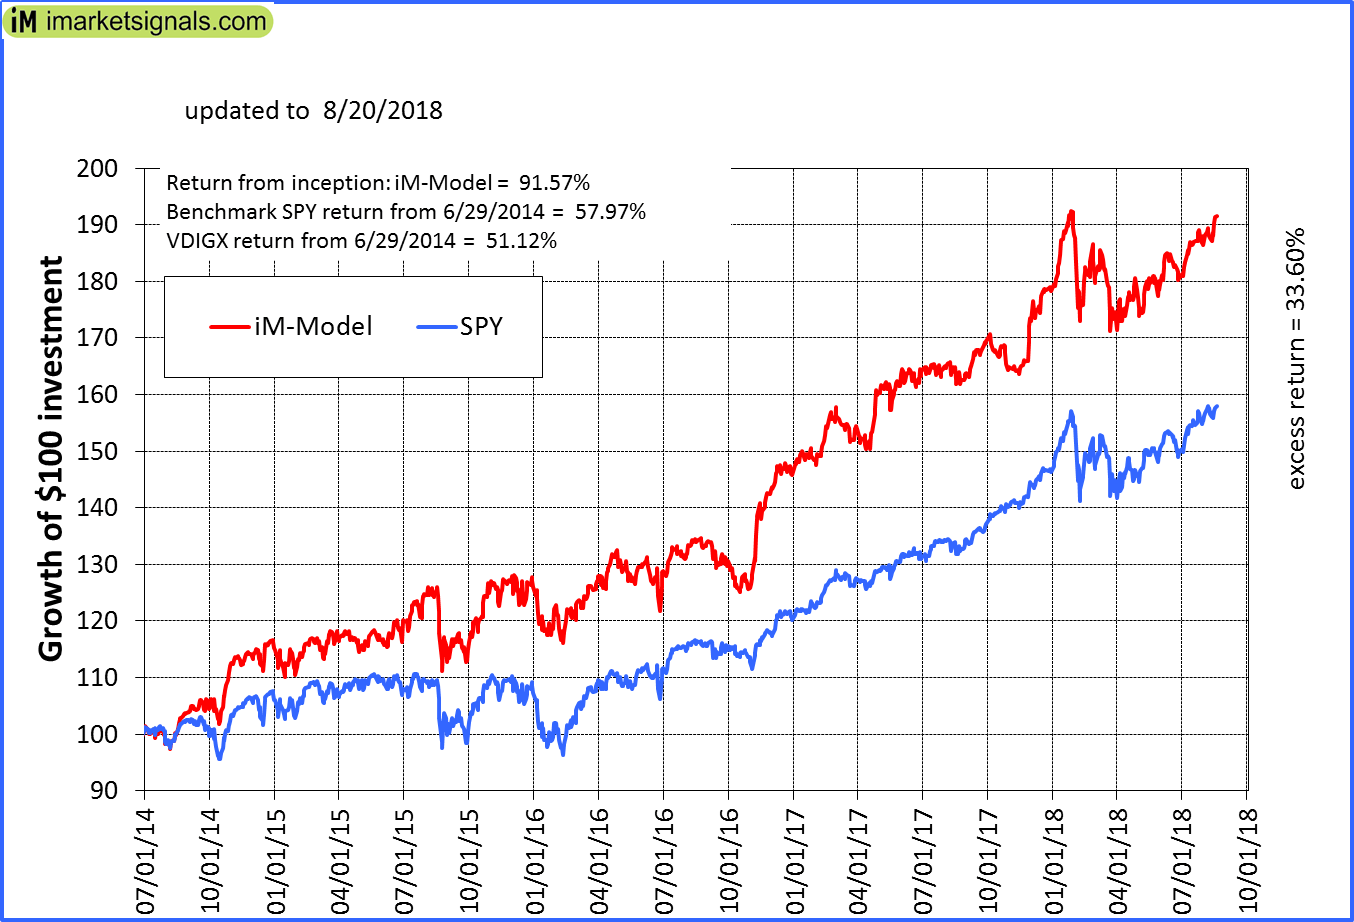
iM-Best10(VDIGX)-Trader: The model’s out of sample performance YTD is 7.5%, and for the last 12 months is 18.3%. Over the same period the benchmark SPY performance was 8.0% and 19.9% respectively. Since inception, on 7/1/2014, the model gained 91.57% while the benchmark SPY gained 57.97% and VDIGX gained 51.12% over the same period. Over the previous week the market value of iM-Best10(VDIGX) gained 2.34% at a time when SPY gained 1.27%. A starting capital of $100,000 at inception on 7/1/2014 would have grown to $191,153 which includes $70 cash and excludes $2,344 spent on fees and slippage. |
|
|
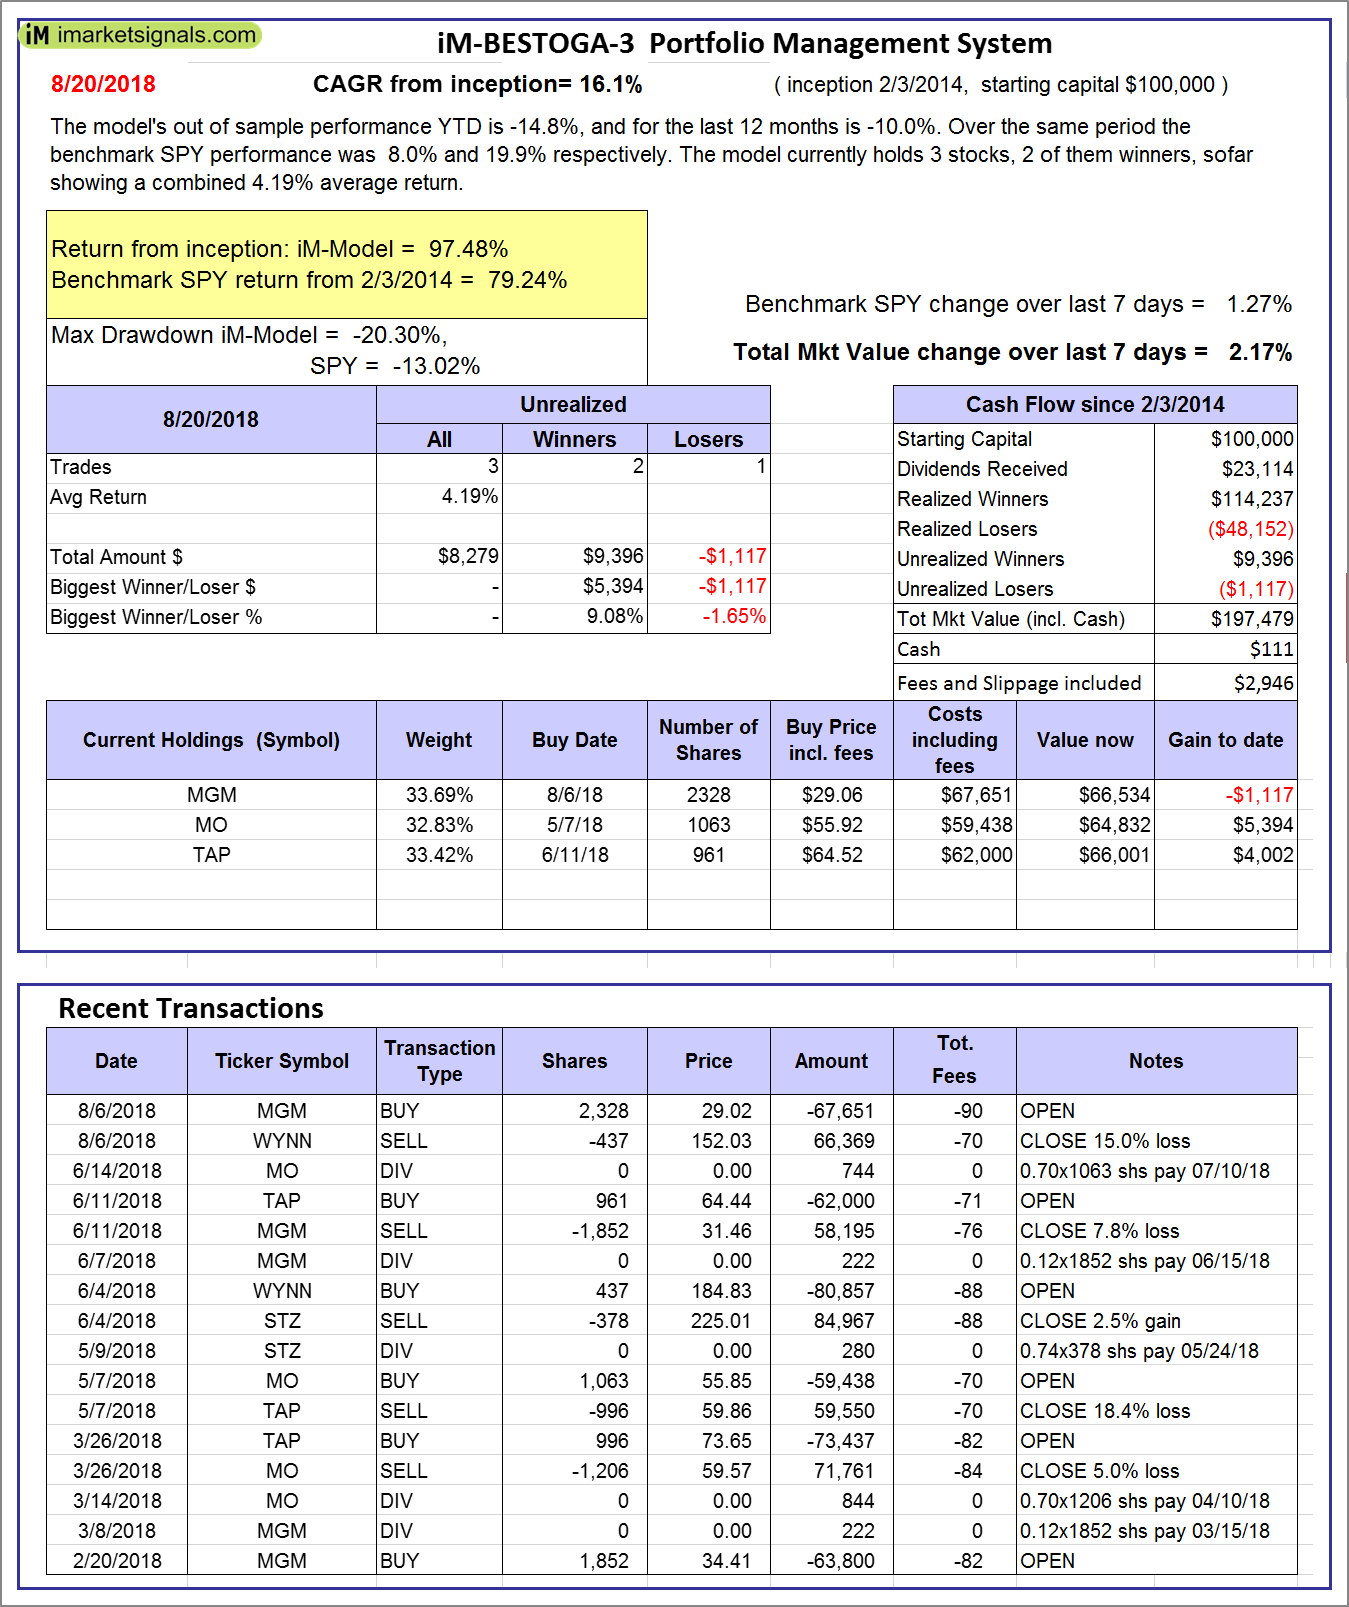
iM-BESTOGA-3: The model’s out of sample performance YTD is -14.8%, and for the last 12 months is -10.0%. Over the same period the benchmark SPY performance was 8.0% and 19.9% respectively. Over the previous week the market value of iM-BESTOGA-3 gained 2.17% at a time when SPY gained 1.27%. A starting capital of $100,000 at inception on 2/3/2014 would have grown to $197,479 which includes $111 cash and excludes $2,946 spent on fees and slippage. |
|
|
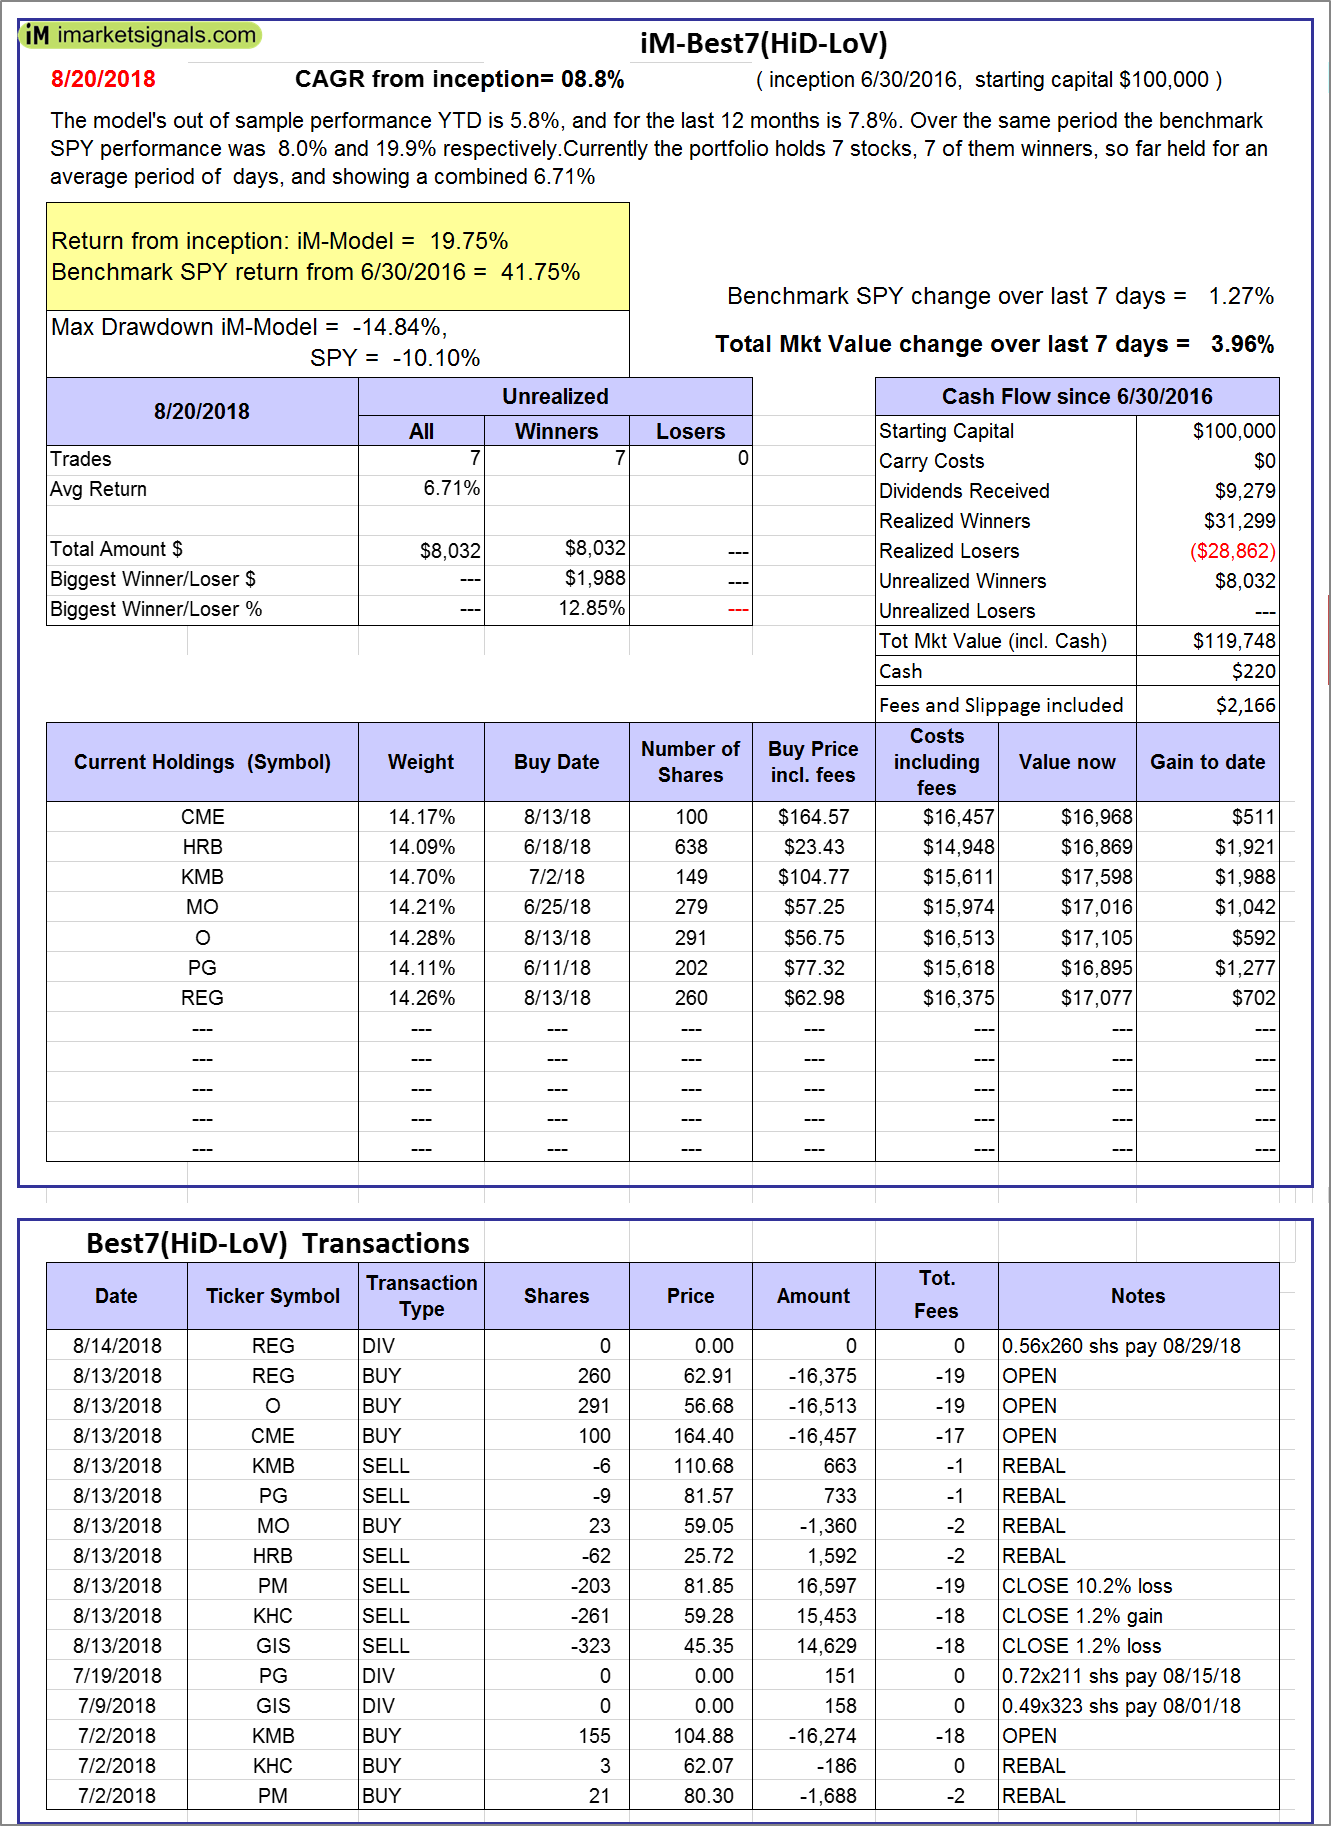
iM-Best7(HiD-LoV): The model’s out of sample performance YTD is 5.8%, and for the last 12 months is 7.8%. Over the same period the benchmark SPY performance was 8.0% and 19.9% respectively. Over the previous week the market value of iM-BESTOGA-3 gained 3.96% at a time when SPY gained 1.27%. A starting capital of $100,000 at inception on 6/30/2016 would have grown to $119,748 which includes $220 cash and excludes $2,166 spent on fees and slippage. |
|
|
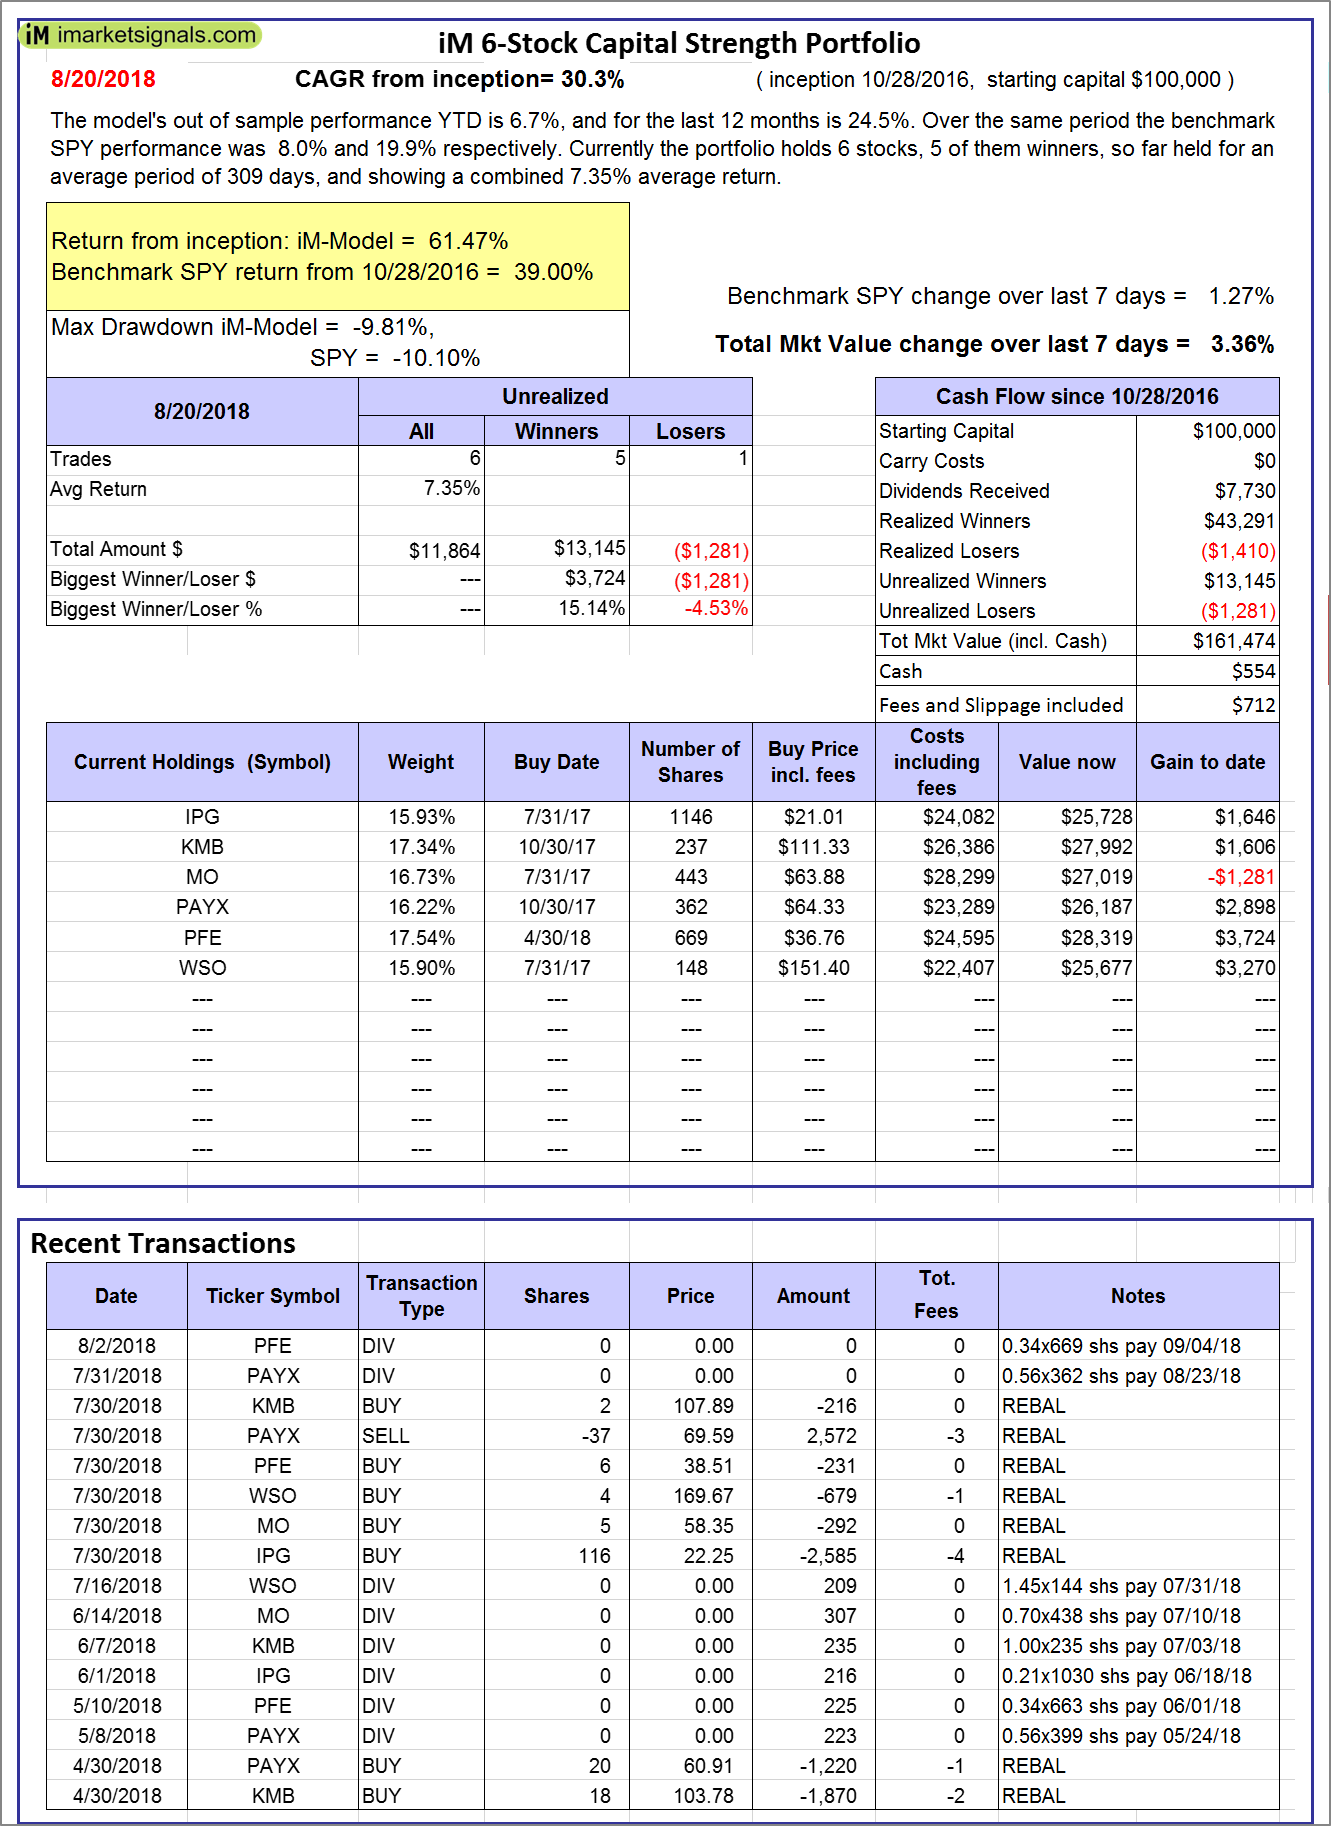
iM 6-Stock Capital Strength Portfolio: The model’s out of sample performance YTD is 6.7%, and for the last 12 months is 24.5%. Over the same period the benchmark SPY performance was 8.0% and 19.9% respectively. Over the previous week the market value of the iM 6-Stock Capital Strength Portfolio gained 3.36% at a time when SPY gained 1.27%. A starting capital of $100,000 at inception on 10/28/2016 would have grown to $161,474 which includes $554 cash and excludes $712 spent on fees and slippage. |
|
|
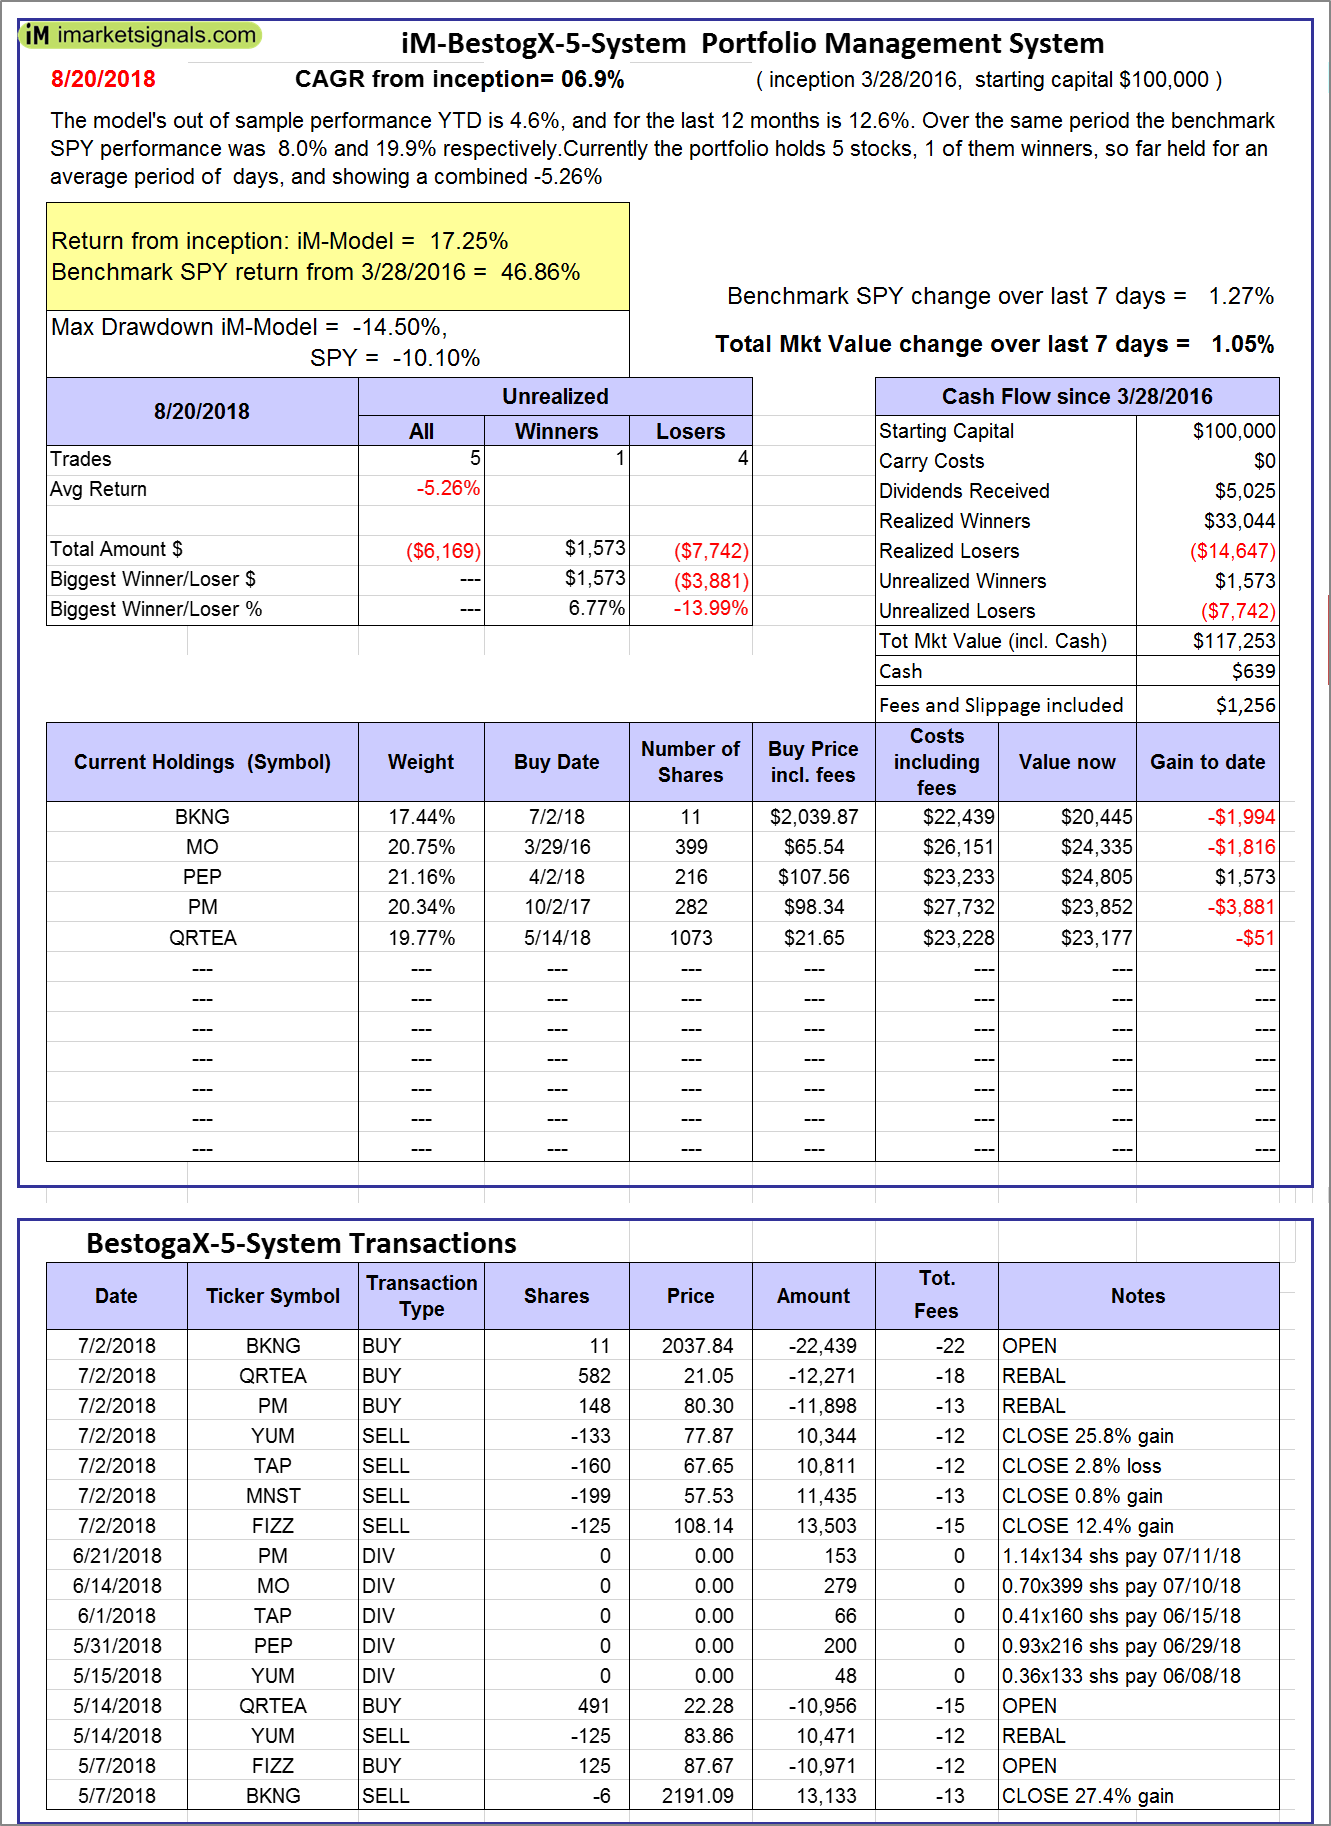
iM-BestogaX5-System: The model’s out of sample performance YTD is 4.6%, and for the last 12 months is 12.6%. Over the same period the benchmark SPY performance was 8.0% and 19.9% respectively. Over the previous week the market value of iM-BestogaX5-System gained 1.05% at a time when SPY gained 1.27%. A starting capital of $100,000 at inception on 3/28/2016 would have grown to $117,253 which includes $639 cash and excludes $1,256 spent on fees and slippage. |
|
|
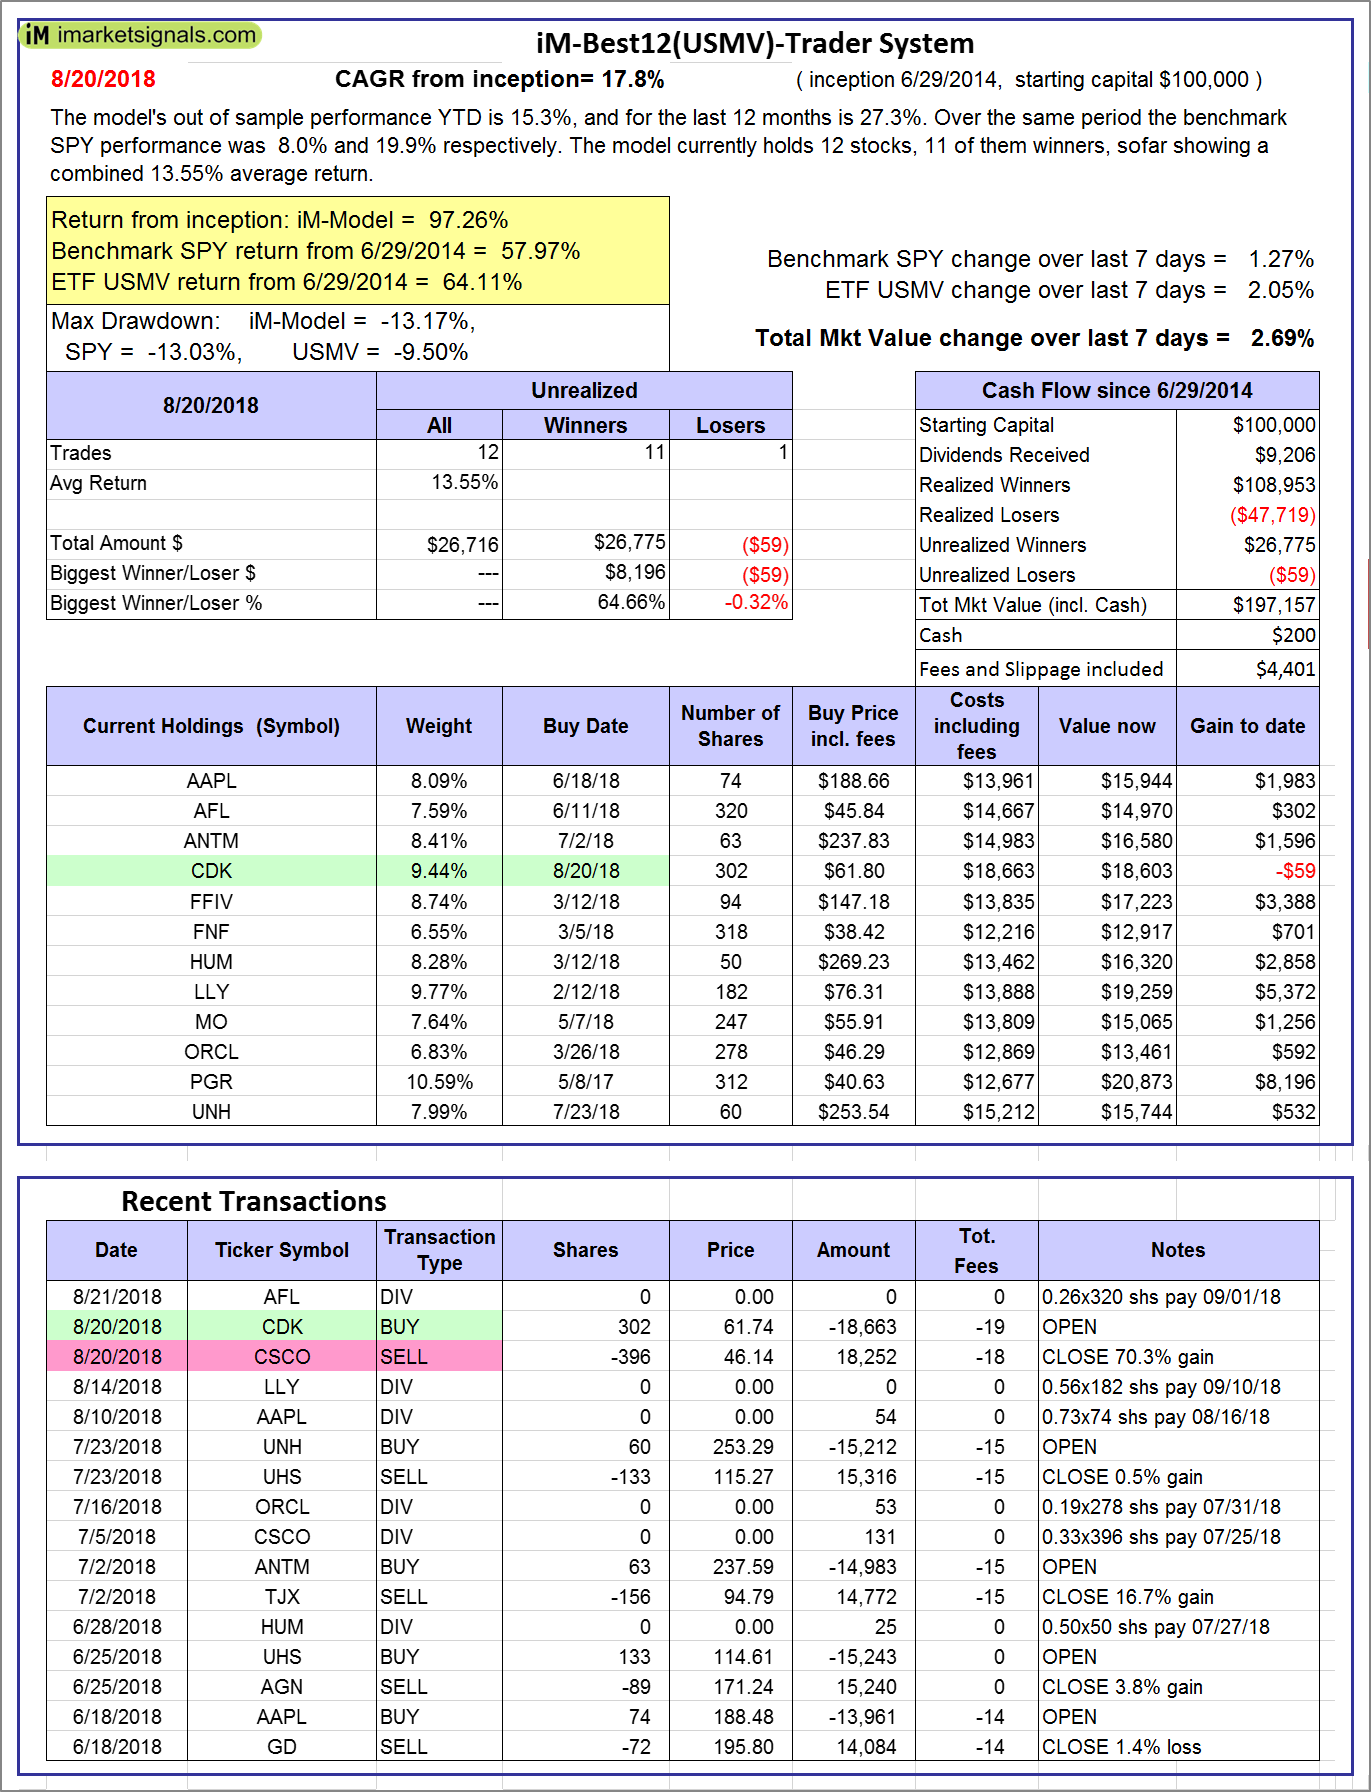
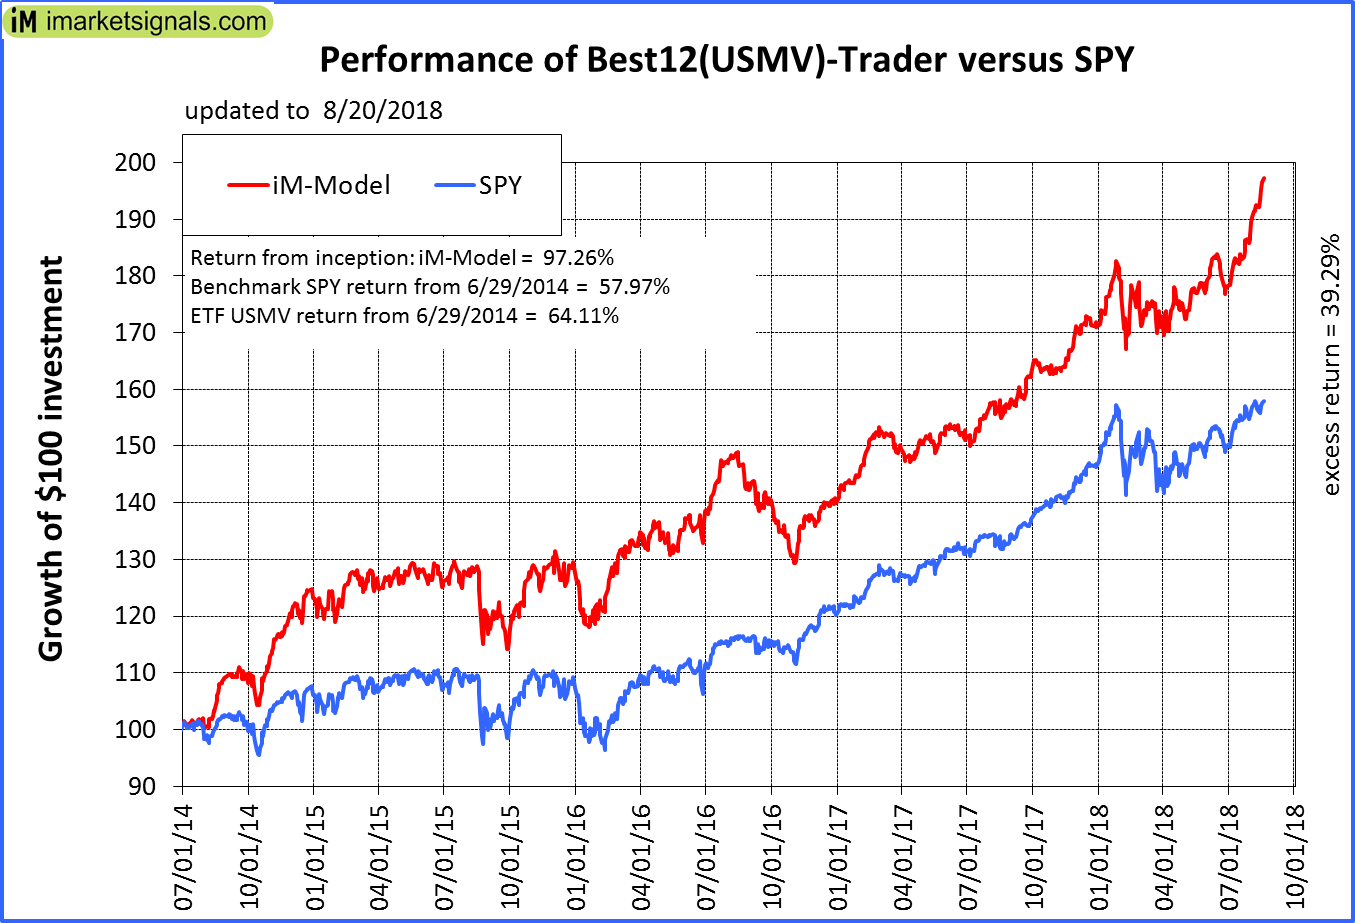
iM-Best12(USMV)-Trader: The model’s out of sample performance YTD is 15.3%, and for the last 12 months is 27.3%. Over the same period the benchmark SPY performance was 8.0% and 19.9% respectively. Since inception, on 6/30/2014, the model gained 97.26% while the benchmark SPY gained 57.97% and the ETF USMV gained 64.11% over the same period. Over the previous week the market value of iM-Best12(USMV)-Trader gained 2.69% at a time when SPY gained 1.27%. A starting capital of $100,000 at inception on 6/30/2014 would have grown to $197,157 which includes $200 cash and excludes $4,401 spent on fees and slippage. |
|
|
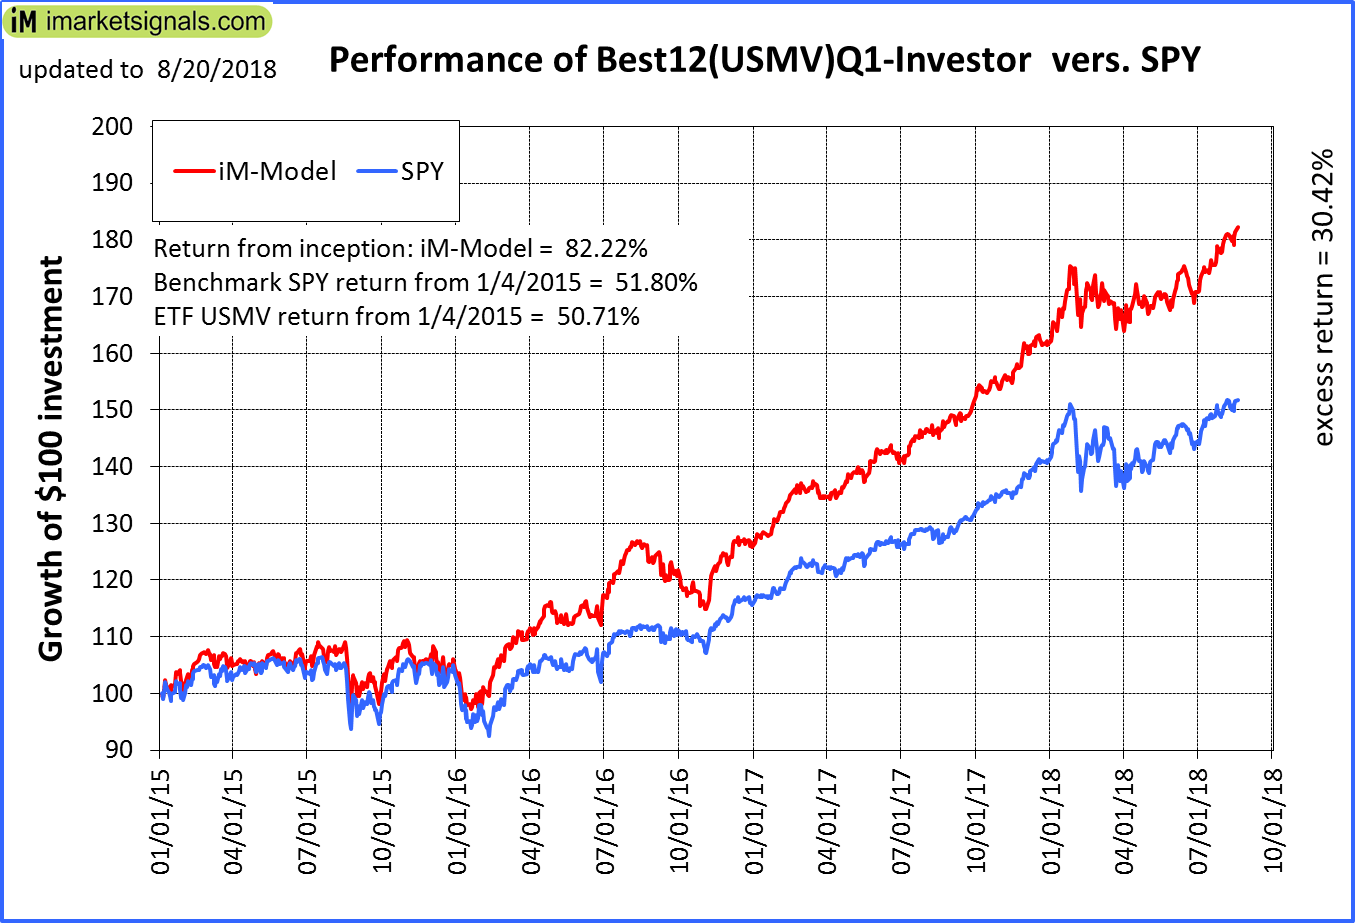
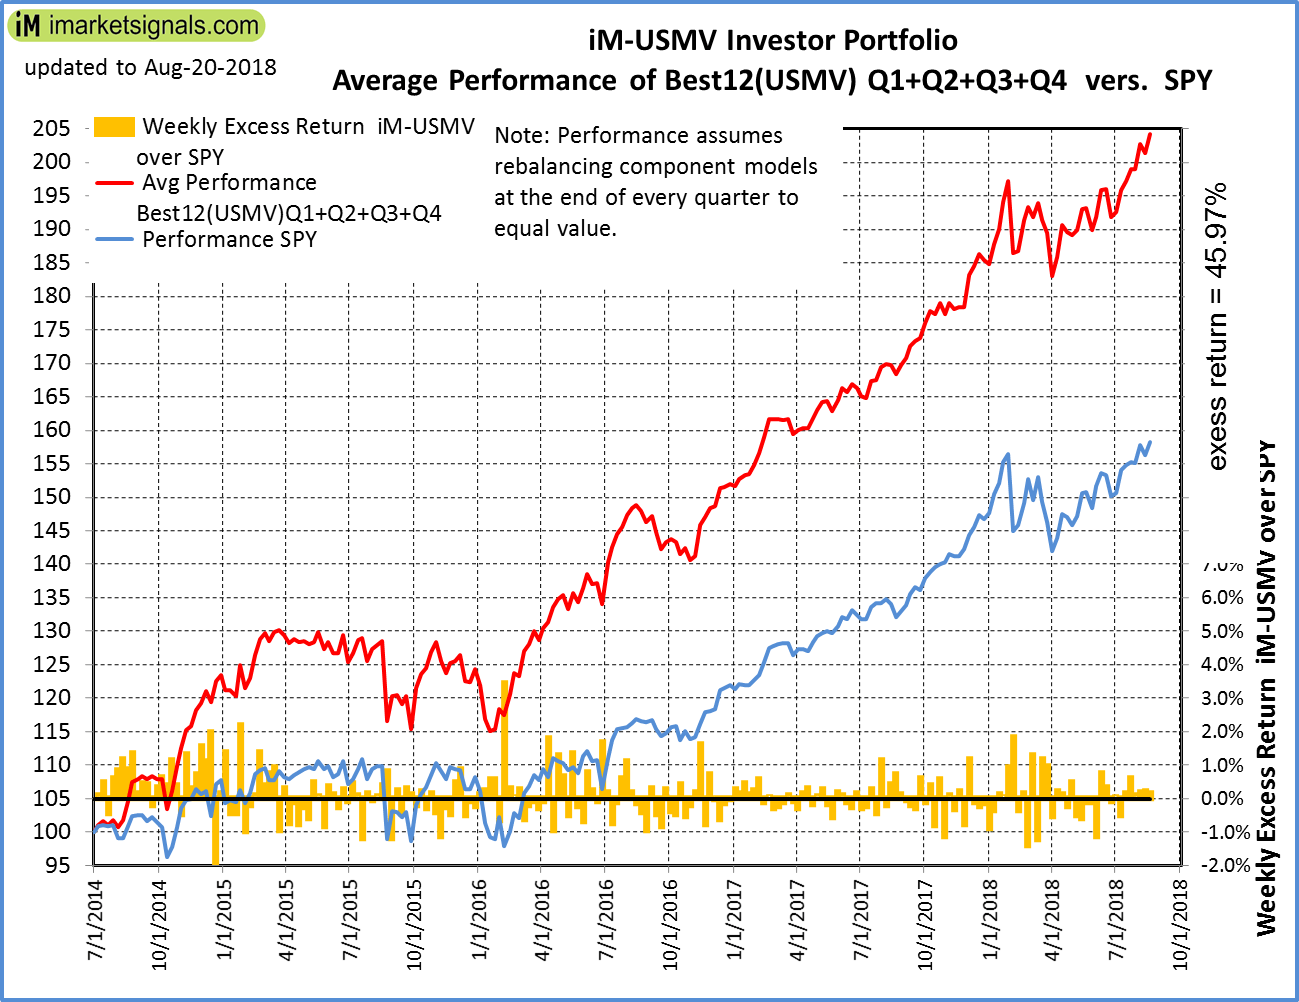
iM-Best12(USMV)Q1-Investor: The model’s out of sample performance YTD is 12.9%, and for the last 12 months is 24.8%. Over the same period the benchmark SPY performance was 8.0% and 19.9% respectively. Since inception, on 1/5/2015, the model gained 82.22% while the benchmark SPY gained 51.80% and the ETF USMV gained 50.71% over the same period. Over the previous week the market value of iM-Best12(USMV)Q1 gained 1.40% at a time when SPY gained 1.27%. A starting capital of $100,000 at inception on 1/5/2015 would have grown to $182,219 which includes $131 cash and excludes $1,252 spent on fees and slippage. |
|
|
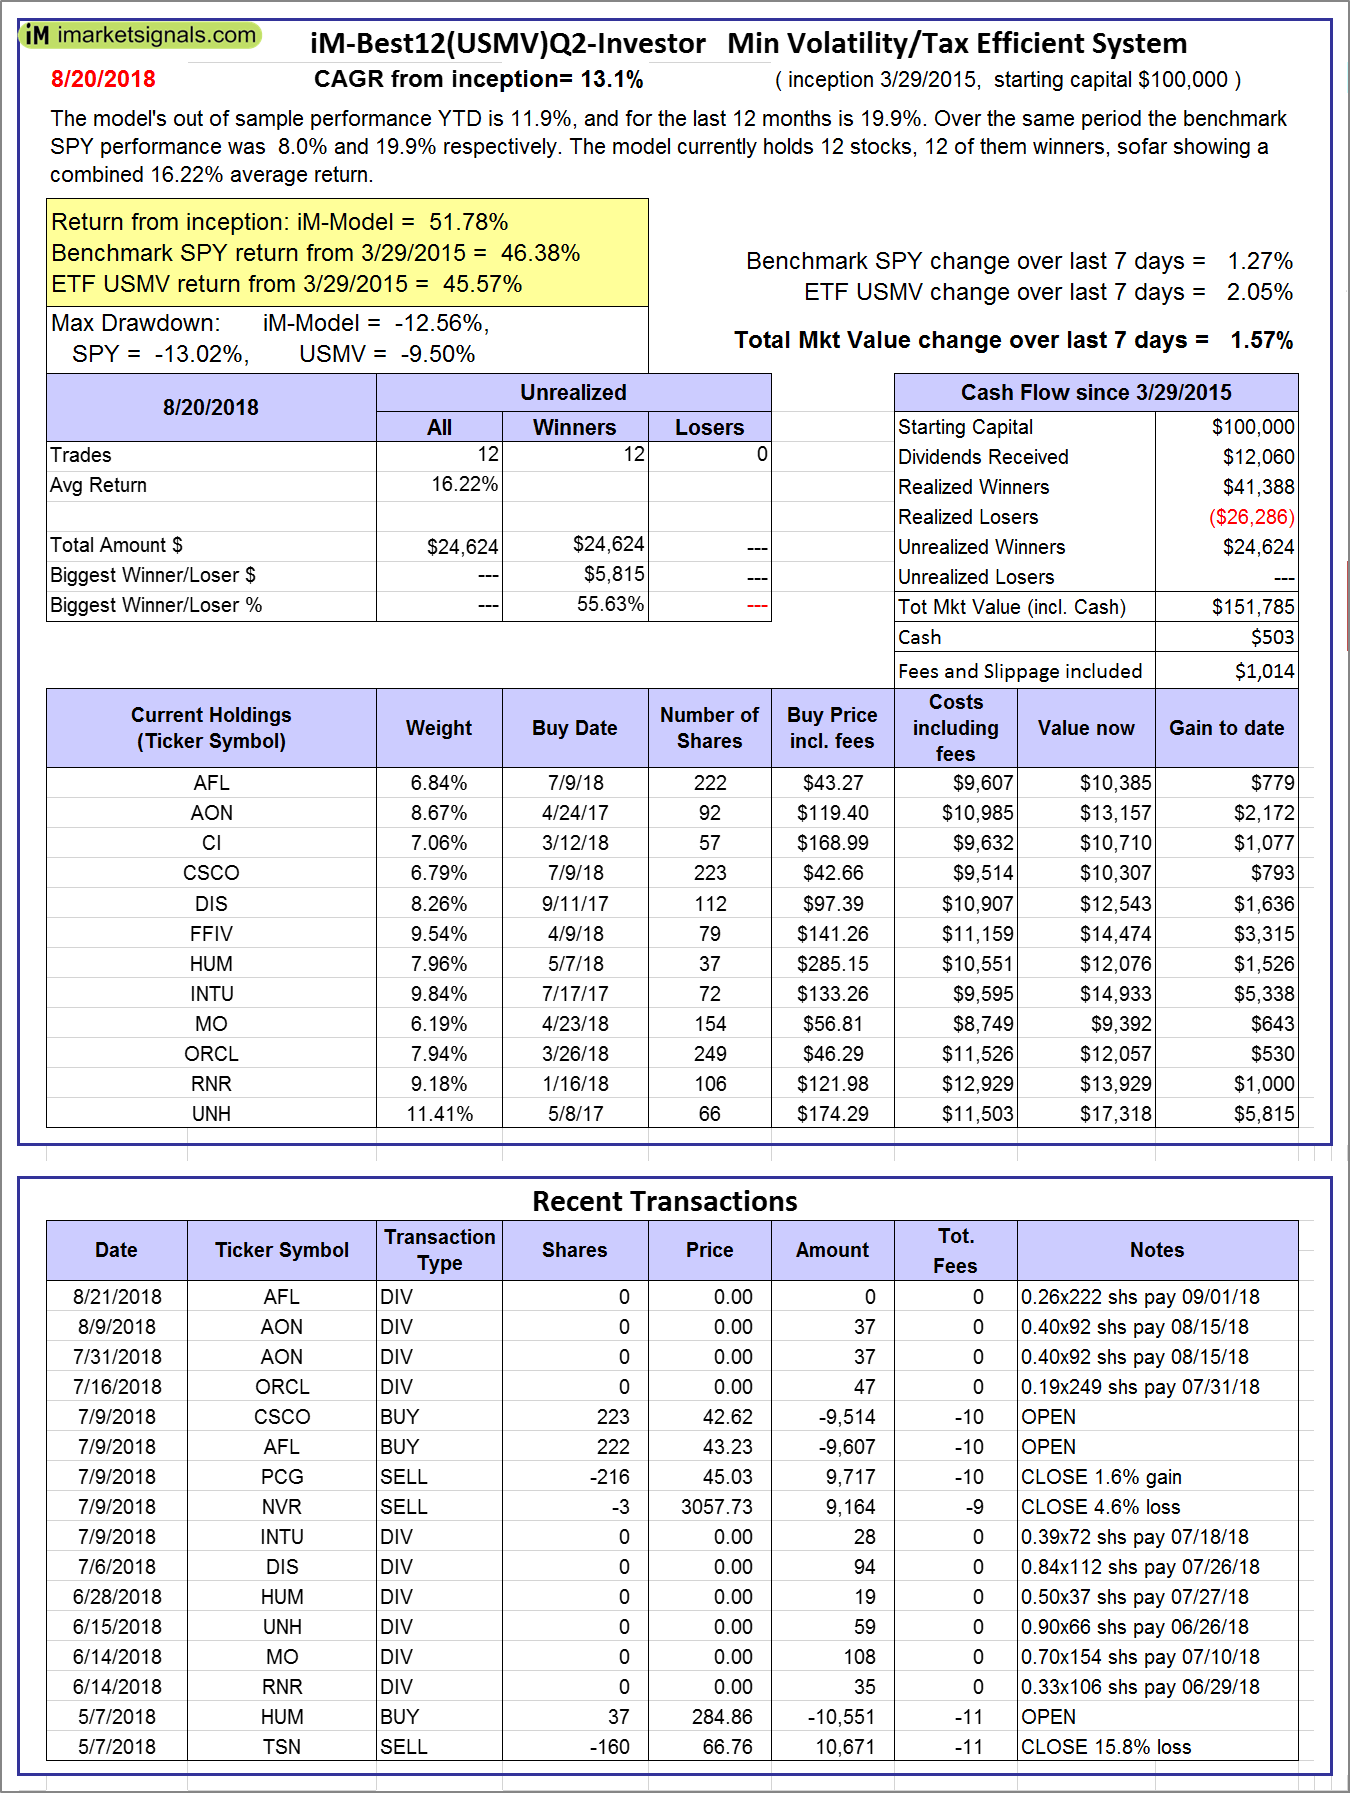
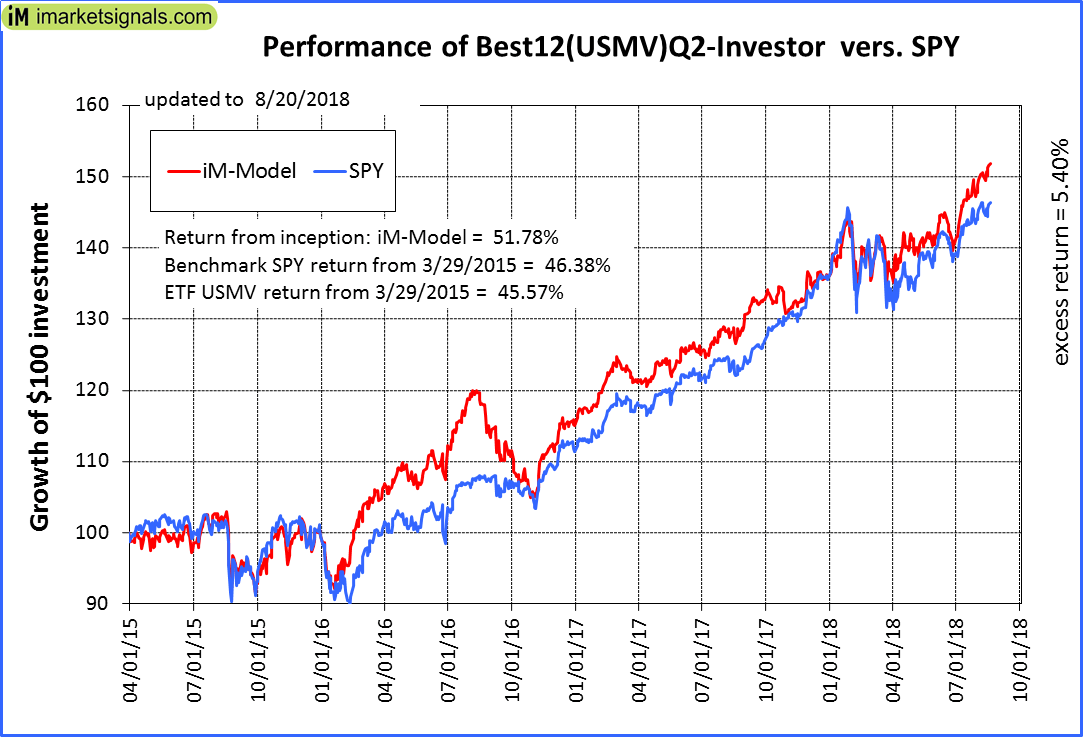
iM-Best12(USMV)Q2-Investor: The model’s out of sample performance YTD is 11.9%, and for the last 12 months is 19.9%. Over the same period the benchmark SPY performance was 8.0% and 19.9% respectively. Since inception, on 3/30/2015, the model gained 51.78% while the benchmark SPY gained 46.38% and the ETF USMV gained 45.57% over the same period. Over the previous week the market value of iM-Best12(USMV)Q2 gained 1.57% at a time when SPY gained 1.27%. A starting capital of $100,000 at inception on 3/30/2015 would have grown to $151,785 which includes $503 cash and excludes $1,014 spent on fees and slippage. |
|
|
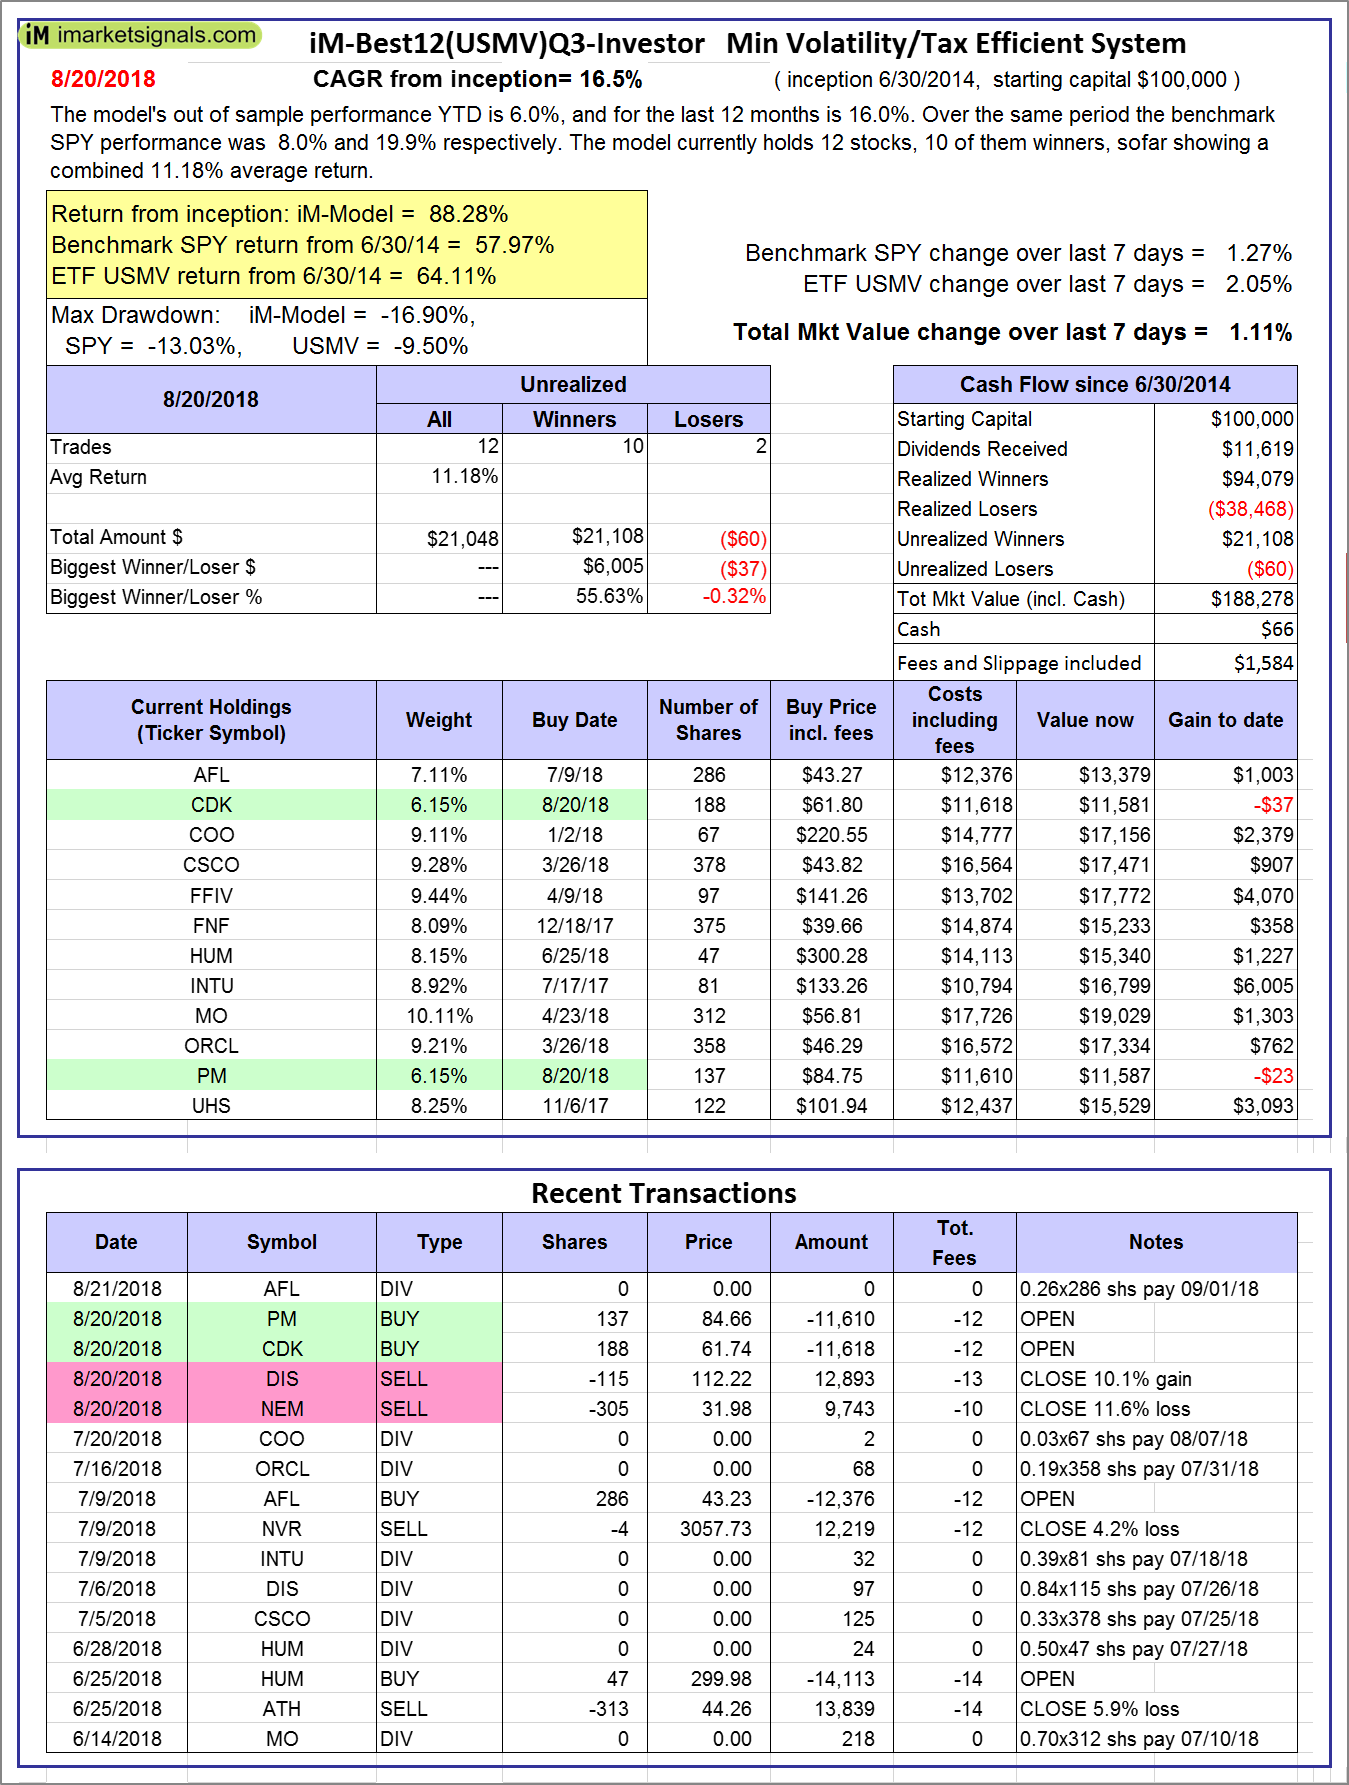
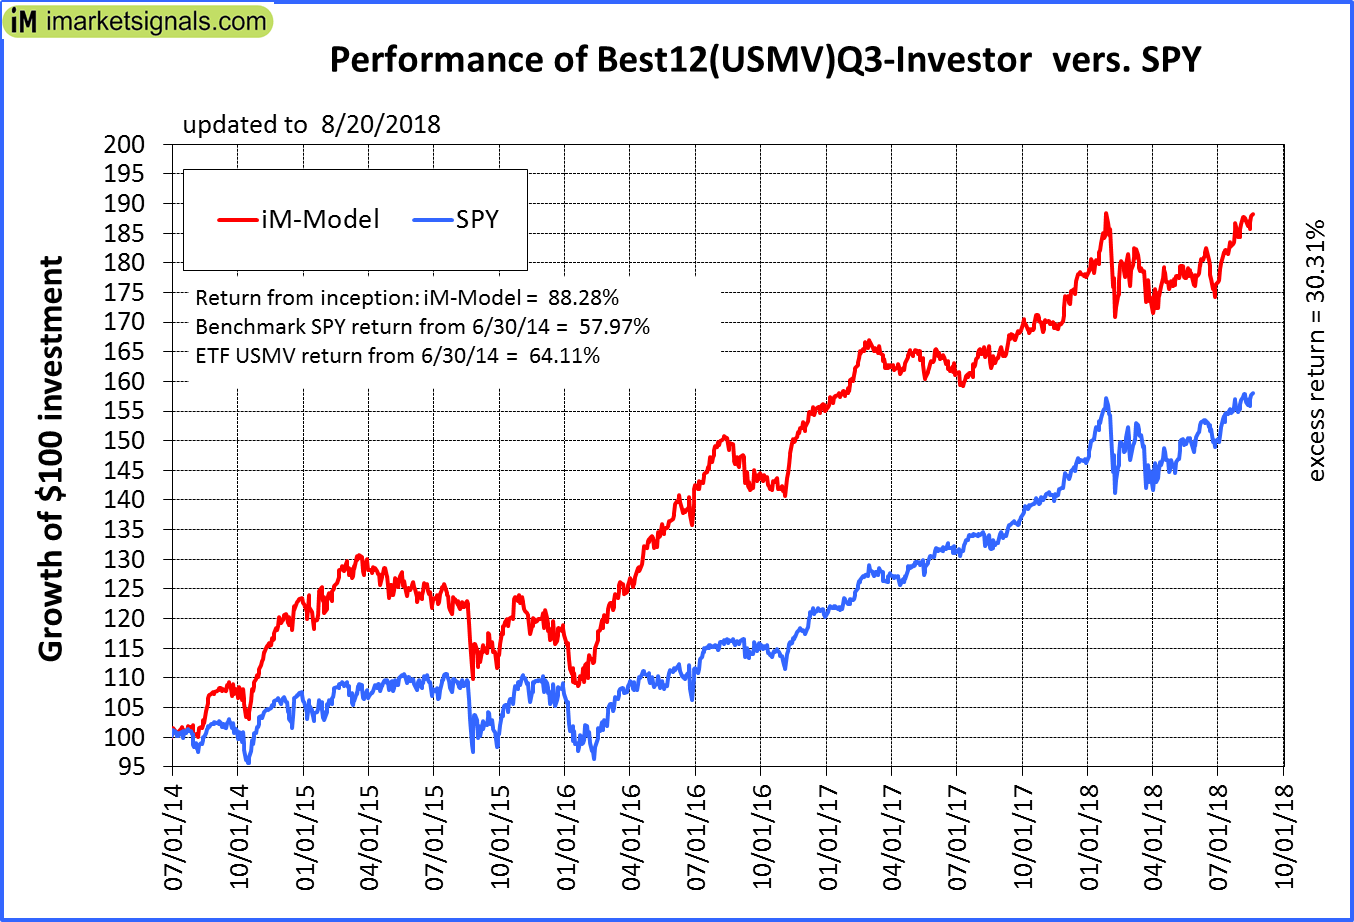
iM-Best12(USMV)Q3-Investor: The model’s out of sample performance YTD is 6.0%, and for the last 12 months is 16.0%. Over the same period the benchmark SPY performance was 8.0% and 19.9% respectively. Since inception, on 7/1/2014, the model gained 88.28% while the benchmark SPY gained 57.97% and the ETF USMV gained 64.11% over the same period. Over the previous week the market value of iM-Best12(USMV)Q3 gained 1.11% at a time when SPY gained 1.27%. A starting capital of $100,000 at inception on 7/1/2014 would have grown to $188,278 which includes $66 cash and excludes $1,584 spent on fees and slippage. |
|
|
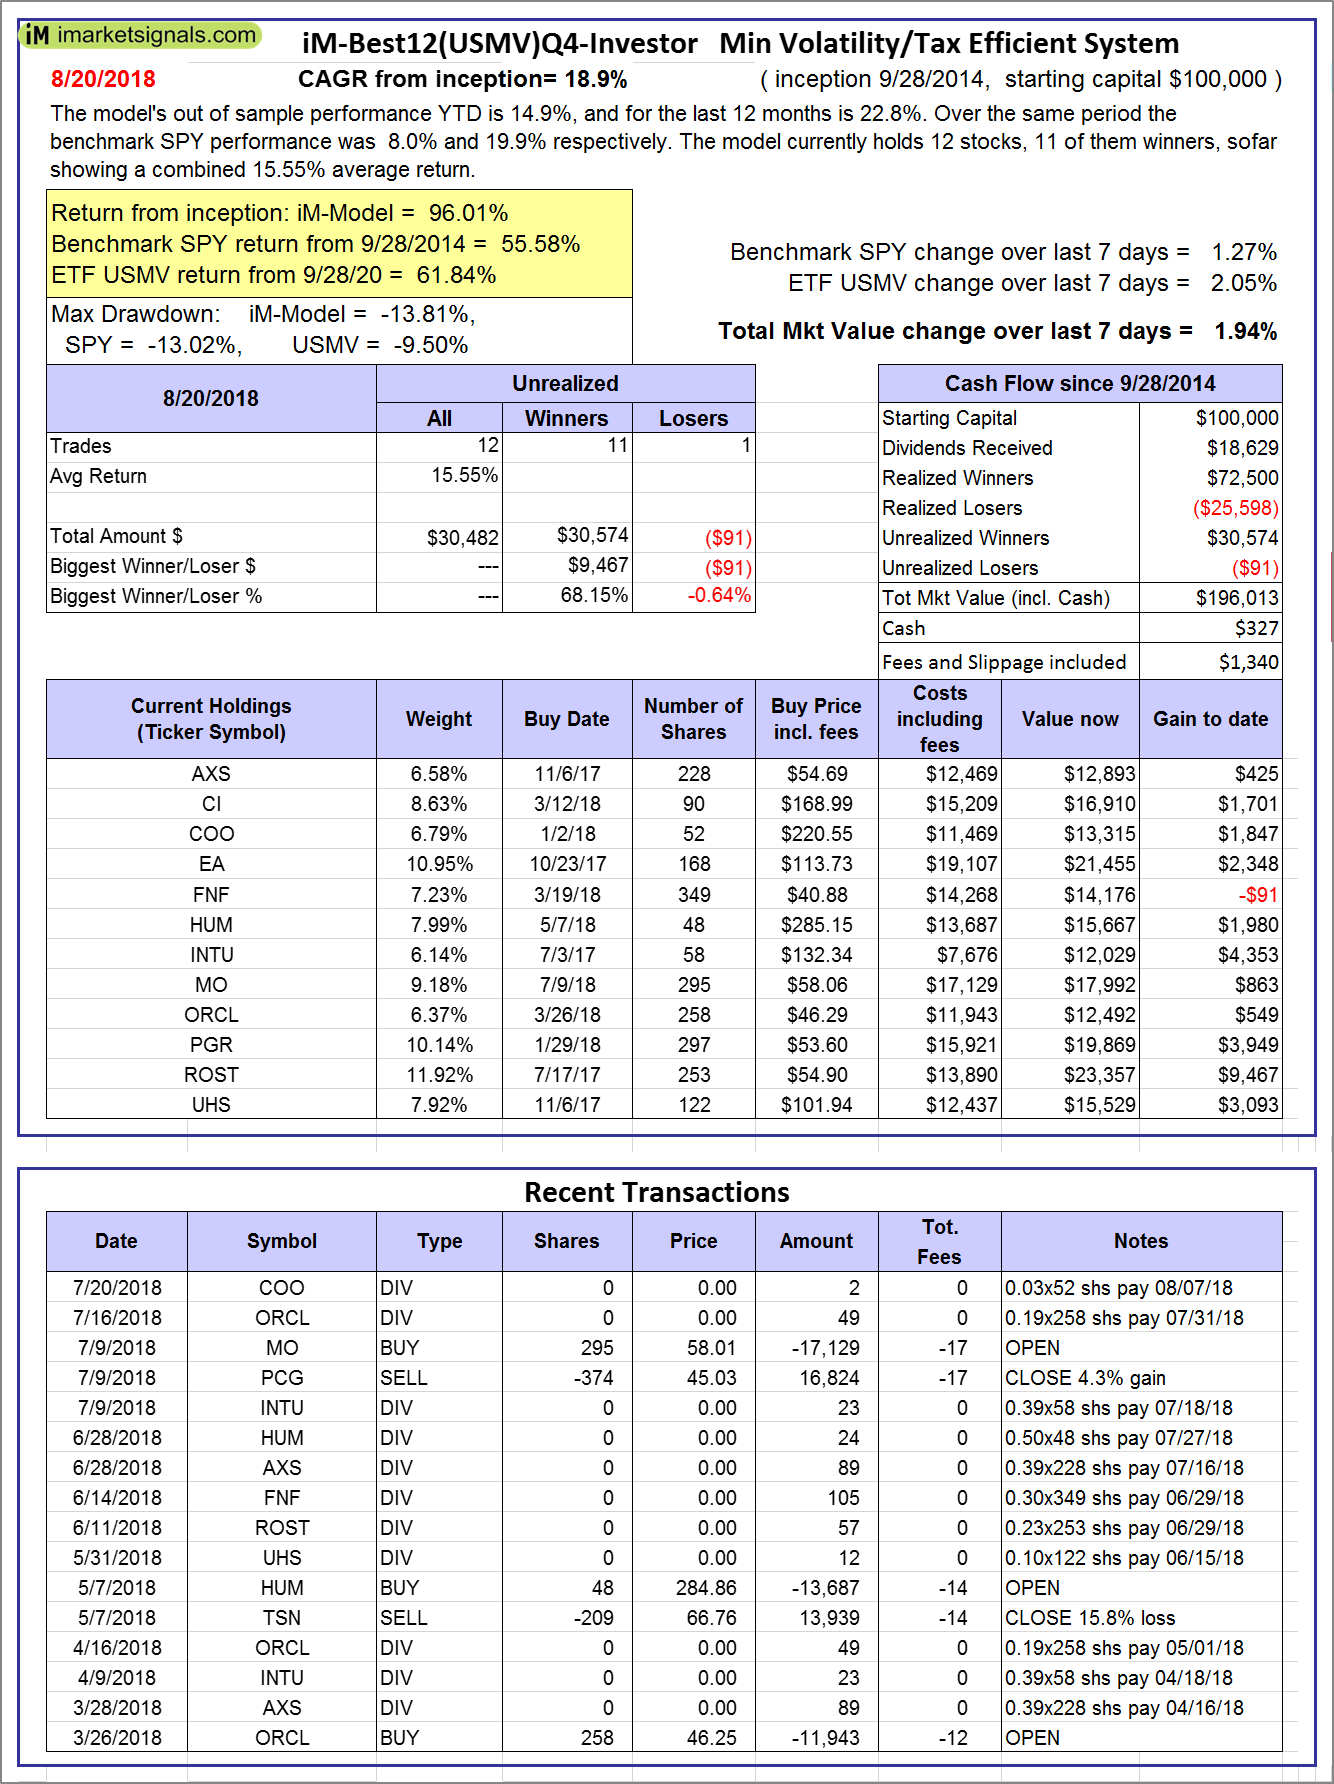
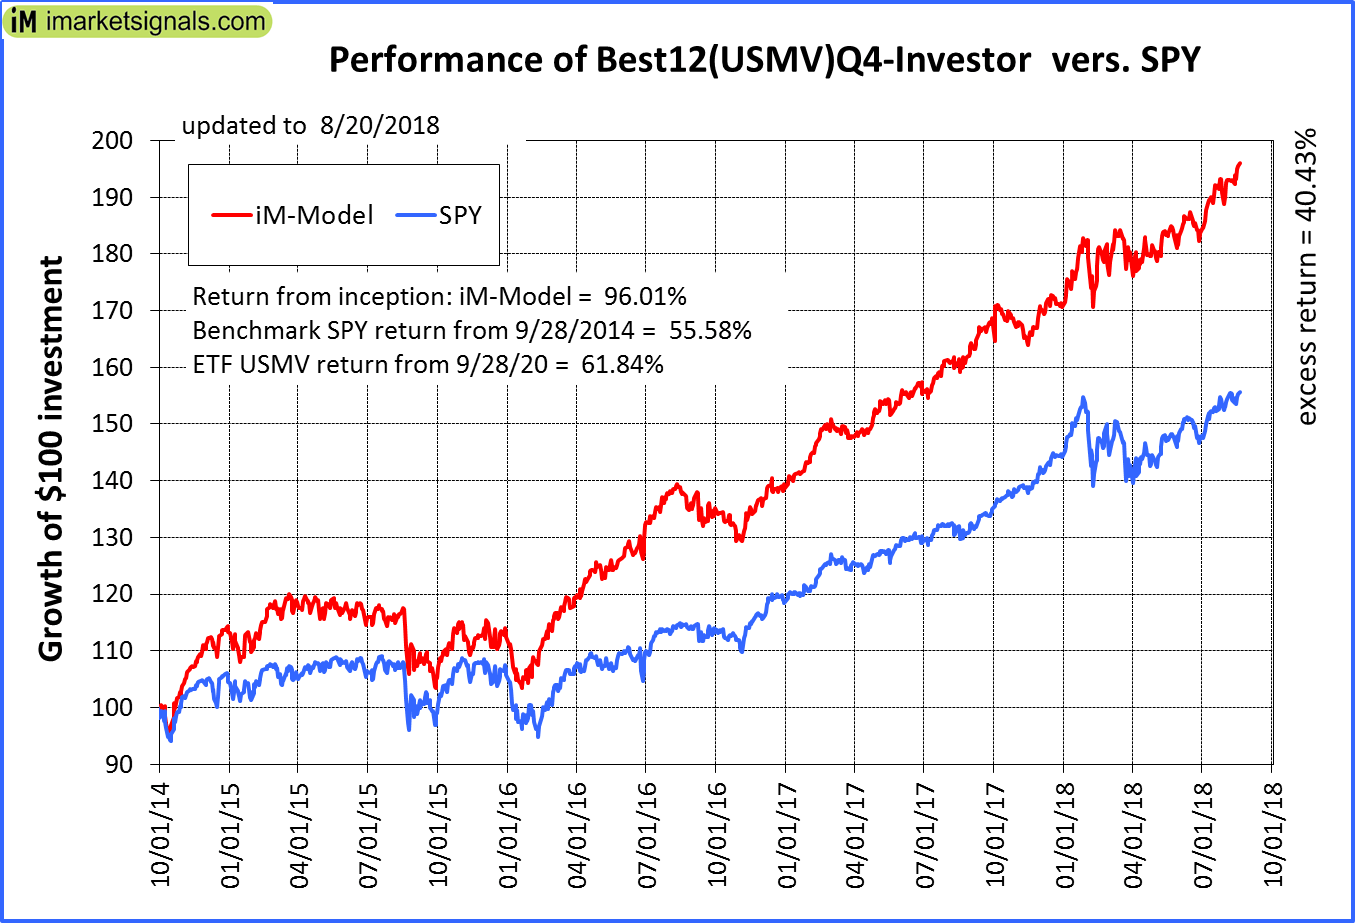
iM-Best12(USMV)Q4-Investor: Since inception, on 9/29/2014, the model gained 96.01% while the benchmark SPY gained 55.58% and the ETF USMV gained 61.84% over the same period. Over the previous week the market value of iM-Best12(USMV)Q4 gained 1.94% at a time when SPY gained 1.27%. A starting capital of $100,000 at inception on 9/29/2014 would have grown to $196,013 which includes $327 cash and excludes $1,340 spent on fees and slippage. |
|
|
Average Performance of iM-Best12(USMV)Q1+Q2+Q3+Q4-Investor resulted in an excess return of 45.97% over SPY. (see iM-USMV Investor Portfolio) |
|
|
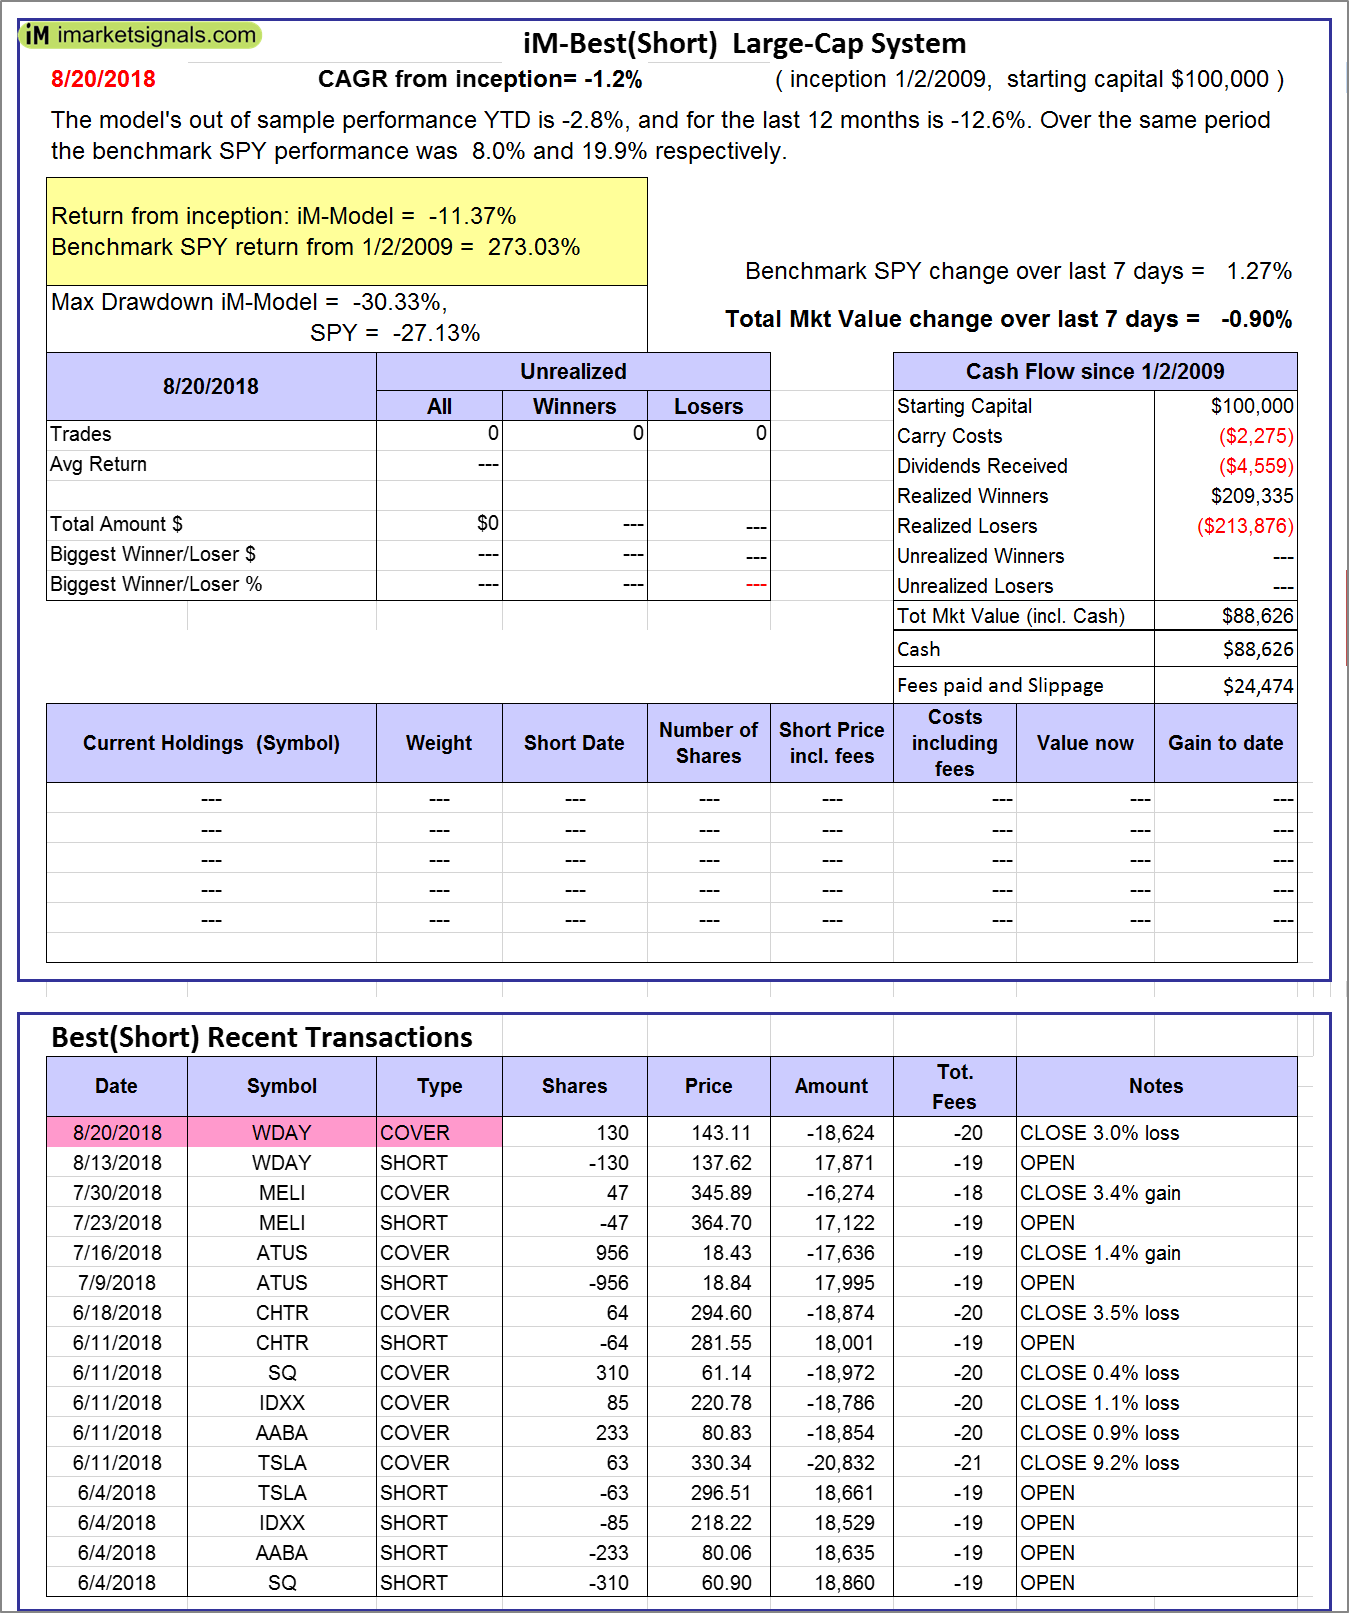
iM-Best(Short): The model’s out of sample performance YTD is -2.8%, and for the last 12 months is -12.6%. Over the same period the benchmark SPY performance was 8.0% and 19.9% respectively. Over the previous week the market value of iM-Best(Short) gained -0.90% at a time when SPY gained 1.27%. Over the period 1/2/2009 to 8/20/2018 the starting capital of $100,000 would have grown to $88,626 which includes $88,626 cash and excludes $24,474 spent on fees and slippage. |
|
|
iM-Best2 MC-Score ETF System: The model’s out of sample performance YTD is 2.7%, and for the last 12 months is 8.8%. Over the same period the benchmark SPY performance was 8.0% and 19.9% respectively. Over the previous week the market value of the iM-Best2 MC-Score ETF System gained 2.60% at a time when SPY gained 1.27%. A starting capital of $100,000 at inception on 6/30/2016 would have grown to $115,382 which includes $1,980 cash and excludes $115 spent on fees and slippage. |
|
|
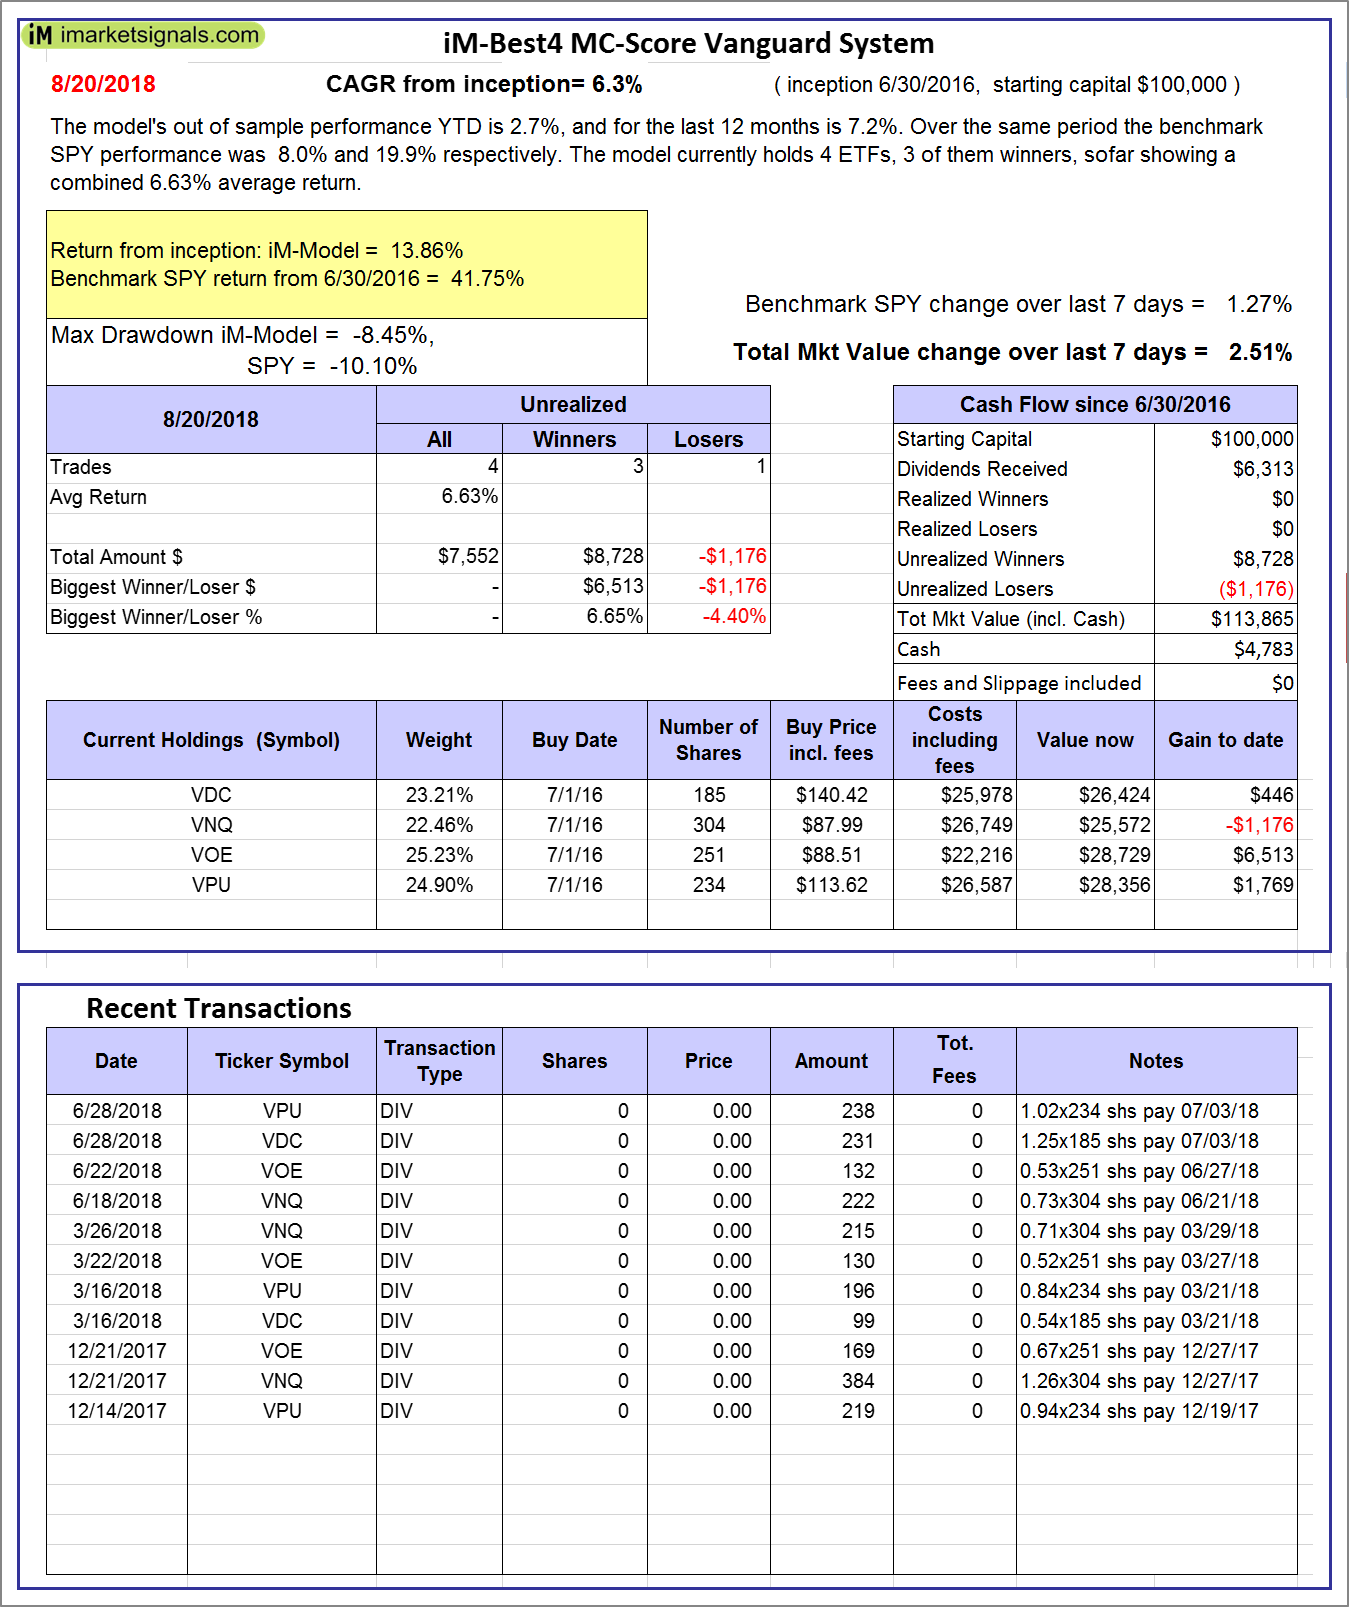
iM-Best4 MC-Score Vanguard System: The model’s out of sample performance YTD is 2.7%, and for the last 12 months is 7.2%. Over the same period the benchmark SPY performance was 8.0% and 19.9% respectively. Over the previous week the market value of the iM-Best4 MC-Score Vanguard System gained 2.51% at a time when SPY gained 1.27%. A starting capital of $100,000 at inception on 6/30/2016 would have grown to $113,865 which includes $4,783 cash and excludes $00 spent on fees and slippage. |
|
|
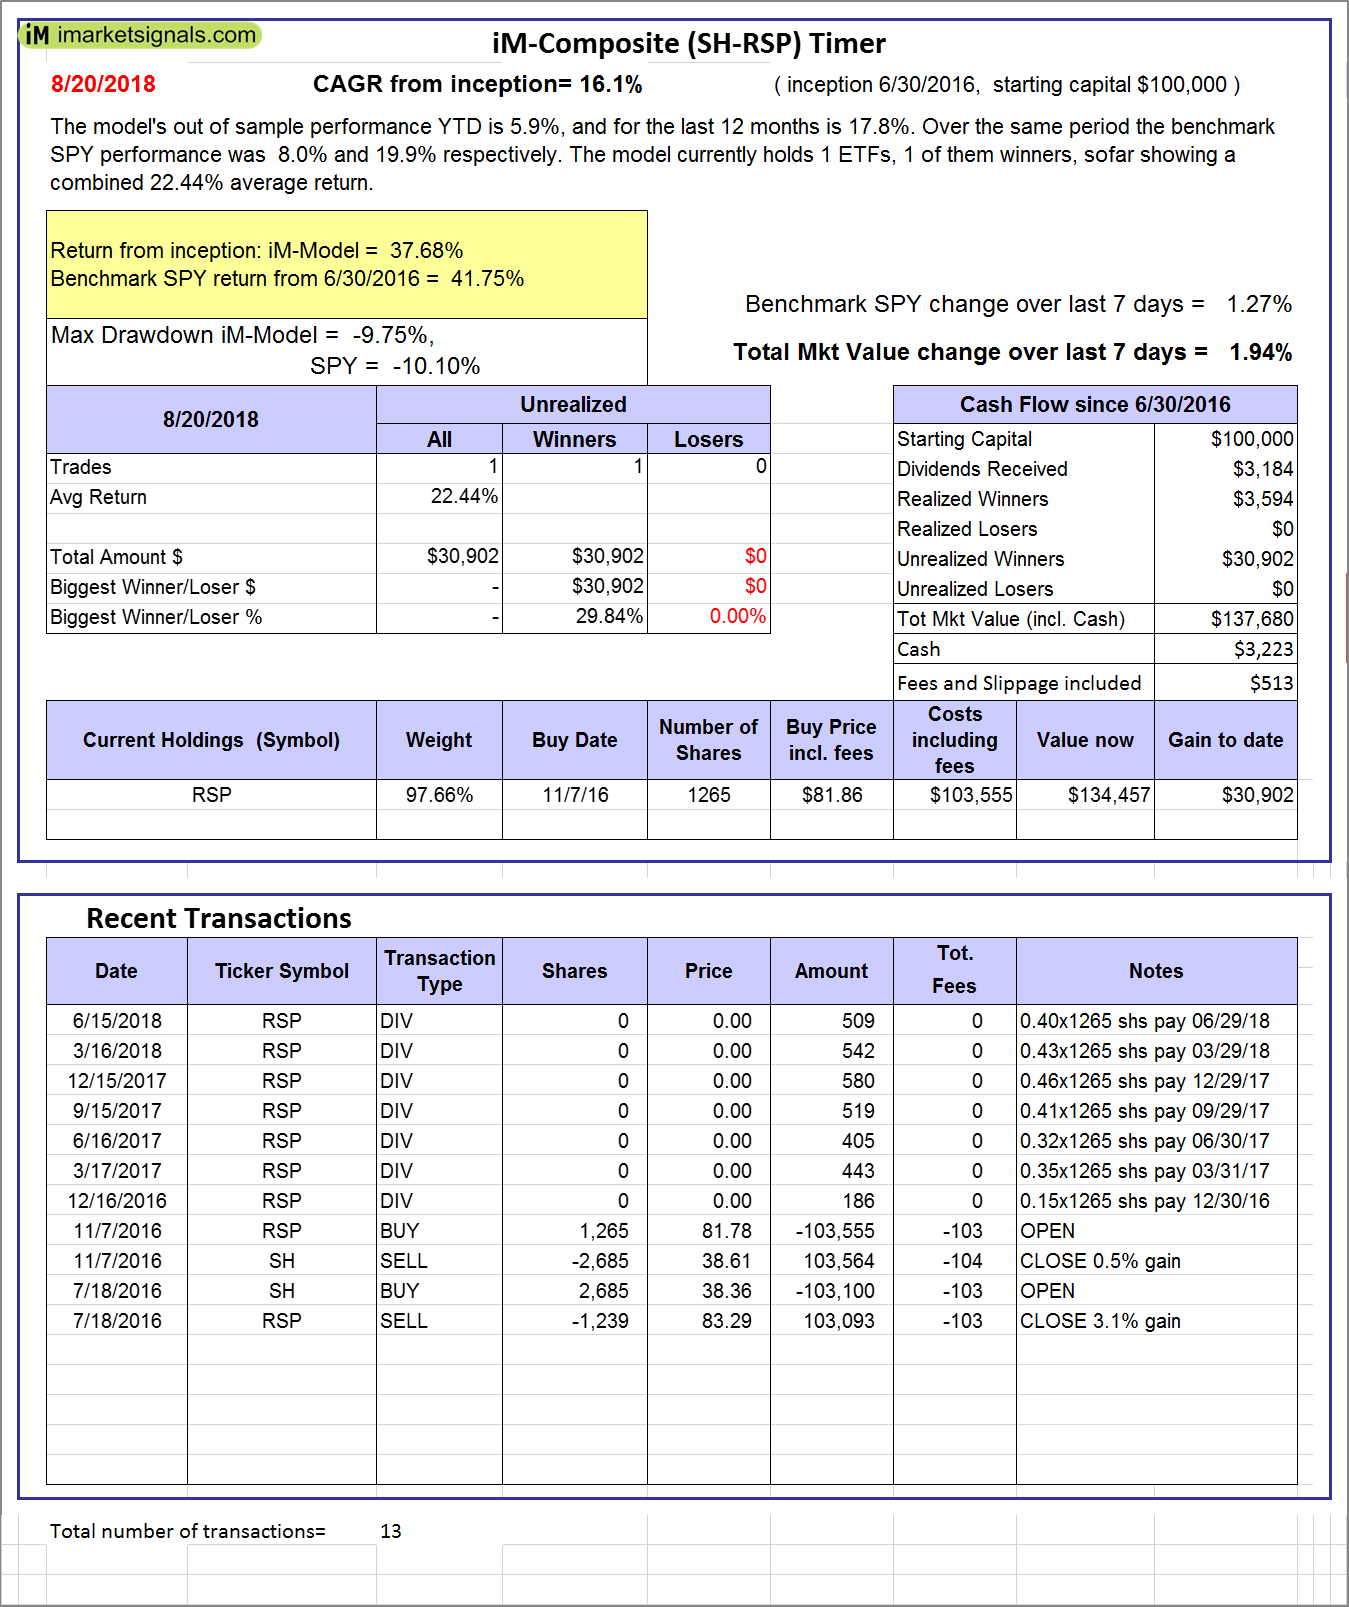
iM-Composite (SH-RSP) Timer: The model’s out of sample performance YTD is 5.9%, and for the last 12 months is 17.8%. Over the same period the benchmark SPY performance was 8.0% and 19.9% respectively. Over the previous week the market value of the iM-Composite (SH-RSP) Timer gained 1.94% at a time when SPY gained 1.27%. A starting capital of $100,000 at inception on 6/30/2016 would have grown to $137,680 which includes $3,223 cash and excludes $513 spent on fees and slippage. |
|
|
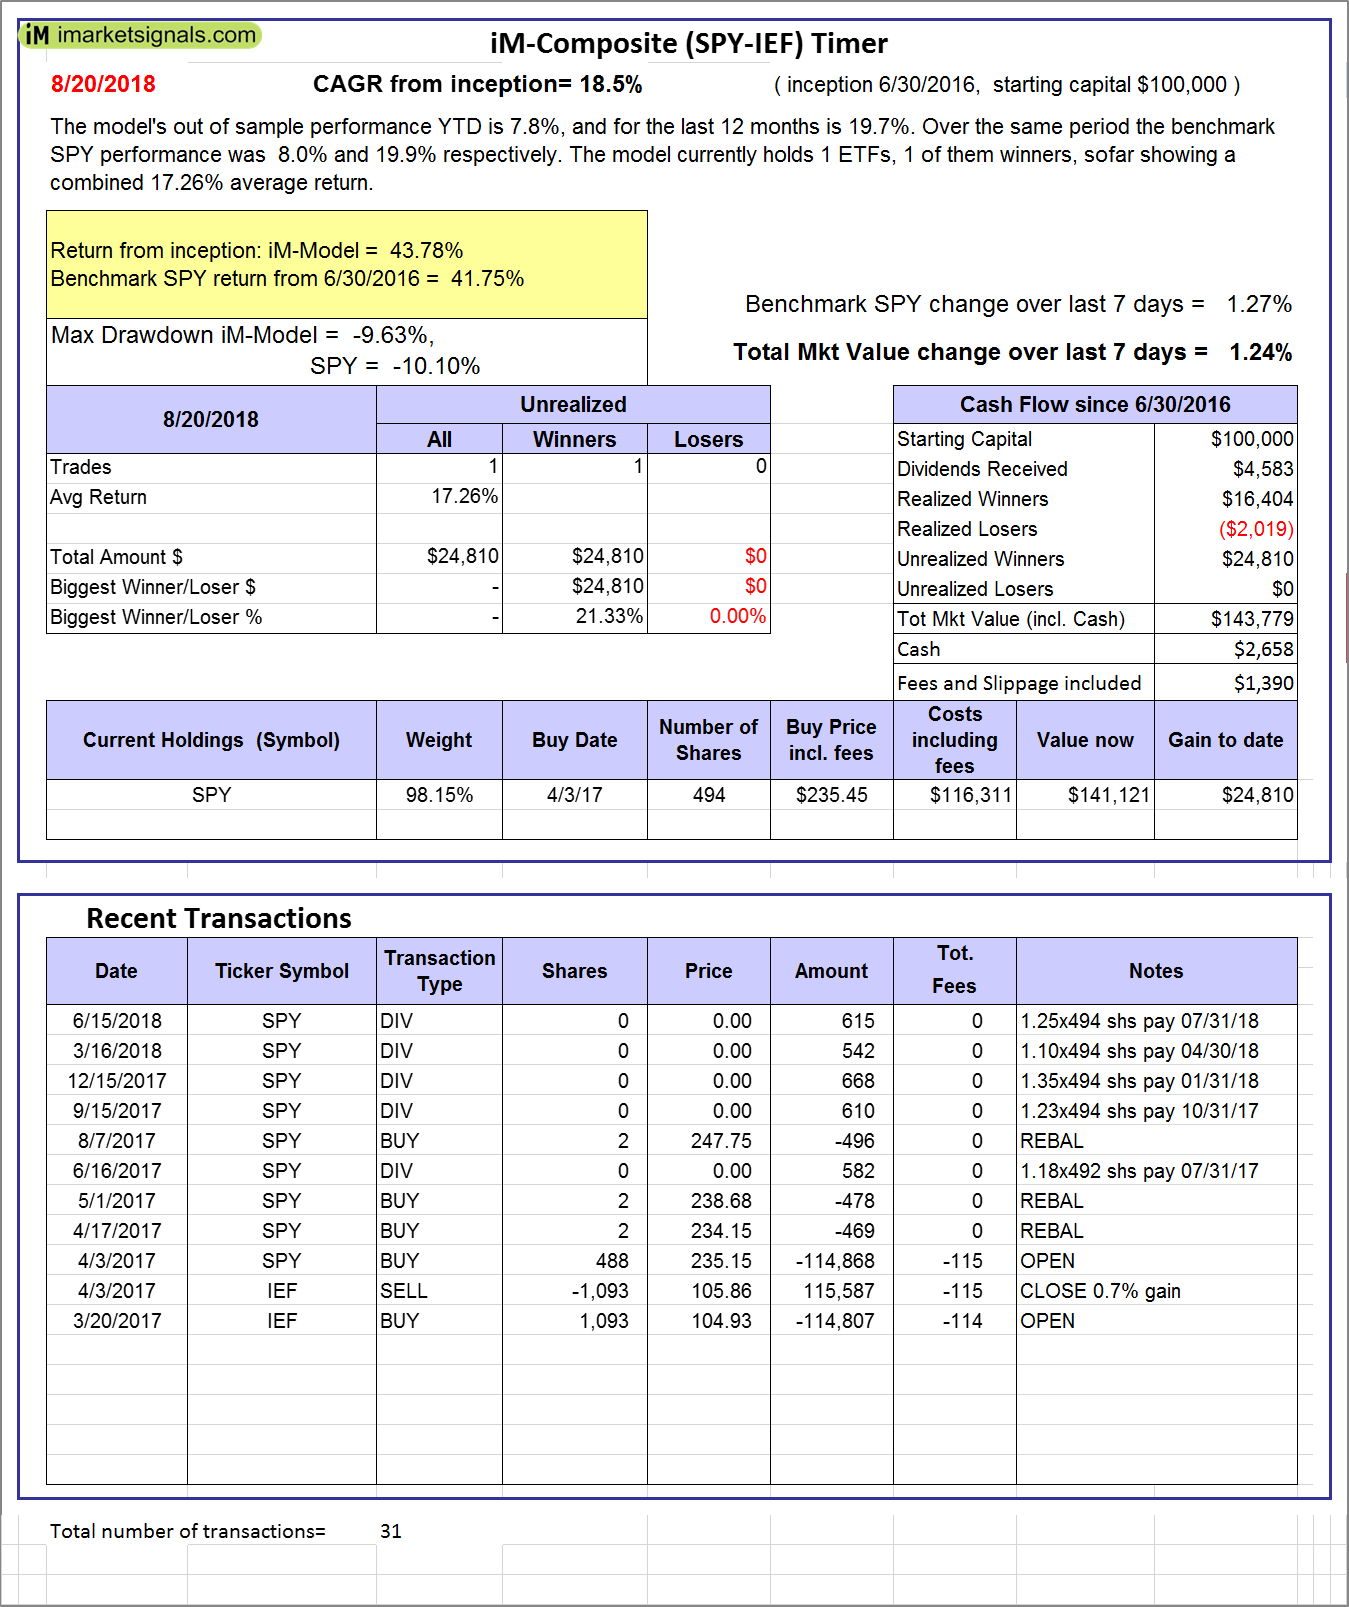
iM-Composite (SPY-IEF) Timer: The model’s out of sample performance YTD is 7.8%, and for the last 12 months is 19.7%. Over the same period the benchmark SPY performance was 8.0% and 19.9% respectively. Over the previous week the market value of the iM-Composite (SPY-IEF) Timer gained 1.24% at a time when SPY gained 1.27%. A starting capital of $100,000 at inception on 6/30/2016 would have grown to $143,779 which includes $2,658 cash and excludes $1,390 spent on fees and slippage. |
|
|
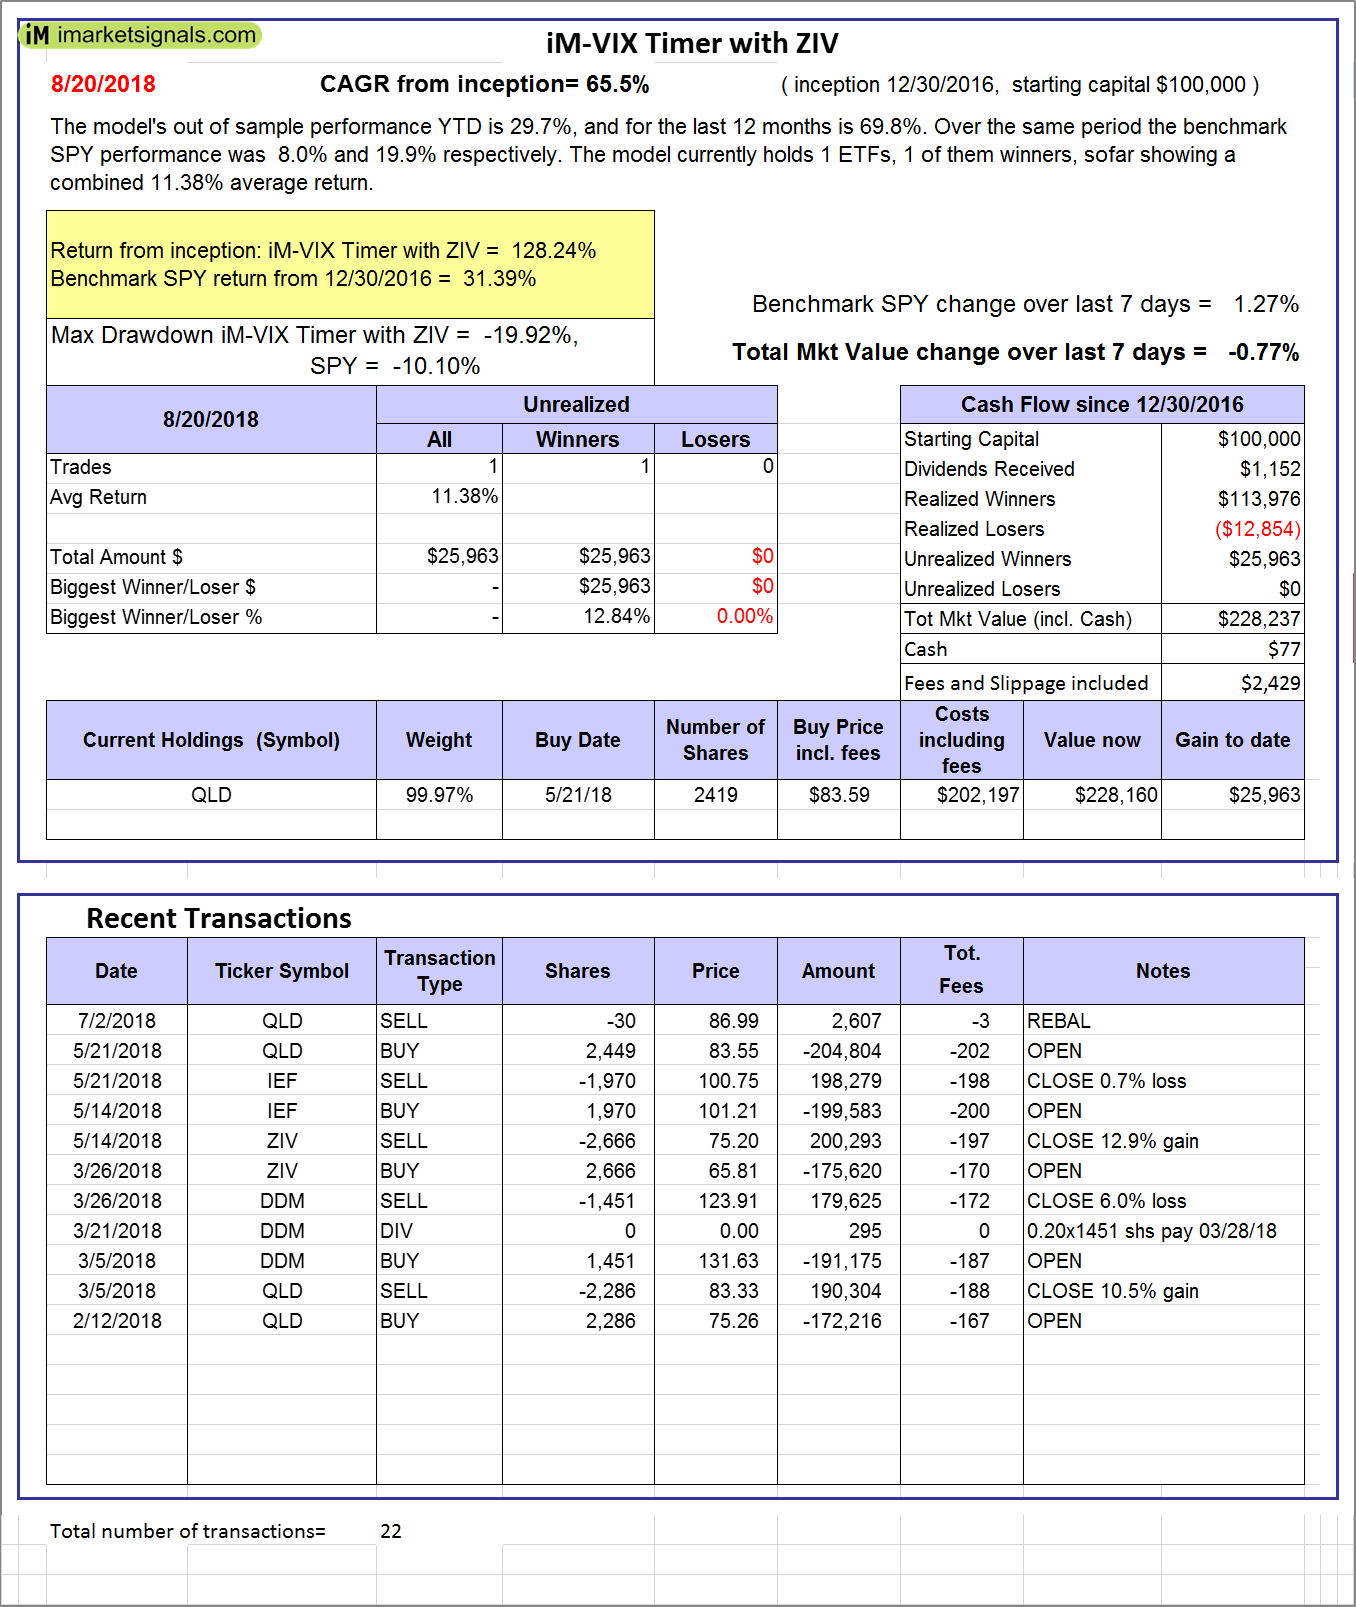
iM-VIX Timer with ZIV: The model’s out of sample performance YTD is 29.7%, and for the last 12 months is 69.8%. Over the same period the benchmark SPY performance was 8.0% and 19.9% respectively. Over the previous week the market value of the iM-VIX Timer with ZIV gained -0.77% at a time when SPY gained 1.27%. A starting capital of $100,000 at inception on 6/30/2016 would have grown to $228,237 which includes $77 cash and excludes $2,429 spent on fees and slippage. |
|
|
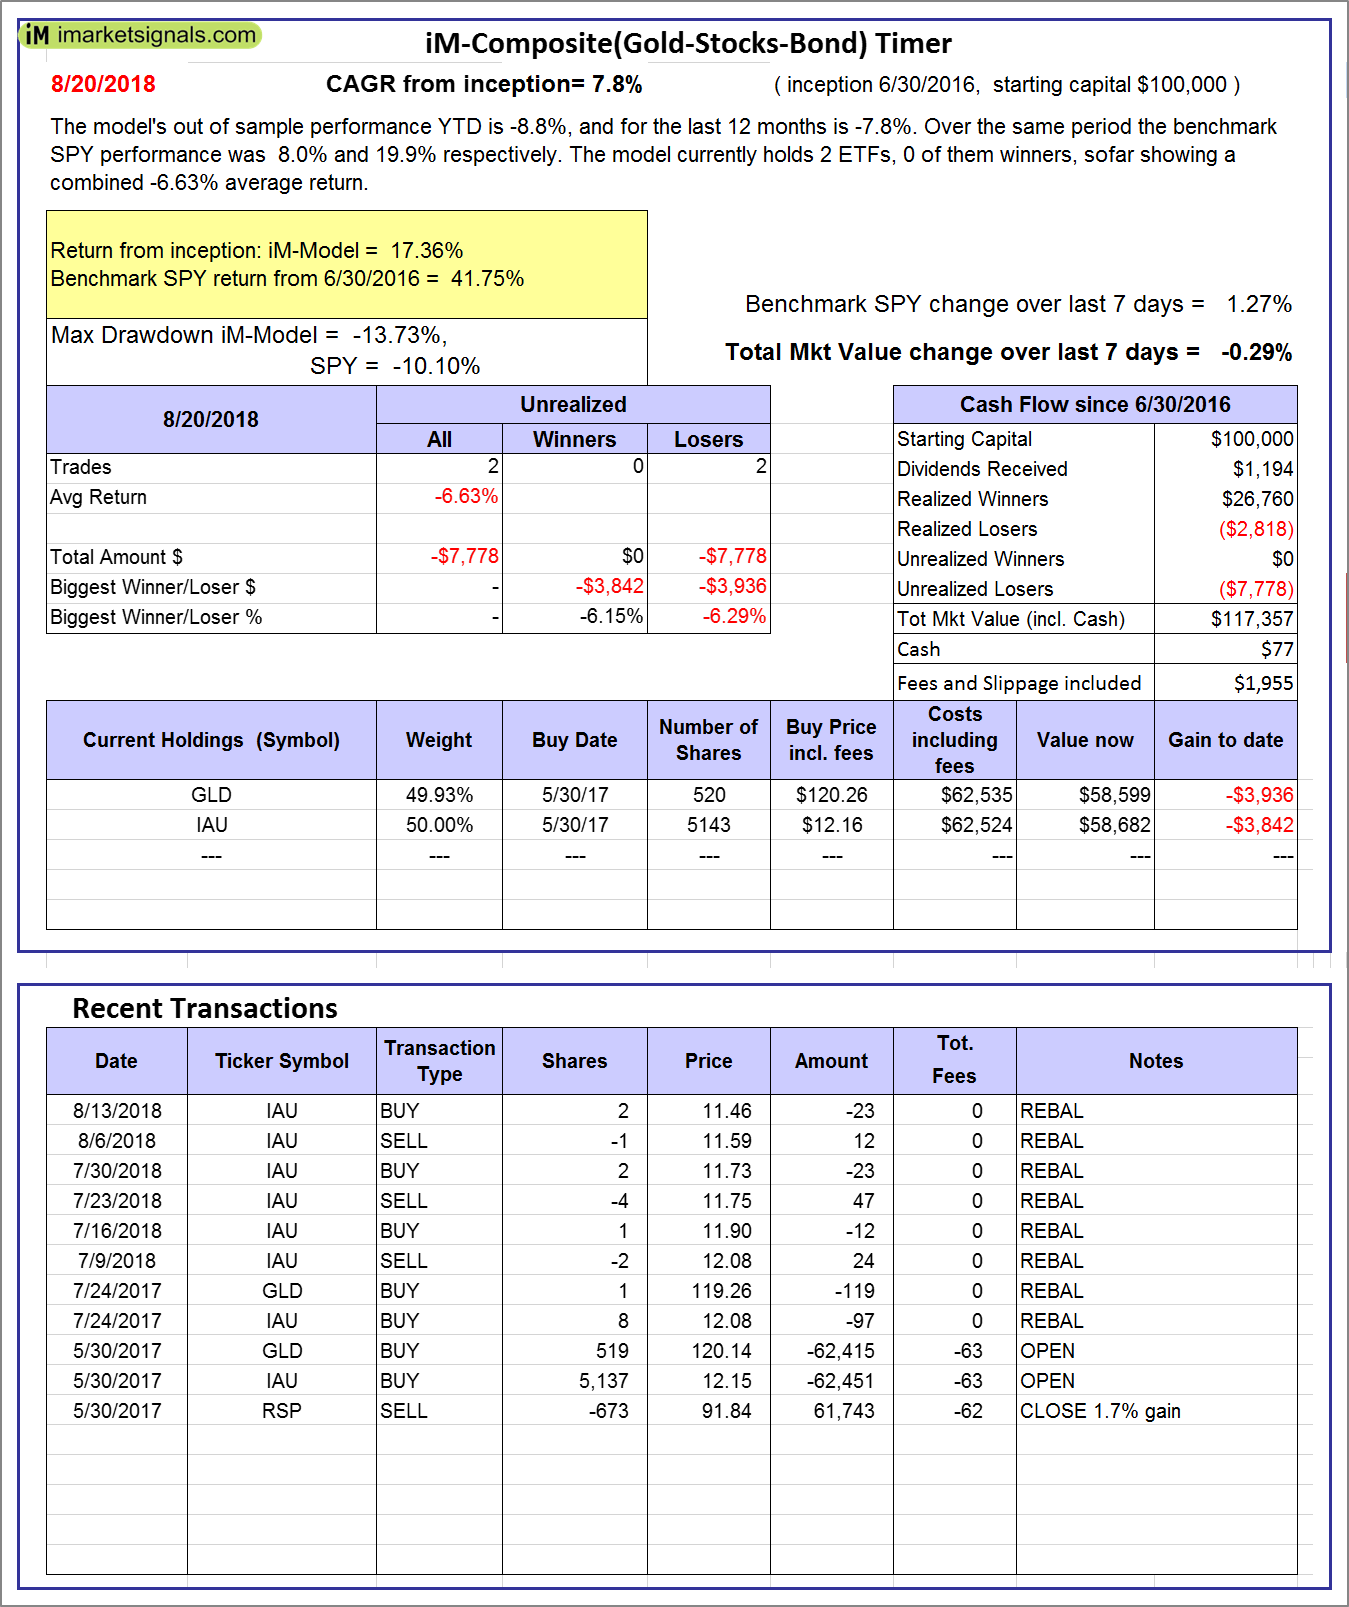
iM-Composite(Gold-Stocks-Bond) Timer: The model’s out of sample performance YTD is -8.8%, and for the last 12 months is -7.8%. Over the same period the benchmark SPY performance was 8.0% and 19.9% respectively. Over the previous week the market value of the iM-Composite(Gold-Stocks-Bond) Timer gained -0.29% at a time when SPY gained 1.27%. A starting capital of $100,000 at inception on 6/30/2016 would have grown to $117,357 which includes $77 cash and excludes $1,955 spent on fees and slippage. |
|
|
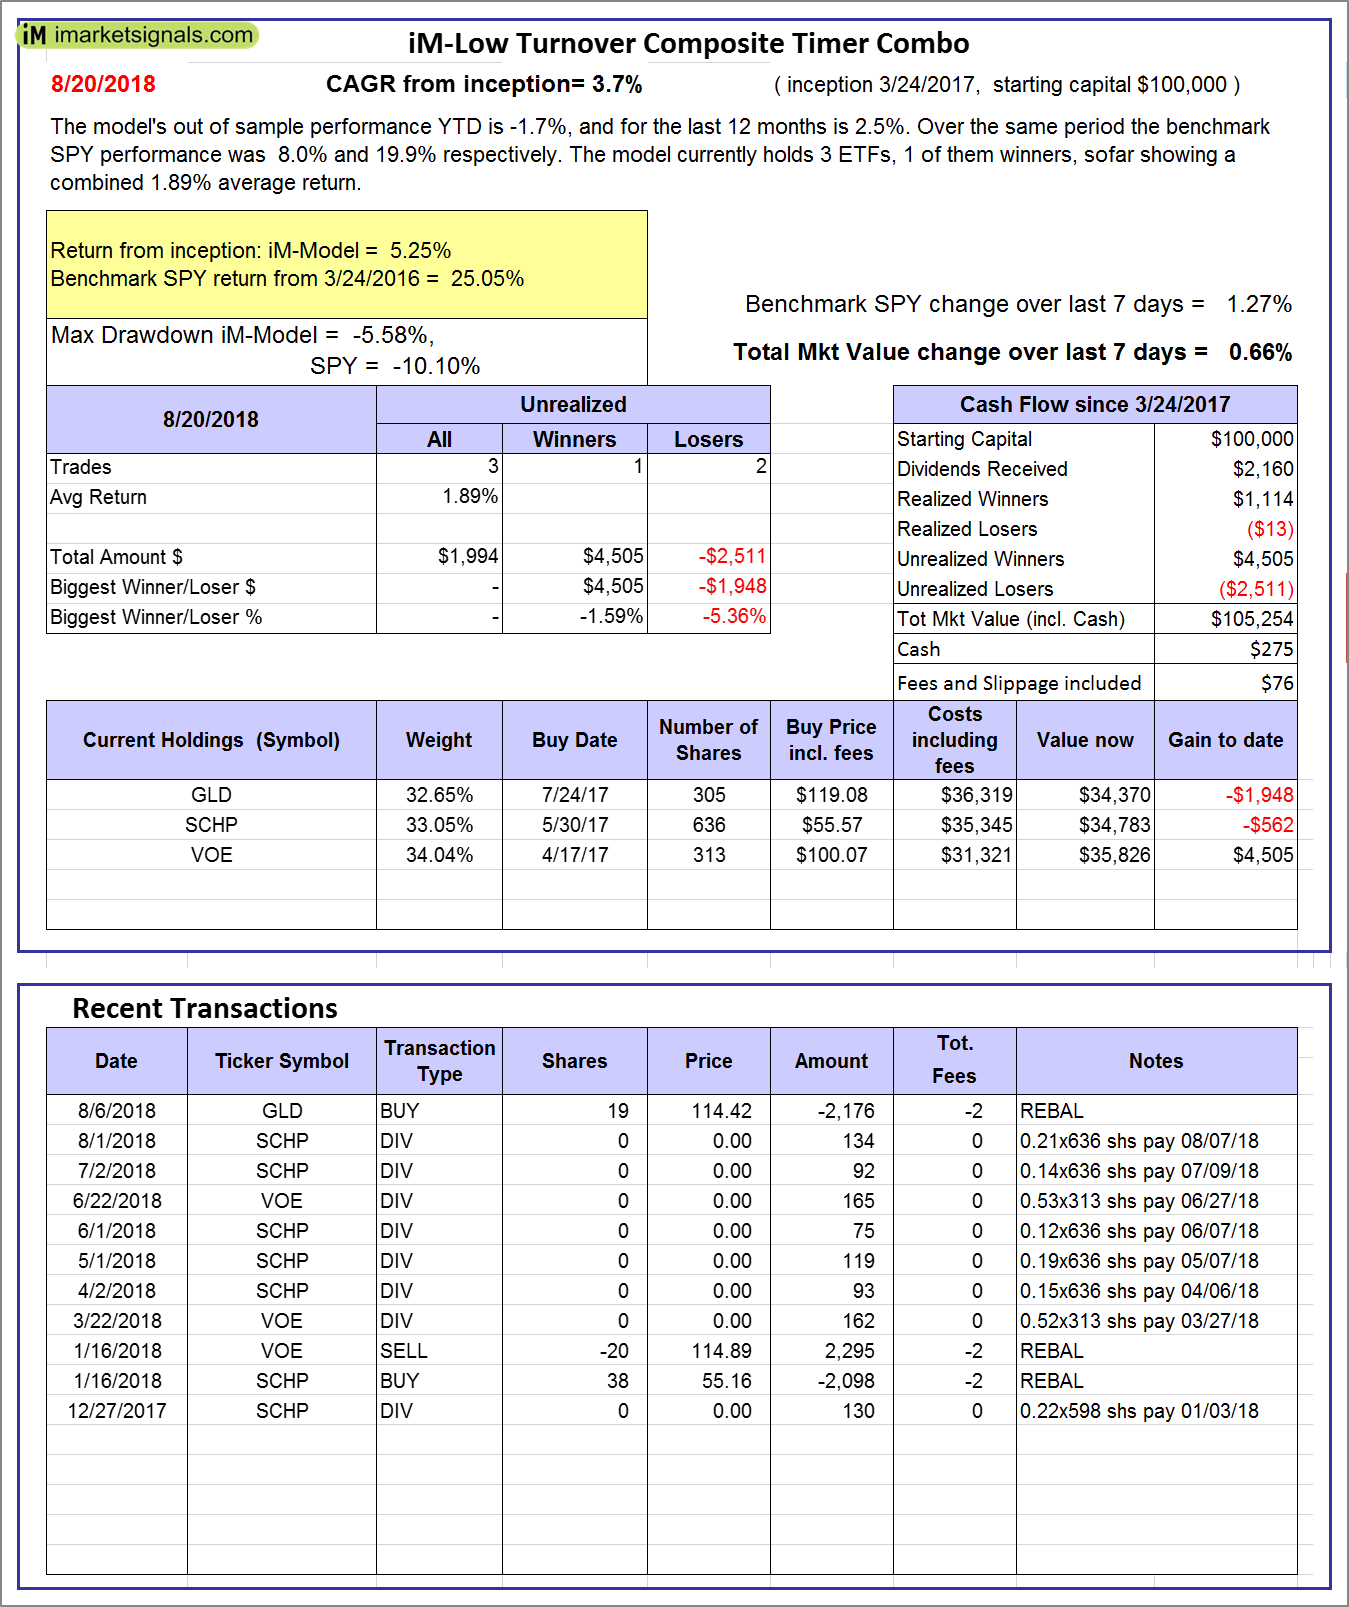
iM-Low Turnover Composite Timer Combo: The model’s out of sample performance YTD is -1.7%, and for the last 12 months is 2.5%. Over the same period the benchmark SPY performance was 8.0% and 19.9% respectively. Over the previous week the market value of the iM-Low Turnover Composite Timer Combo gained 0.66% at a time when SPY gained 1.27%. A starting capital of $100,000 at inception on 3/24/27 would have grown to $105,254 which includes $275 cash and excludes $76 spent on fees and slippage. |
|
|
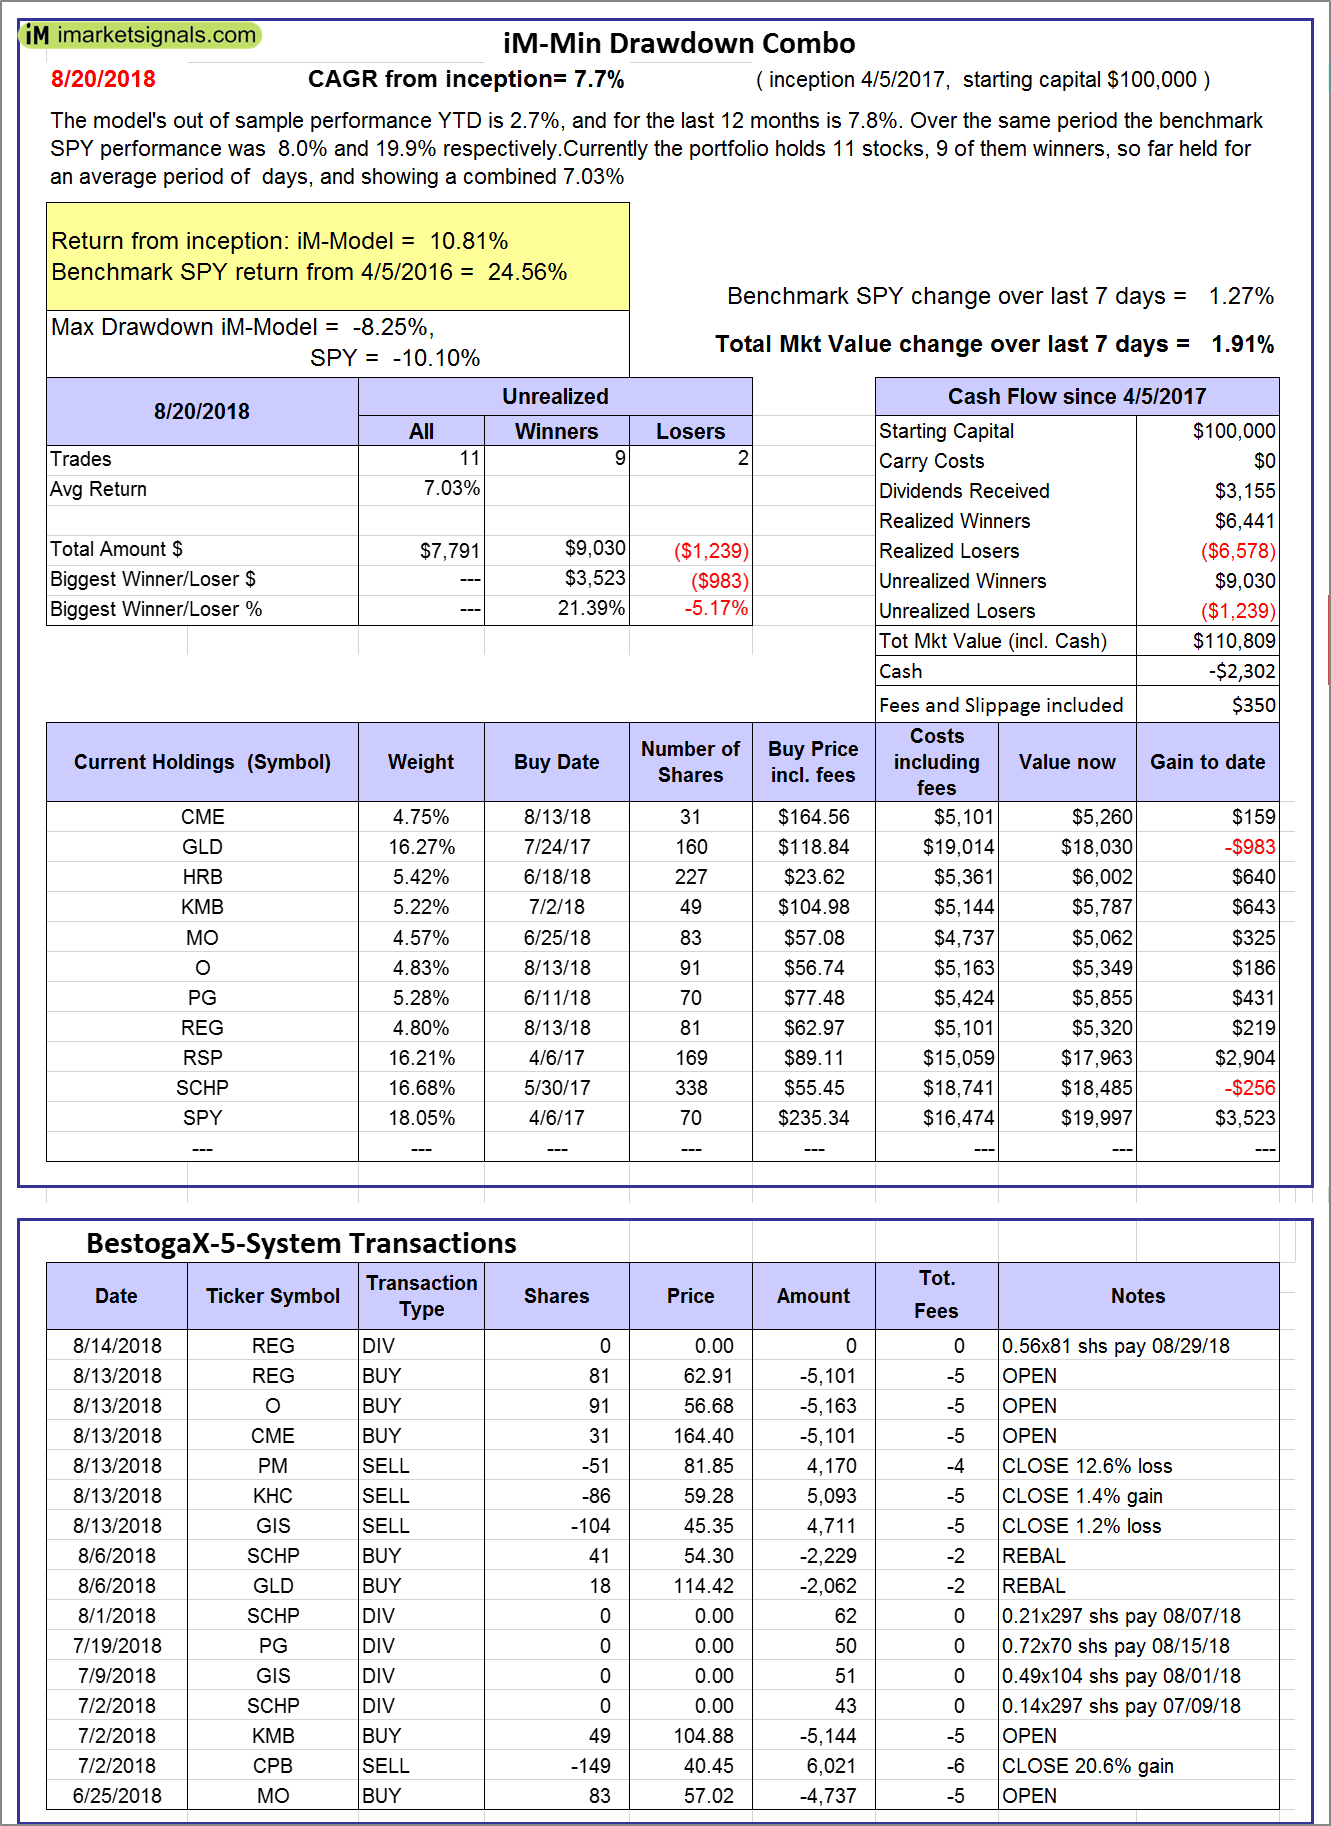
iM-Min Drawdown Combo: The model’s out of sample performance YTD is 2.7%, and for the last 12 months is 7.8%. Over the same period the benchmark SPY performance was 8.0% and 19.9% respectively. Over the previous week the market value of the iM-Min Drawdown Combo gained 1.91% at a time when SPY gained 1.27%. A starting capital of $100,000 at inception on 4/5/2017 would have grown to $110,809 which includes -$2,302 cash and excludes $350 spent on fees and slippage. |
|
|
iM-5ETF Trader (includes leveraged ETFs): The model’s out of sample performance YTD is 14.6%, and for the last 12 months is 40.4%. Over the same period the benchmark SPY performance was 8.0% and 19.9% respectively. Over the previous week the market value of the iM-5ETF Trader (includes leveraged ETFs) gained 1.99% at a time when SPY gained 1.27%. A starting capital of $100,000 at inception on 10/30/2016 would have grown to $186,541 which includes $1,539 cash and excludes $1,030 spent on fees and slippage. |
|
|
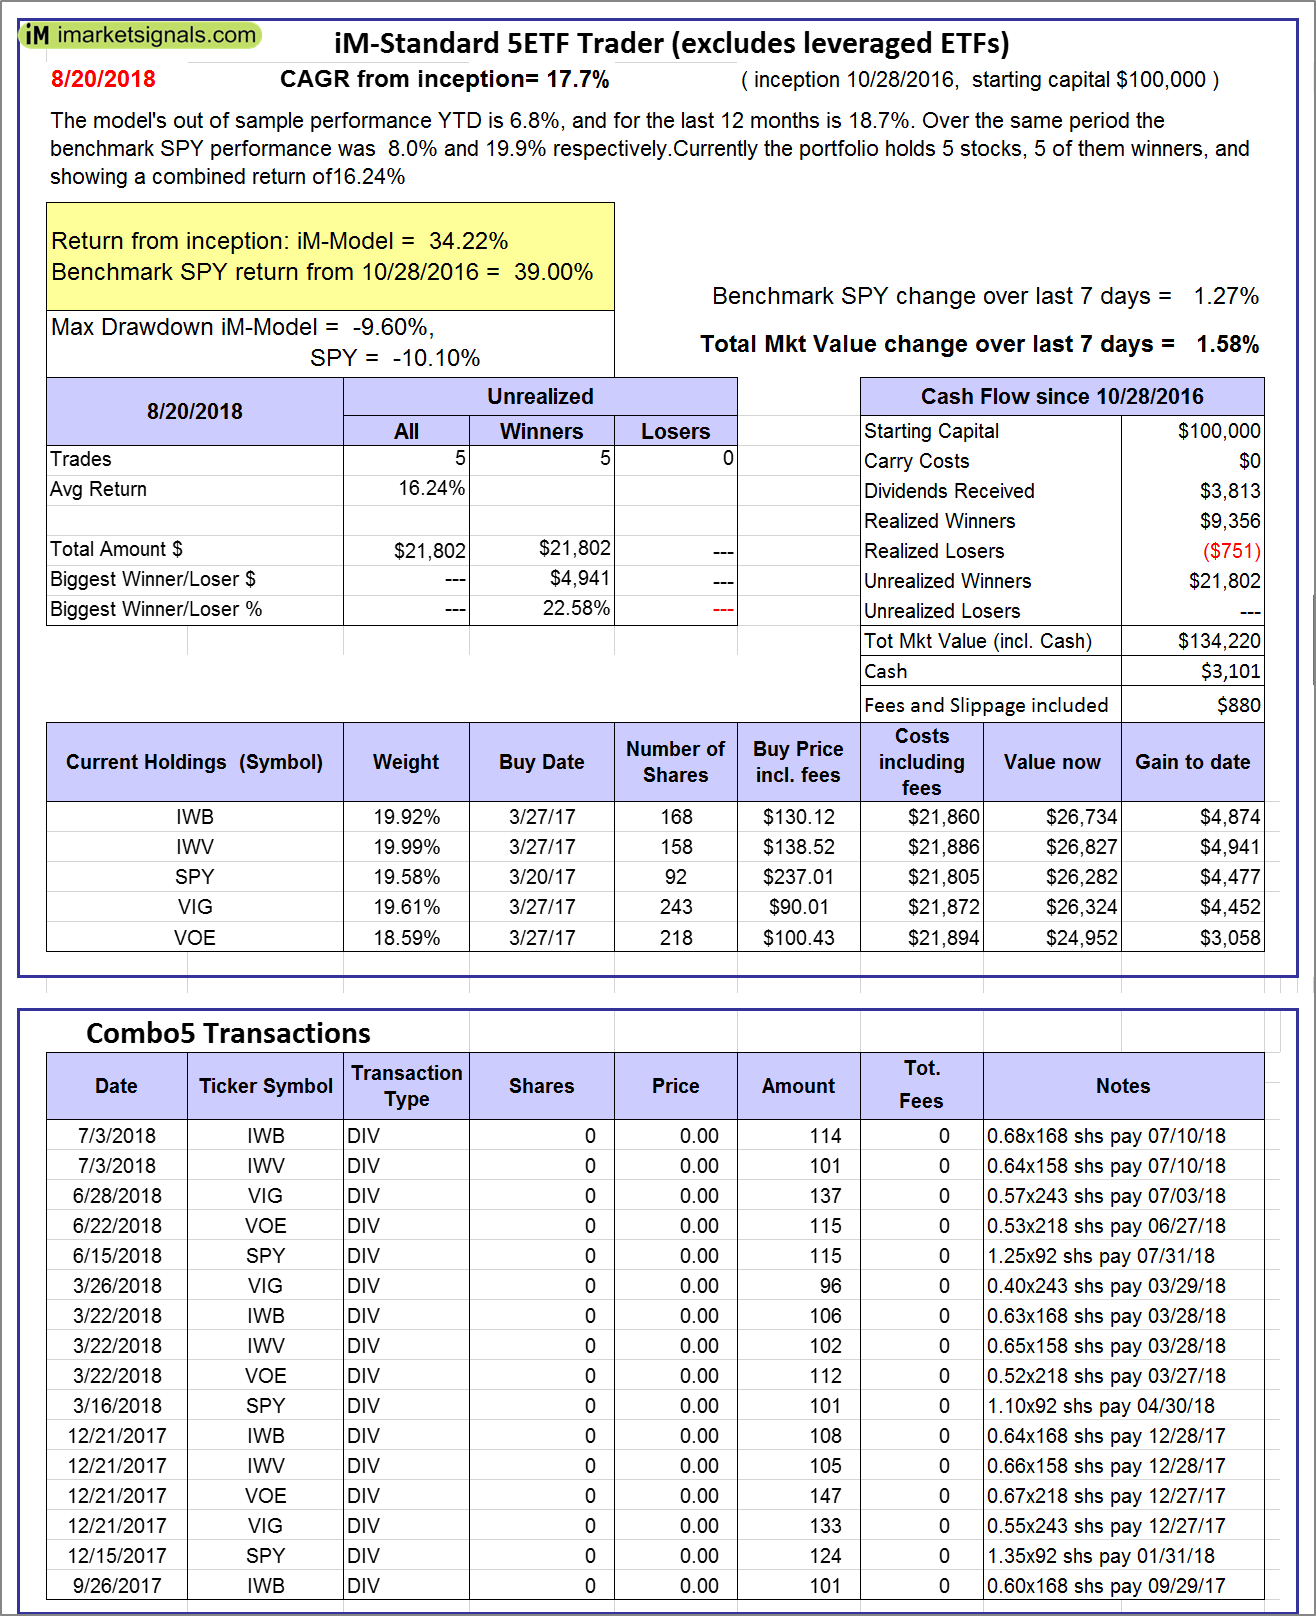
iM-Standard 5ETF Trader (excludes leveraged ETFs): The model’s out of sample performance YTD is 6.8%, and for the last 12 months is 18.7%. Over the same period the benchmark SPY performance was 8.0% and 19.9% respectively. Over the previous week the market value of the iM-Standard 5ETF Trader (excludes leveraged ETFs) gained 1.58% at a time when SPY gained 1.27%. A starting capital of $100,000 at inception on 10/30/2016 would have grown to $134,220 which includes $3,101 cash and excludes $880 spent on fees and slippage. |


Leave a Reply
You must be logged in to post a comment.