
  |
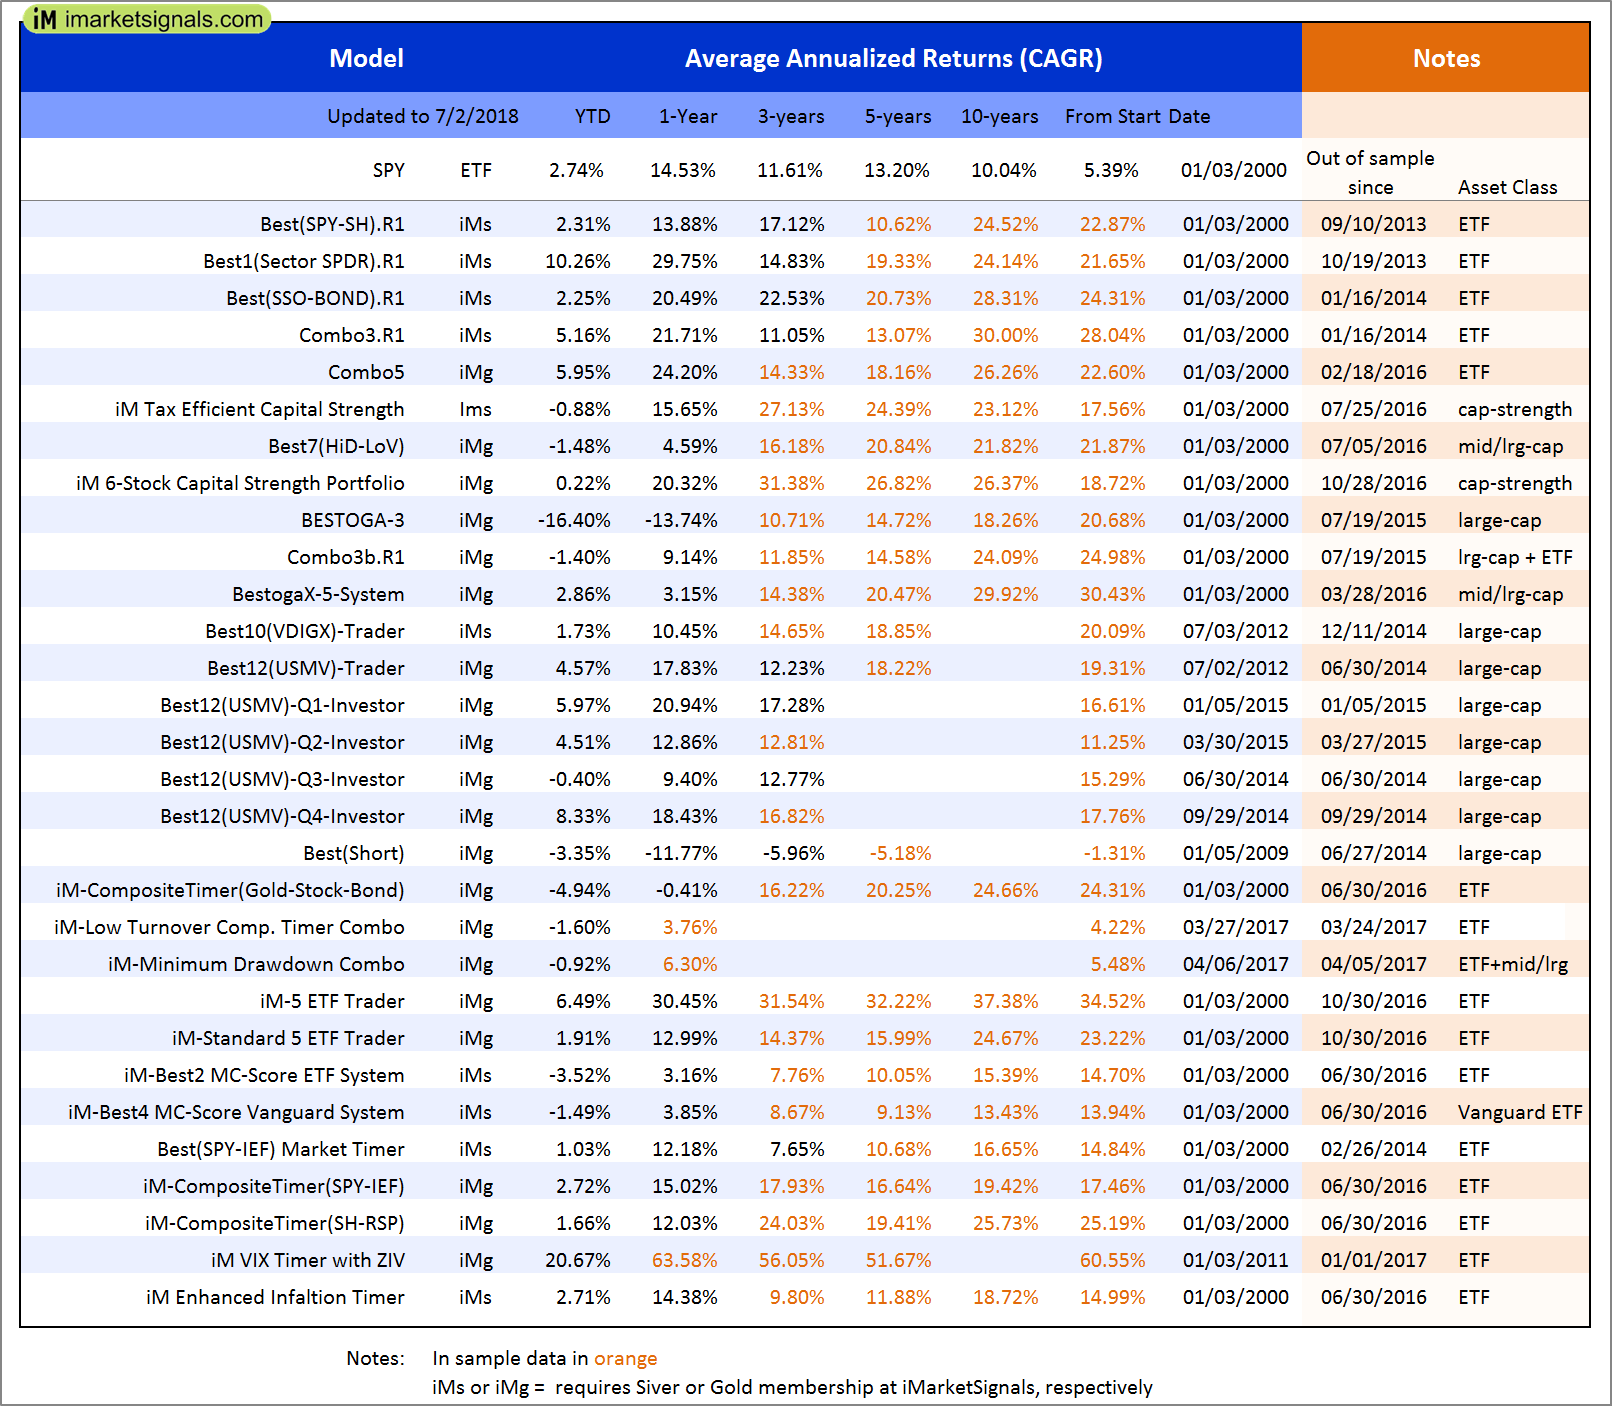
Out of sample performance summary of our models for the past 1, 2, 4 and 13 week periods. The active active return indicates how the models over- or underperformed the benchmark ETF SPY. Also the YTD, and the 1-, 3-, 5- and 10-year annualized returns are shown in the second table |
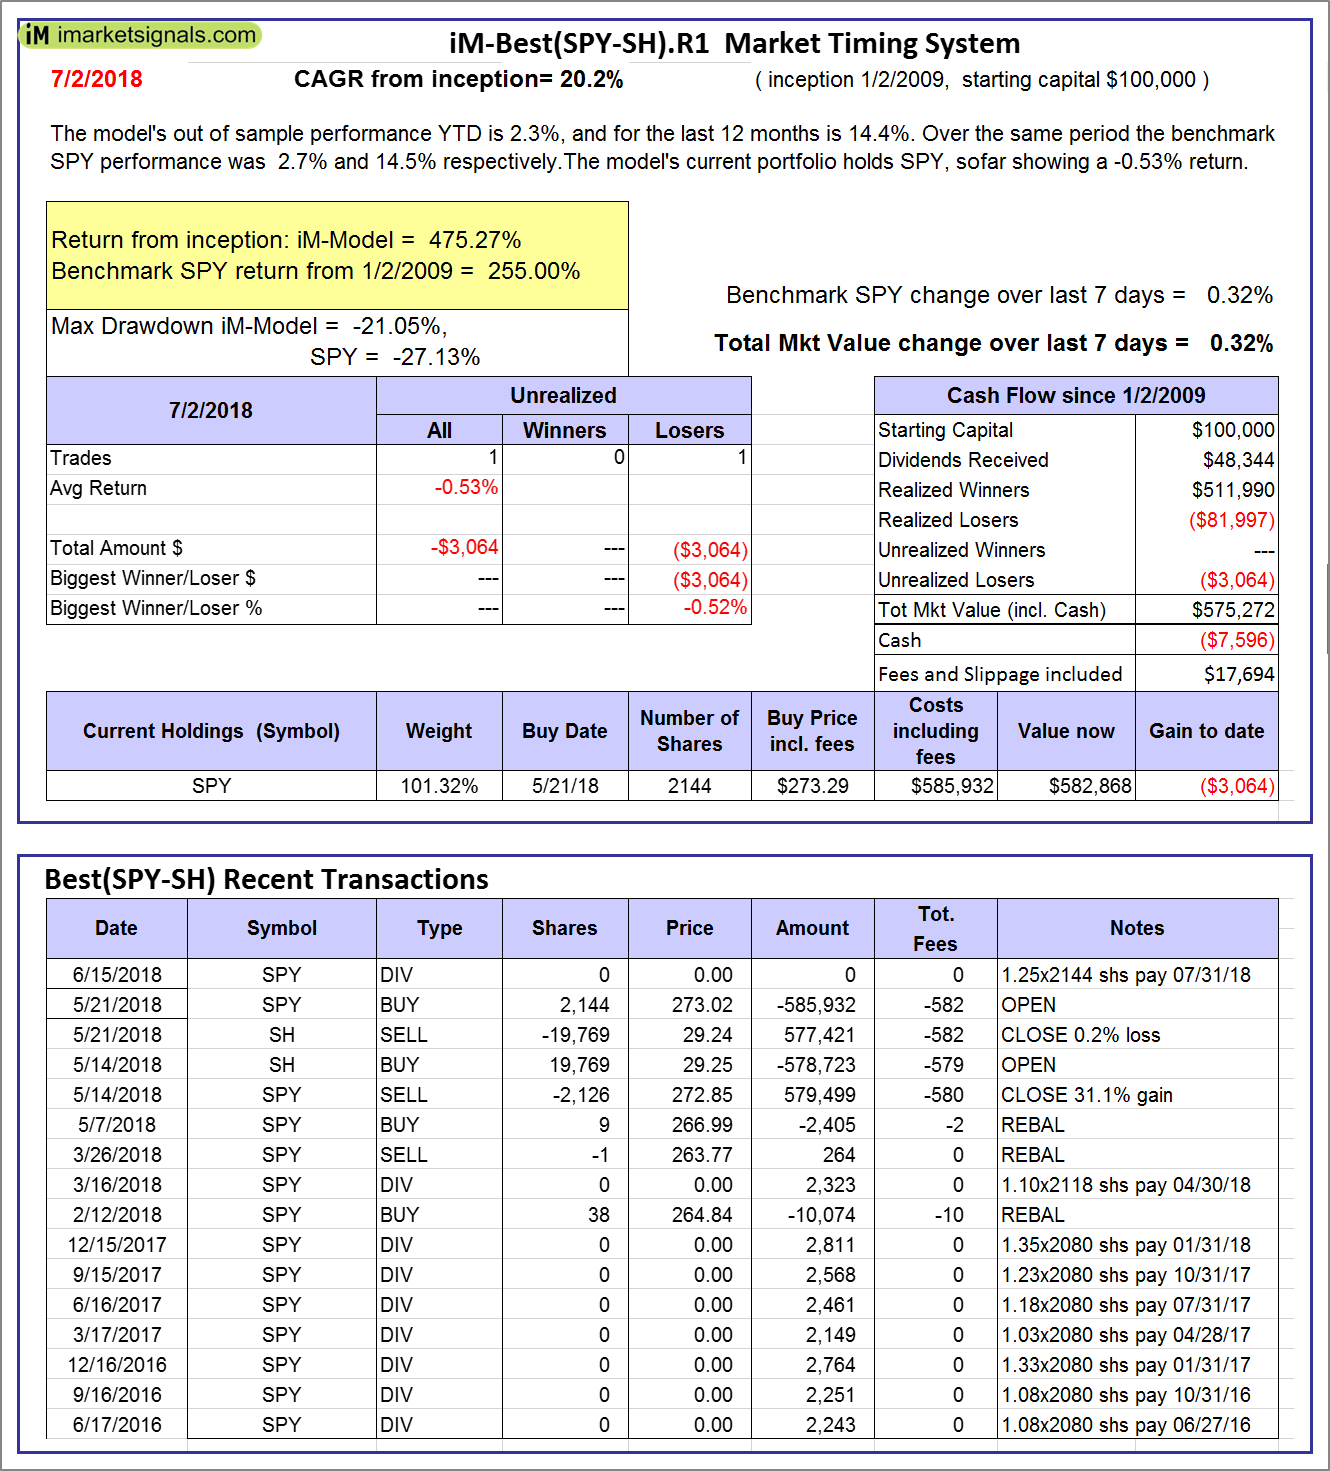 |
iM-Best(SPY-SH).R1: The model’s out of sample performance YTD is 2.3%, and for the last 12 months is 14.4%. Over the same period the benchmark SPY performance was 2.7% and 14.5% respectively. Over the previous week the market value of Best(SPY-SH) gained 0.32% at a time when SPY gained 0.32%. A starting capital of $100,000 at inception on 1/2/2009 would have grown to $575,272 which includes -$7,596 cash and excludes $17,694 spent on fees and slippage. |
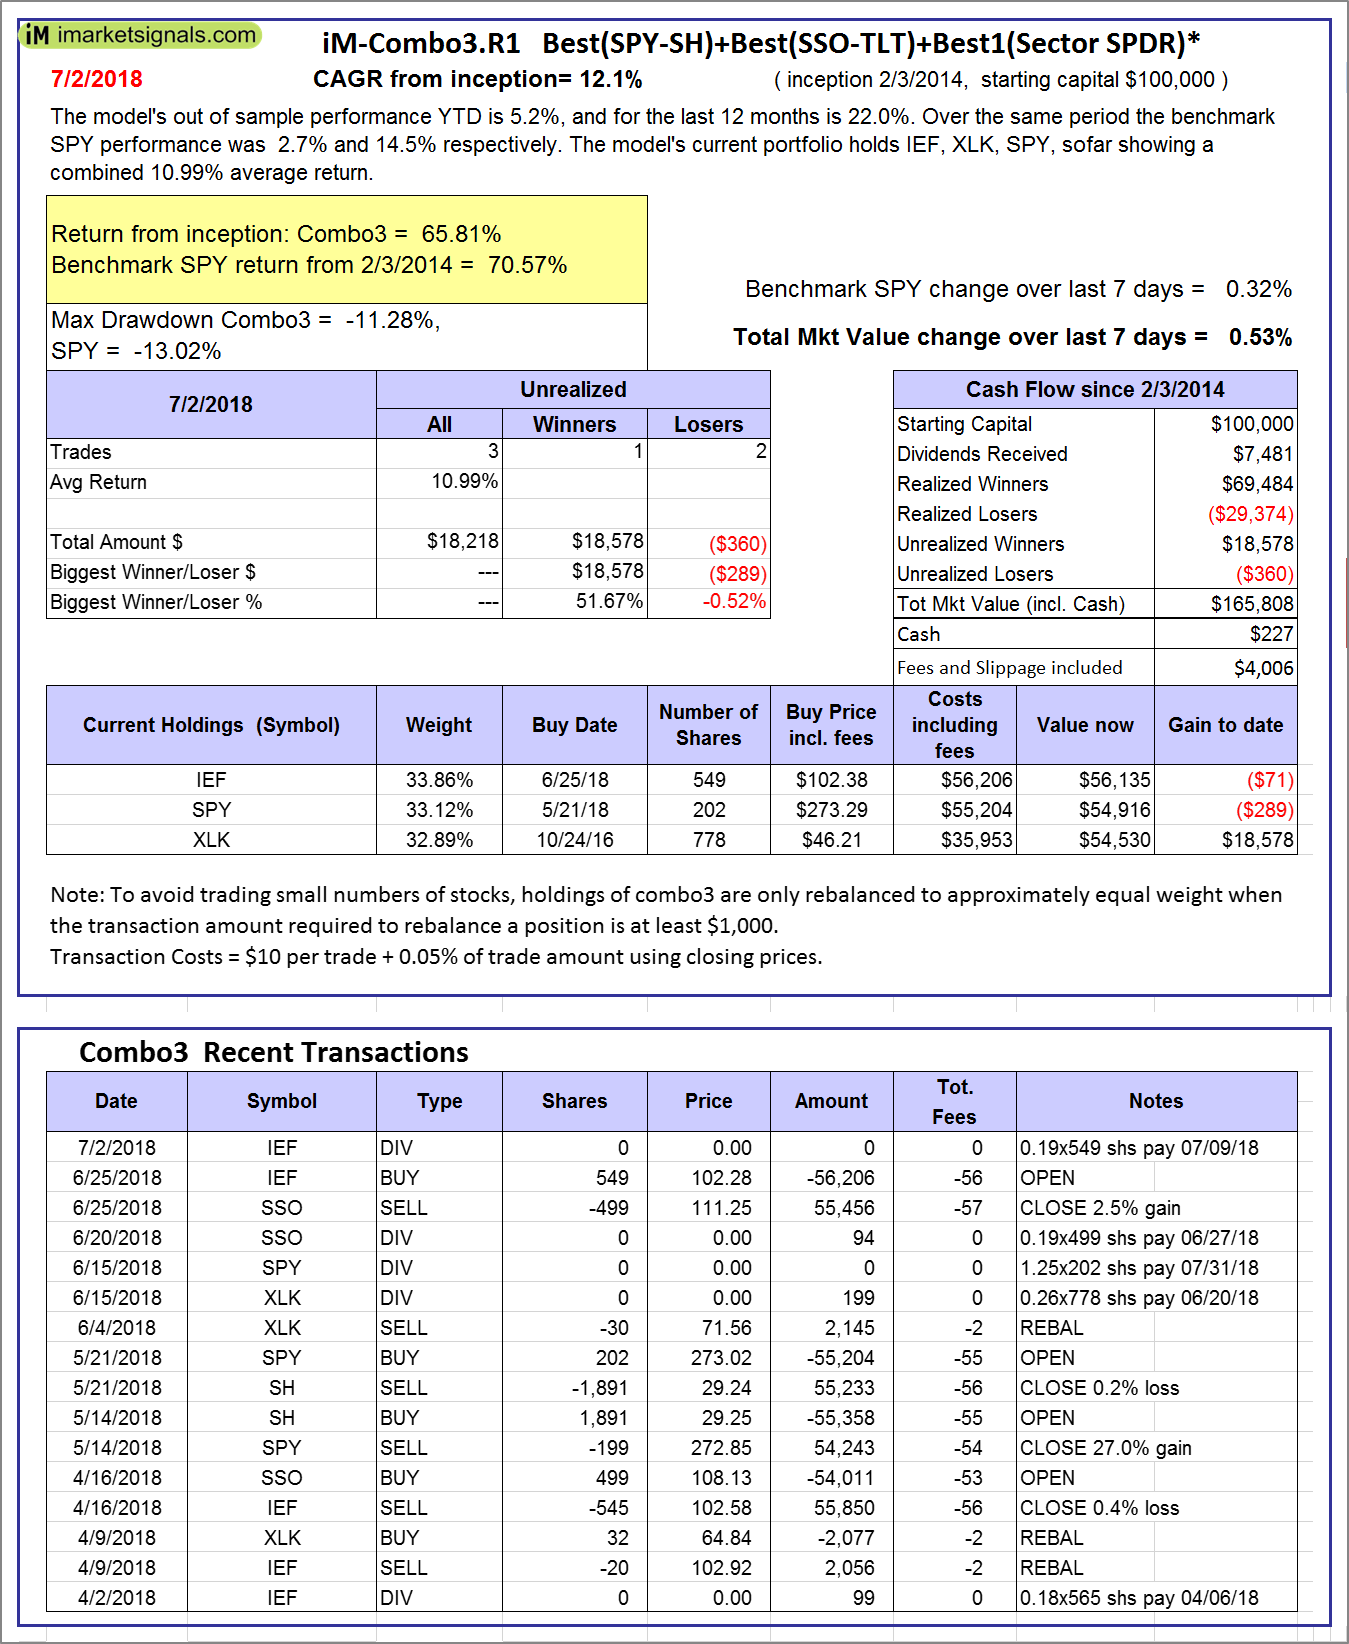 |
iM-Combo3.R1: The model’s out of sample performance YTD is 5.2%, and for the last 12 months is 22.0%. Over the same period the benchmark SPY performance was 2.7% and 14.5% respectively. Over the previous week the market value of iM-Combo3.R1 gained 0.53% at a time when SPY gained 0.32%. A starting capital of $100,000 at inception on 2/3/2014 would have grown to $165,808 which includes $227 cash and excludes $4,006 spent on fees and slippage. |
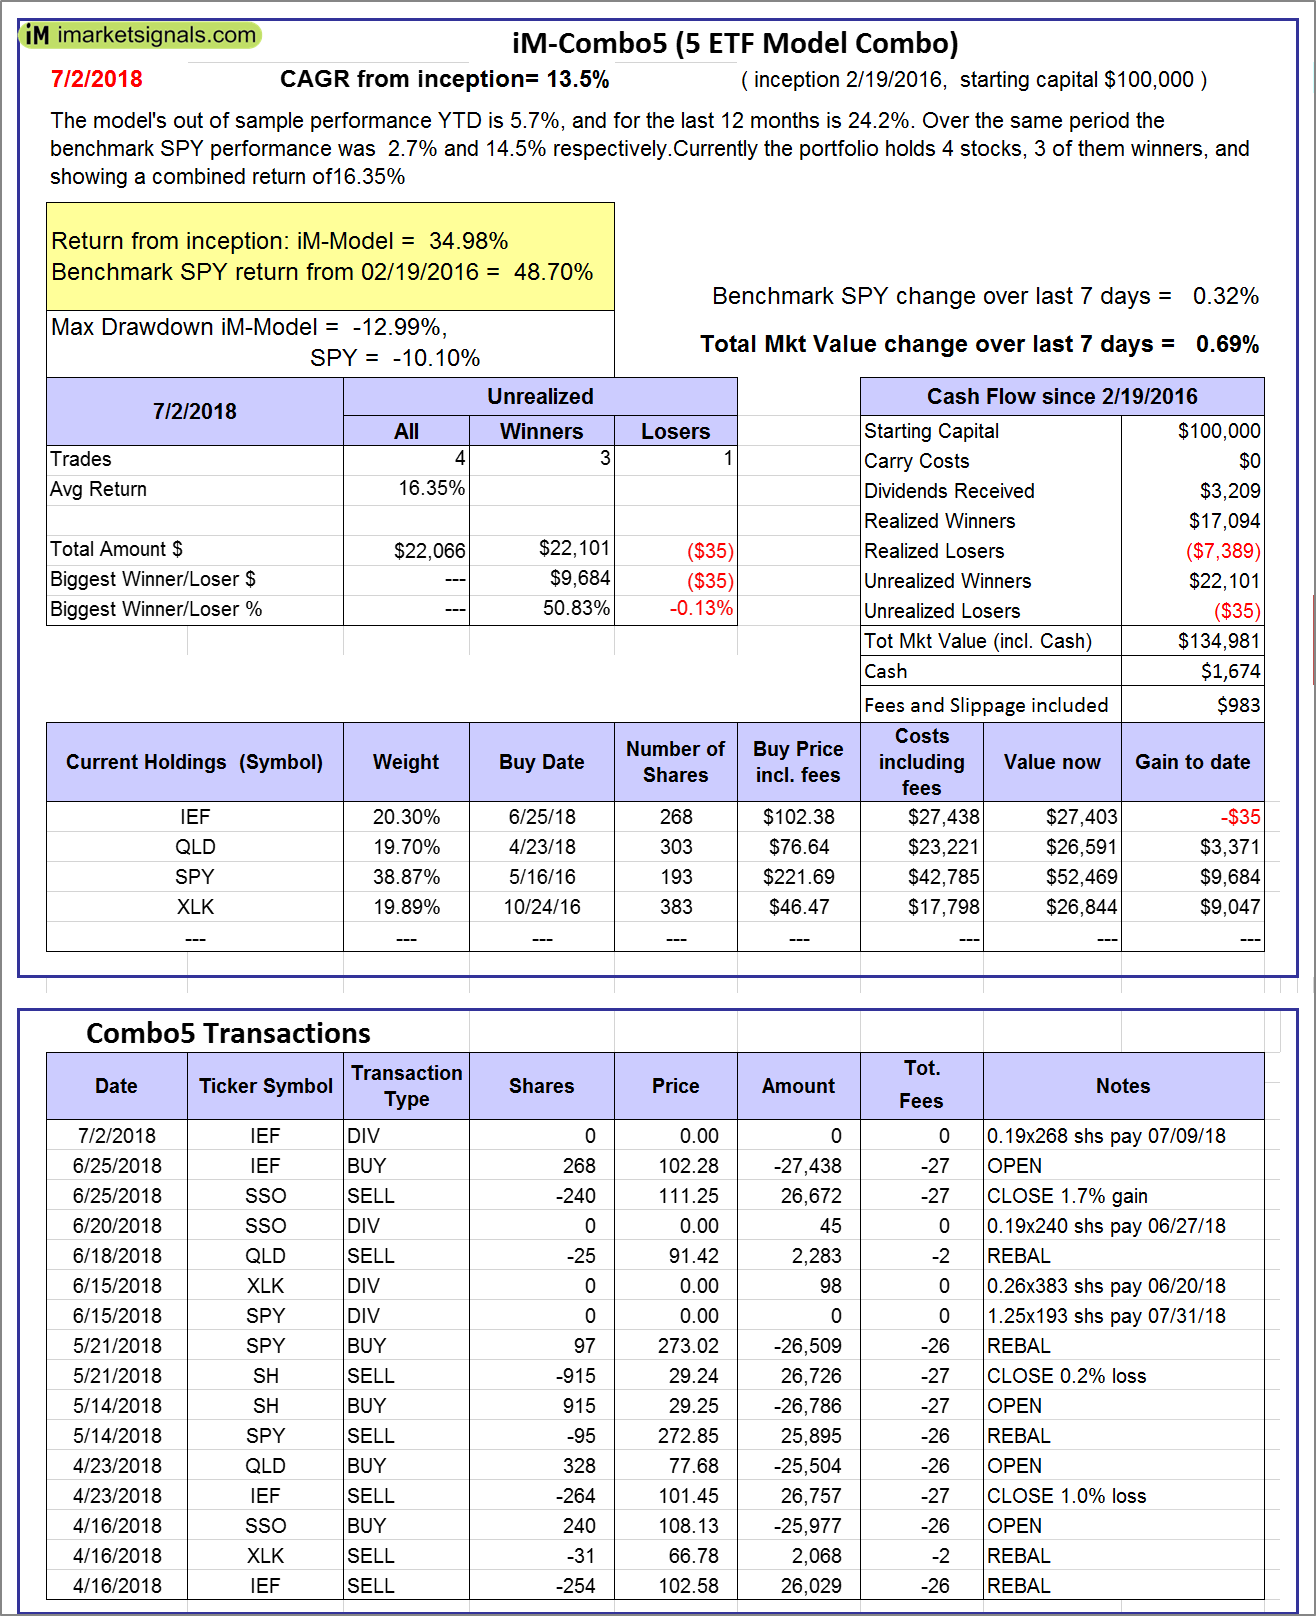 |
iM-Combo5: The model’s out of sample performance YTD is 5.7%, and for the last 12 months is 24.2%. Over the same period the benchmark SPY performance was 2.7% and 14.5% respectively. Over the previous week the market value of iM-Combo5 gained 0.69% at a time when SPY gained 0.32%. A starting capital of $100,000 at inception on 2/22/2016 would have grown to $134,981 which includes $1,674 cash and excludes $983 spent on fees and slippage. |
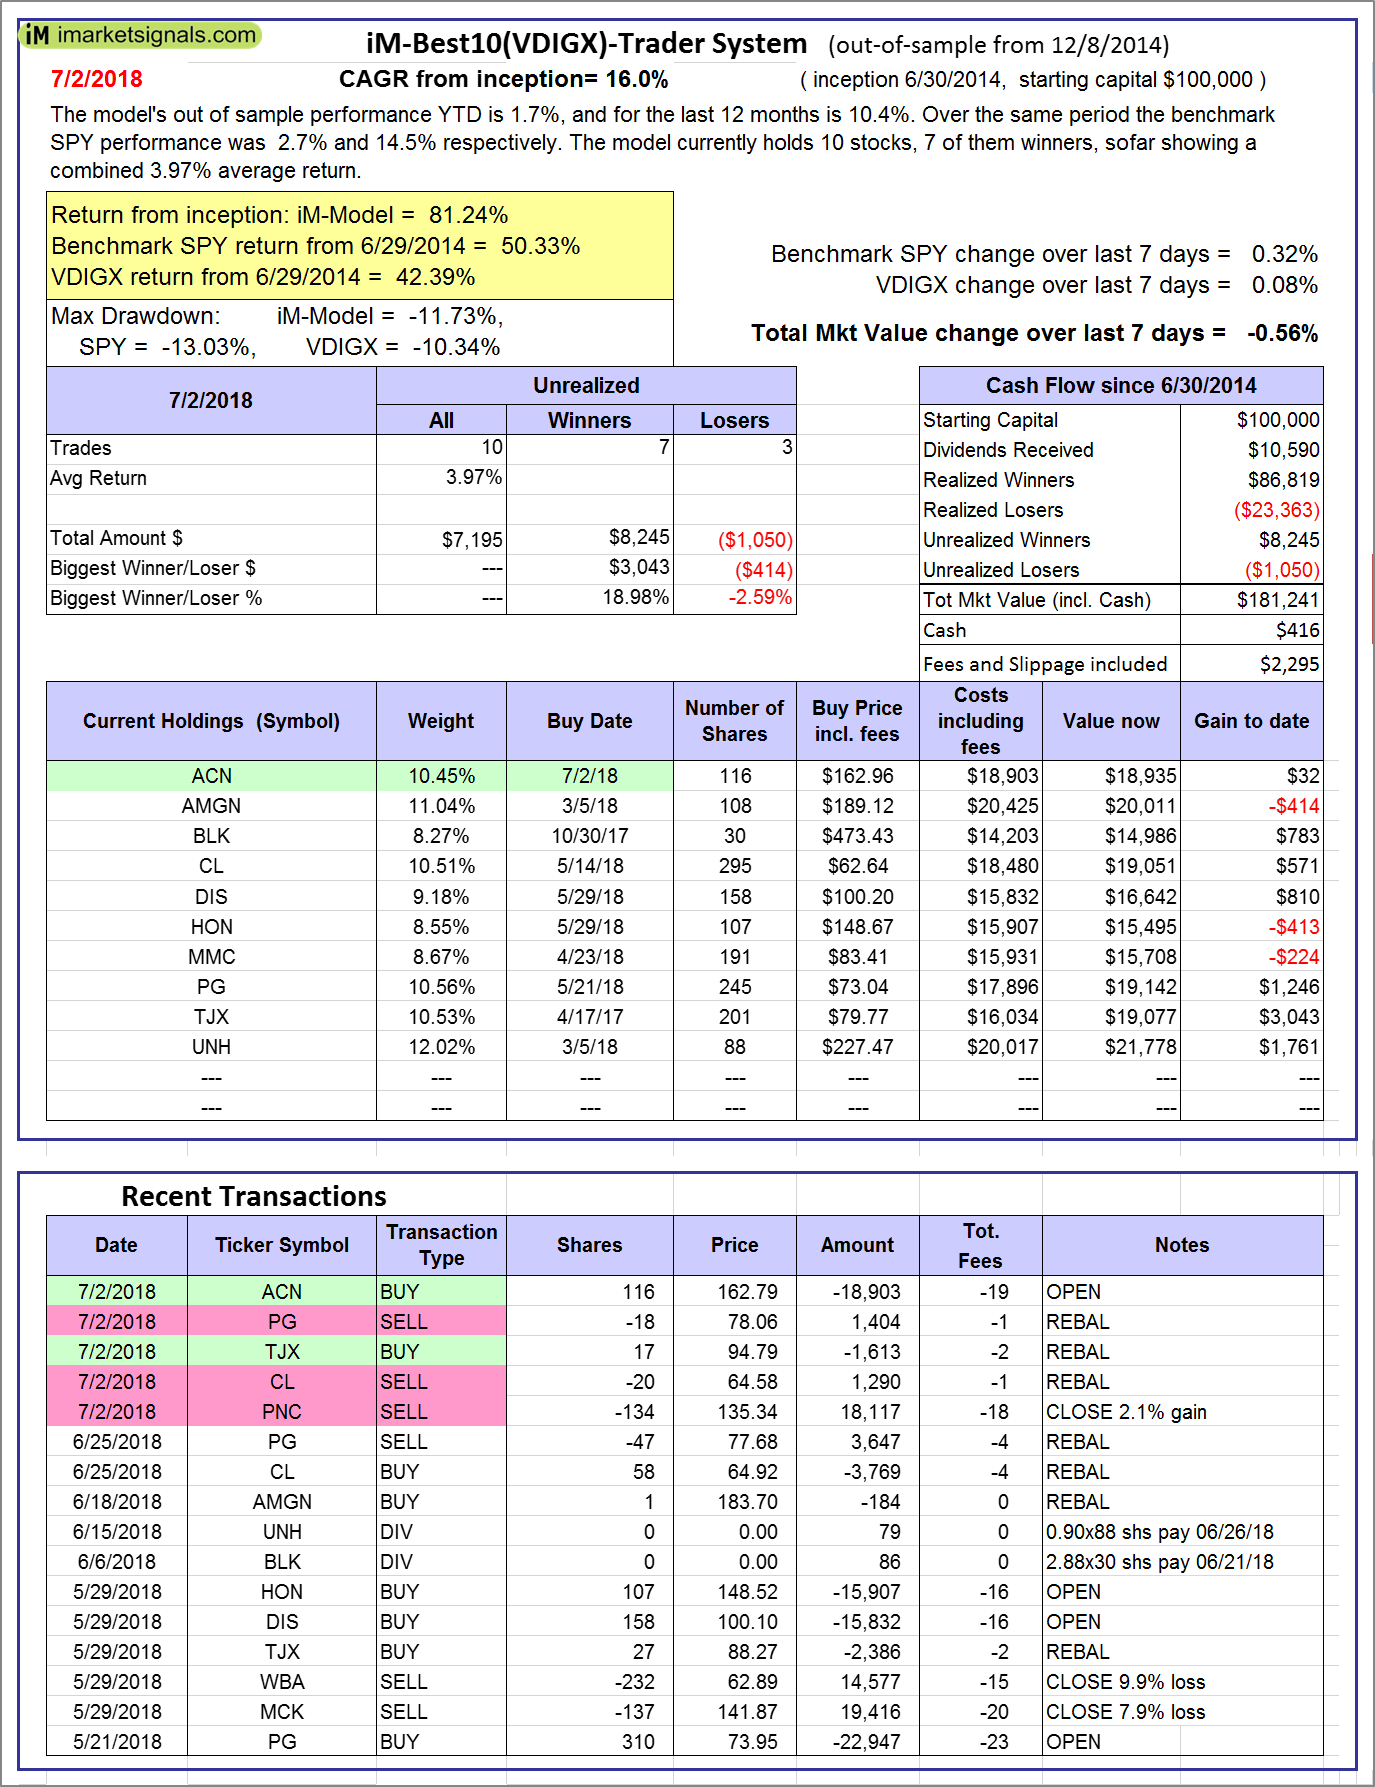 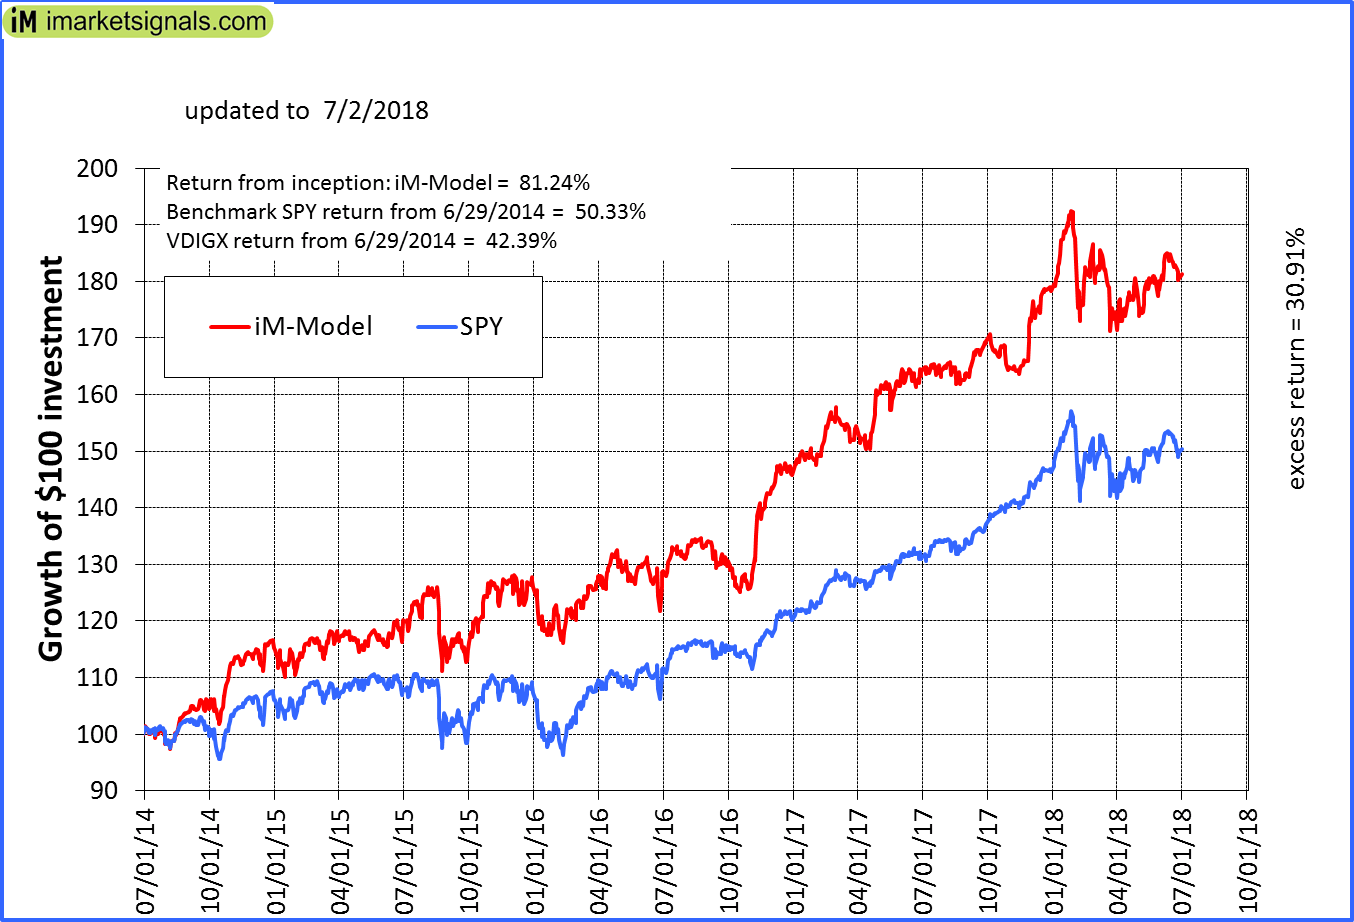 |
iM-Best10(VDIGX)-Trader: The model’s out of sample performance YTD is 1.7%, and for the last 12 months is 10.4%. Over the same period the benchmark SPY performance was 2.7% and 14.5% respectively. Since inception, on 7/1/2014, the model gained 81.24% while the benchmark SPY gained 50.33% and VDIGX gained 42.39% over the same period. Over the previous week the market value of iM-Best10(VDIGX) gained -0.56% at a time when SPY gained 0.32%. A starting capital of $100,000 at inception on 7/1/2014 would have grown to $181,241 which includes $416 cash and excludes $2,295 spent on fees and slippage. |
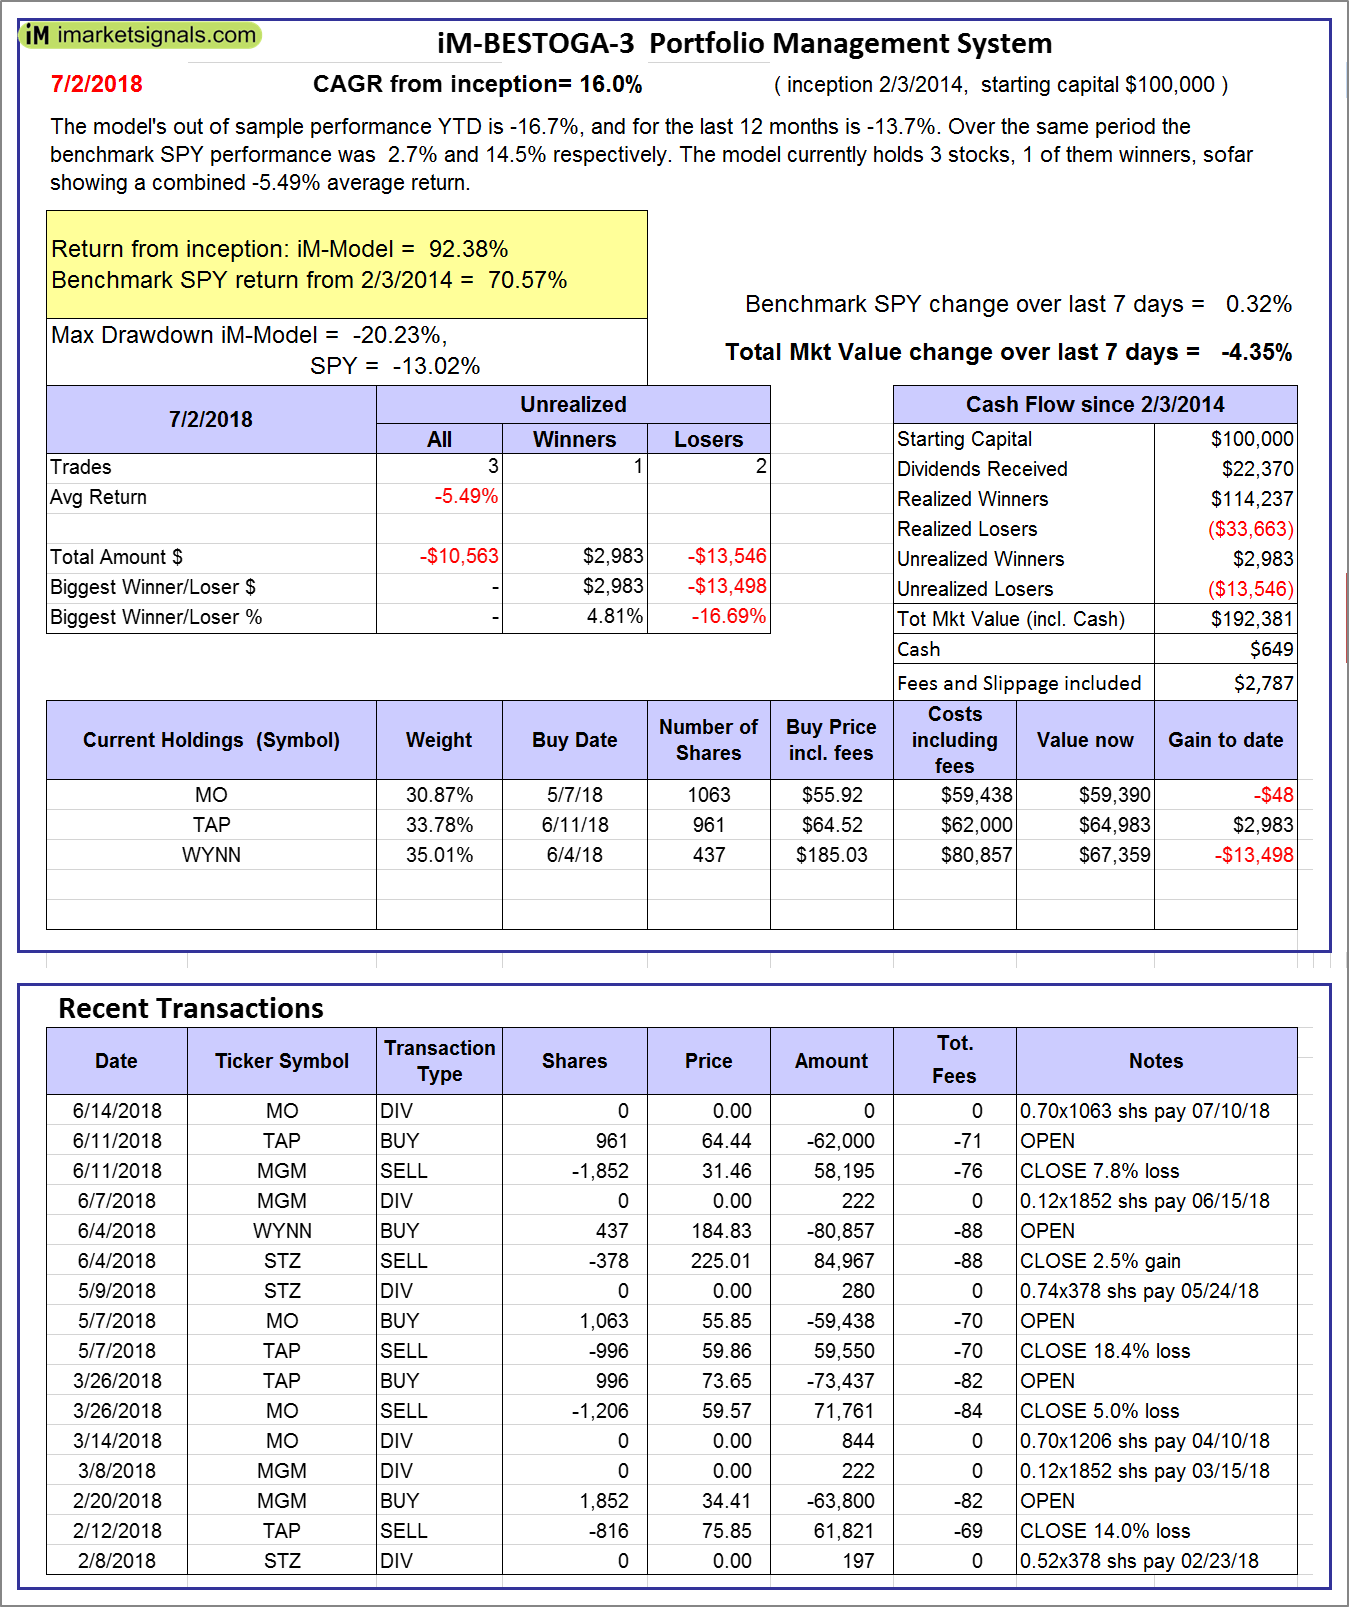 |
iM-BESTOGA-3: The model’s out of sample performance YTD is -16.7%, and for the last 12 months is -13.7%. Over the same period the benchmark SPY performance was 2.7% and 14.5% respectively. Over the previous week the market value of iM-BESTOGA-3 gained -4.35% at a time when SPY gained 0.32%. A starting capital of $100,000 at inception on 2/3/2014 would have grown to $192,381 which includes $649 cash and excludes $2,787 spent on fees and slippage. |
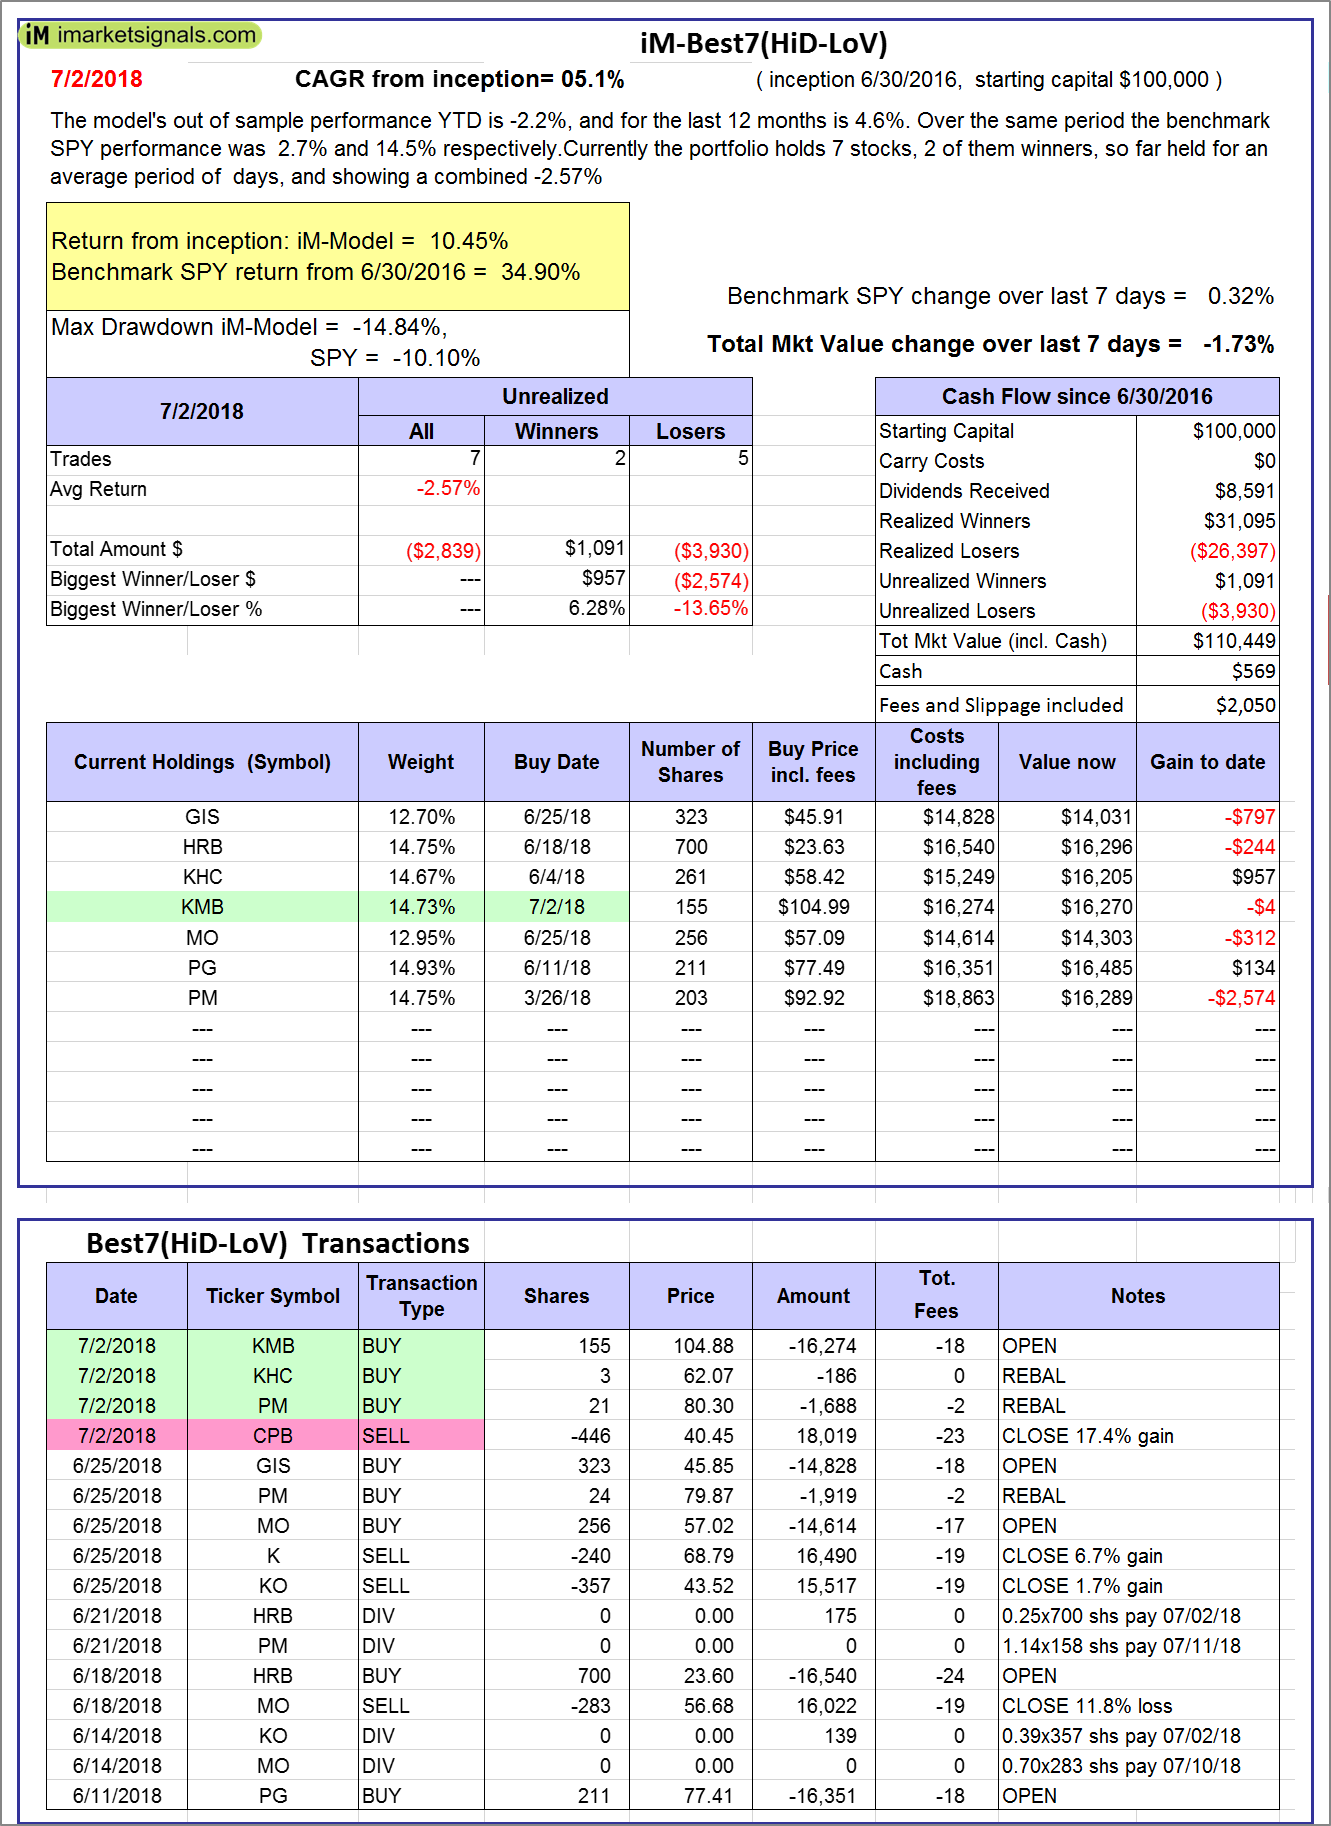 |
iM-Best7(HiD-LoV): The model’s out of sample performance YTD is -2.2%, and for the last 12 months is 4.6%. Over the same period the benchmark SPY performance was 2.7% and 14.5% respectively. Over the previous week the market value of iM-BESTOGA-3 gained -1.73% at a time when SPY gained 0.32%. A starting capital of $100,000 at inception on 6/30/2016 would have grown to $110,449 which includes $569 cash and excludes $2,050 spent on fees and slippage. |
 |
iM 6-Stock Capital Strength Portfolio: The model’s out of sample performance YTD is -0.1%, and for the last 12 months is 20.3%. Over the same period the benchmark SPY performance was 2.7% and 14.5% respectively. Over the previous week the market value of the iM 6-Stock Capital Strength Portfolio gained -0.98% at a time when SPY gained 0.32%. A starting capital of $100,000 at inception on 10/28/2016 would have grown to $151,031 which includes $1,235 cash and excludes $704 spent on fees and slippage. |
 |
iM-BestogaX5-System: The model’s out of sample performance YTD is 2.1%, and for the last 12 months is 3.1%. Over the same period the benchmark SPY performance was 2.7% and 14.5% respectively. Over the previous week the market value of iM-BestogaX5-System gained -1.17% at a time when SPY gained 0.32%. A starting capital of $100,000 at inception on 3/28/2016 would have grown to $113,975 which includes $207 cash and excludes $1,256 spent on fees and slippage. |
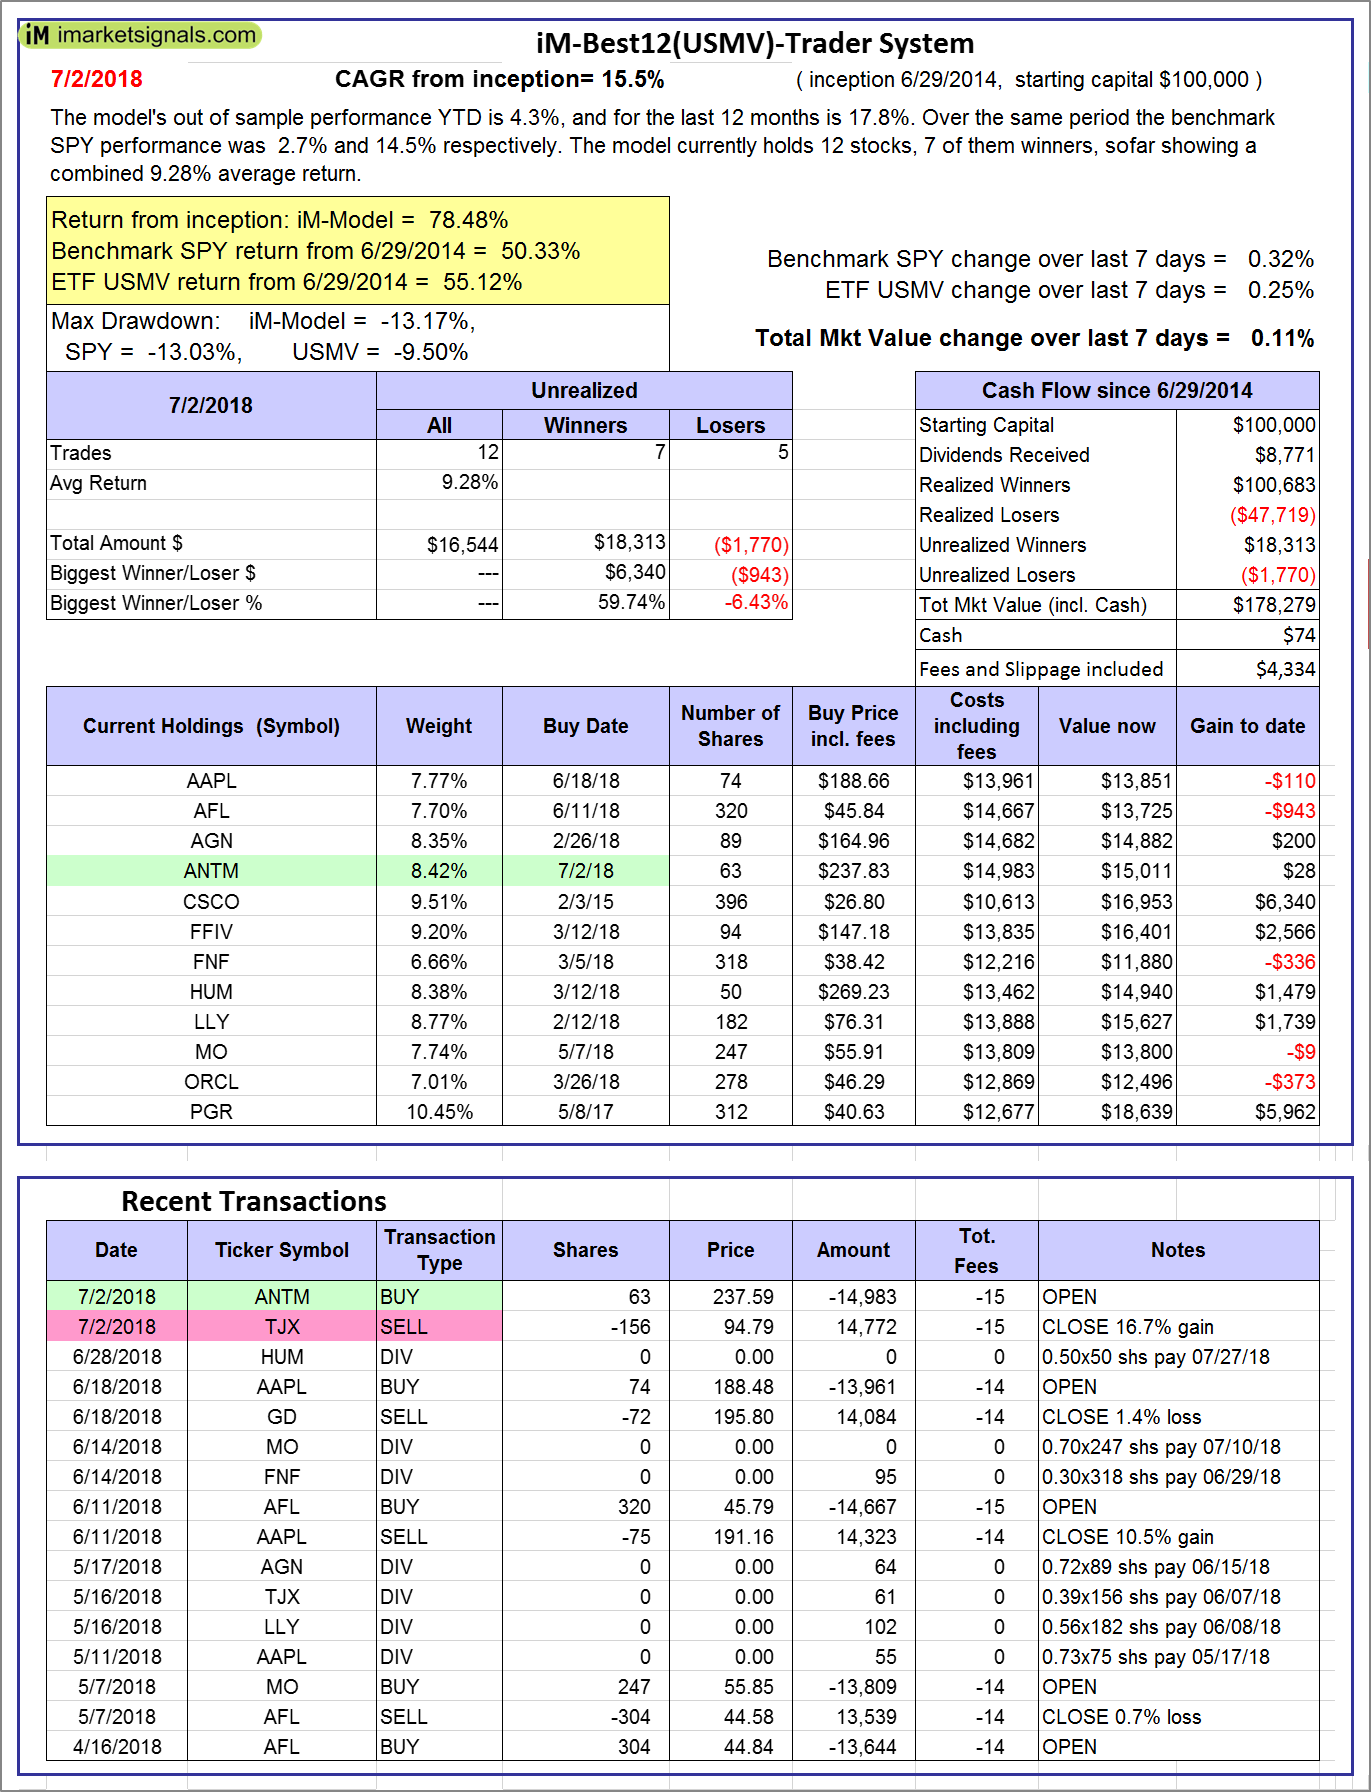 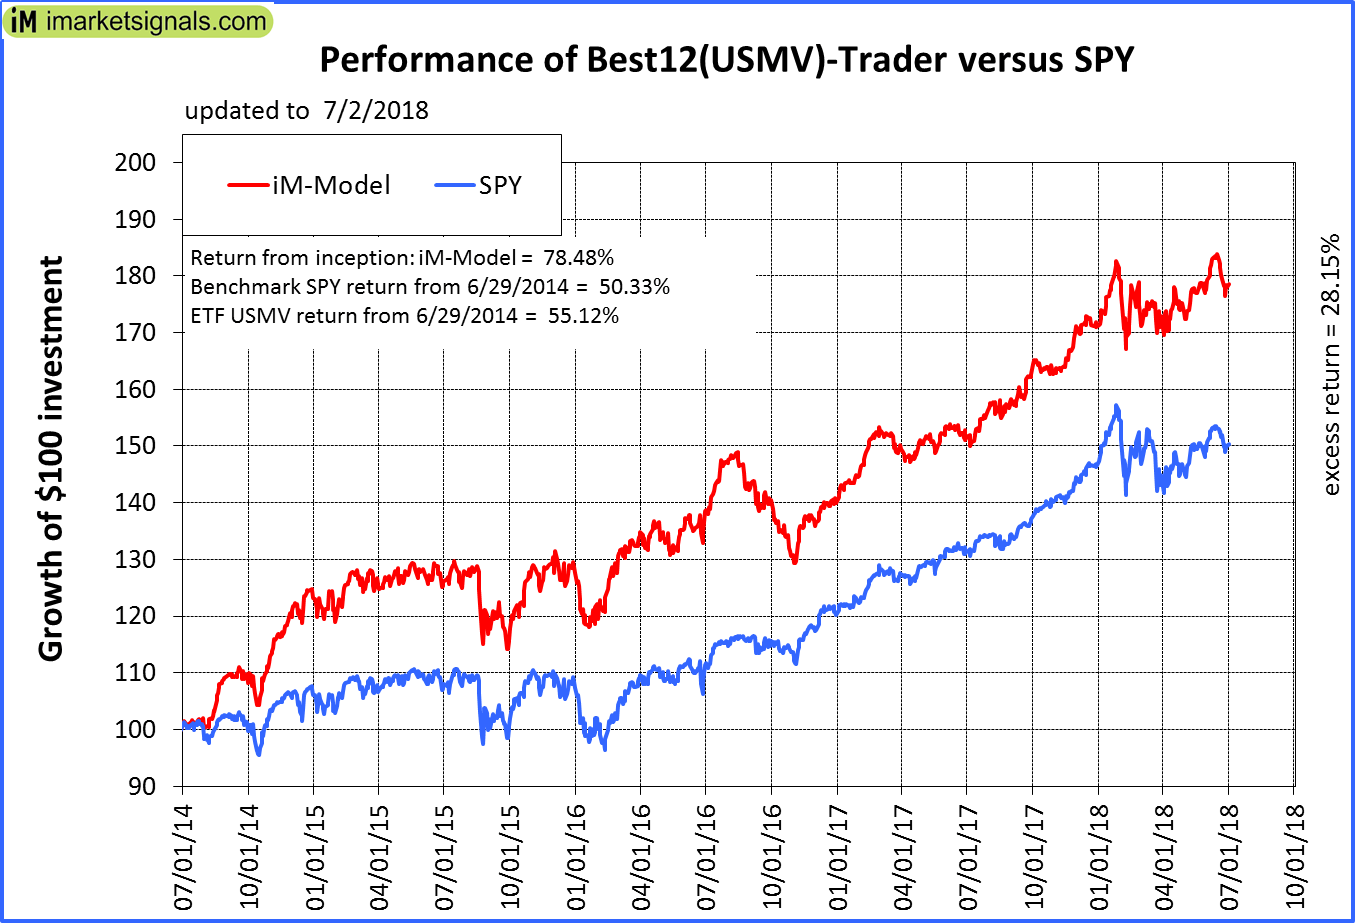 |
iM-Best12(USMV)-Trader: The model’s out of sample performance YTD is 4.3%, and for the last 12 months is 17.8%. Over the same period the benchmark SPY performance was 2.7% and 14.5% respectively. Since inception, on 6/30/2014, the model gained 78.48% while the benchmark SPY gained 50.33% and the ETF USMV gained 55.12% over the same period. Over the previous week the market value of iM-Best12(USMV)-Trader gained 0.11% at a time when SPY gained 0.32%. A starting capital of $100,000 at inception on 6/30/2014 would have grown to $178,279 which includes $74 cash and excludes $4,334 spent on fees and slippage. |
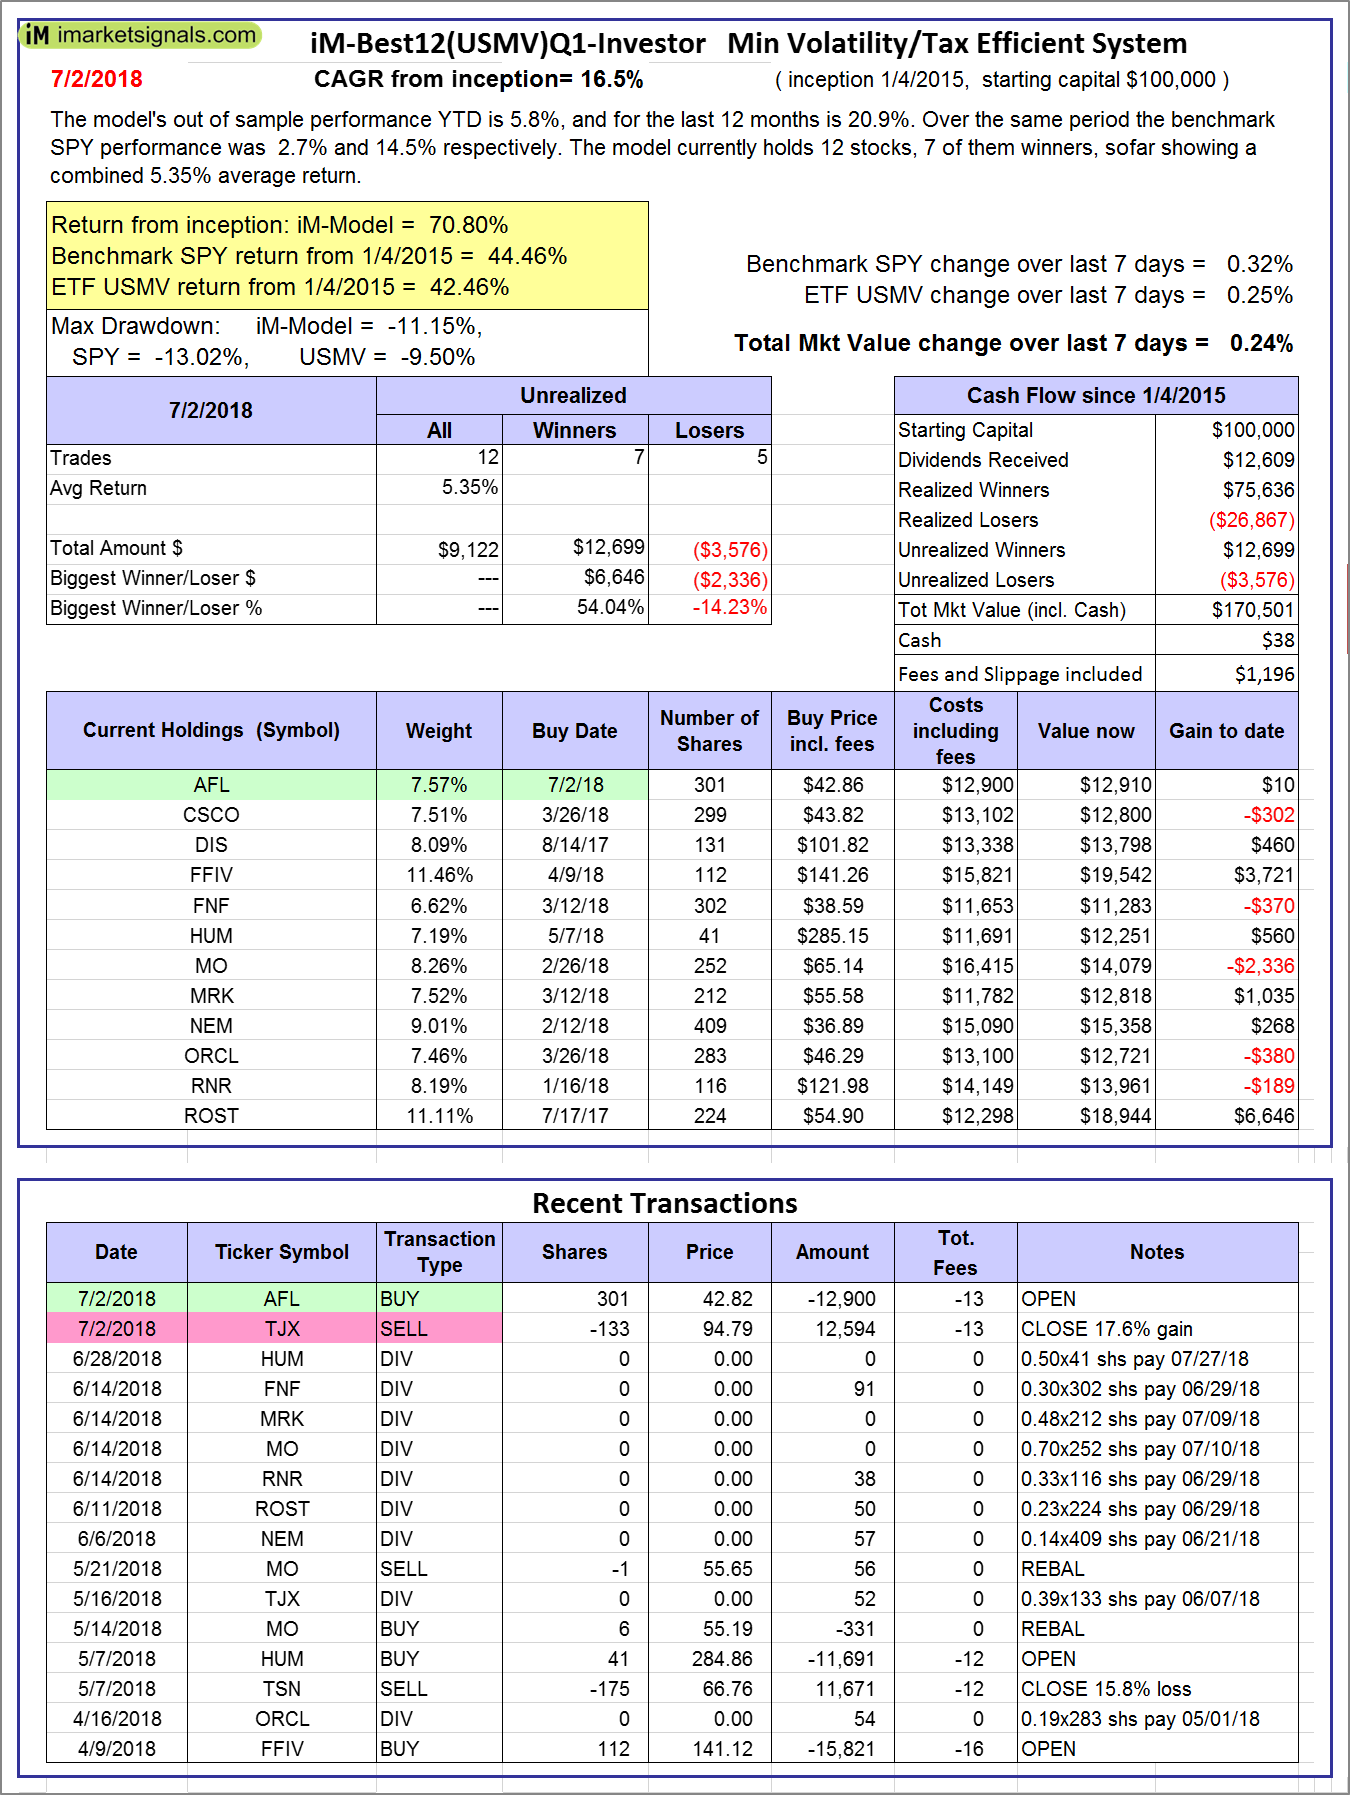 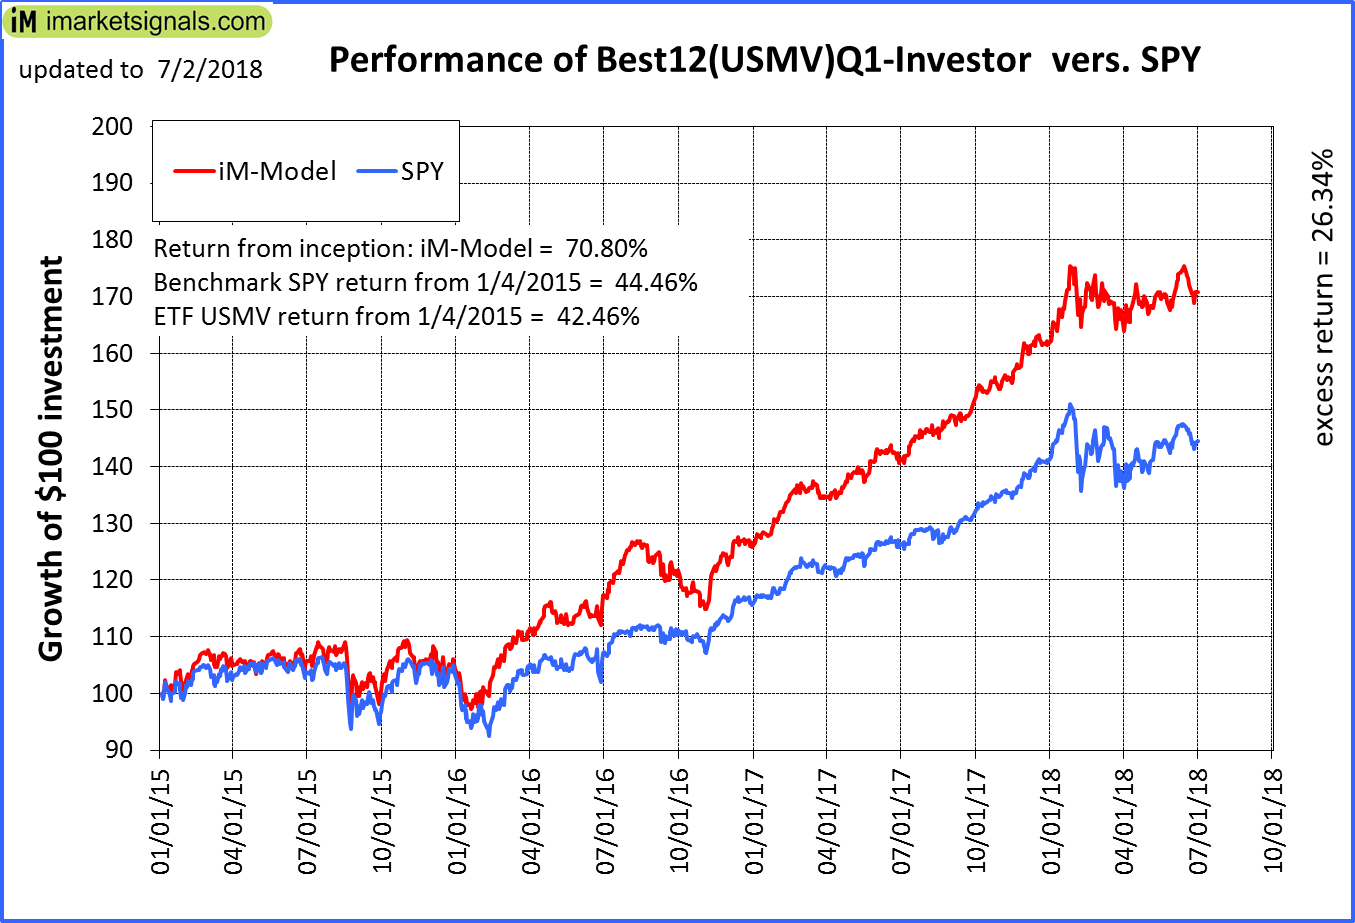 |
iM-Best12(USMV)Q1-Investor: The model’s out of sample performance YTD is 5.8%, and for the last 12 months is 20.9%. Over the same period the benchmark SPY performance was 2.7% and 14.5% respectively. Since inception, on 1/5/2015, the model gained 70.80% while the benchmark SPY gained 44.46% and the ETF USMV gained 42.46% over the same period. Over the previous week the market value of iM-Best12(USMV)Q1 gained 0.24% at a time when SPY gained 0.32%. A starting capital of $100,000 at inception on 1/5/2015 would have grown to $170,501 which includes $38 cash and excludes $1,196 spent on fees and slippage. |
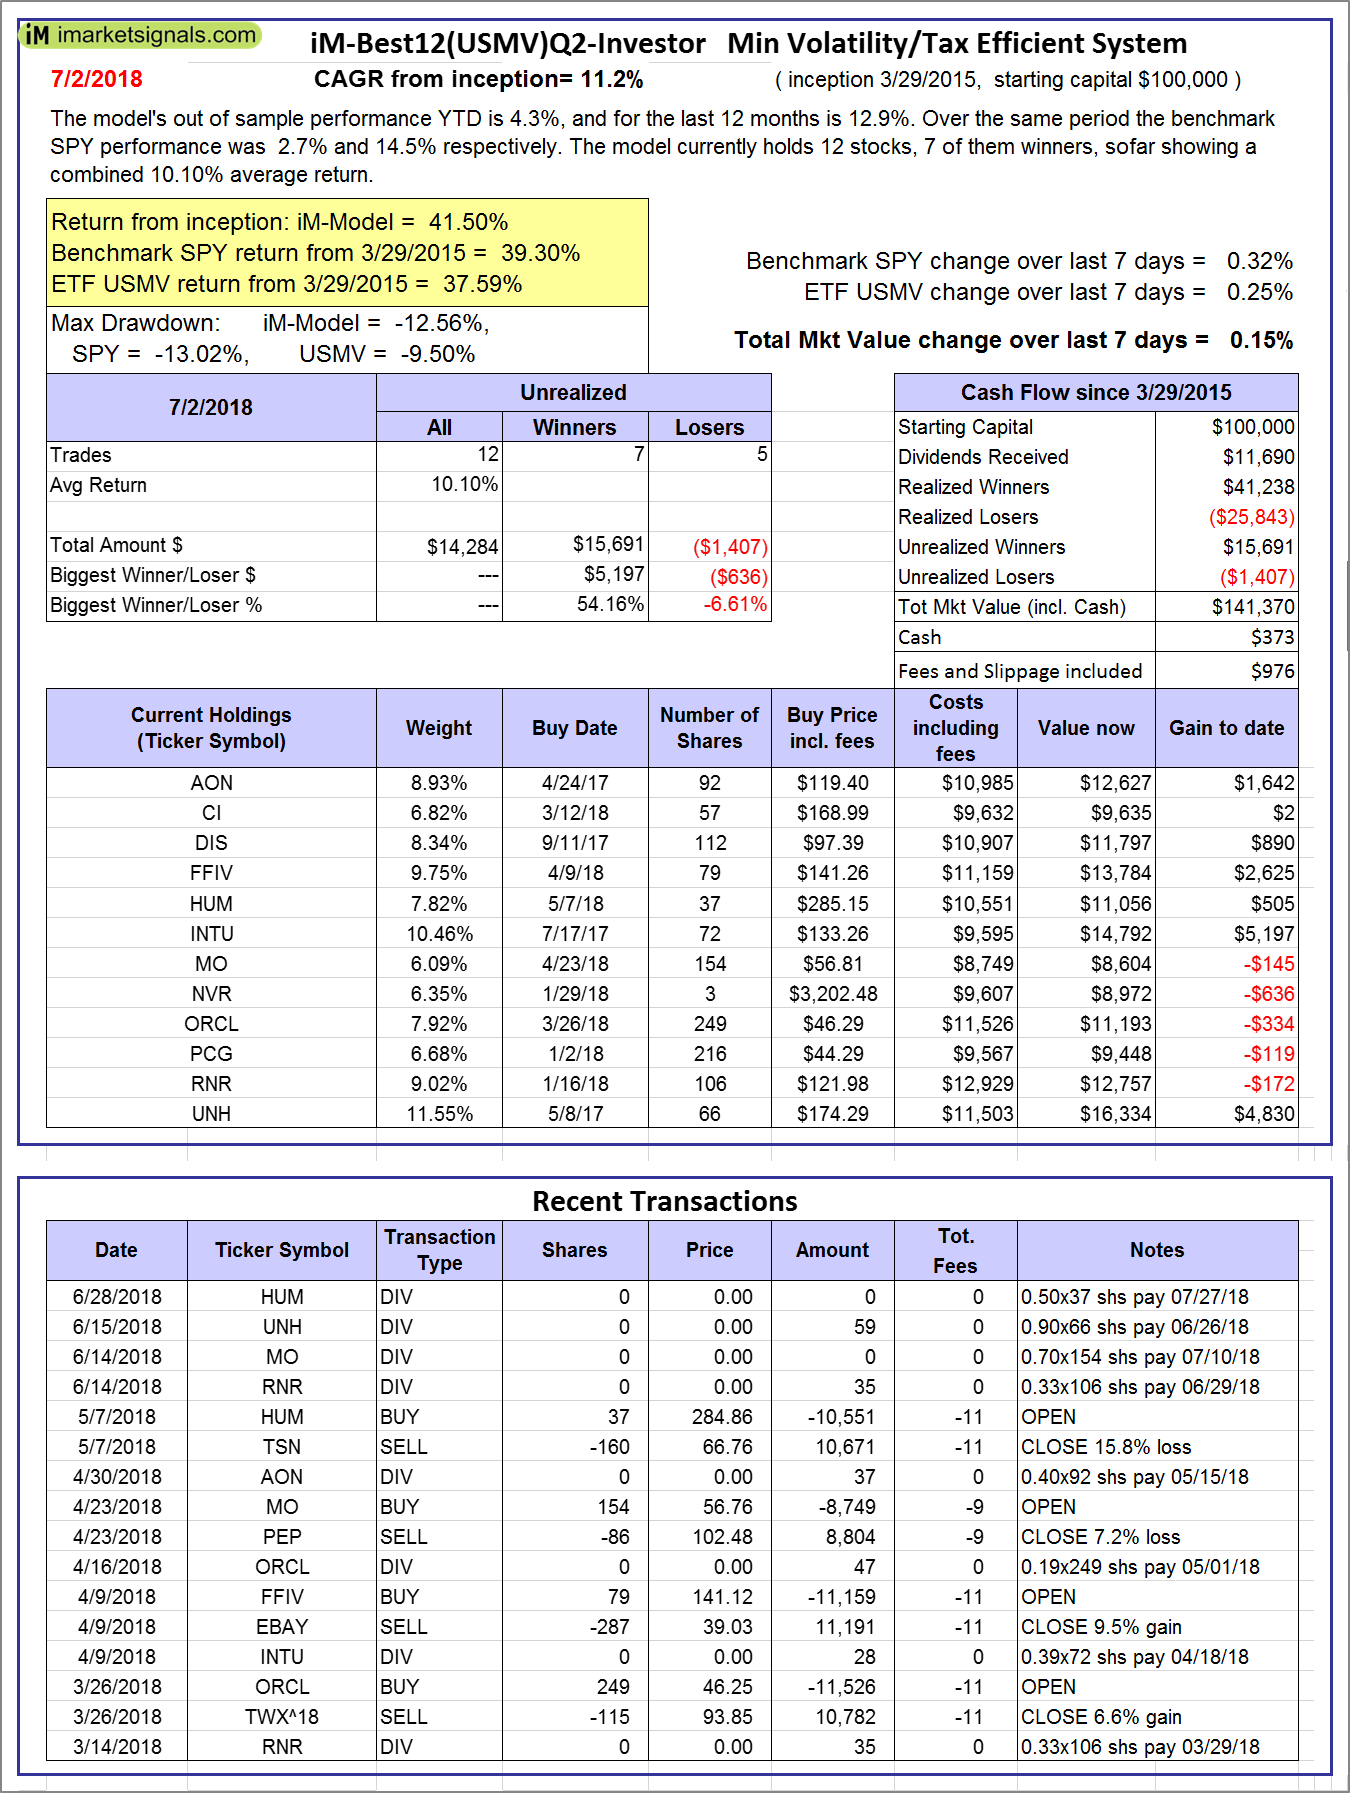 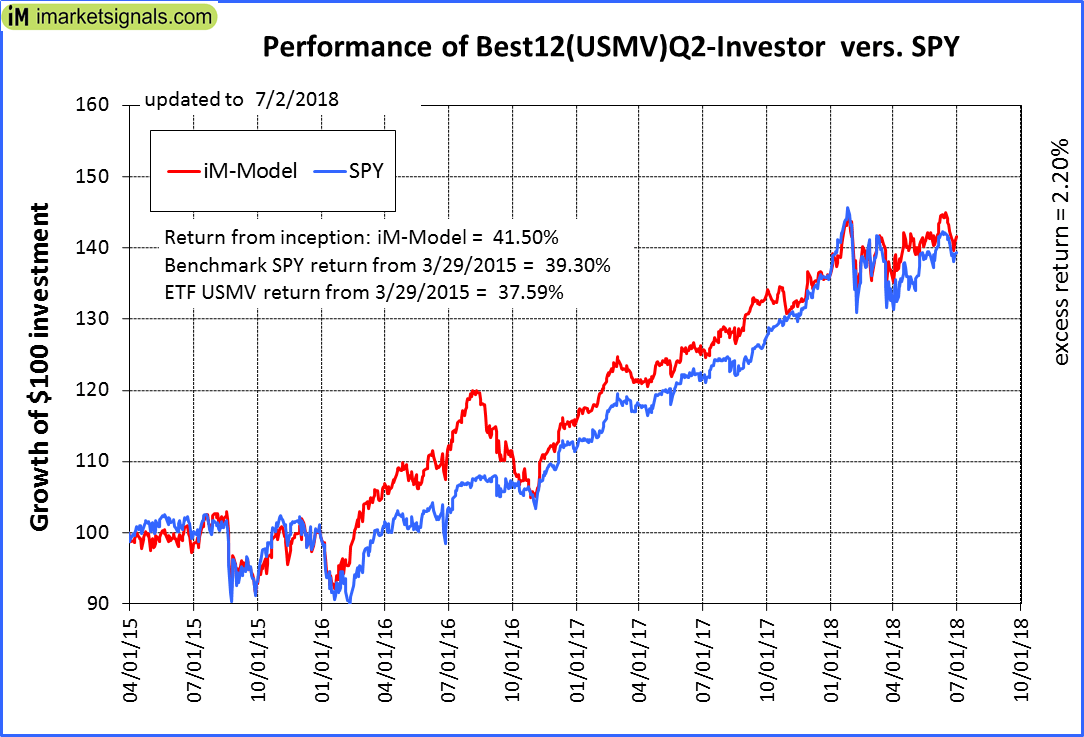 |
iM-Best12(USMV)Q2-Investor: The model’s out of sample performance YTD is 4.3%, and for the last 12 months is 12.9%. Over the same period the benchmark SPY performance was 2.7% and 14.5% respectively. Since inception, on 3/30/2015, the model gained 41.50% while the benchmark SPY gained 39.30% and the ETF USMV gained 37.59% over the same period. Over the previous week the market value of iM-Best12(USMV)Q2 gained 0.15% at a time when SPY gained 0.32%. A starting capital of $100,000 at inception on 3/30/2015 would have grown to $141,370 which includes $373 cash and excludes $976 spent on fees and slippage. |
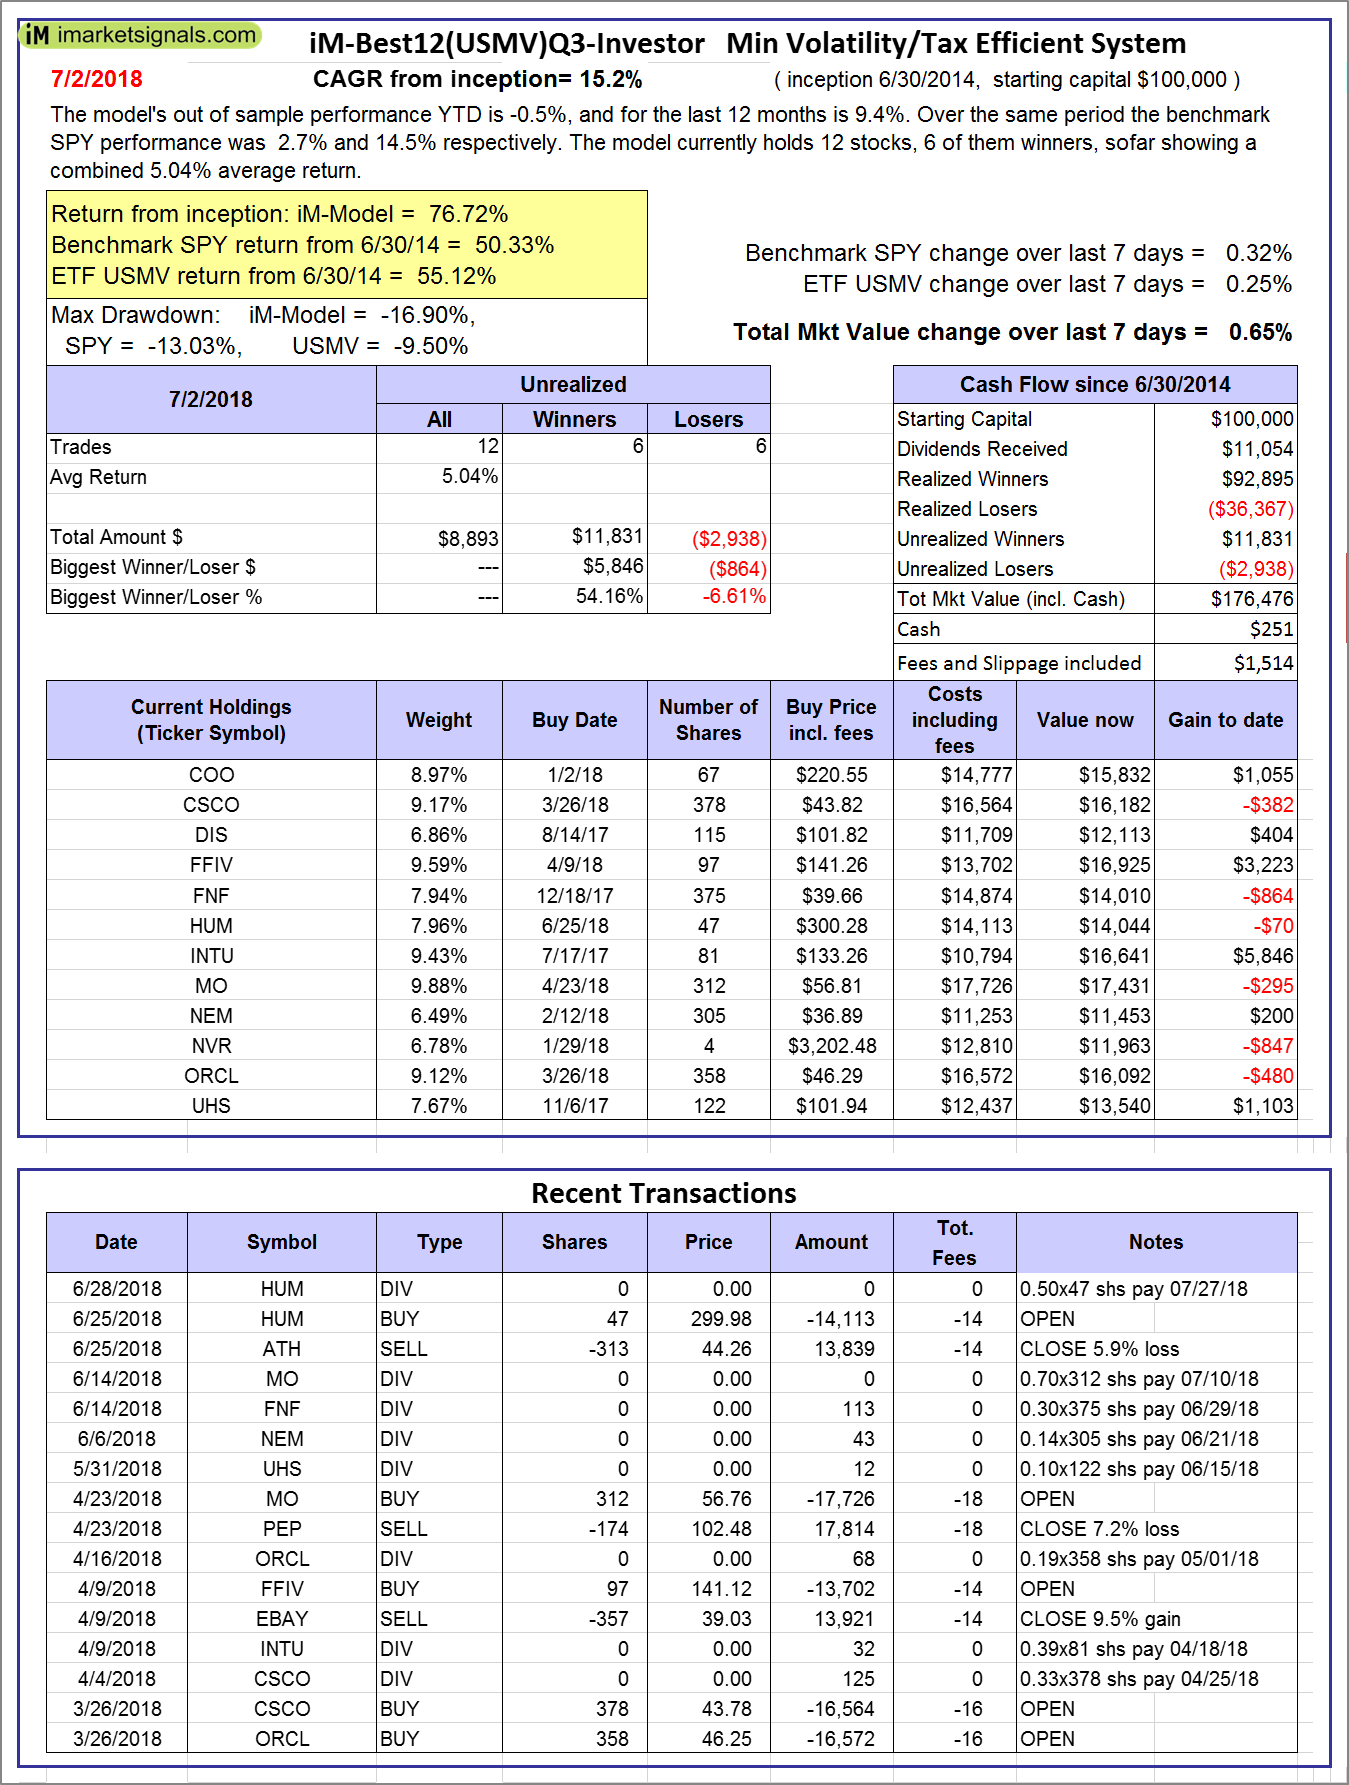  |
iM-Best12(USMV)Q3-Investor: The model’s out of sample performance YTD is -0.5%, and for the last 12 months is 9.4%. Over the same period the benchmark SPY performance was 2.7% and 14.5% respectively. Since inception, on 7/1/2014, the model gained 76.72% while the benchmark SPY gained 50.33% and the ETF USMV gained 55.12% over the same period. Over the previous week the market value of iM-Best12(USMV)Q3 gained 0.65% at a time when SPY gained 0.32%. A starting capital of $100,000 at inception on 7/1/2014 would have grown to $176,476 which includes $251 cash and excludes $1,514 spent on fees and slippage. |
 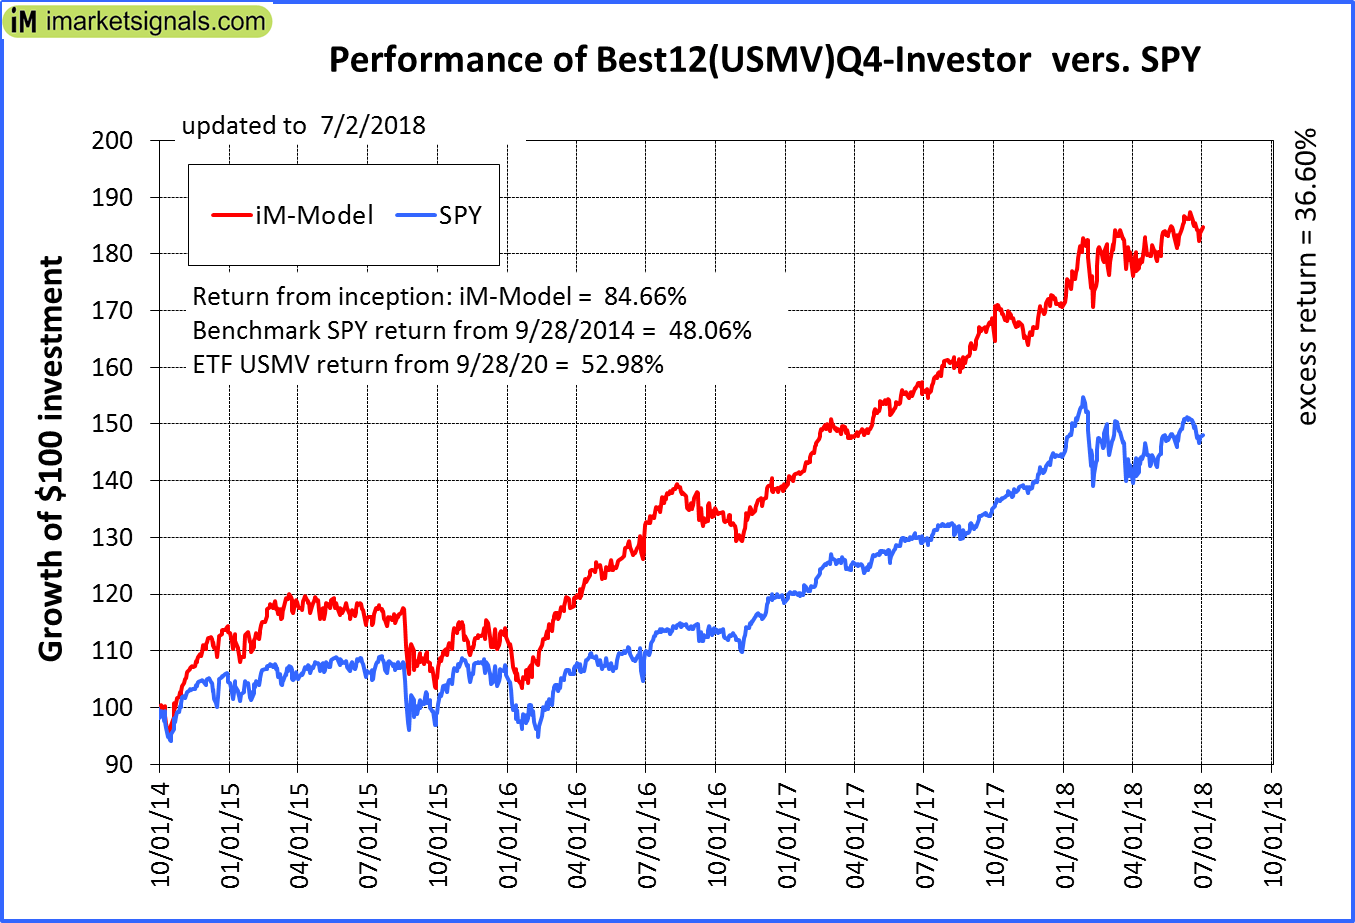 |
iM-Best12(USMV)Q4-Investor: Since inception, on 9/29/2014, the model gained 84.66% while the benchmark SPY gained 48.06% and the ETF USMV gained 52.98% over the same period. Over the previous week the market value of iM-Best12(USMV)Q4 gained 0.20% at a time when SPY gained 0.32%. A starting capital of $100,000 at inception on 9/29/2014 would have grown to $184,546 which includes $445 cash and excludes $1,306 spent on fees and slippage. |
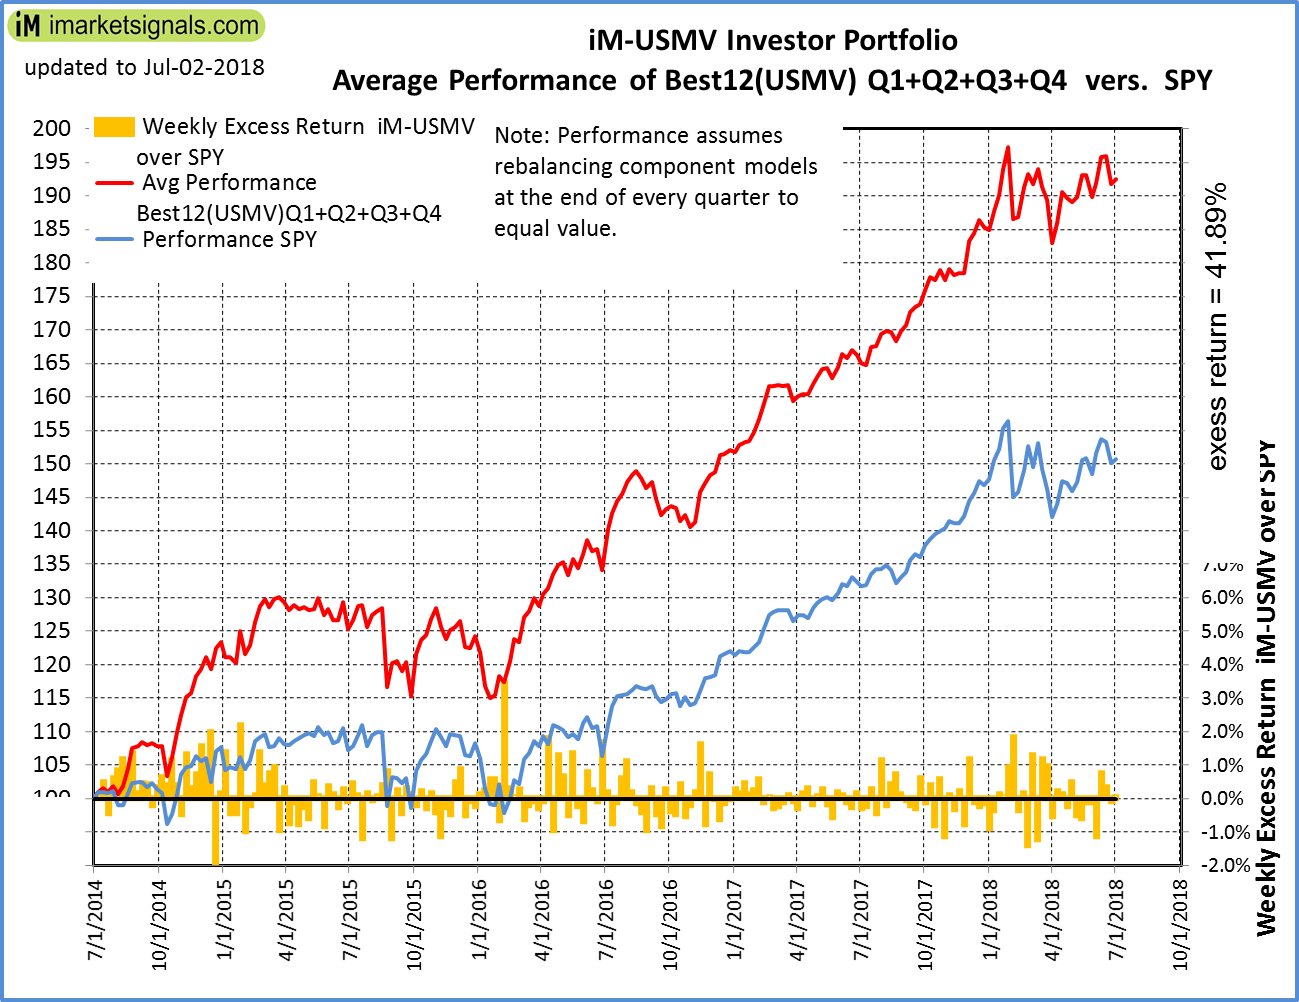 |
Average Performance of iM-Best12(USMV)Q1+Q2+Q3+Q4-Investor resulted in an excess return of 41.89% over SPY. (see iM-USMV Investor Portfolio) |
 |
iM-Best(Short): The model’s out of sample performance YTD is -3.4%, and for the last 12 months is -12.0%. Over the same period the benchmark SPY performance was 2.7% and 14.5% respectively. Over the previous week the market value of iM-Best(Short) gained 0.00% at a time when SPY gained 0.32%. Over the period 1/2/2009 to 7/2/2018 the starting capital of $100,000 would have grown to $88,172 which includes $88,172 cash and excludes $24,362 spent on fees and slippage. |
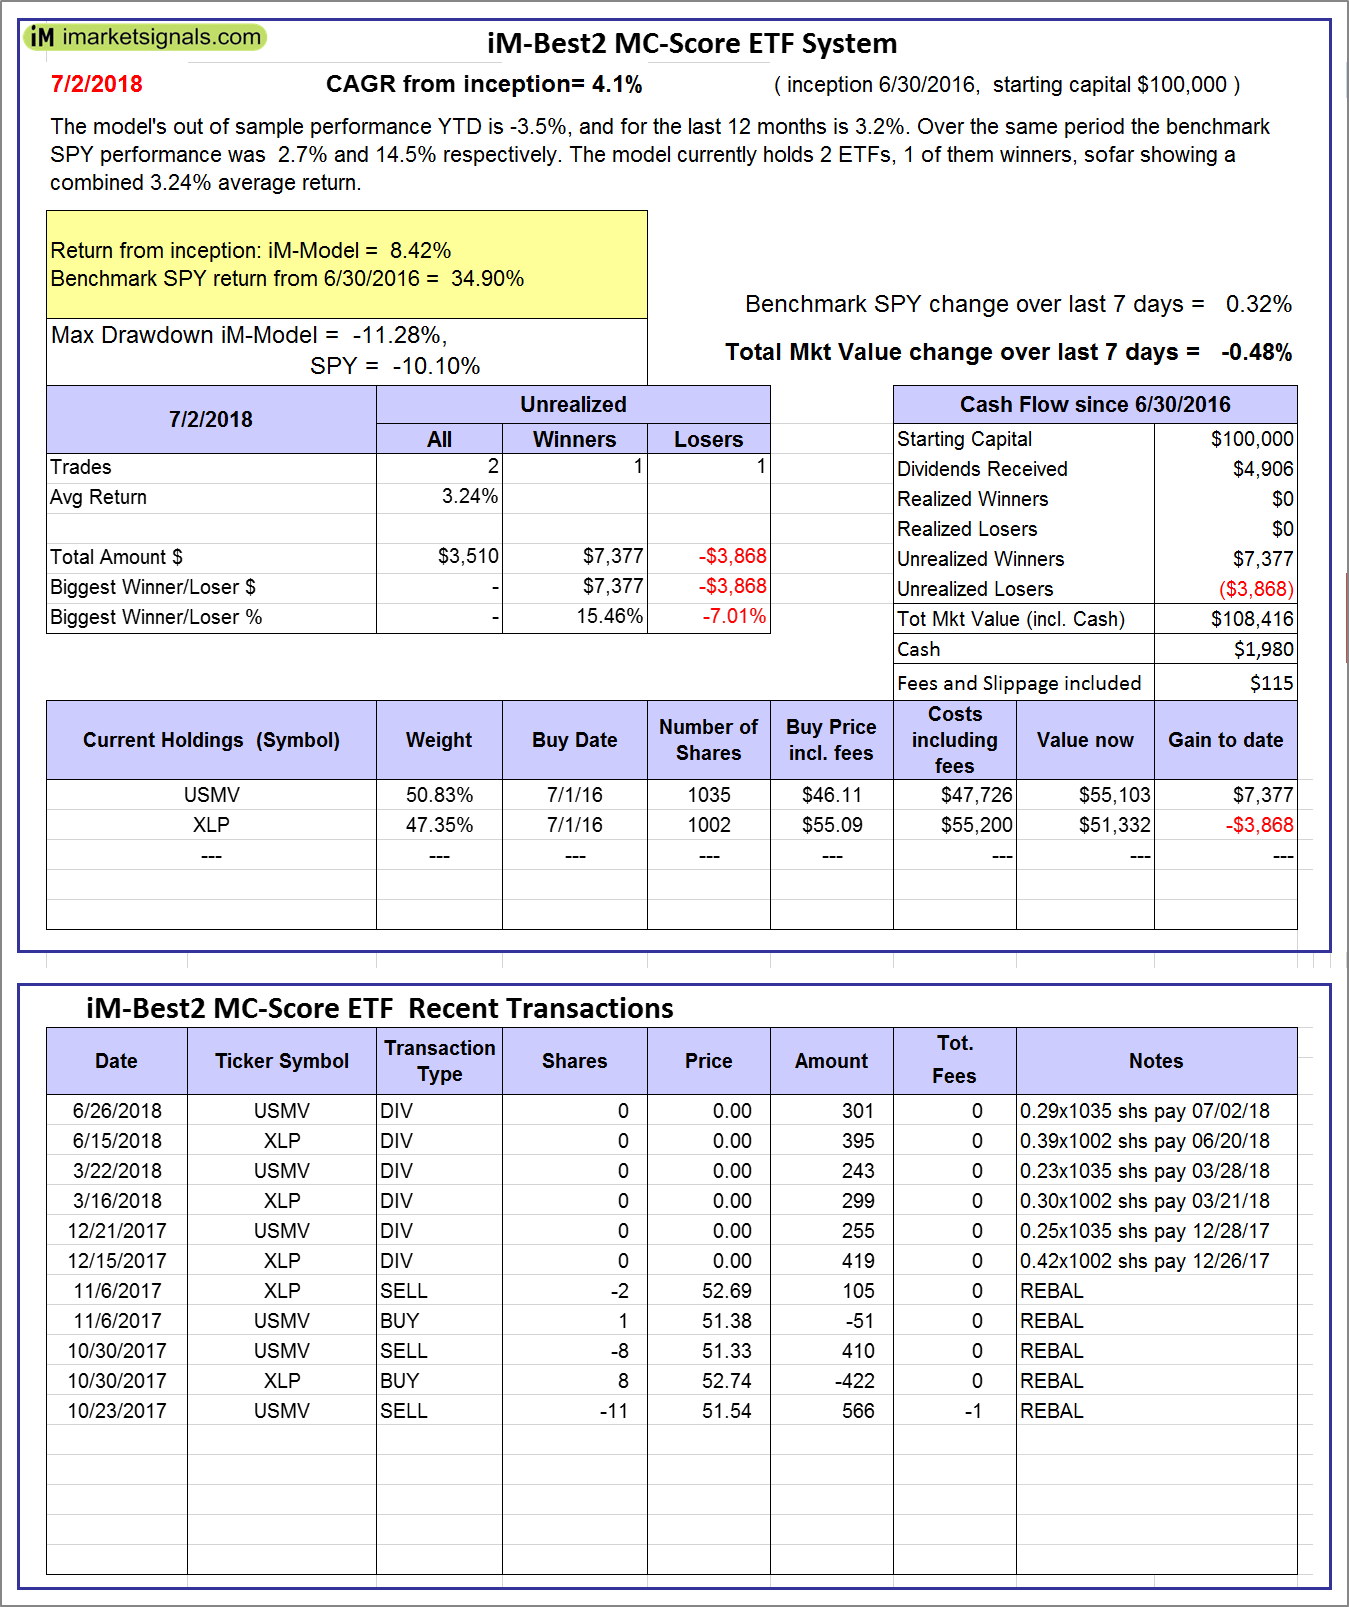 |
iM-Best2 MC-Score ETF System: The model’s out of sample performance YTD is -3.5%, and for the last 12 months is 3.2%. Over the same period the benchmark SPY performance was 2.7% and 14.5% respectively. Over the previous week the market value of the iM-Best2 MC-Score ETF System gained -0.48% at a time when SPY gained 0.32%. A starting capital of $100,000 at inception on 6/30/2016 would have grown to $108,416 which includes $1,980 cash and excludes $115 spent on fees and slippage. |
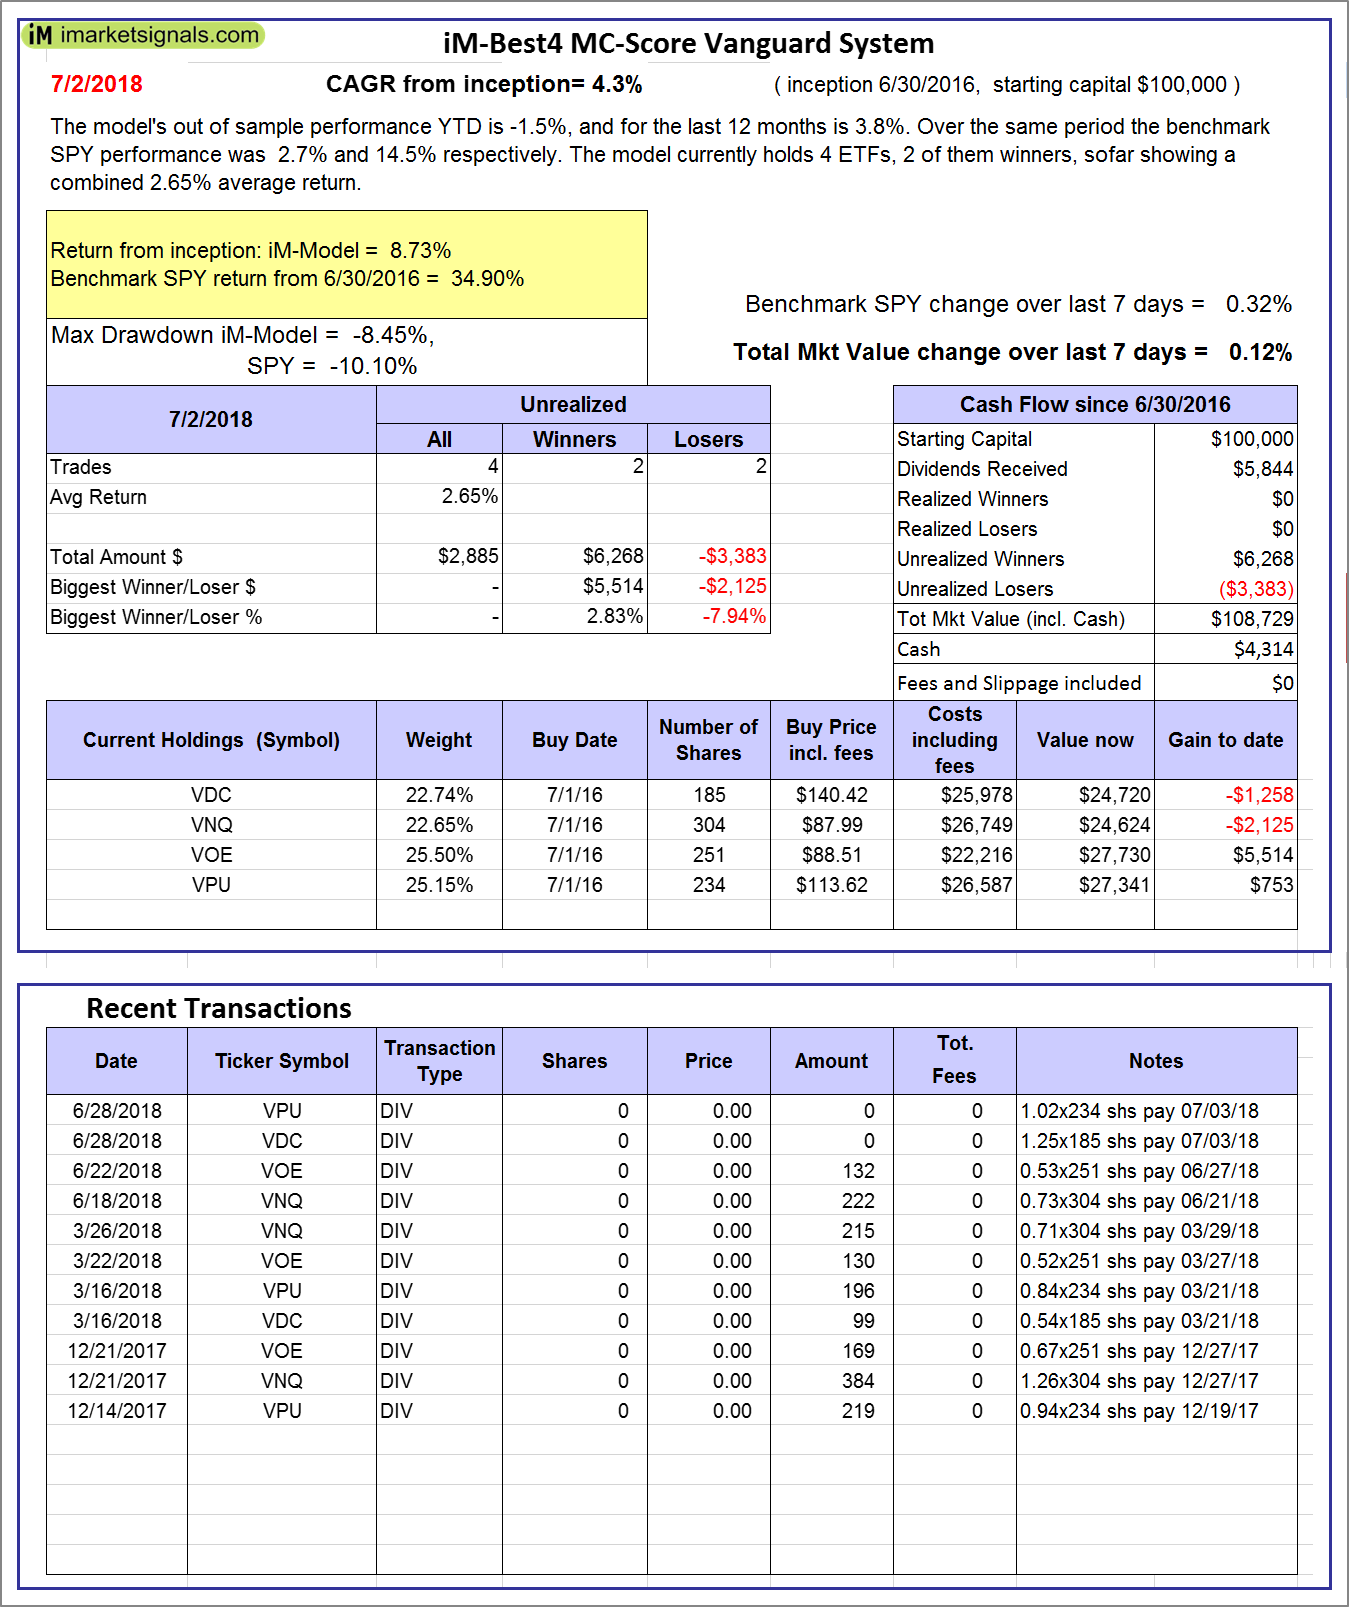 |
iM-Best4 MC-Score Vanguard System: The model’s out of sample performance YTD is -1.5%, and for the last 12 months is 3.8%. Over the same period the benchmark SPY performance was 2.7% and 14.5% respectively. Over the previous week the market value of the iM-Best4 MC-Score Vanguard System gained 0.12% at a time when SPY gained 0.32%. A starting capital of $100,000 at inception on 6/30/2016 would have grown to $108,729 which includes $4,314 cash and excludes $00 spent on fees and slippage. |
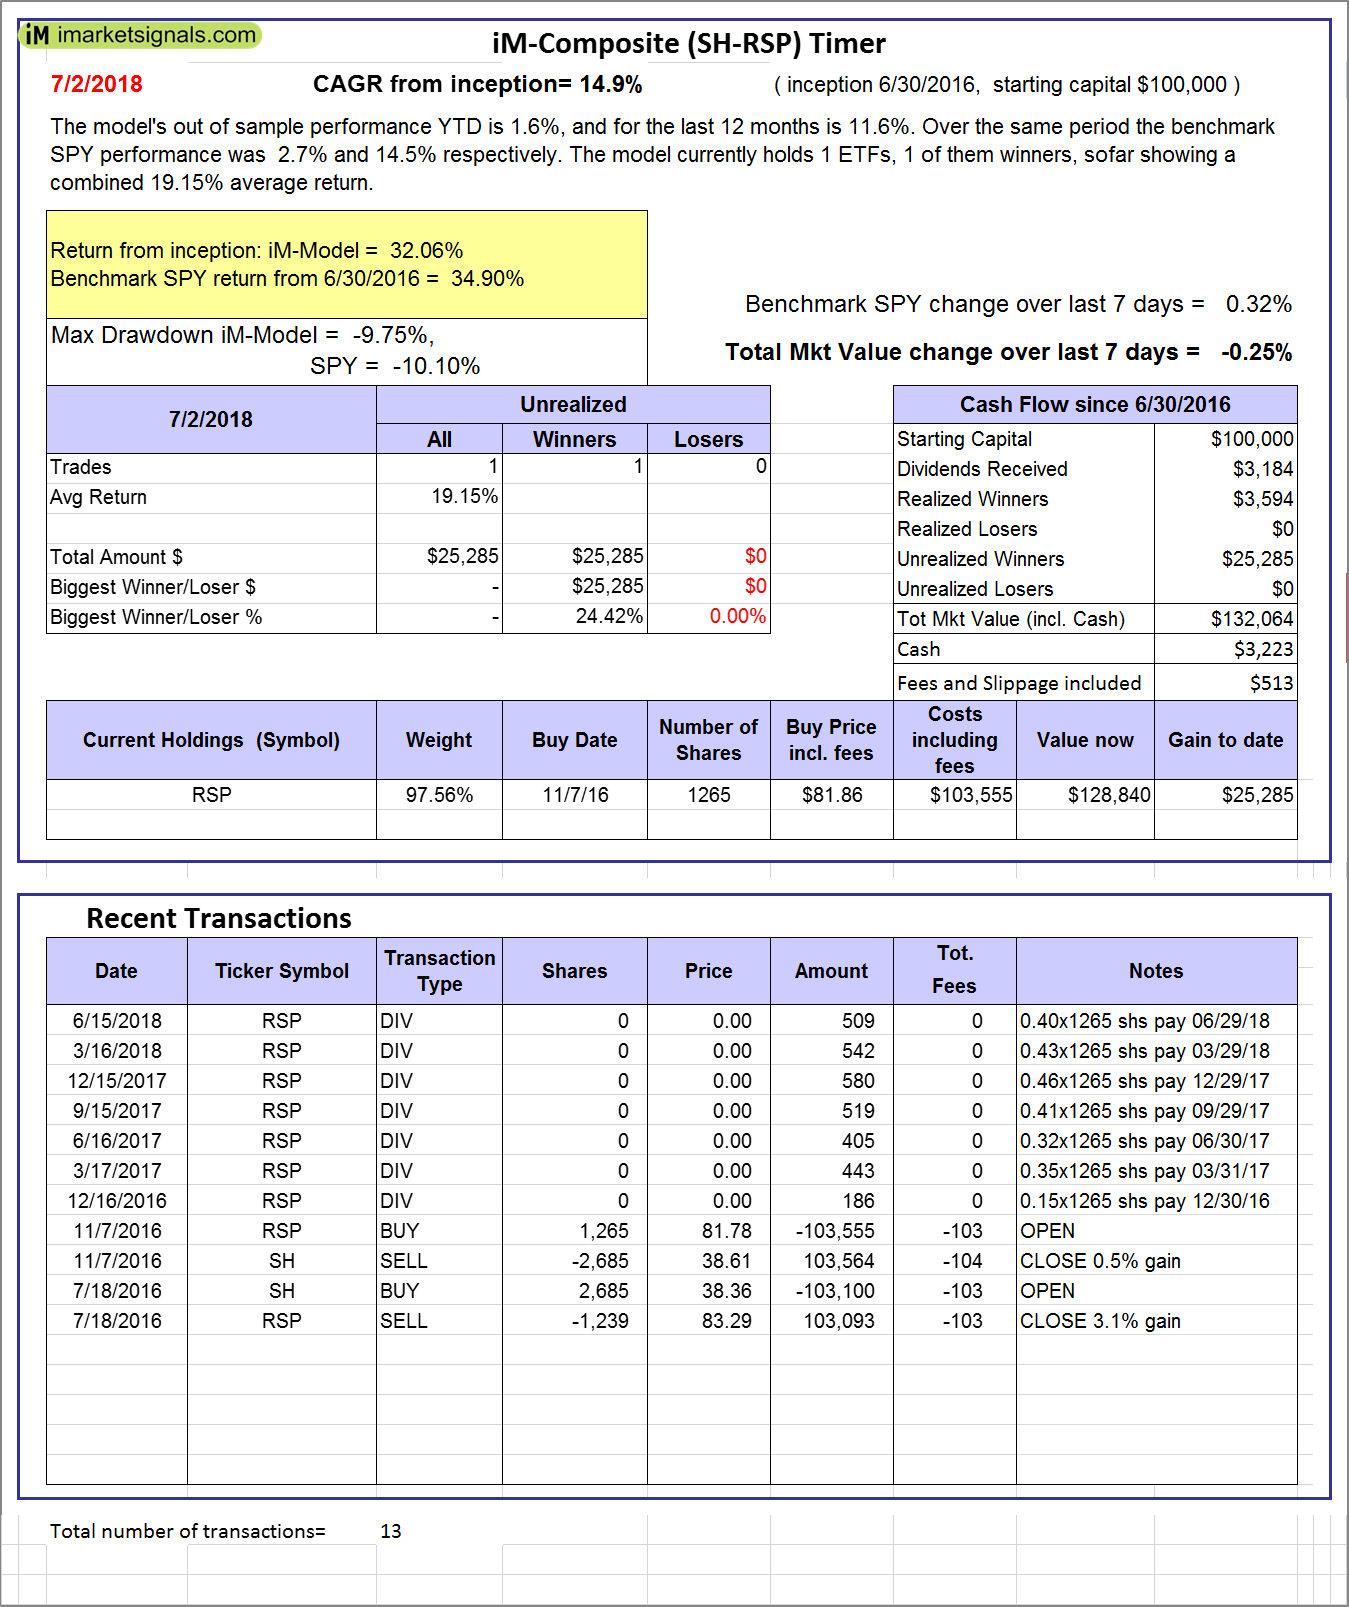 |
iM-Composite (SH-RSP) Timer: The model’s out of sample performance YTD is 1.6%, and for the last 12 months is 11.6%. Over the same period the benchmark SPY performance was 2.7% and 14.5% respectively. Over the previous week the market value of the iM-Composite (SH-RSP) Timer gained -0.25% at a time when SPY gained 0.32%. A starting capital of $100,000 at inception on 6/30/2016 would have grown to $132,064 which includes $3,223 cash and excludes $513 spent on fees and slippage. |
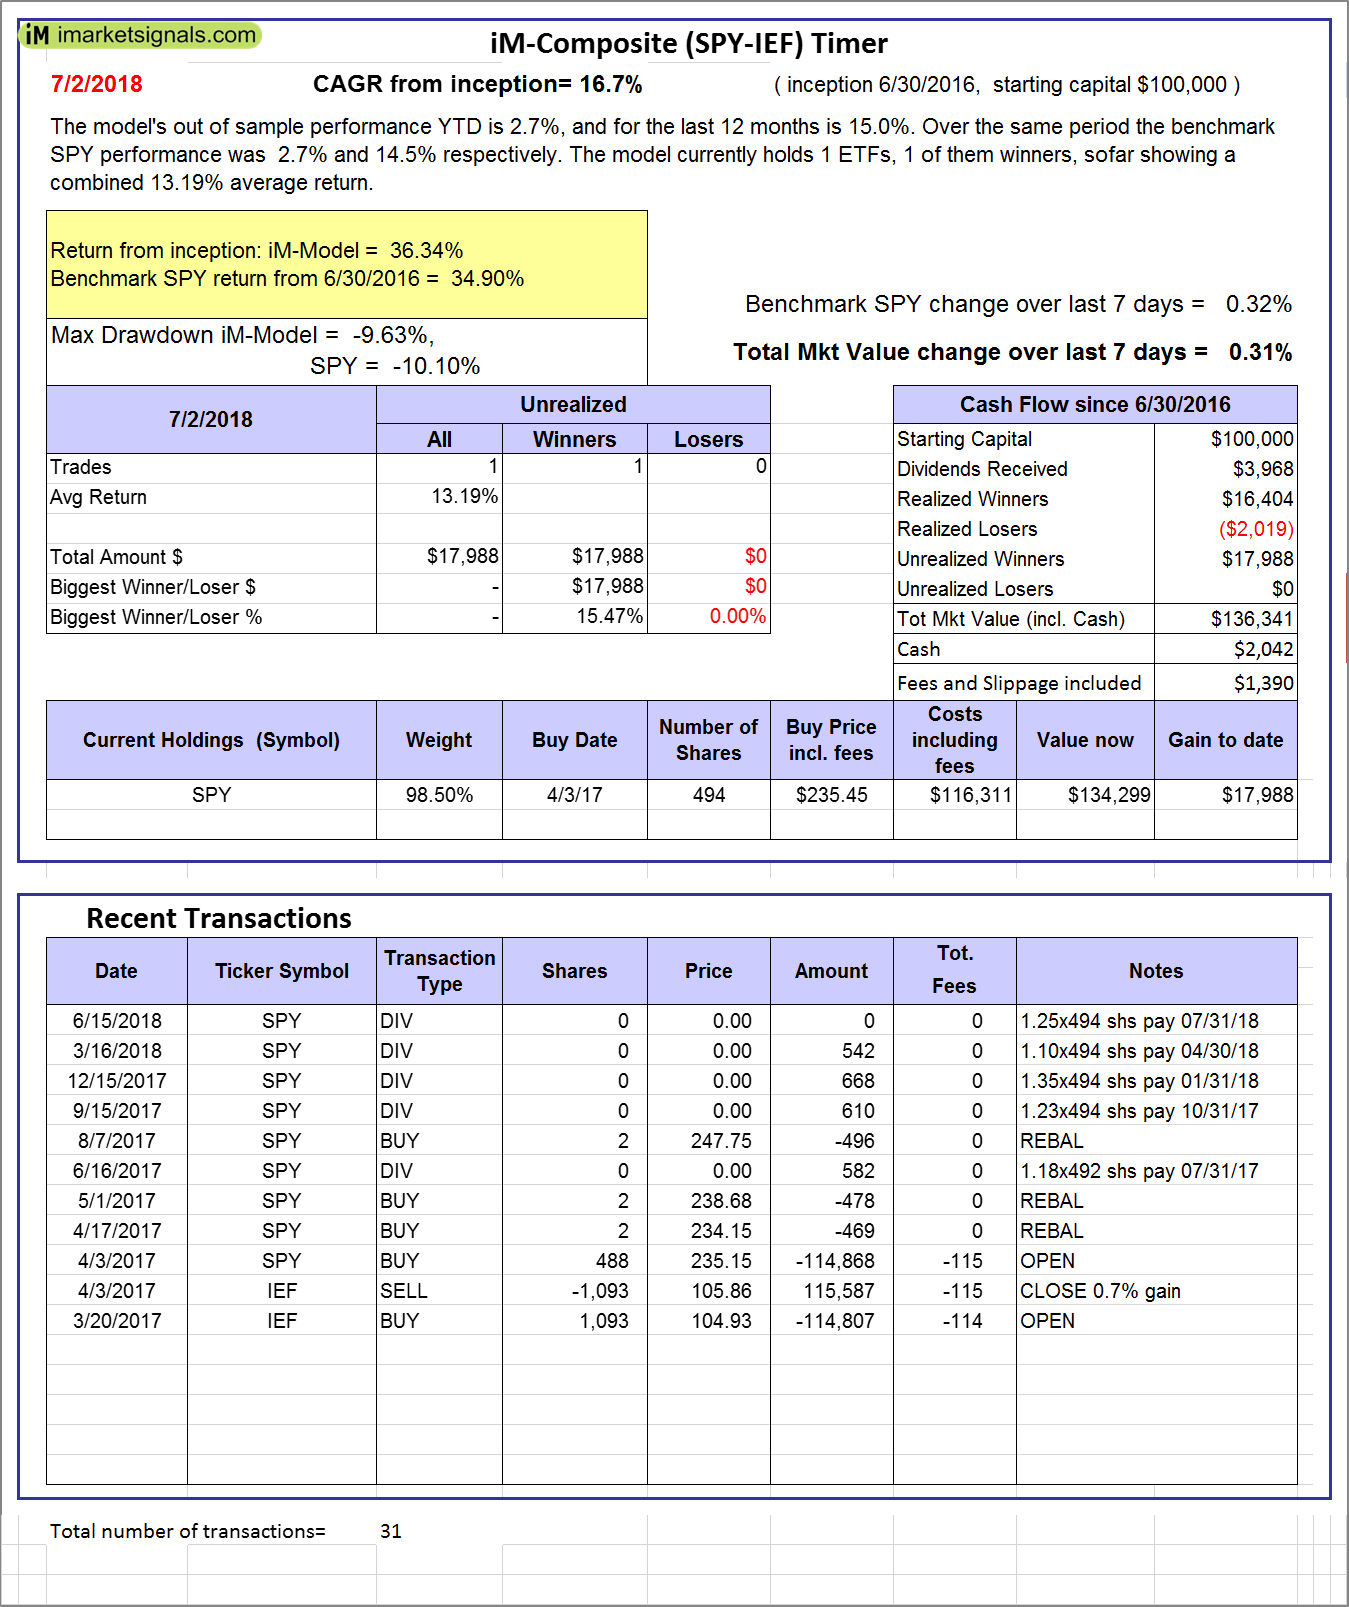 |
iM-Composite (SPY-IEF) Timer: The model’s out of sample performance YTD is 2.7%, and for the last 12 months is 15.0%. Over the same period the benchmark SPY performance was 2.7% and 14.5% respectively. Over the previous week the market value of the iM-Composite (SPY-IEF) Timer gained 0.31% at a time when SPY gained 0.32%. A starting capital of $100,000 at inception on 6/30/2016 would have grown to $136,341 which includes $2,042 cash and excludes $1,390 spent on fees and slippage. |
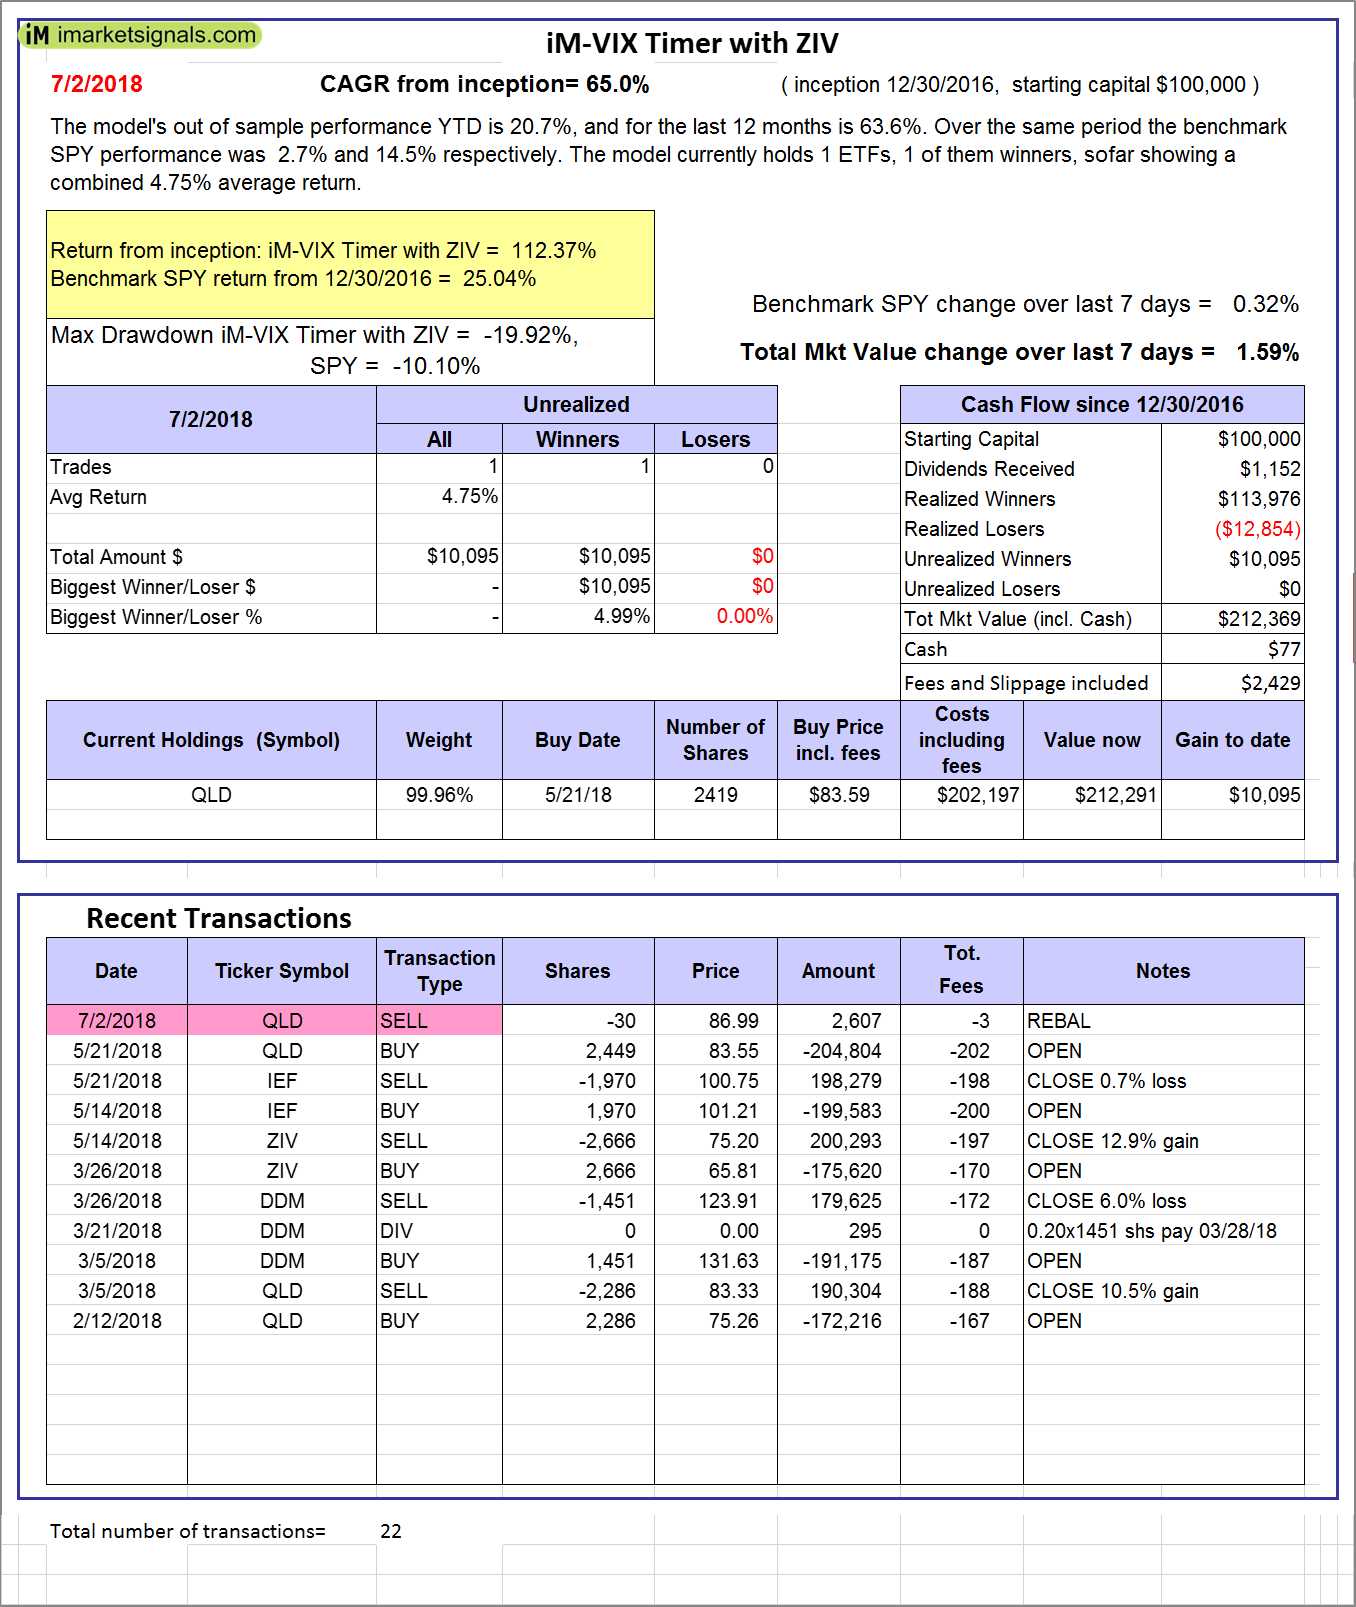 |
iM-VIX Timer with ZIV: The model’s out of sample performance YTD is 20.7%, and for the last 12 months is 63.6%. Over the same period the benchmark SPY performance was 2.7% and 14.5% respectively. Over the previous week the market value of the iM-VIX Timer with ZIV gained 1.59% at a time when SPY gained 0.32%. A starting capital of $100,000 at inception on 6/30/2016 would have grown to $212,369 which includes $77 cash and excludes $2,429 spent on fees and slippage. |
 |
iM-Composite(Gold-Stocks-Bond) Timer: The model’s out of sample performance YTD is -4.9%, and for the last 12 months is -0.4%. Over the same period the benchmark SPY performance was 2.7% and 14.5% respectively. Over the previous week the market value of the iM-Composite(Gold-Stocks-Bond) Timer gained -2.00% at a time when SPY gained 0.32%. A starting capital of $100,000 at inception on 6/30/2016 would have grown to $122,357 which includes $53 cash and excludes $1,955 spent on fees and slippage. |
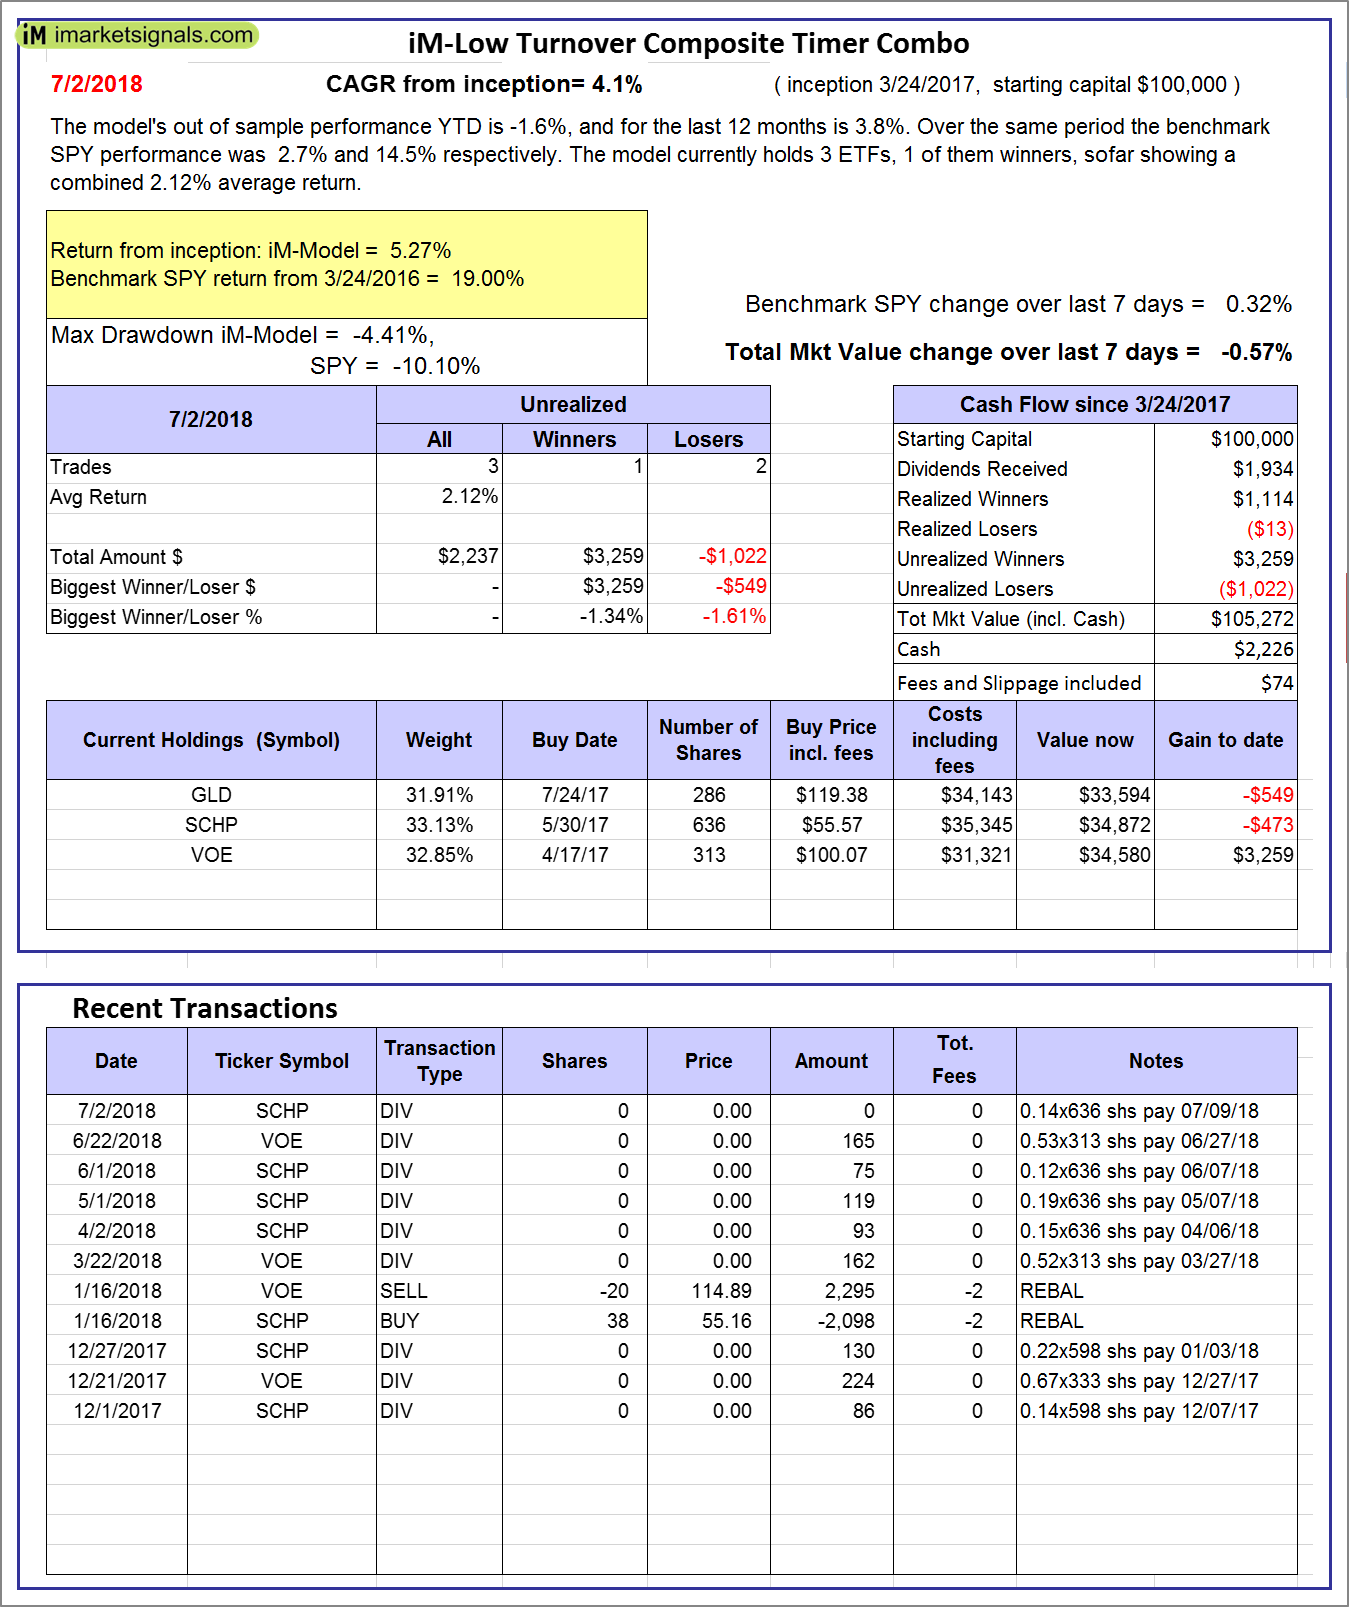 |
iM-Low Turnover Composite Timer Combo: The model’s out of sample performance YTD is -1.6%, and for the last 12 months is 3.8%. Over the same period the benchmark SPY performance was 2.7% and 14.5% respectively. Over the previous week the market value of the iM-Low Turnover Composite Timer Combo gained -0.57% at a time when SPY gained 0.32%. A starting capital of $100,000 at inception on 3/24/27 would have grown to $105,272 which includes $2,226 cash and excludes $74 spent on fees and slippage. |
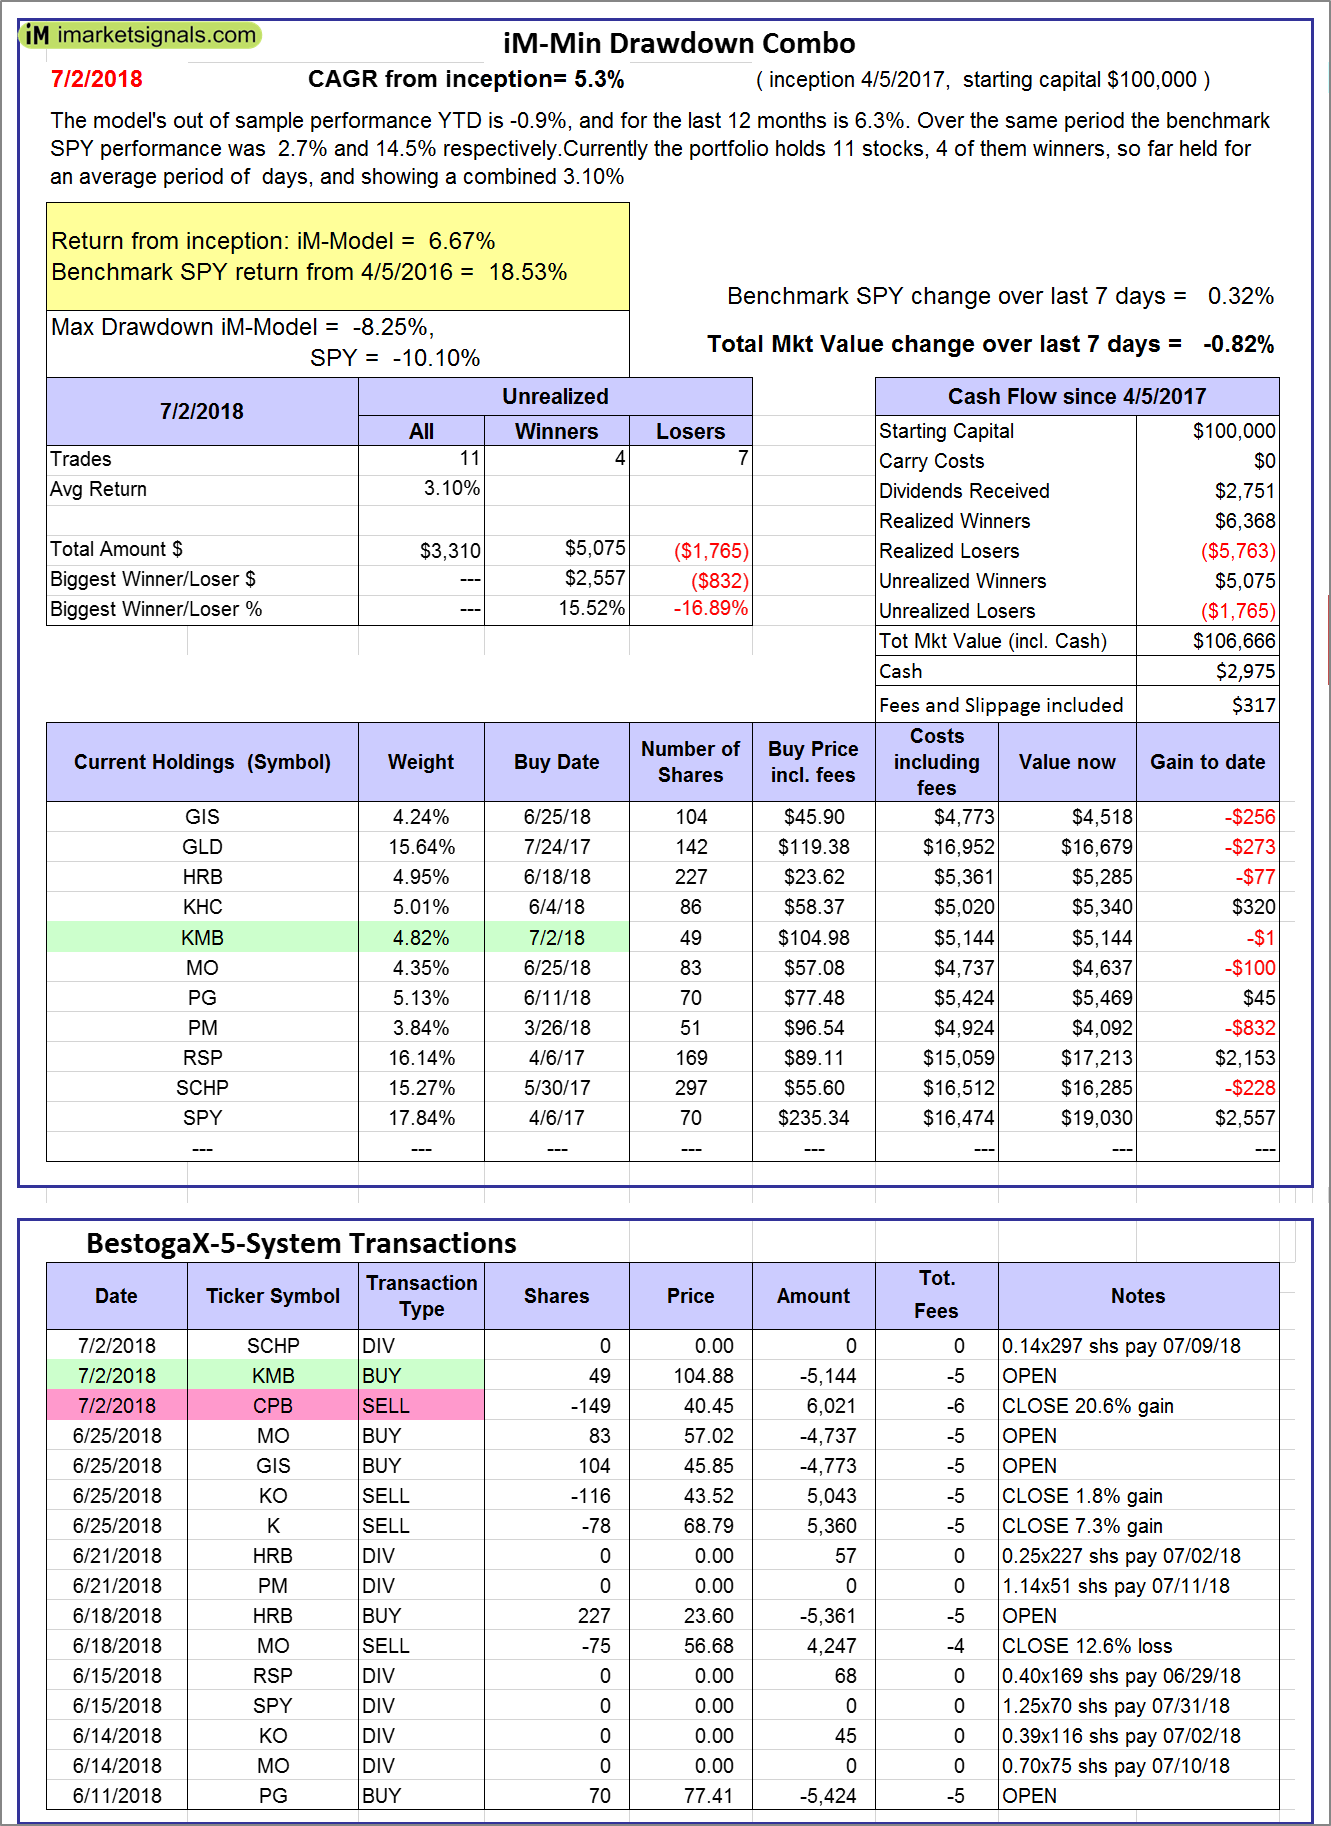 |
iM-Min Drawdown Combo: The model’s out of sample performance YTD is -0.9%, and for the last 12 months is 6.3%. Over the same period the benchmark SPY performance was 2.7% and 14.5% respectively. Over the previous week the market value of the iM-Min Drawdown Combo gained -0.82% at a time when SPY gained 0.32%. A starting capital of $100,000 at inception on 4/5/2017 would have grown to $106,666 which includes $2,975 cash and excludes $317 spent on fees and slippage. |
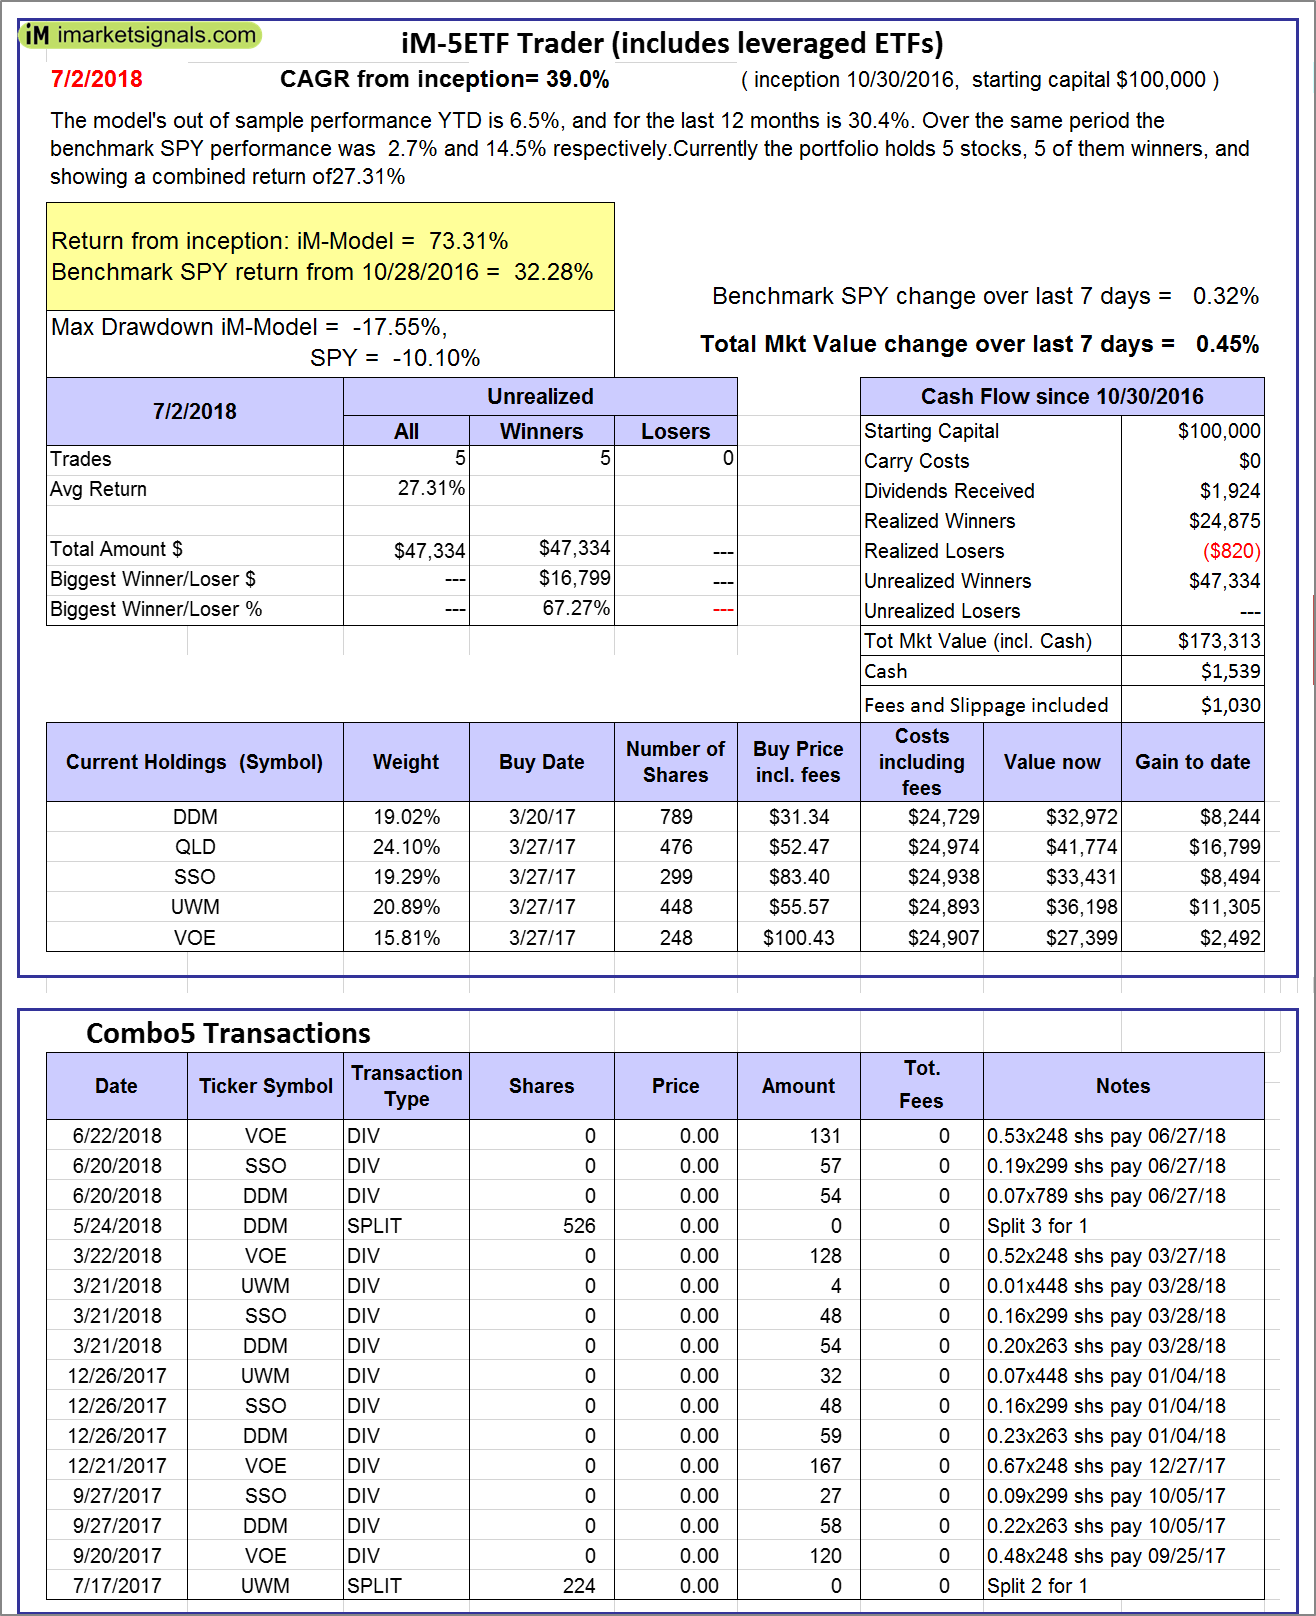 |
iM-5ETF Trader (includes leveraged ETFs): The model’s out of sample performance YTD is 6.5%, and for the last 12 months is 30.4%. Over the same period the benchmark SPY performance was 2.7% and 14.5% respectively. Over the previous week the market value of the iM-5ETF Trader (includes leveraged ETFs) gained 0.45% at a time when SPY gained 0.32%. A starting capital of $100,000 at inception on 10/30/2016 would have grown to $173,313 which includes $1,539 cash and excludes $1,030 spent on fees and slippage. |
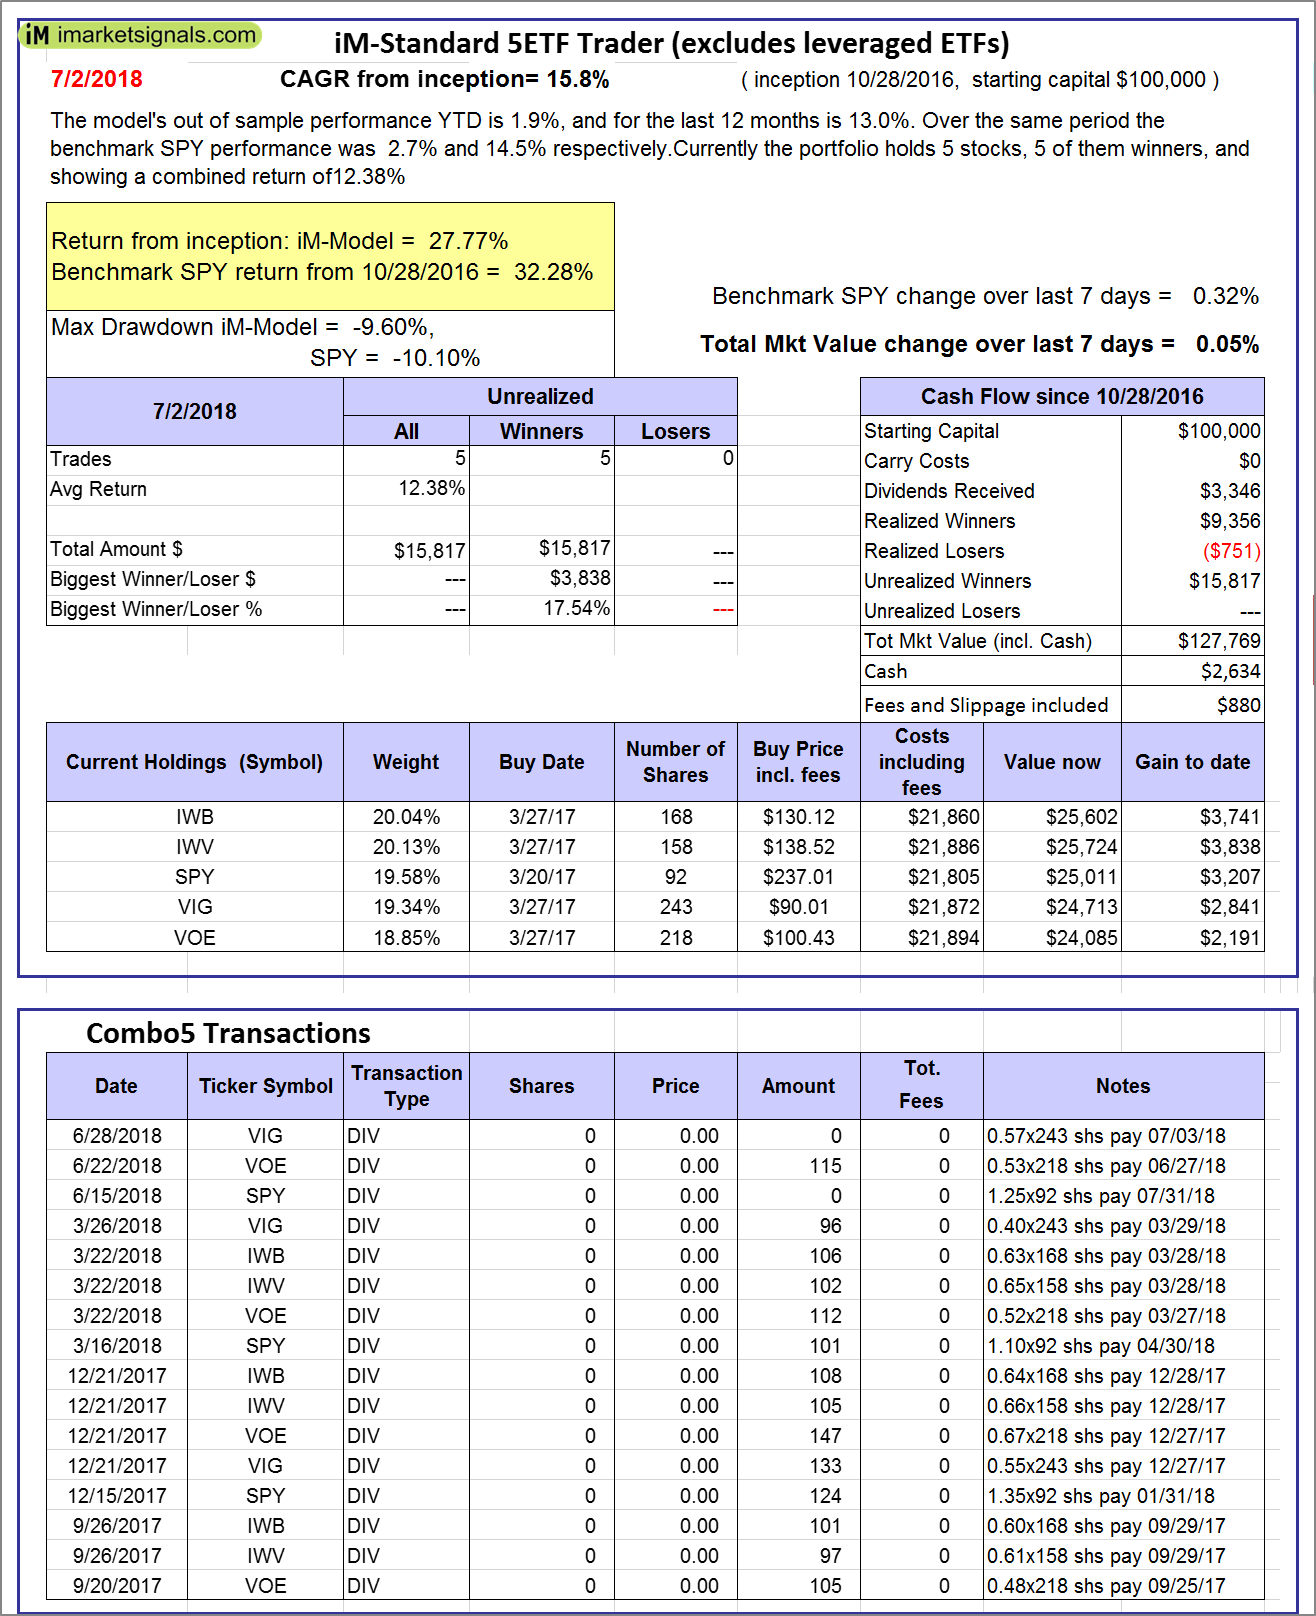 |
iM-Standard 5ETF Trader (excludes leveraged ETFs): The model’s out of sample performance YTD is 1.9%, and for the last 12 months is 13.0%. Over the same period the benchmark SPY performance was 2.7% and 14.5% respectively. Over the previous week the market value of the iM-Standard 5ETF Trader (excludes leveraged ETFs) gained 0.05% at a time when SPY gained 0.32%. A starting capital of $100,000 at inception on 10/30/2016 would have grown to $127,769 which includes $2,634 cash and excludes $880 spent on fees and slippage. |
iM-Best Reports – 7/2/2018
Posted in pmp SPY-SH
Leave a Reply
You must be logged in to post a comment.