
  |
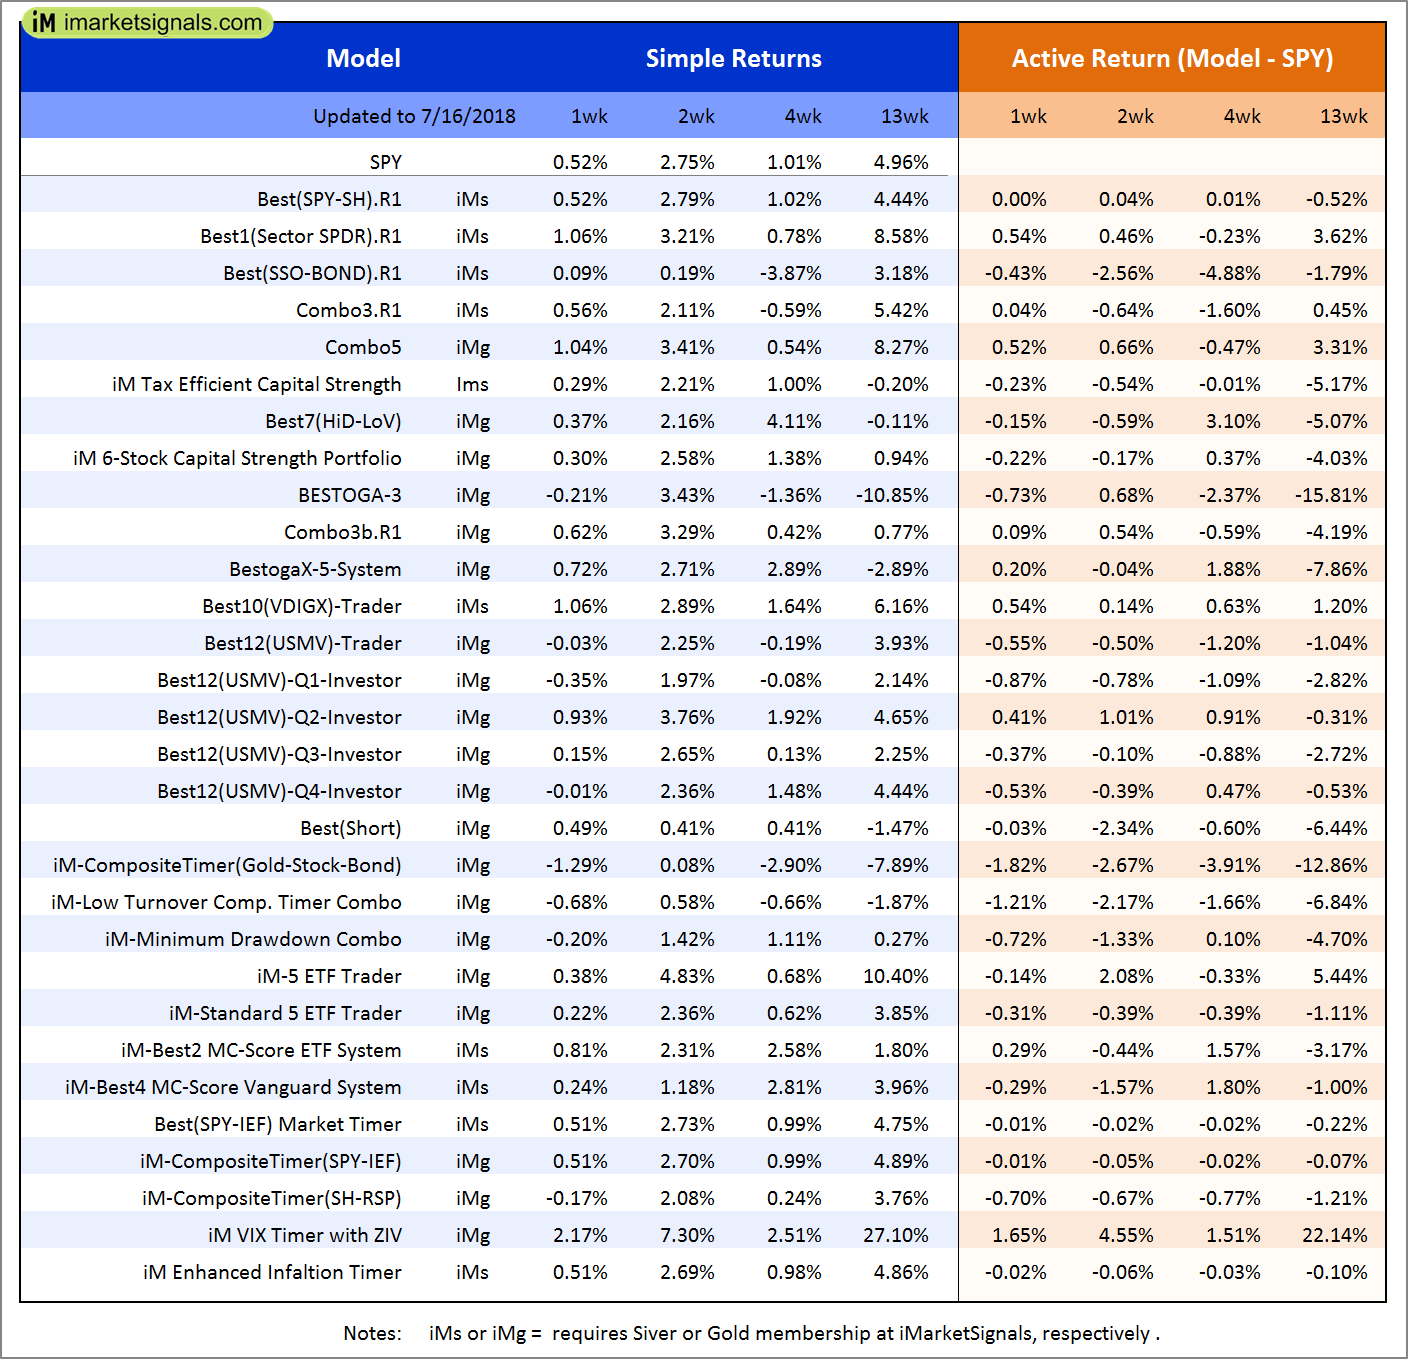
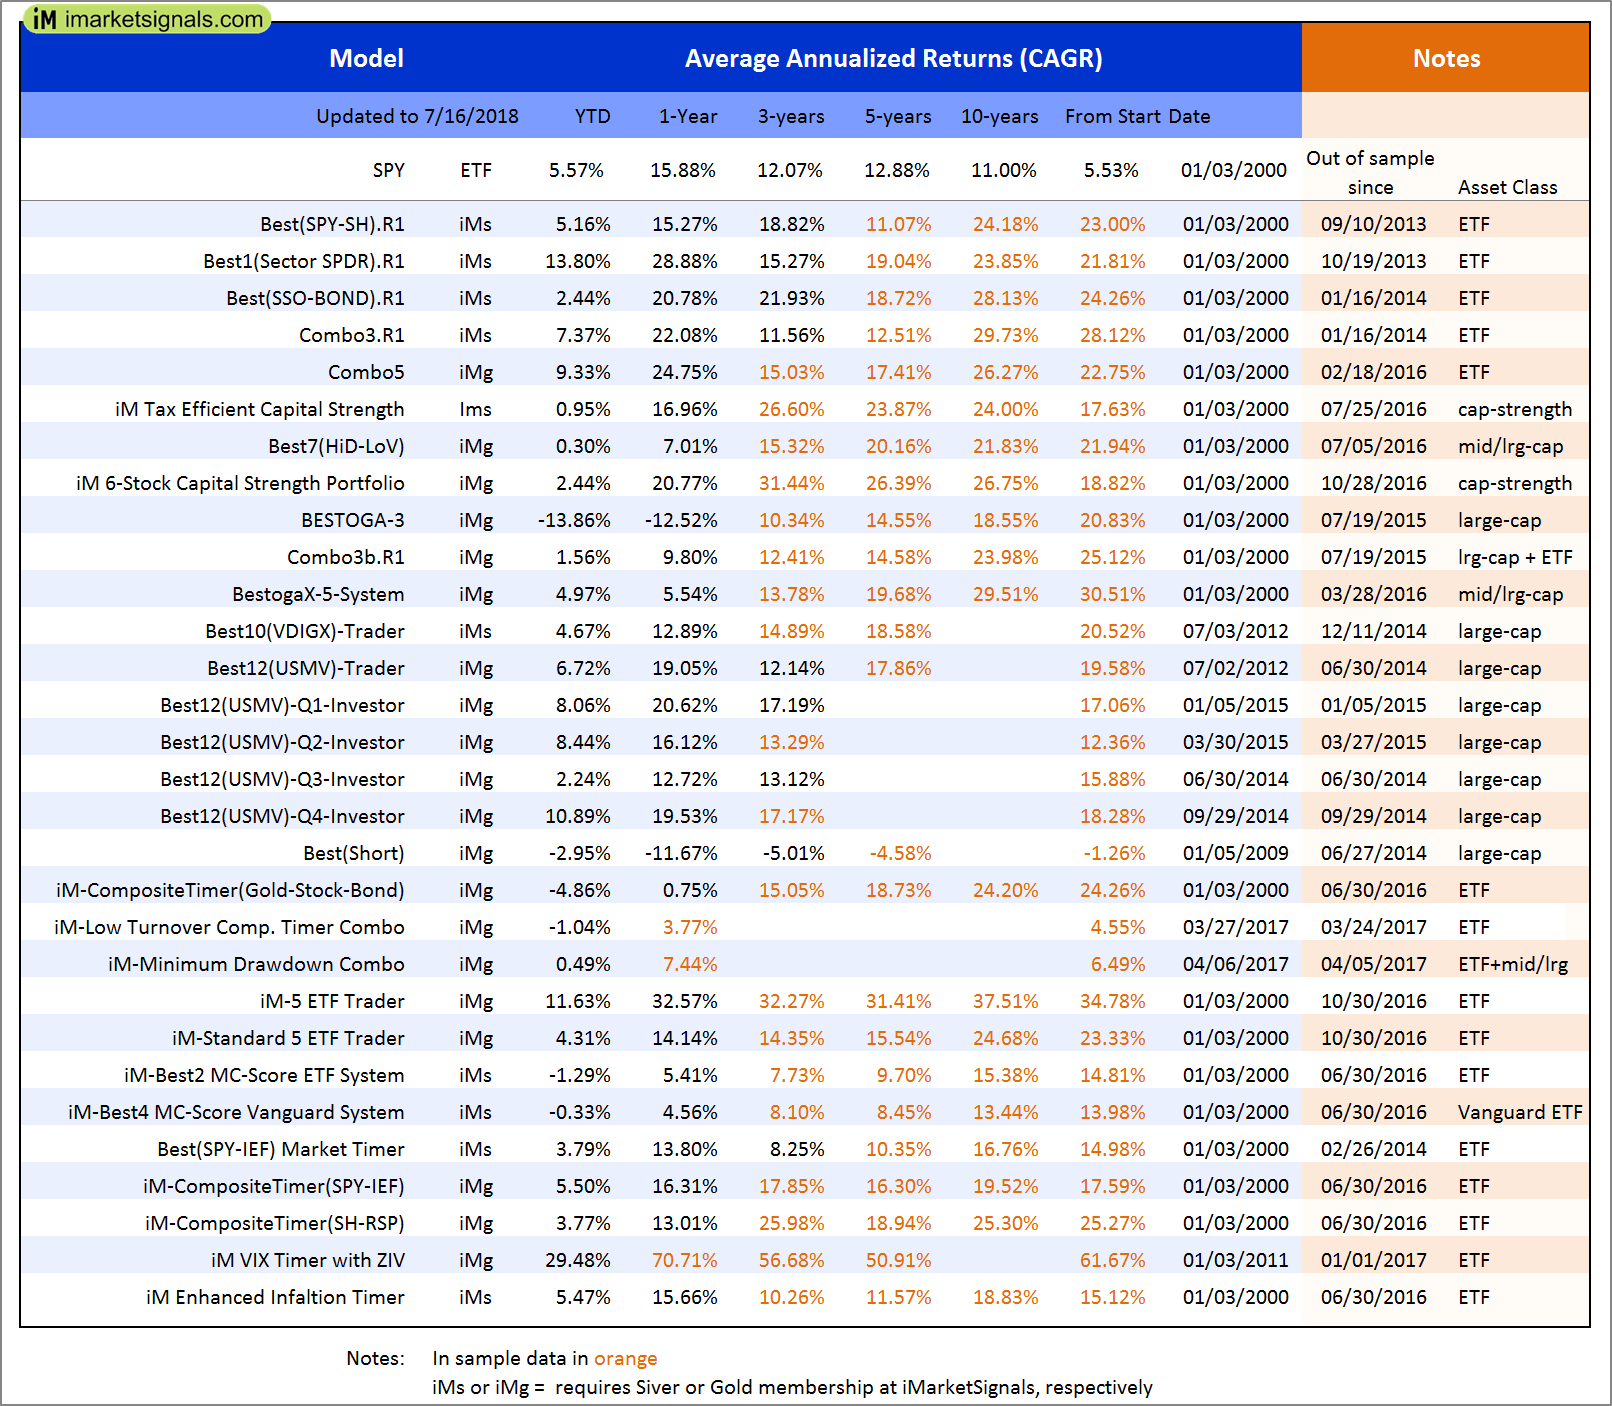
Out of sample performance summary of our models for the past 1, 2, 4 and 13 week periods. The active active return indicates how the models over- or underperformed the benchmark ETF SPY. Also the YTD, and the 1-, 3-, 5- and 10-year annualized returns are shown in the second table |
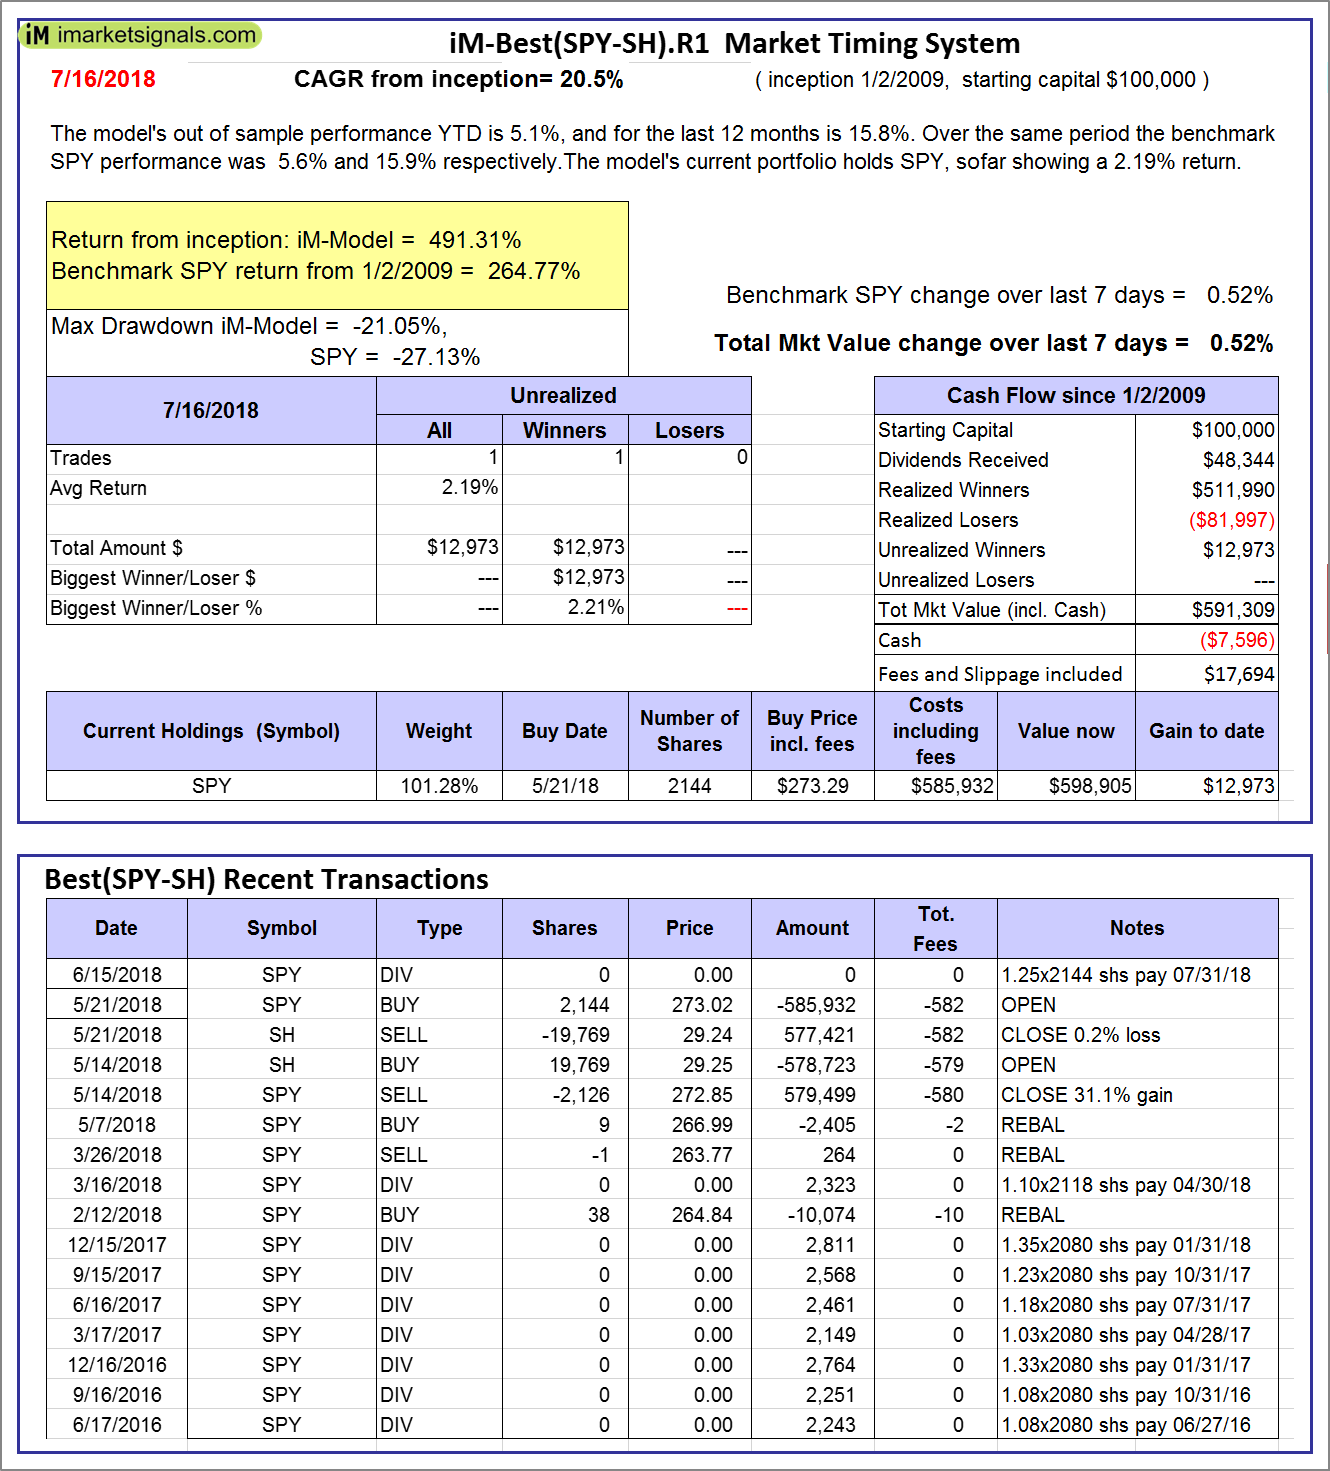 |
iM-Best(SPY-SH).R1: The model’s out of sample performance YTD is 5.1%, and for the last 12 months is 15.8%. Over the same period the benchmark SPY performance was 5.6% and 15.9% respectively. Over the previous week the market value of Best(SPY-SH) gained 0.52% at a time when SPY gained 0.52%. A starting capital of $100,000 at inception on 1/2/2009 would have grown to $591,309 which includes -$7,596 cash and excludes $17,694 spent on fees and slippage. |
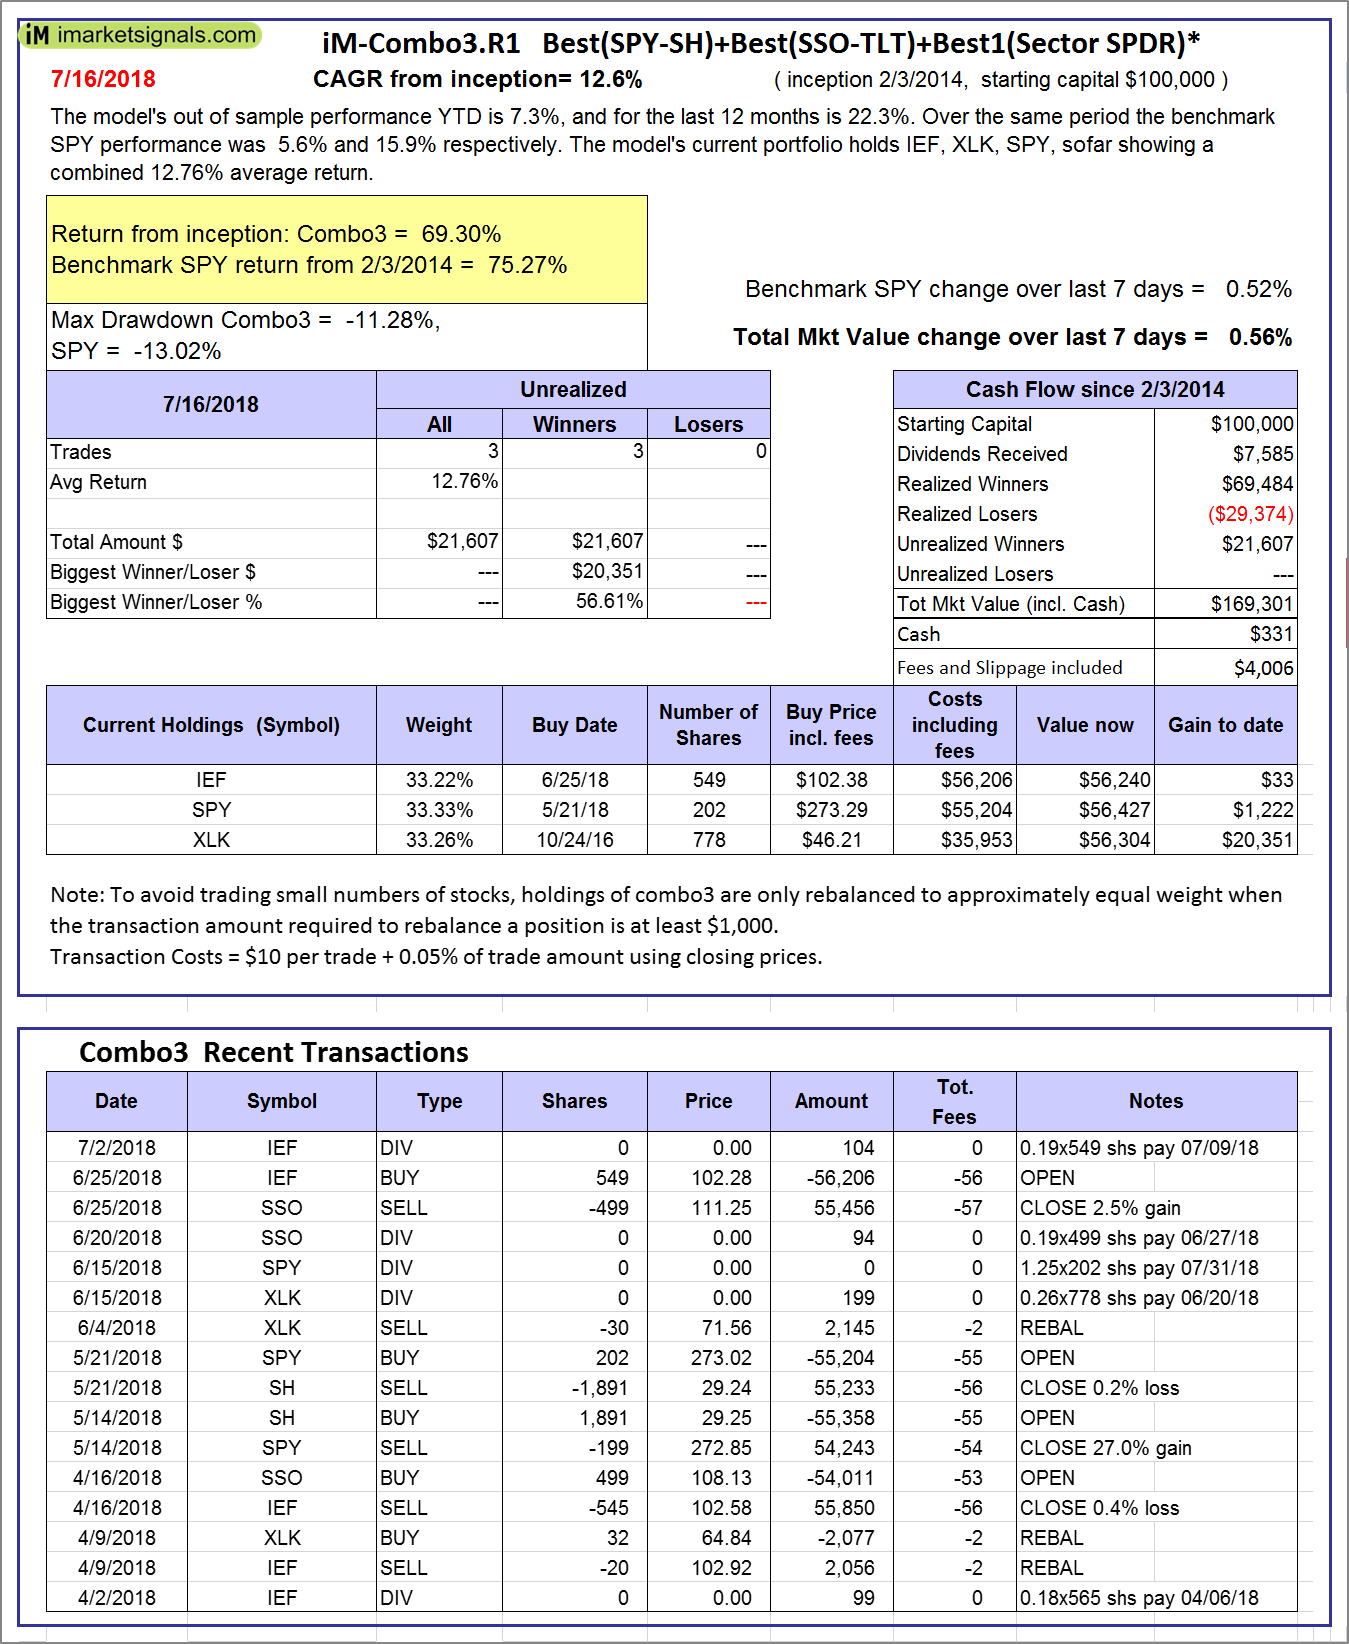 |
iM-Combo3.R1: The model’s out of sample performance YTD is 7.3%, and for the last 12 months is 22.3%. Over the same period the benchmark SPY performance was 5.6% and 15.9% respectively. Over the previous week the market value of iM-Combo3.R1 gained 0.56% at a time when SPY gained 0.52%. A starting capital of $100,000 at inception on 2/3/2014 would have grown to $169,301 which includes $331 cash and excludes $4,006 spent on fees and slippage. |
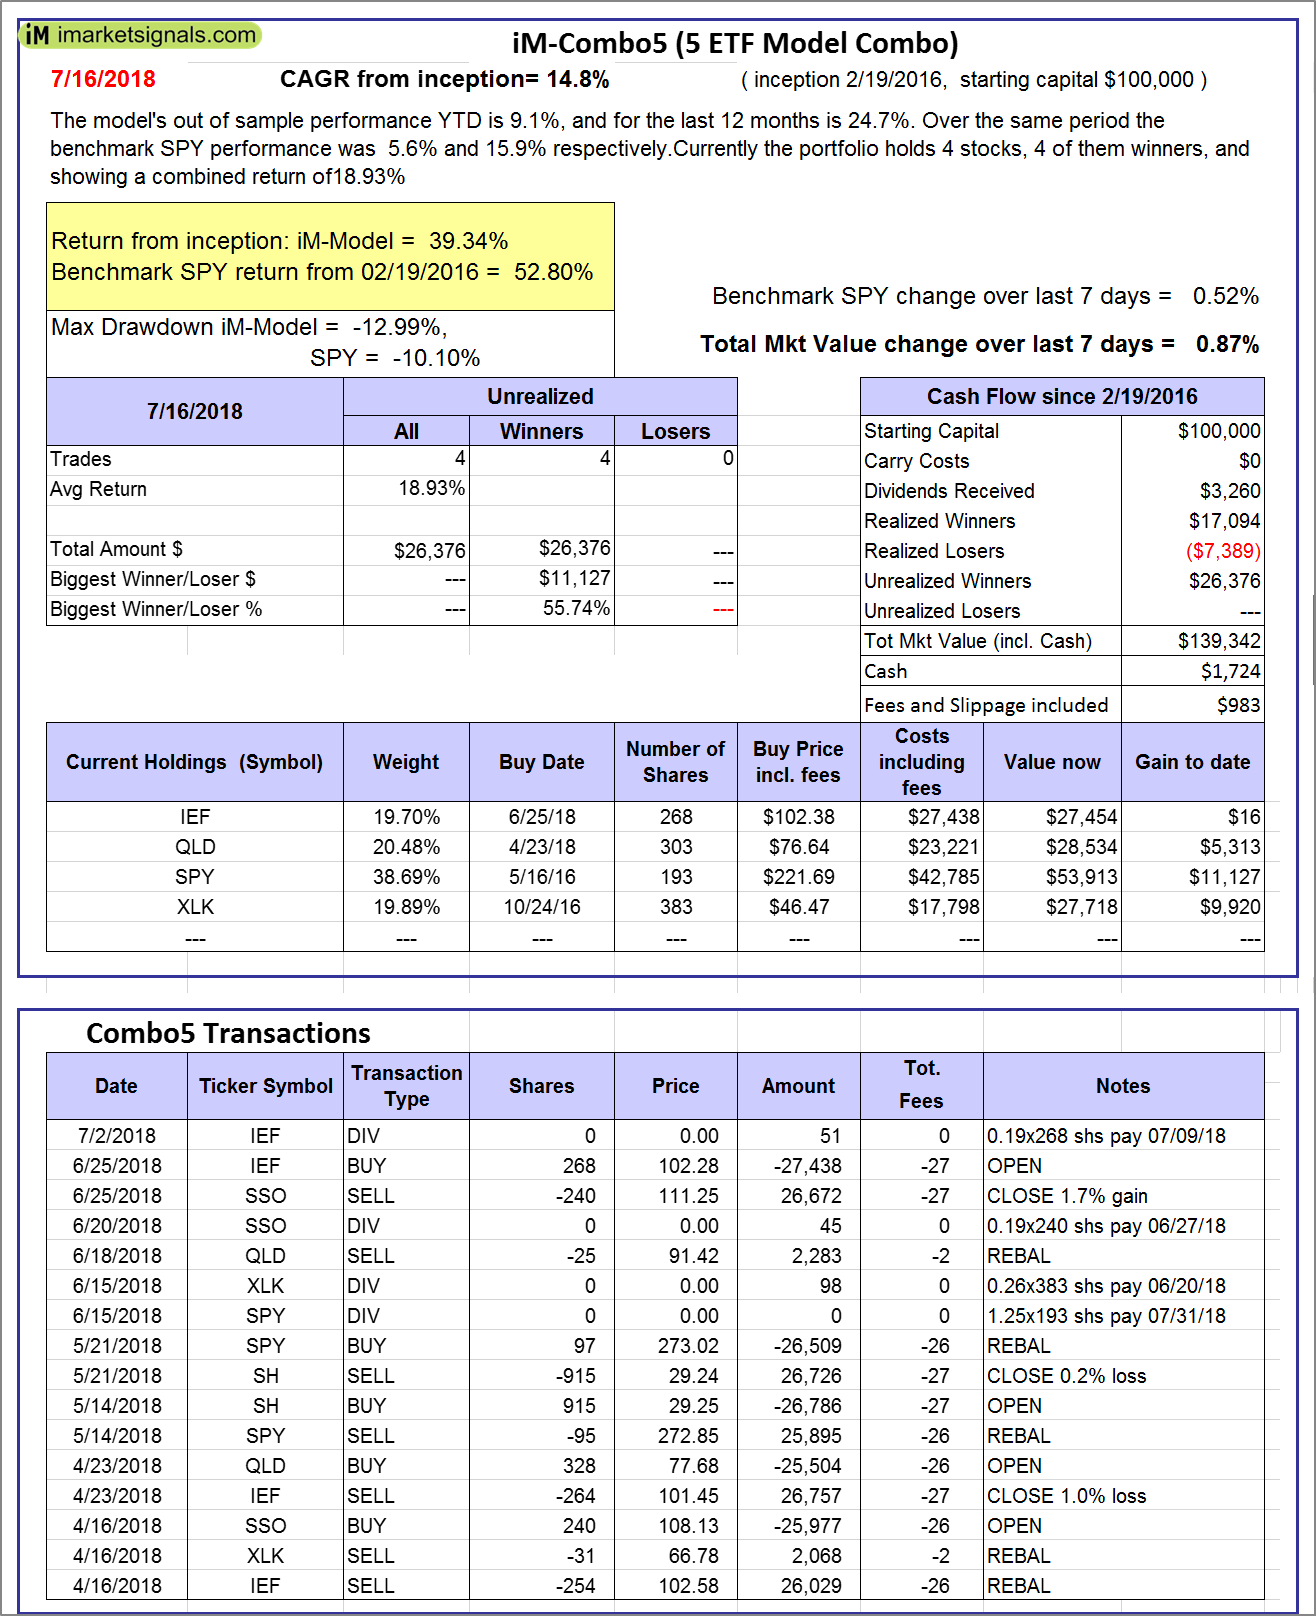 |
iM-Combo5: The model’s out of sample performance YTD is 9.1%, and for the last 12 months is 24.7%. Over the same period the benchmark SPY performance was 5.6% and 15.9% respectively. Over the previous week the market value of iM-Combo5 gained 0.87% at a time when SPY gained 0.52%. A starting capital of $100,000 at inception on 2/22/2016 would have grown to $139,342 which includes $1,724 cash and excludes $983 spent on fees and slippage. |
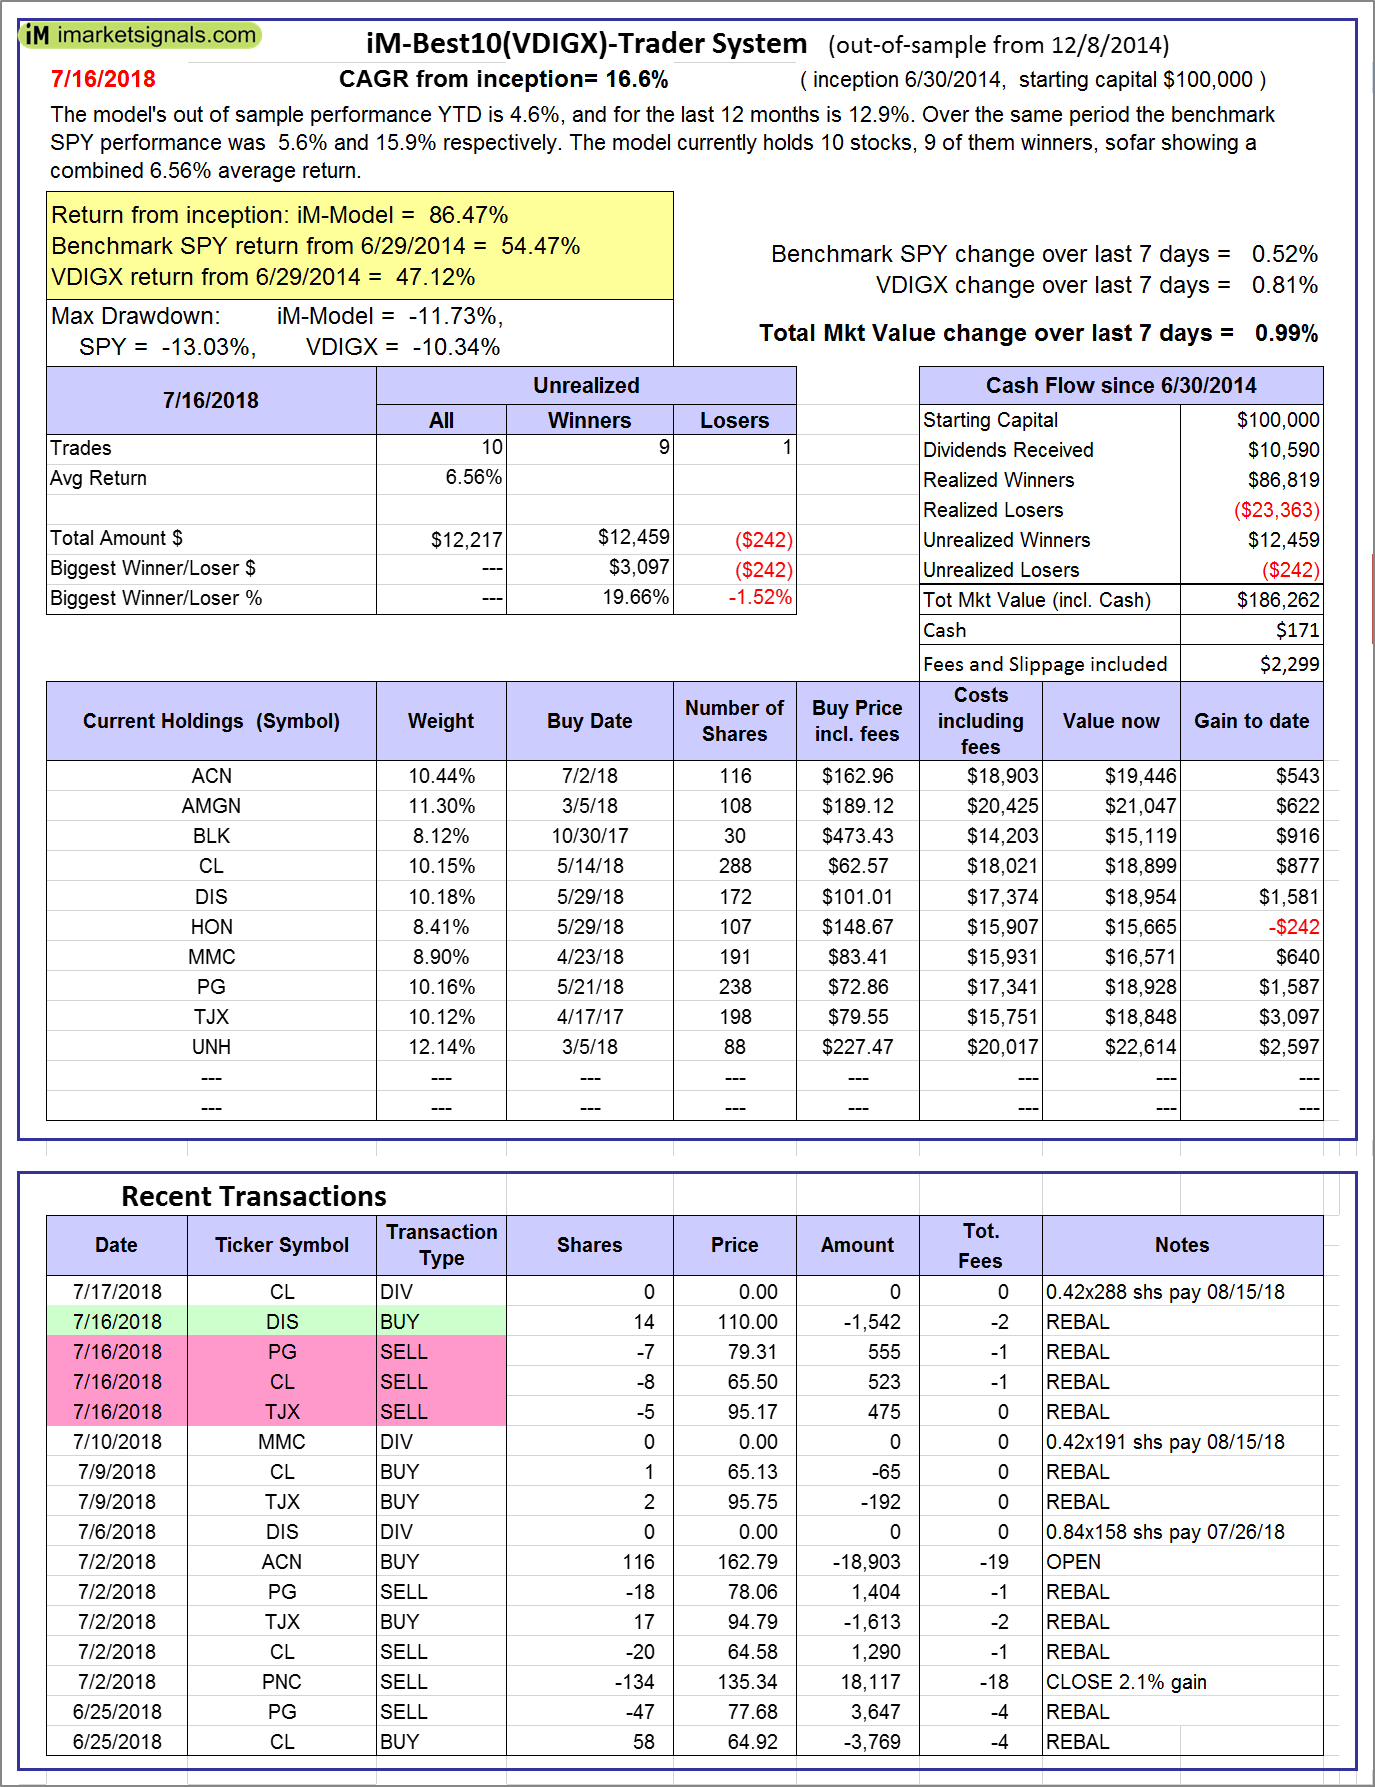 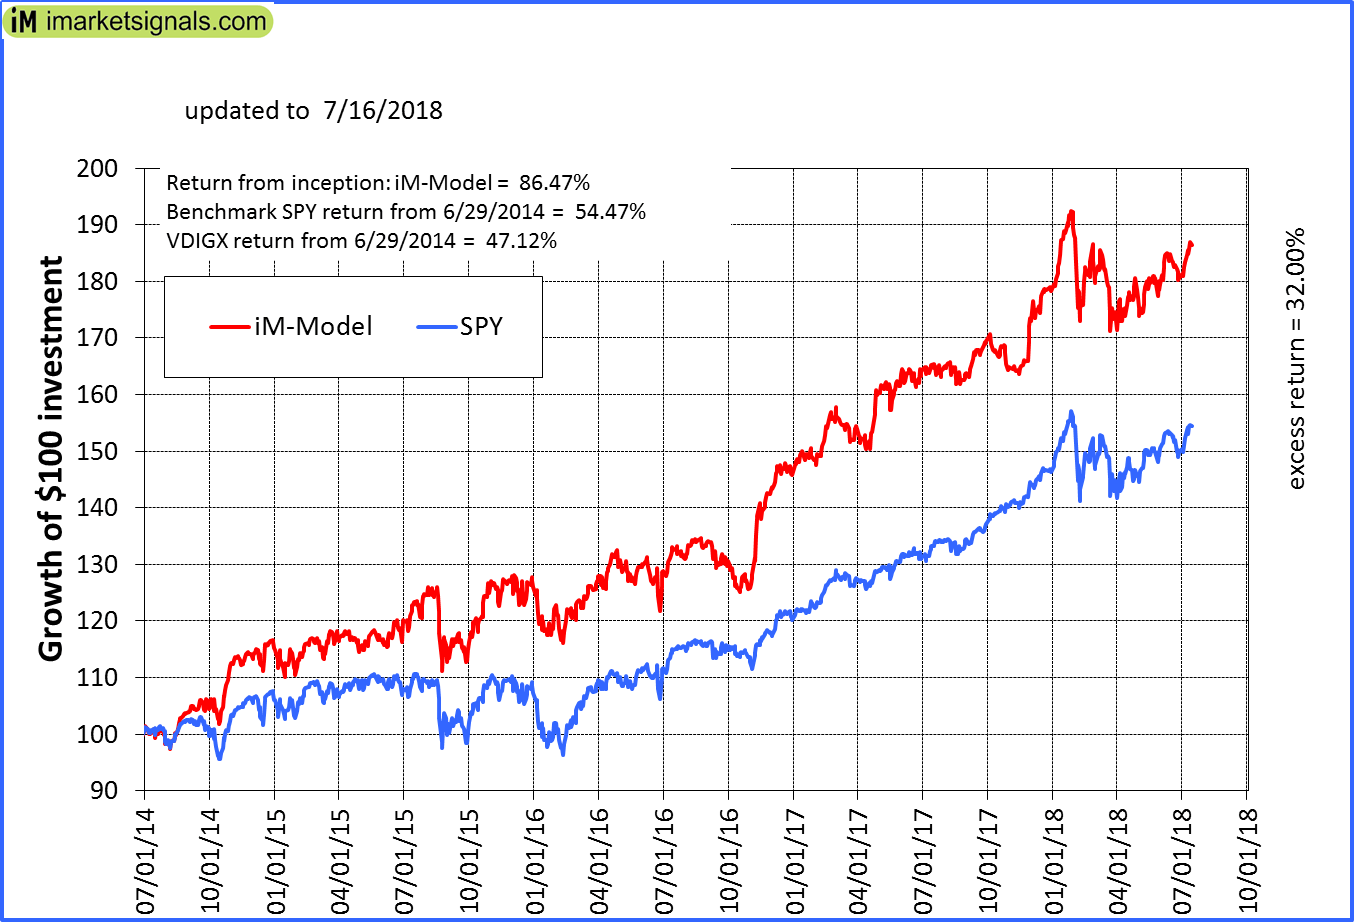 |
iM-Best10(VDIGX)-Trader: The model’s out of sample performance YTD is 4.6%, and for the last 12 months is 12.9%. Over the same period the benchmark SPY performance was 5.6% and 15.9% respectively. Since inception, on 7/1/2014, the model gained 86.47% while the benchmark SPY gained 54.47% and VDIGX gained 47.12% over the same period. Over the previous week the market value of iM-Best10(VDIGX) gained 0.99% at a time when SPY gained 0.52%. A starting capital of $100,000 at inception on 7/1/2014 would have grown to $186,262 which includes $171 cash and excludes $2,299 spent on fees and slippage. |
 |
iM-BESTOGA-3: The model’s out of sample performance YTD is -14.2%, and for the last 12 months is -12.5%. Over the same period the benchmark SPY performance was 5.6% and 15.9% respectively. Over the previous week the market value of iM-BESTOGA-3 gained -0.58% at a time when SPY gained 0.52%. A starting capital of $100,000 at inception on 2/3/2014 would have grown to $198,979 which includes $1,394 cash and excludes $2,787 spent on fees and slippage. |
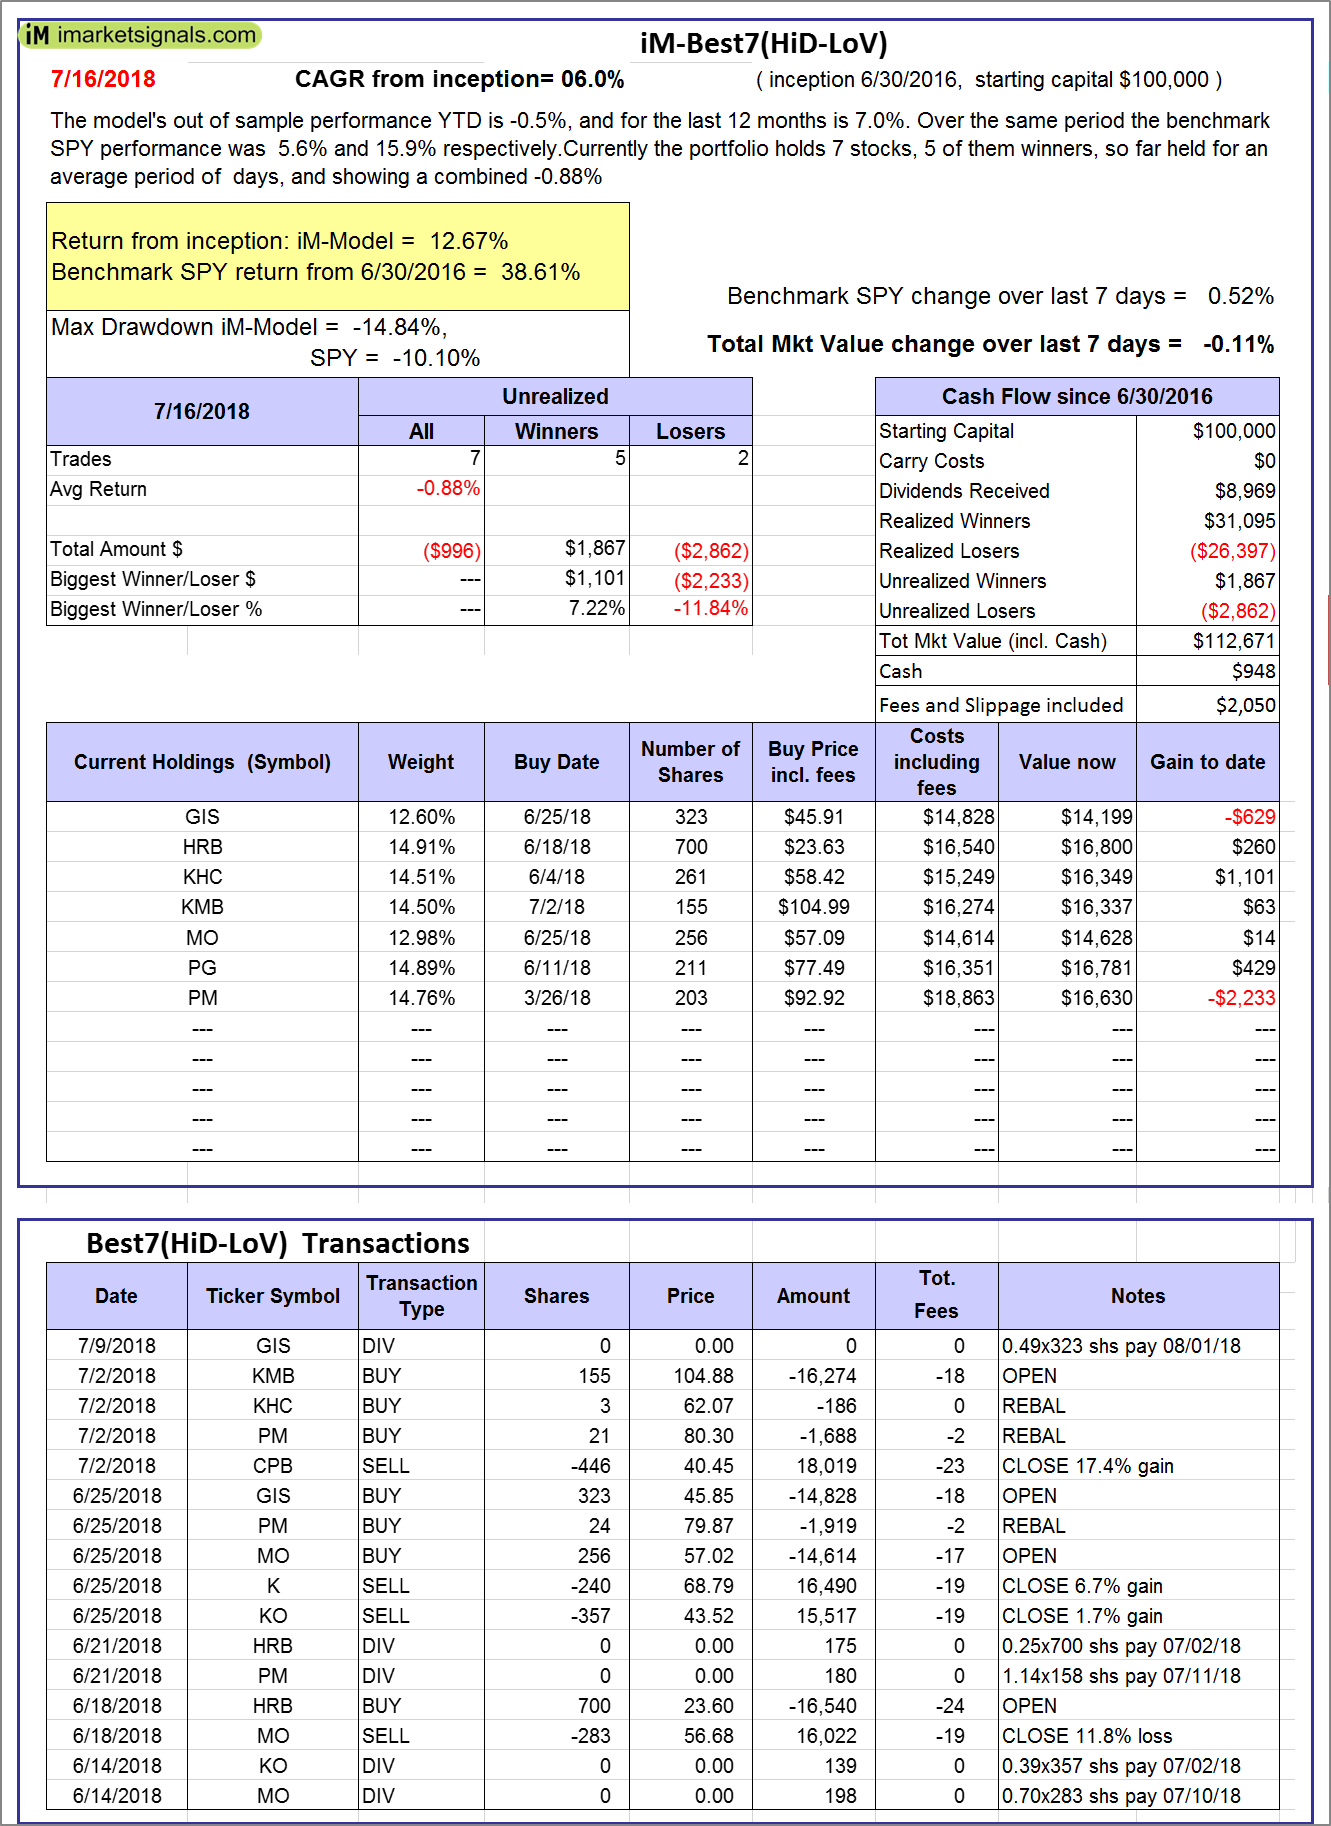 |
iM-Best7(HiD-LoV): The model’s out of sample performance YTD is -0.5%, and for the last 12 months is 7.0%. Over the same period the benchmark SPY performance was 5.6% and 15.9% respectively. Over the previous week the market value of iM-BESTOGA-3 gained -0.11% at a time when SPY gained 0.52%. A starting capital of $100,000 at inception on 6/30/2016 would have grown to $112,671 which includes $948 cash and excludes $2,050 spent on fees and slippage. |
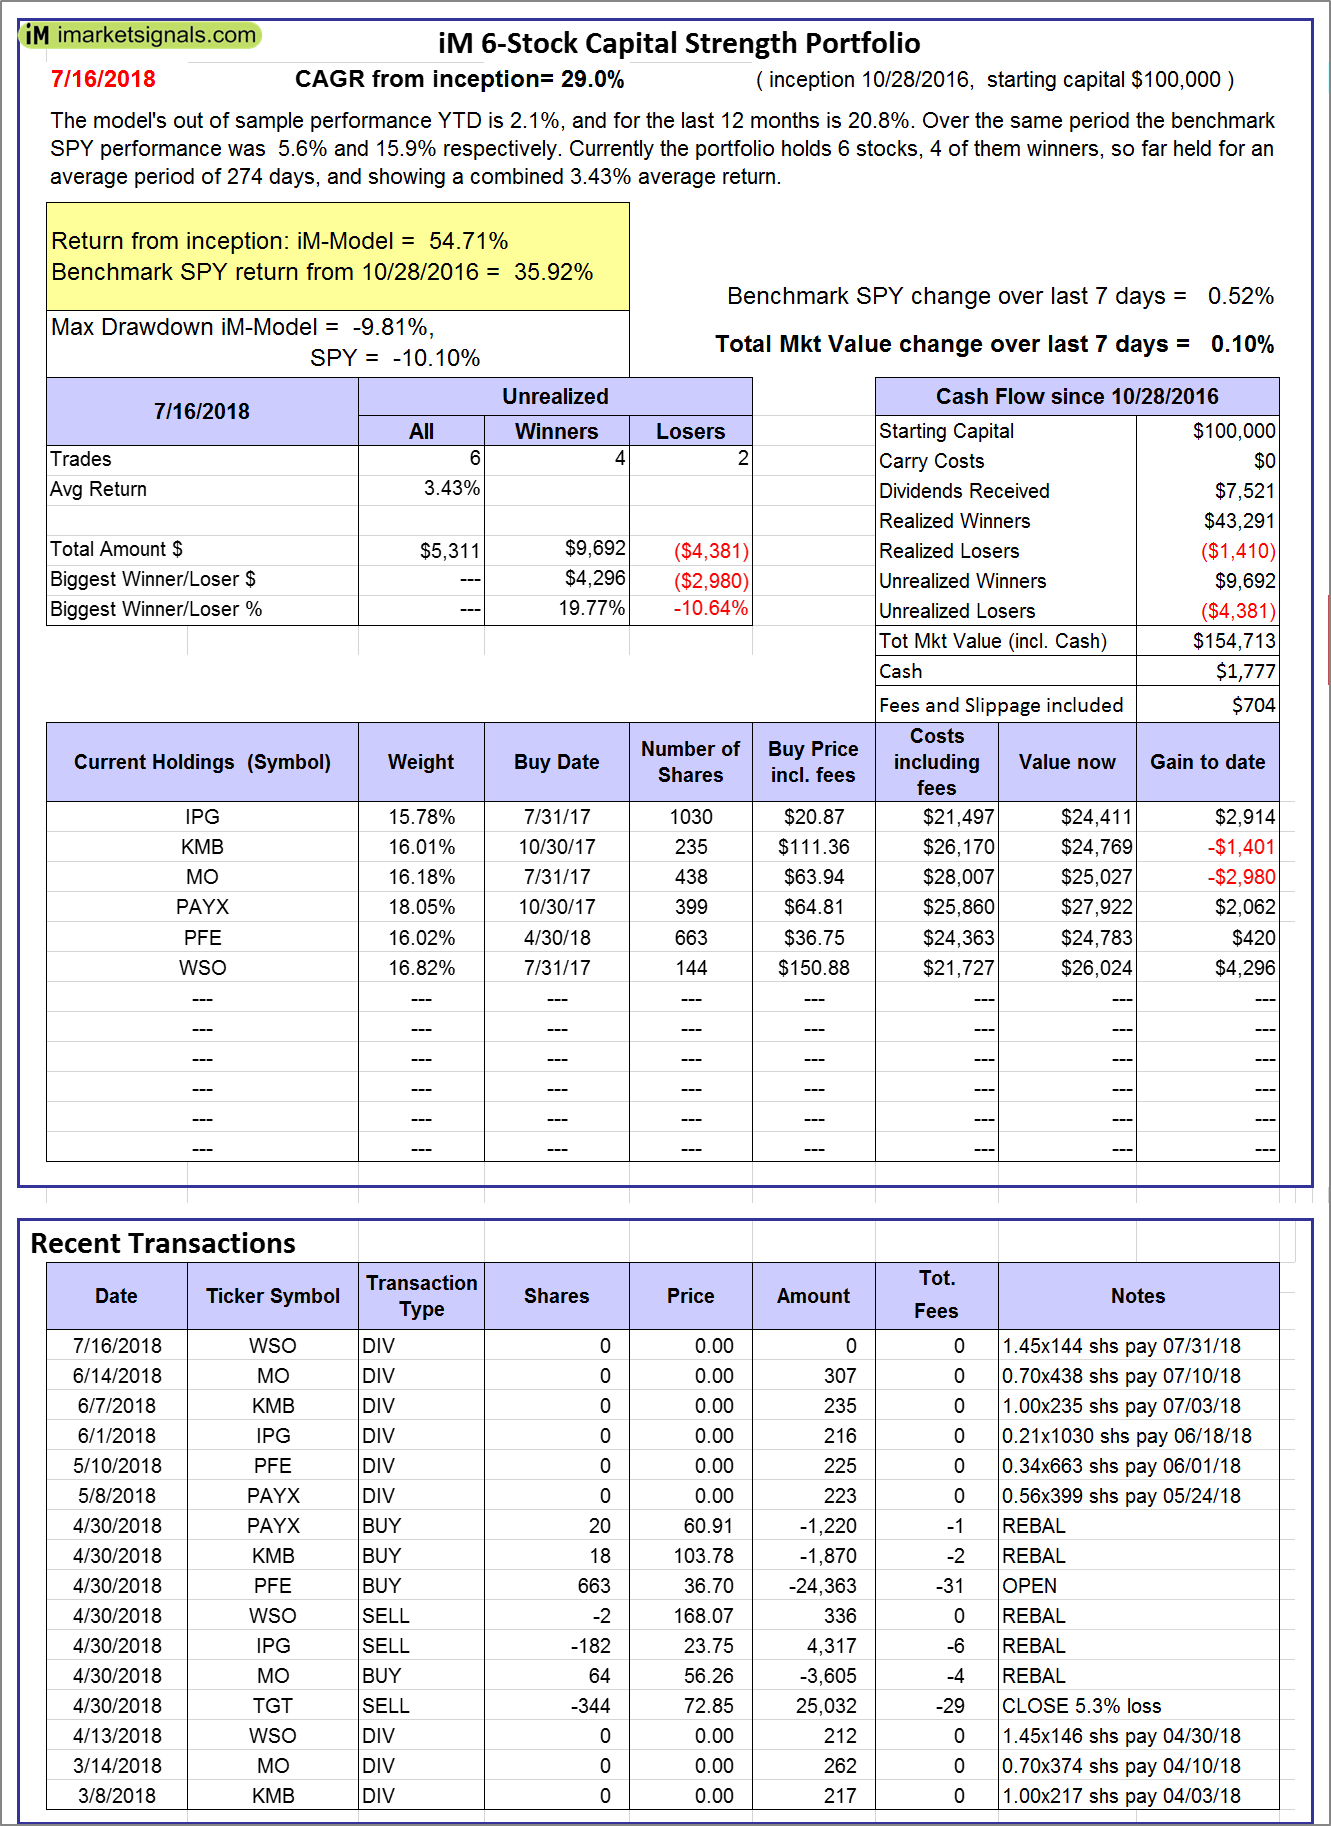 |
iM 6-Stock Capital Strength Portfolio: The model’s out of sample performance YTD is 2.1%, and for the last 12 months is 20.8%. Over the same period the benchmark SPY performance was 5.6% and 15.9% respectively. Over the previous week the market value of the iM 6-Stock Capital Strength Portfolio gained 0.10% at a time when SPY gained 0.52%. A starting capital of $100,000 at inception on 10/28/2016 would have grown to $154,713 which includes $1,777 cash and excludes $704 spent on fees and slippage. |
 |
iM-BestogaX5-System: The model’s out of sample performance YTD is 4.2%, and for the last 12 months is 5.5%. Over the same period the benchmark SPY performance was 5.6% and 15.9% respectively. Over the previous week the market value of iM-BestogaX5-System gained 0.08% at a time when SPY gained 0.52%. A starting capital of $100,000 at inception on 3/28/2016 would have grown to $116,754 which includes $639 cash and excludes $1,256 spent on fees and slippage. |
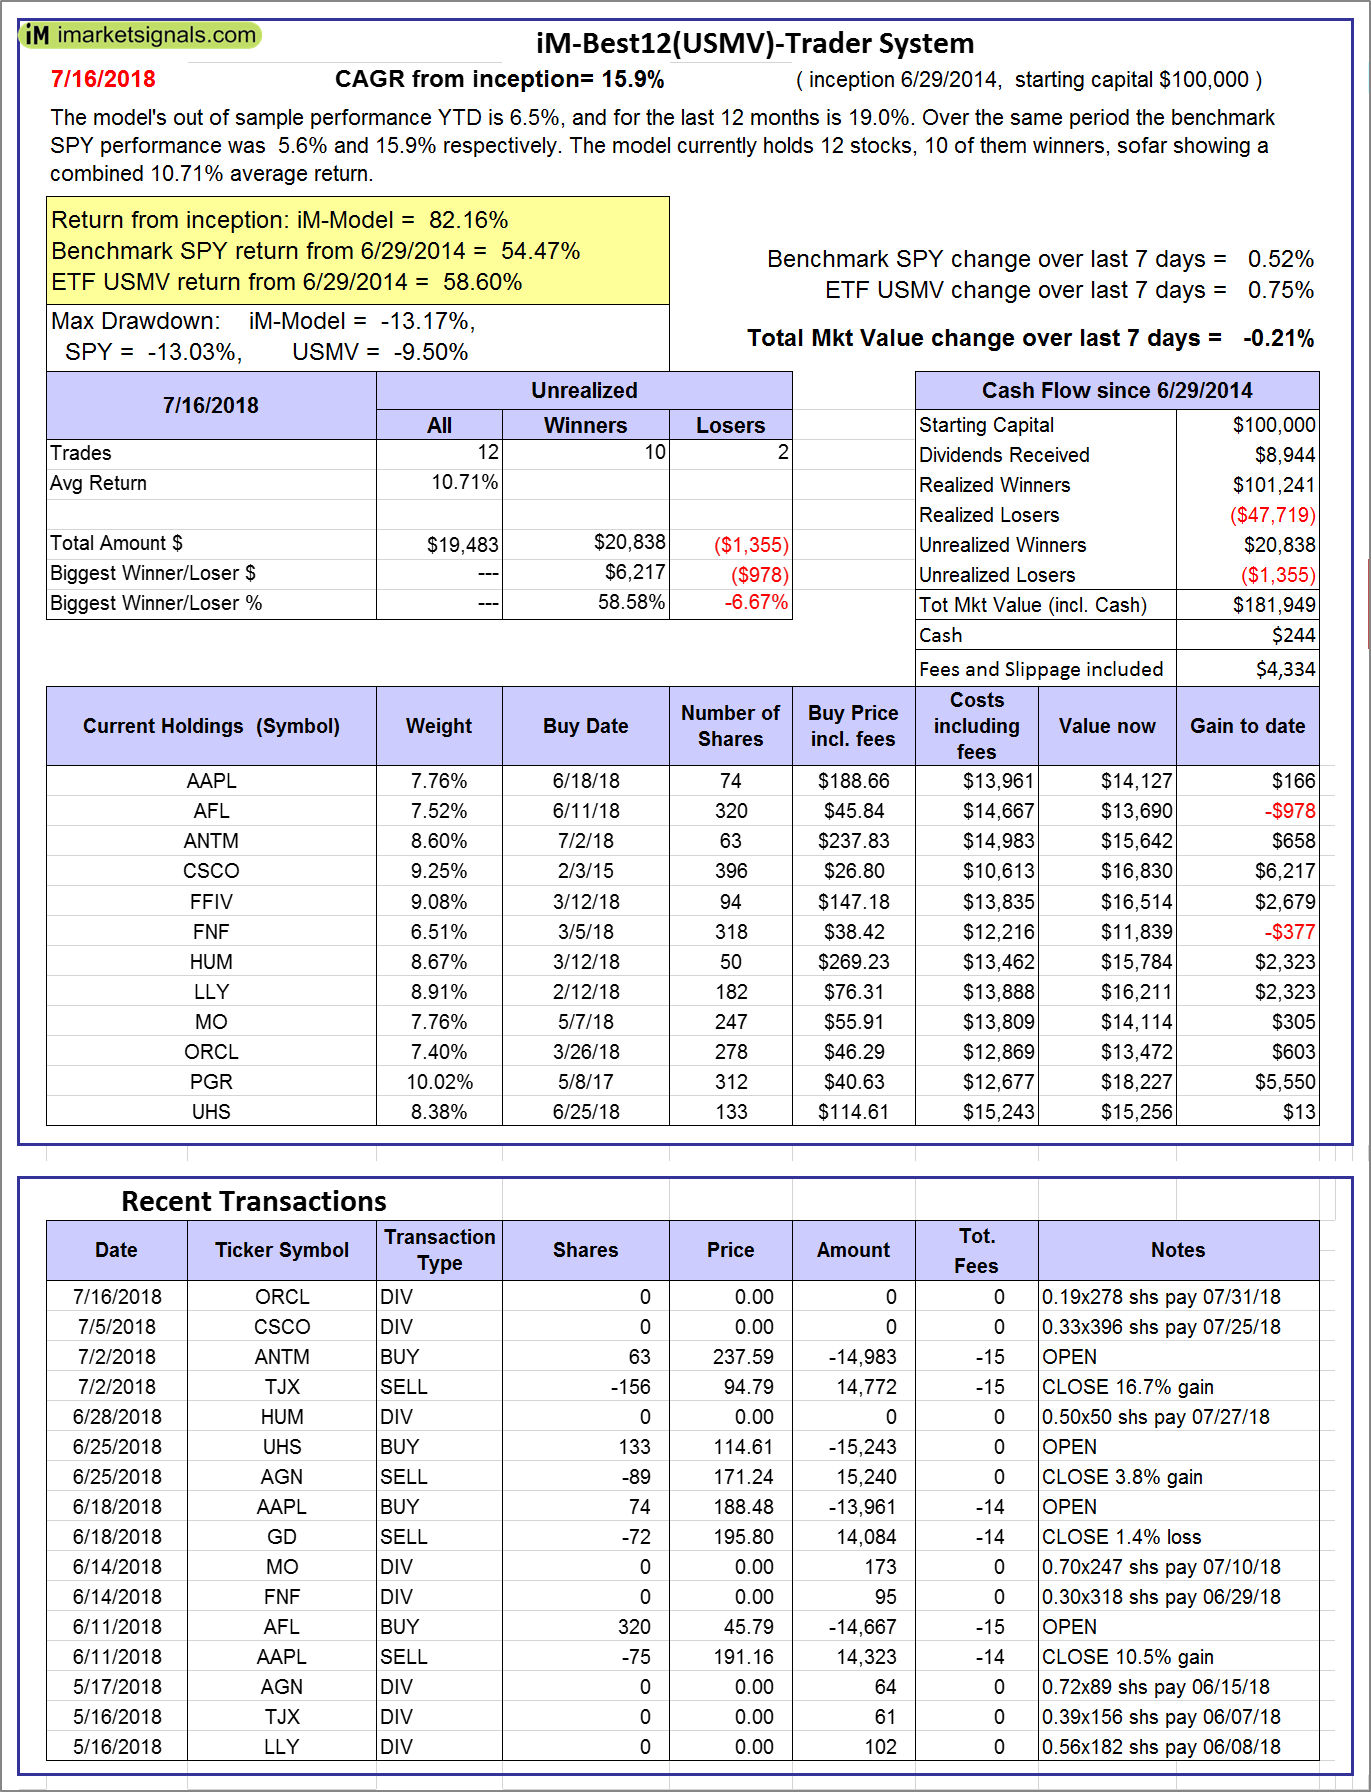 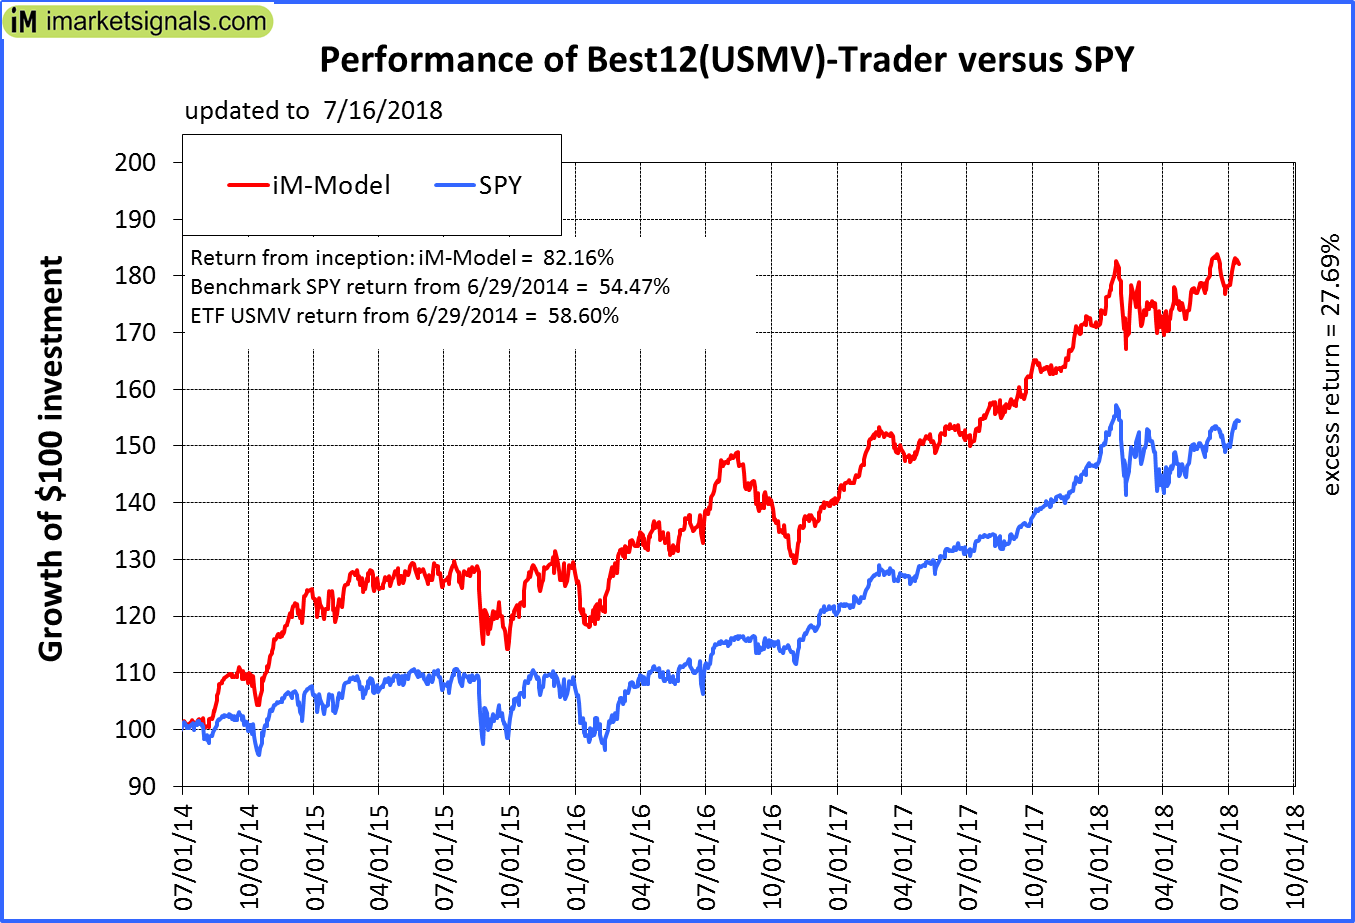 |
iM-Best12(USMV)-Trader: The model’s out of sample performance YTD is 6.5%, and for the last 12 months is 19.0%. Over the same period the benchmark SPY performance was 5.6% and 15.9% respectively. Since inception, on 6/30/2014, the model gained 82.16% while the benchmark SPY gained 54.47% and the ETF USMV gained 58.60% over the same period. Over the previous week the market value of iM-Best12(USMV)-Trader gained -0.21% at a time when SPY gained 0.52%. A starting capital of $100,000 at inception on 6/30/2014 would have grown to $181,949 which includes $244 cash and excludes $4,334 spent on fees and slippage. |
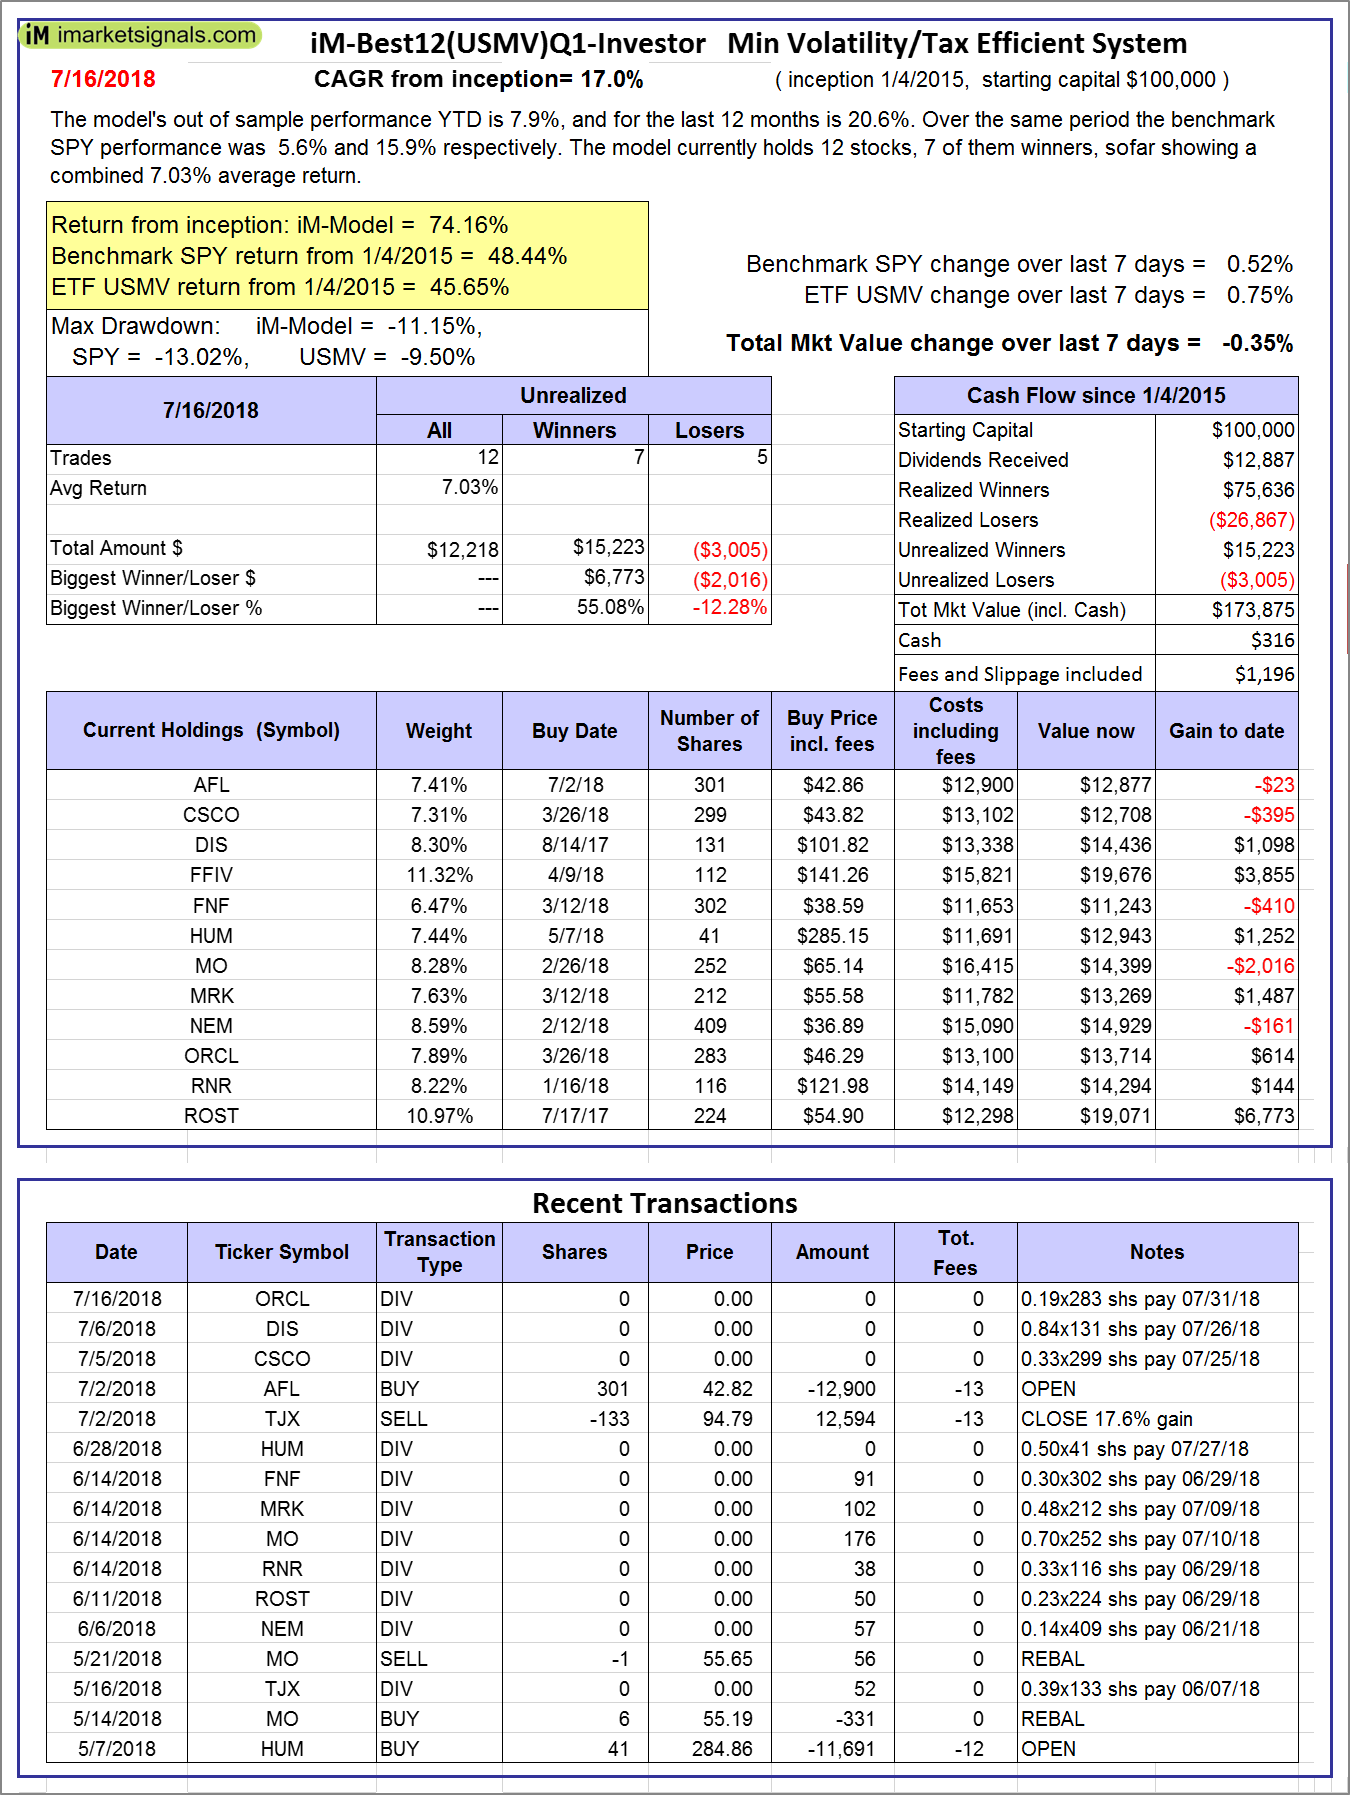 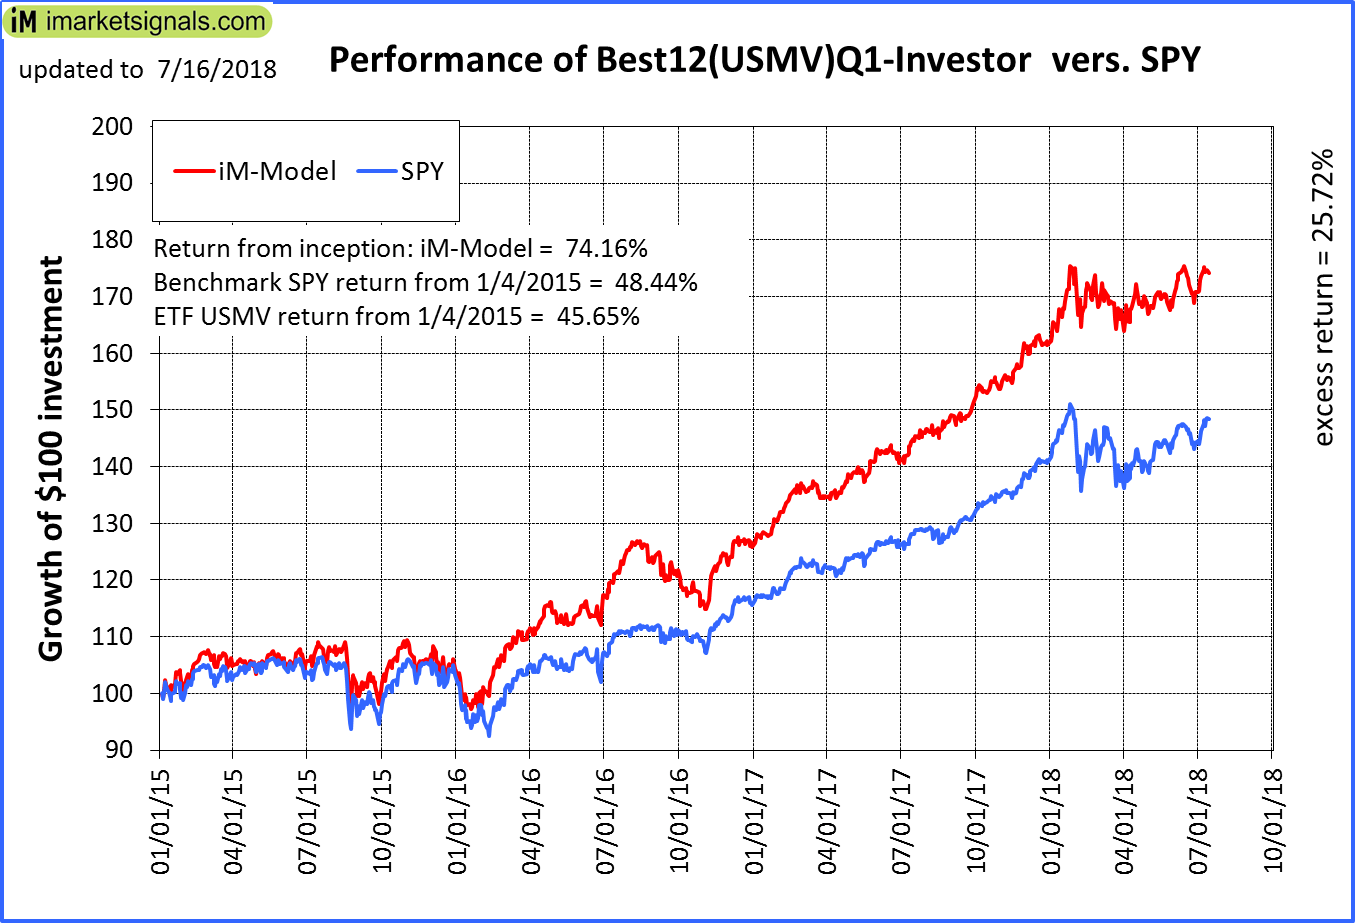 |
iM-Best12(USMV)Q1-Investor: The model’s out of sample performance YTD is 7.9%, and for the last 12 months is 20.6%. Over the same period the benchmark SPY performance was 5.6% and 15.9% respectively. Since inception, on 1/5/2015, the model gained 74.16% while the benchmark SPY gained 48.44% and the ETF USMV gained 45.65% over the same period. Over the previous week the market value of iM-Best12(USMV)Q1 gained -0.35% at a time when SPY gained 0.52%. A starting capital of $100,000 at inception on 1/5/2015 would have grown to $173,875 which includes $316 cash and excludes $1,196 spent on fees and slippage. |
  |
iM-Best12(USMV)Q2-Investor: The model’s out of sample performance YTD is 8.3%, and for the last 12 months is 16.1%. Over the same period the benchmark SPY performance was 5.6% and 15.9% respectively. Since inception, on 3/30/2015, the model gained 46.82% while the benchmark SPY gained 43.13% and the ETF USMV gained 40.68% over the same period. Over the previous week the market value of iM-Best12(USMV)Q2 gained 0.93% at a time when SPY gained 0.52%. A starting capital of $100,000 at inception on 3/30/2015 would have grown to $146,629 which includes $241 cash and excludes $1,014 spent on fees and slippage. |
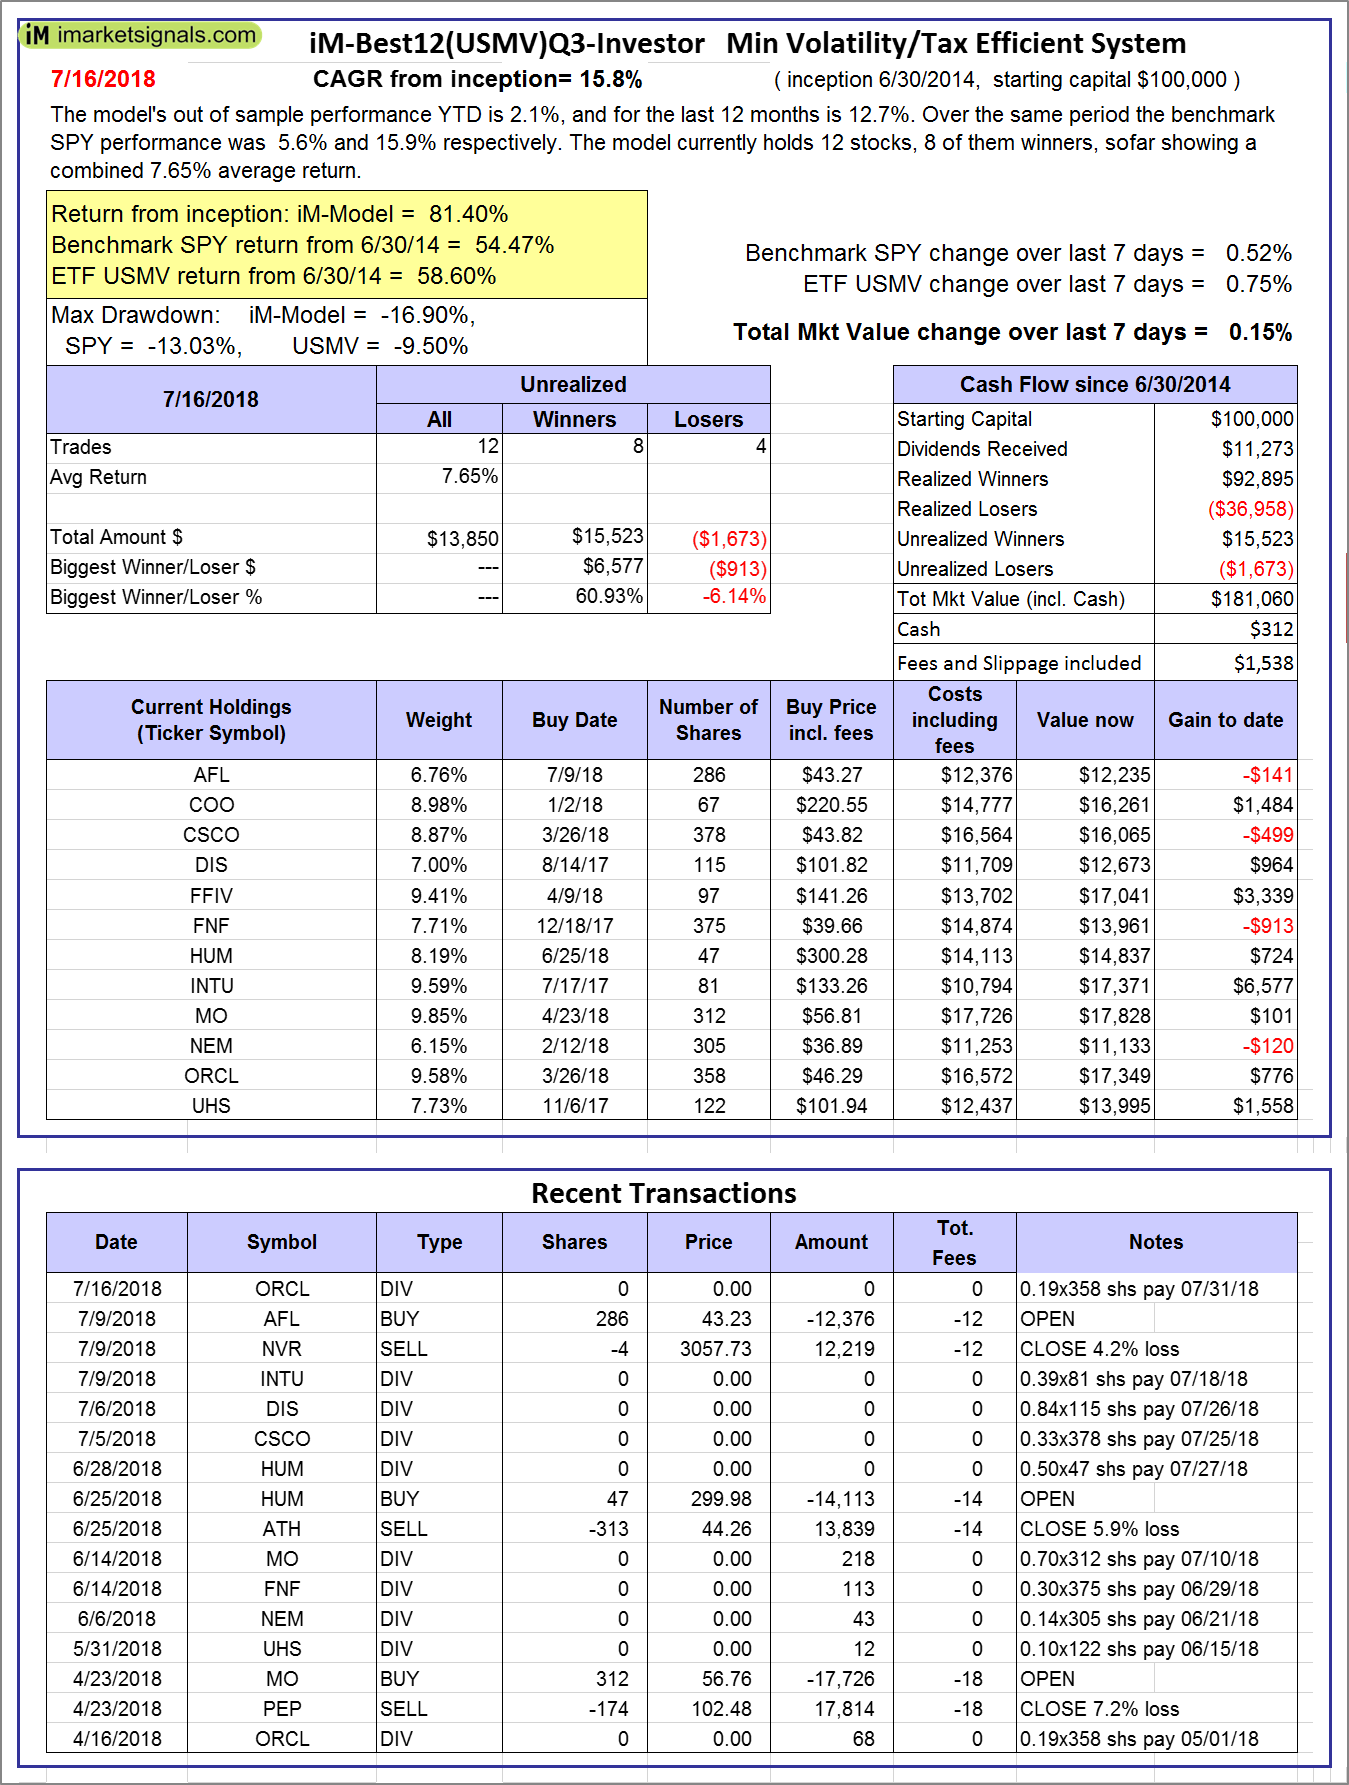 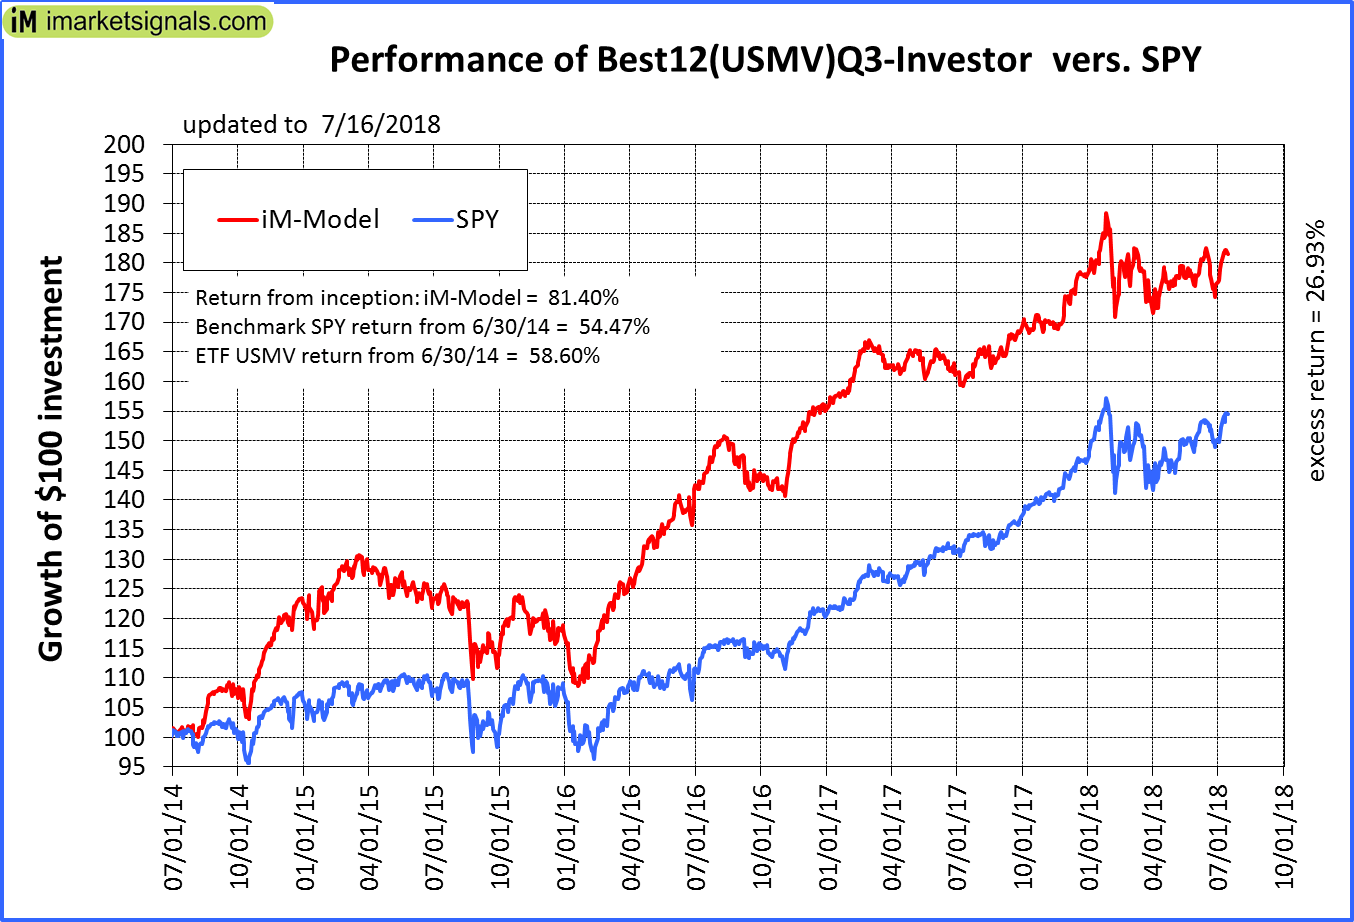 |
iM-Best12(USMV)Q3-Investor: The model’s out of sample performance YTD is 2.1%, and for the last 12 months is 12.7%. Over the same period the benchmark SPY performance was 5.6% and 15.9% respectively. Since inception, on 7/1/2014, the model gained 81.40% while the benchmark SPY gained 54.47% and the ETF USMV gained 58.60% over the same period. Over the previous week the market value of iM-Best12(USMV)Q3 gained 0.15% at a time when SPY gained 0.52%. A starting capital of $100,000 at inception on 7/1/2014 would have grown to $181,060 which includes $312 cash and excludes $1,538 spent on fees and slippage. |
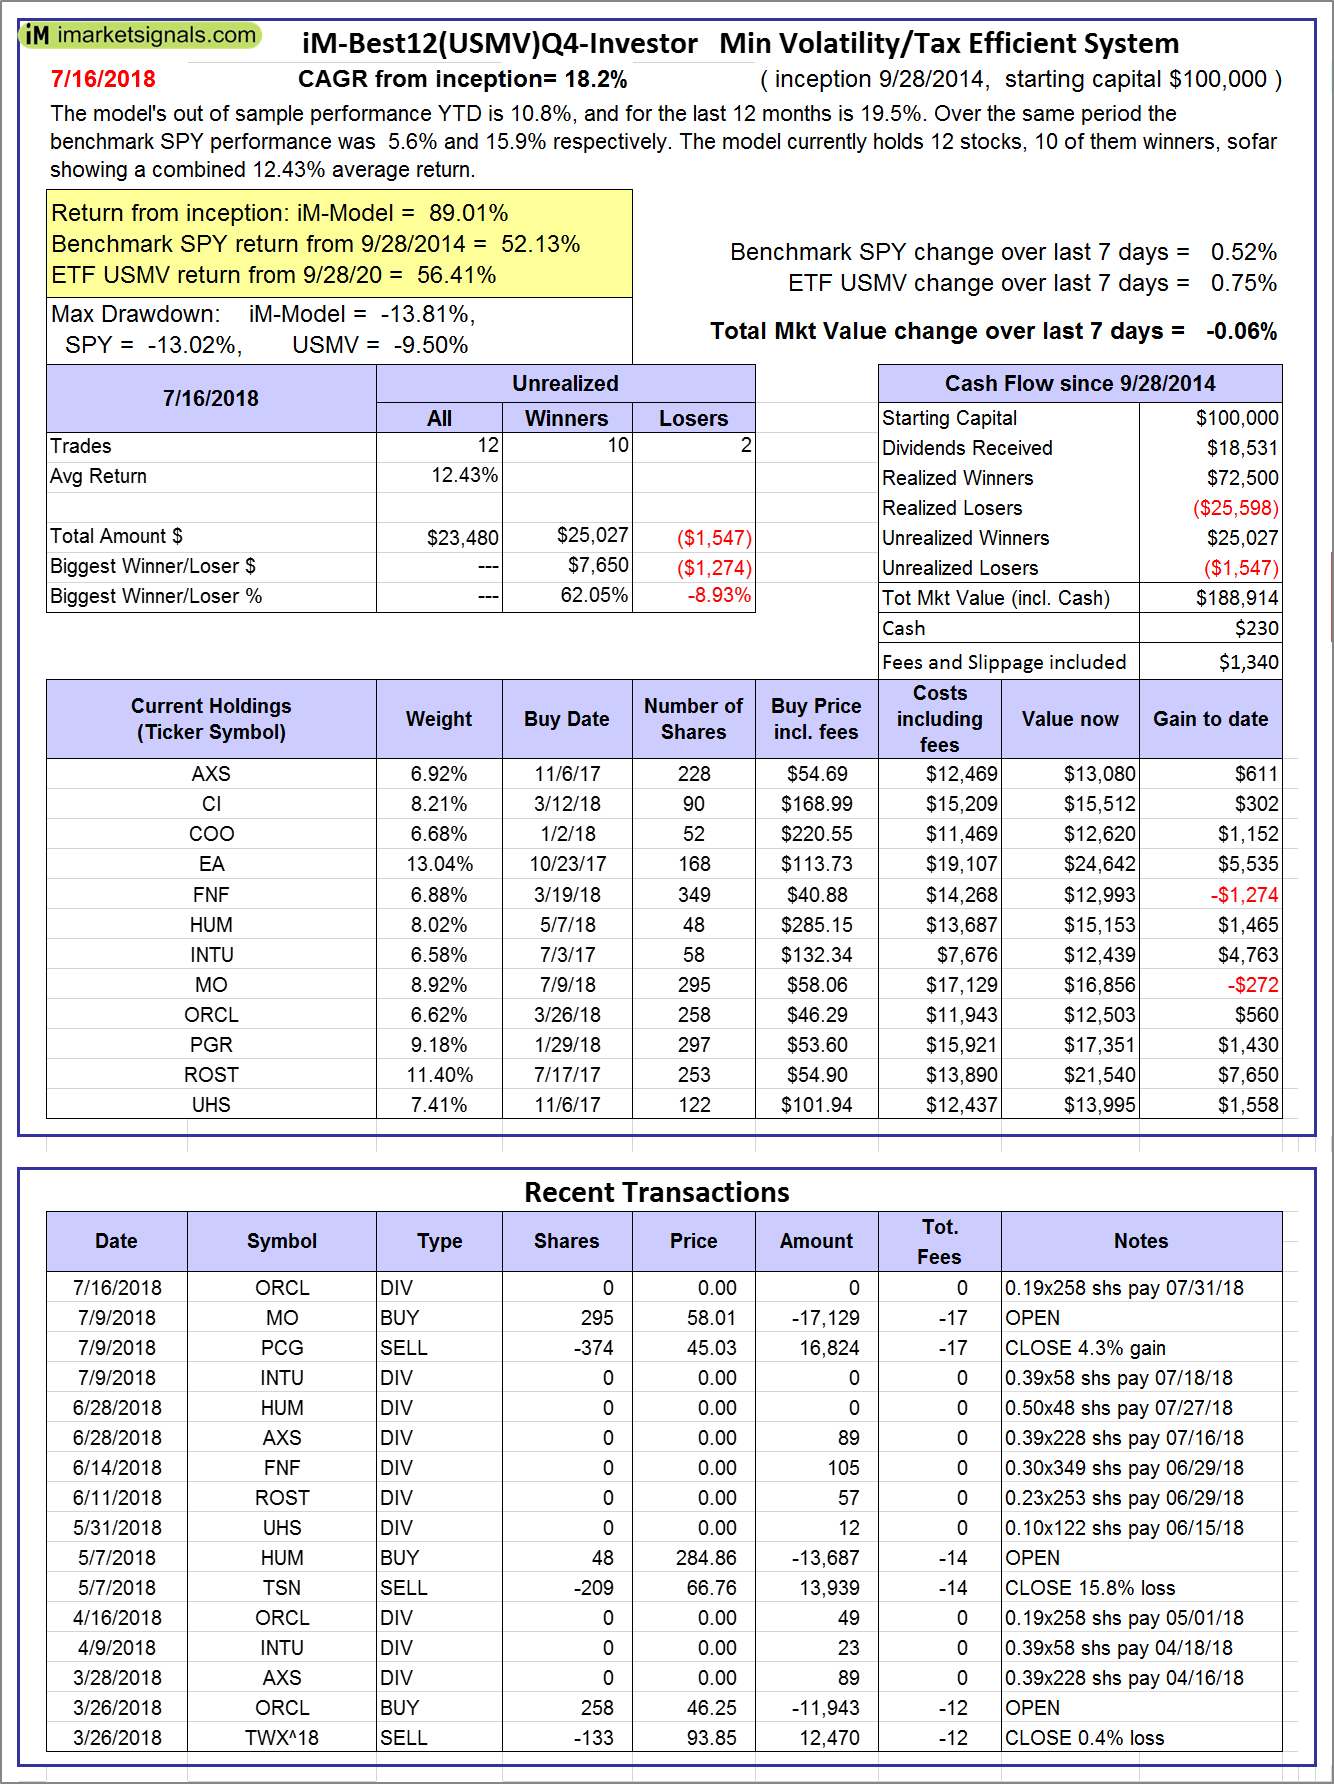 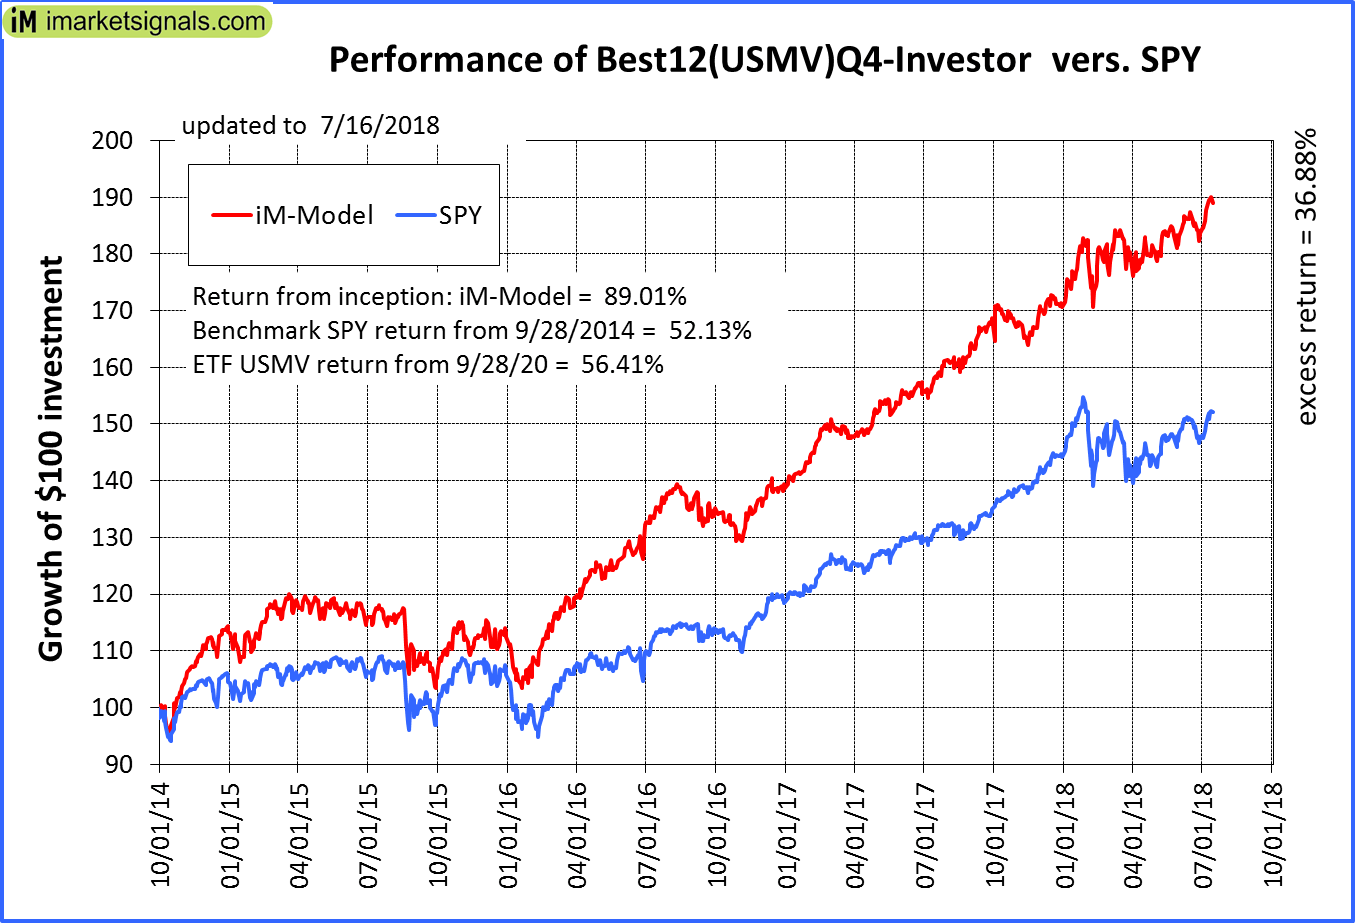 |
iM-Best12(USMV)Q4-Investor: Since inception, on 9/29/2014, the model gained 89.01% while the benchmark SPY gained 52.13% and the ETF USMV gained 56.41% over the same period. Over the previous week the market value of iM-Best12(USMV)Q4 gained -0.06% at a time when SPY gained 0.52%. A starting capital of $100,000 at inception on 9/29/2014 would have grown to $188,914 which includes $230 cash and excludes $1,340 spent on fees and slippage. |
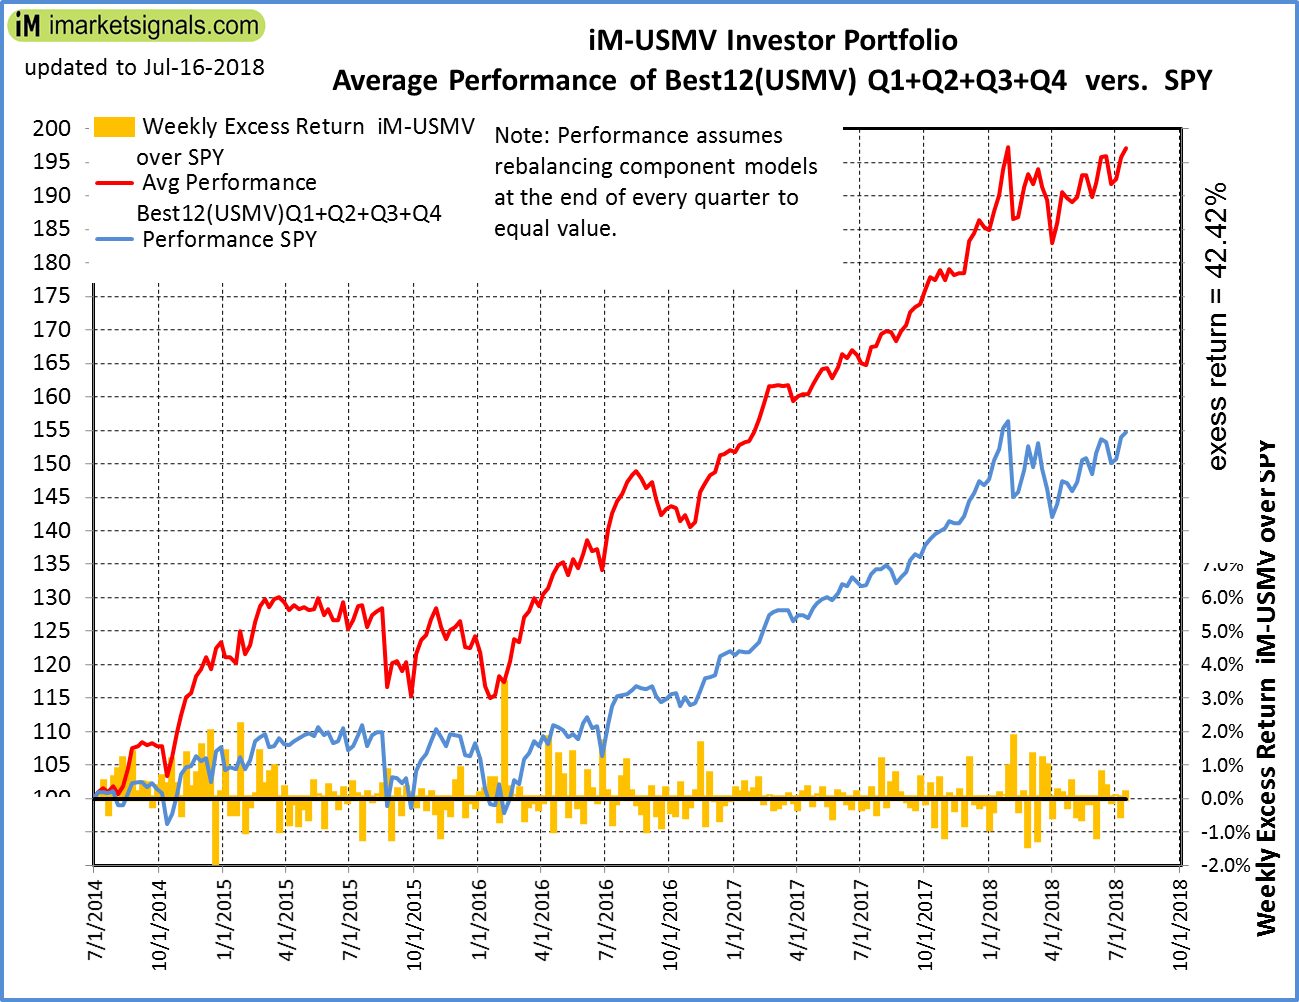 |
Average Performance of iM-Best12(USMV)Q1+Q2+Q3+Q4-Investor resulted in an excess return of 42.42% over SPY. (see iM-USMV Investor Portfolio) |
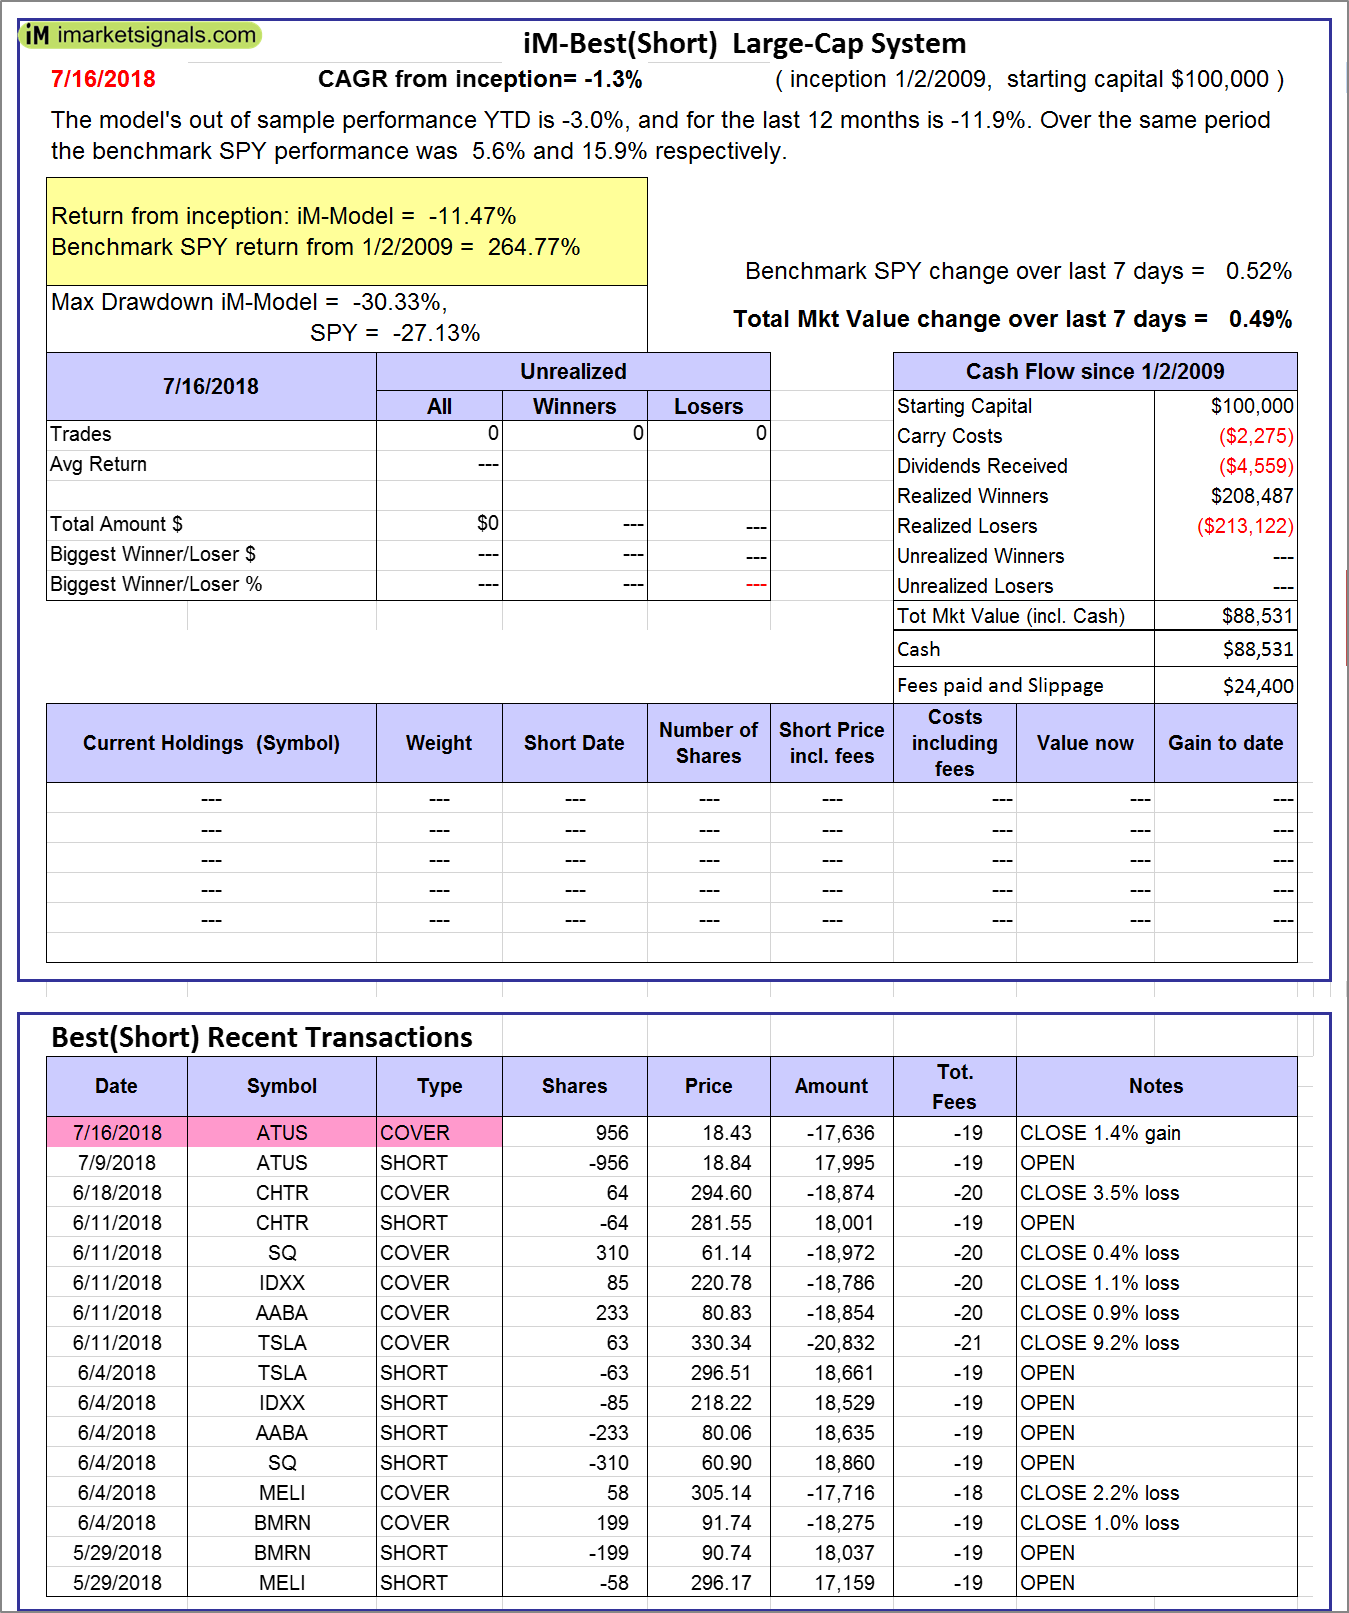 |
iM-Best(Short): The model’s out of sample performance YTD is -3.0%, and for the last 12 months is -11.9%. Over the same period the benchmark SPY performance was 5.6% and 15.9% respectively. Over the previous week the market value of iM-Best(Short) gained 0.49% at a time when SPY gained 0.52%. Over the period 1/2/2009 to 7/16/2018 the starting capital of $100,000 would have grown to $88,531 which includes $88,531 cash and excludes $24,400 spent on fees and slippage. |
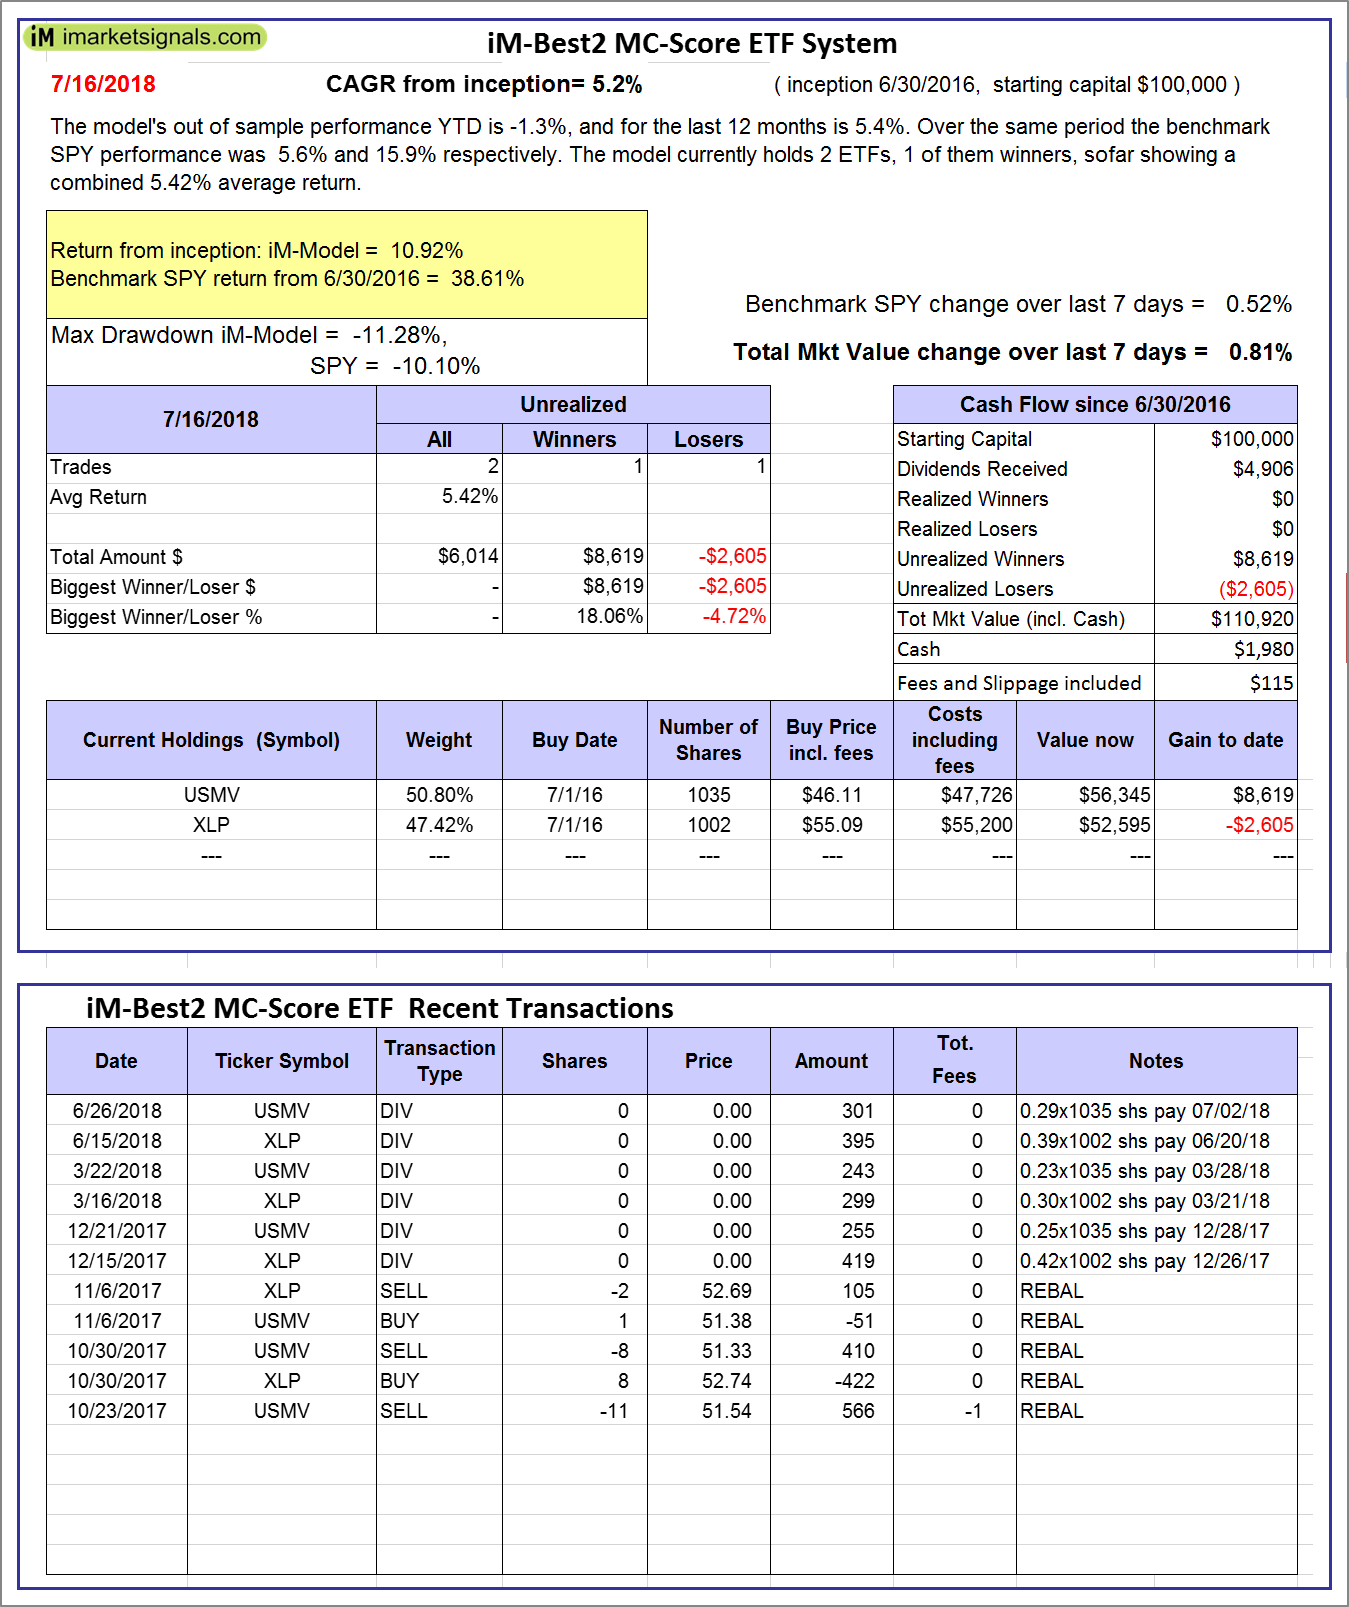 |
iM-Best2 MC-Score ETF System: The model’s out of sample performance YTD is -1.3%, and for the last 12 months is 5.4%. Over the same period the benchmark SPY performance was 5.6% and 15.9% respectively. Over the previous week the market value of the iM-Best2 MC-Score ETF System gained 0.81% at a time when SPY gained 0.52%. A starting capital of $100,000 at inception on 6/30/2016 would have grown to $110,920 which includes $1,980 cash and excludes $115 spent on fees and slippage. |
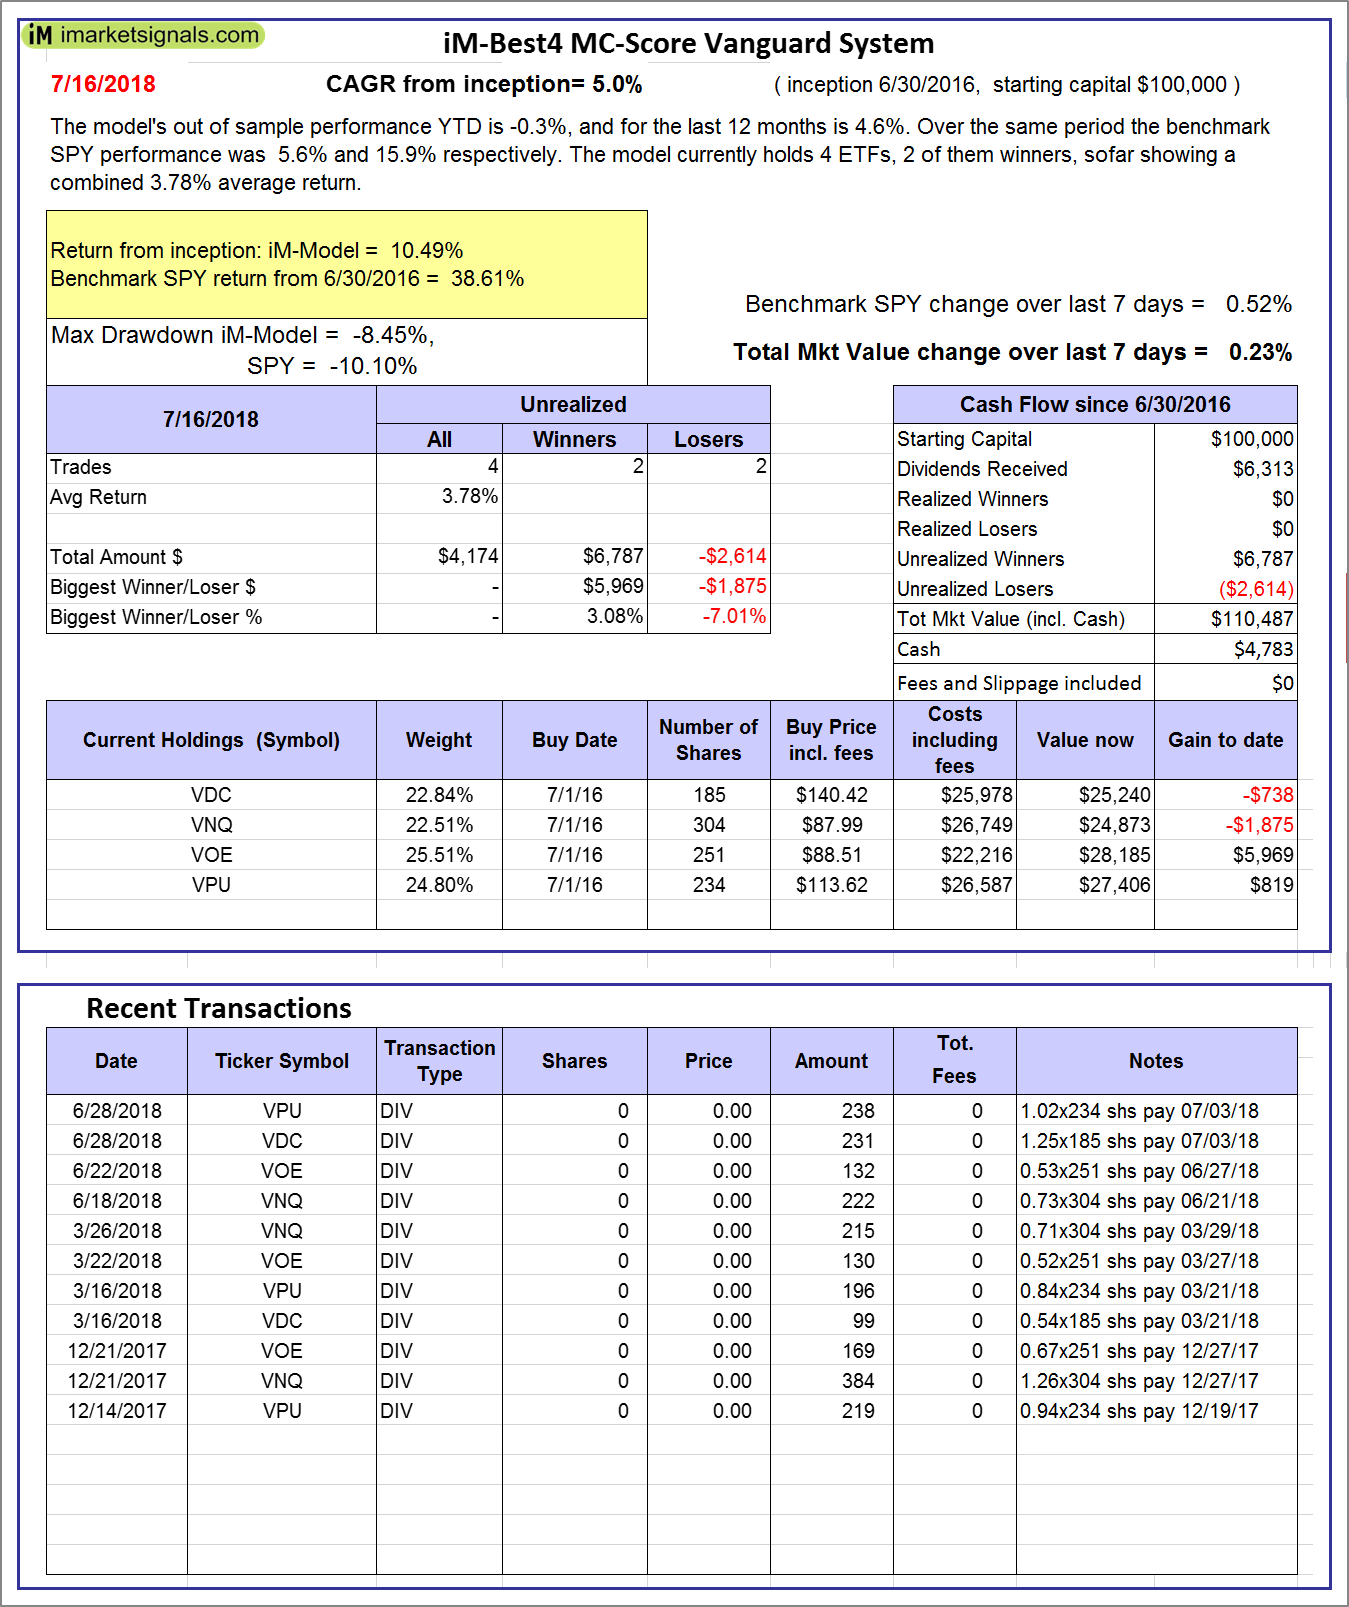 |
iM-Best4 MC-Score Vanguard System: The model’s out of sample performance YTD is -0.3%, and for the last 12 months is 4.6%. Over the same period the benchmark SPY performance was 5.6% and 15.9% respectively. Over the previous week the market value of the iM-Best4 MC-Score Vanguard System gained 0.23% at a time when SPY gained 0.52%. A starting capital of $100,000 at inception on 6/30/2016 would have grown to $110,487 which includes $4,783 cash and excludes $00 spent on fees and slippage. |
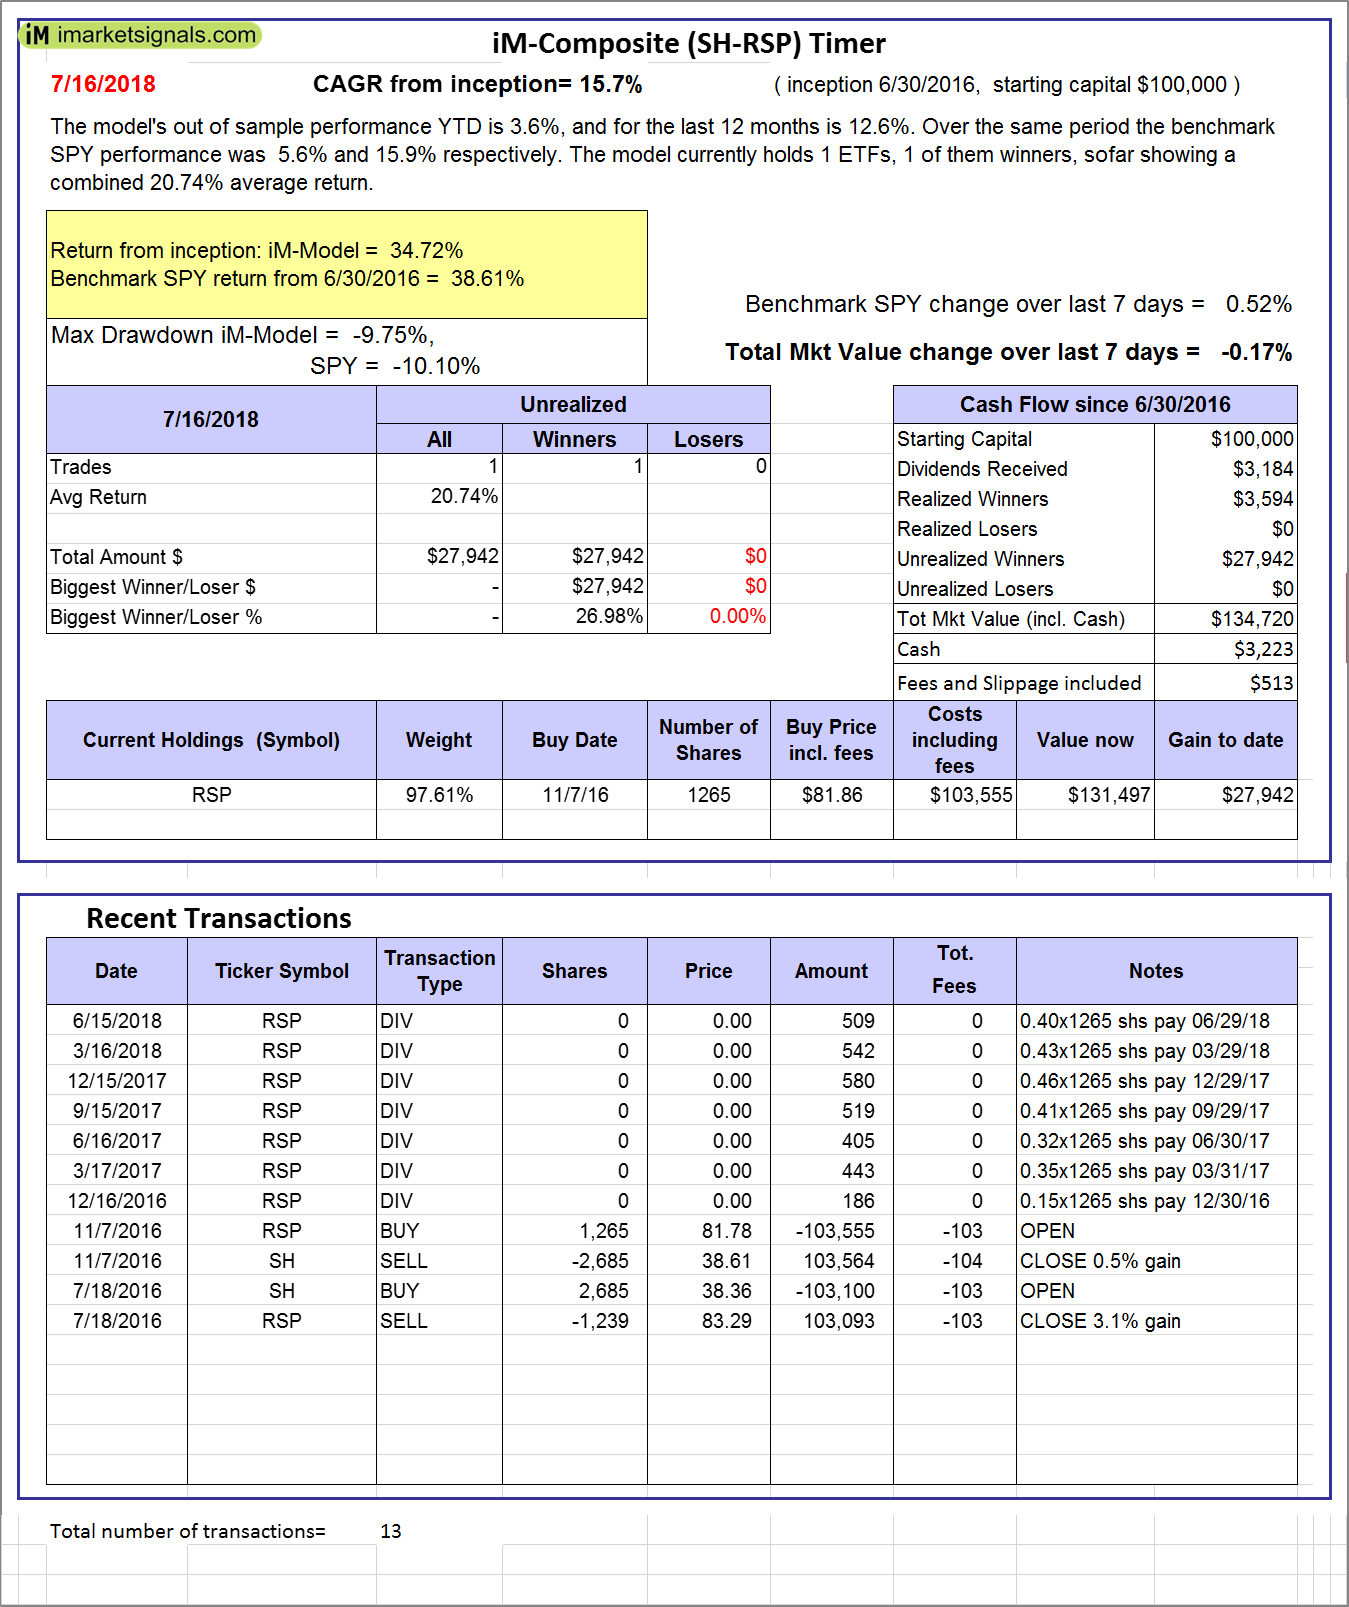 |
iM-Composite (SH-RSP) Timer: The model’s out of sample performance YTD is 3.6%, and for the last 12 months is 12.6%. Over the same period the benchmark SPY performance was 5.6% and 15.9% respectively. Over the previous week the market value of the iM-Composite (SH-RSP) Timer gained -0.17% at a time when SPY gained 0.52%. A starting capital of $100,000 at inception on 6/30/2016 would have grown to $134,720 which includes $3,223 cash and excludes $513 spent on fees and slippage. |
 |
iM-Composite (SPY-IEF) Timer: The model’s out of sample performance YTD is 5.5%, and for the last 12 months is 16.3%. Over the same period the benchmark SPY performance was 5.6% and 15.9% respectively. Over the previous week the market value of the iM-Composite (SPY-IEF) Timer gained 0.51% at a time when SPY gained 0.52%. A starting capital of $100,000 at inception on 6/30/2016 would have grown to $140,036 which includes $2,042 cash and excludes $1,390 spent on fees and slippage. |
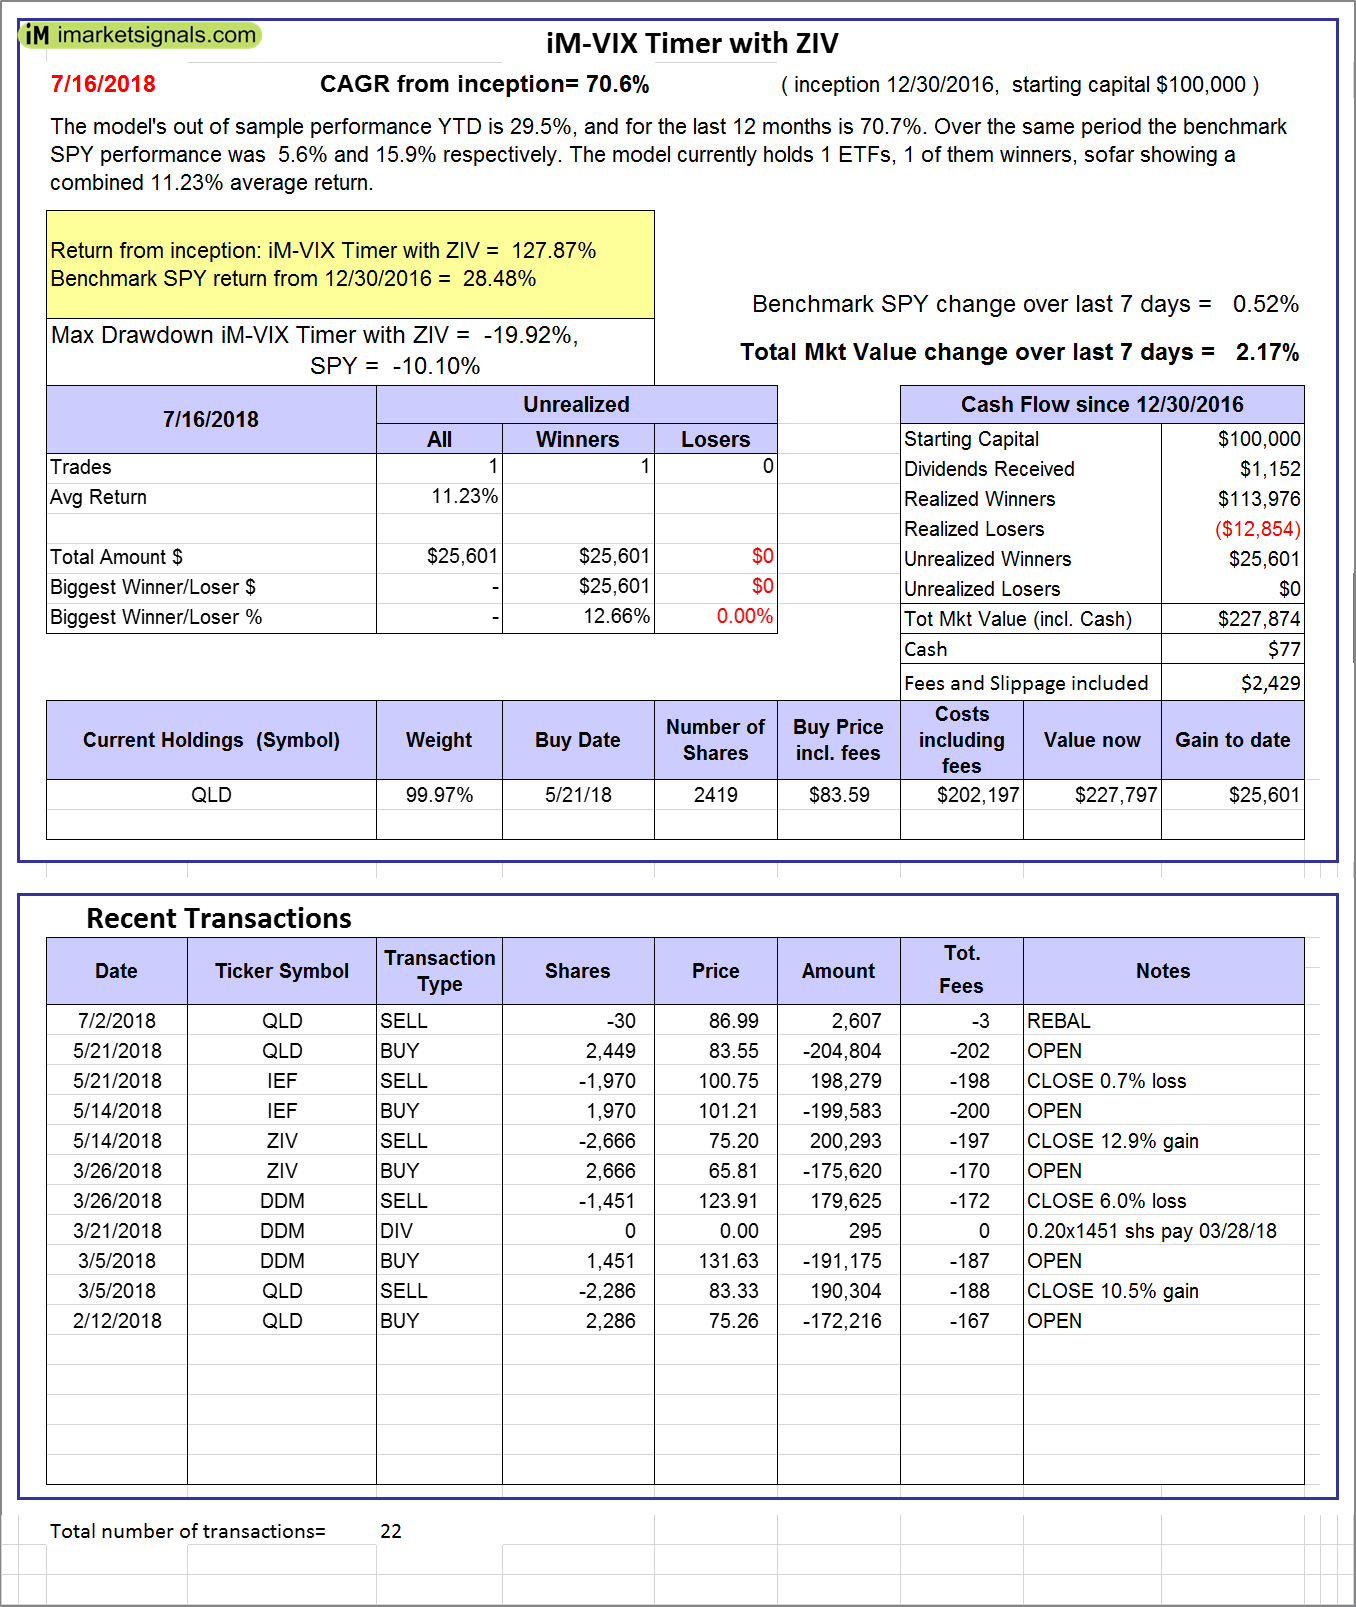 |
iM-VIX Timer with ZIV: The model’s out of sample performance YTD is 29.5%, and for the last 12 months is 70.7%. Over the same period the benchmark SPY performance was 5.6% and 15.9% respectively. Over the previous week the market value of the iM-VIX Timer with ZIV gained 2.17% at a time when SPY gained 0.52%. A starting capital of $100,000 at inception on 6/30/2016 would have grown to $227,874 which includes $77 cash and excludes $2,429 spent on fees and slippage. |
 |
iM-Composite(Gold-Stocks-Bond) Timer: The model’s out of sample performance YTD is -4.9%, and for the last 12 months is 0.8%. Over the same period the benchmark SPY performance was 5.6% and 15.9% respectively. Over the previous week the market value of the iM-Composite(Gold-Stocks-Bond) Timer gained -1.29% at a time when SPY gained 0.52%. A starting capital of $100,000 at inception on 6/30/2016 would have grown to $122,456 which includes $65 cash and excludes $1,955 spent on fees and slippage. |
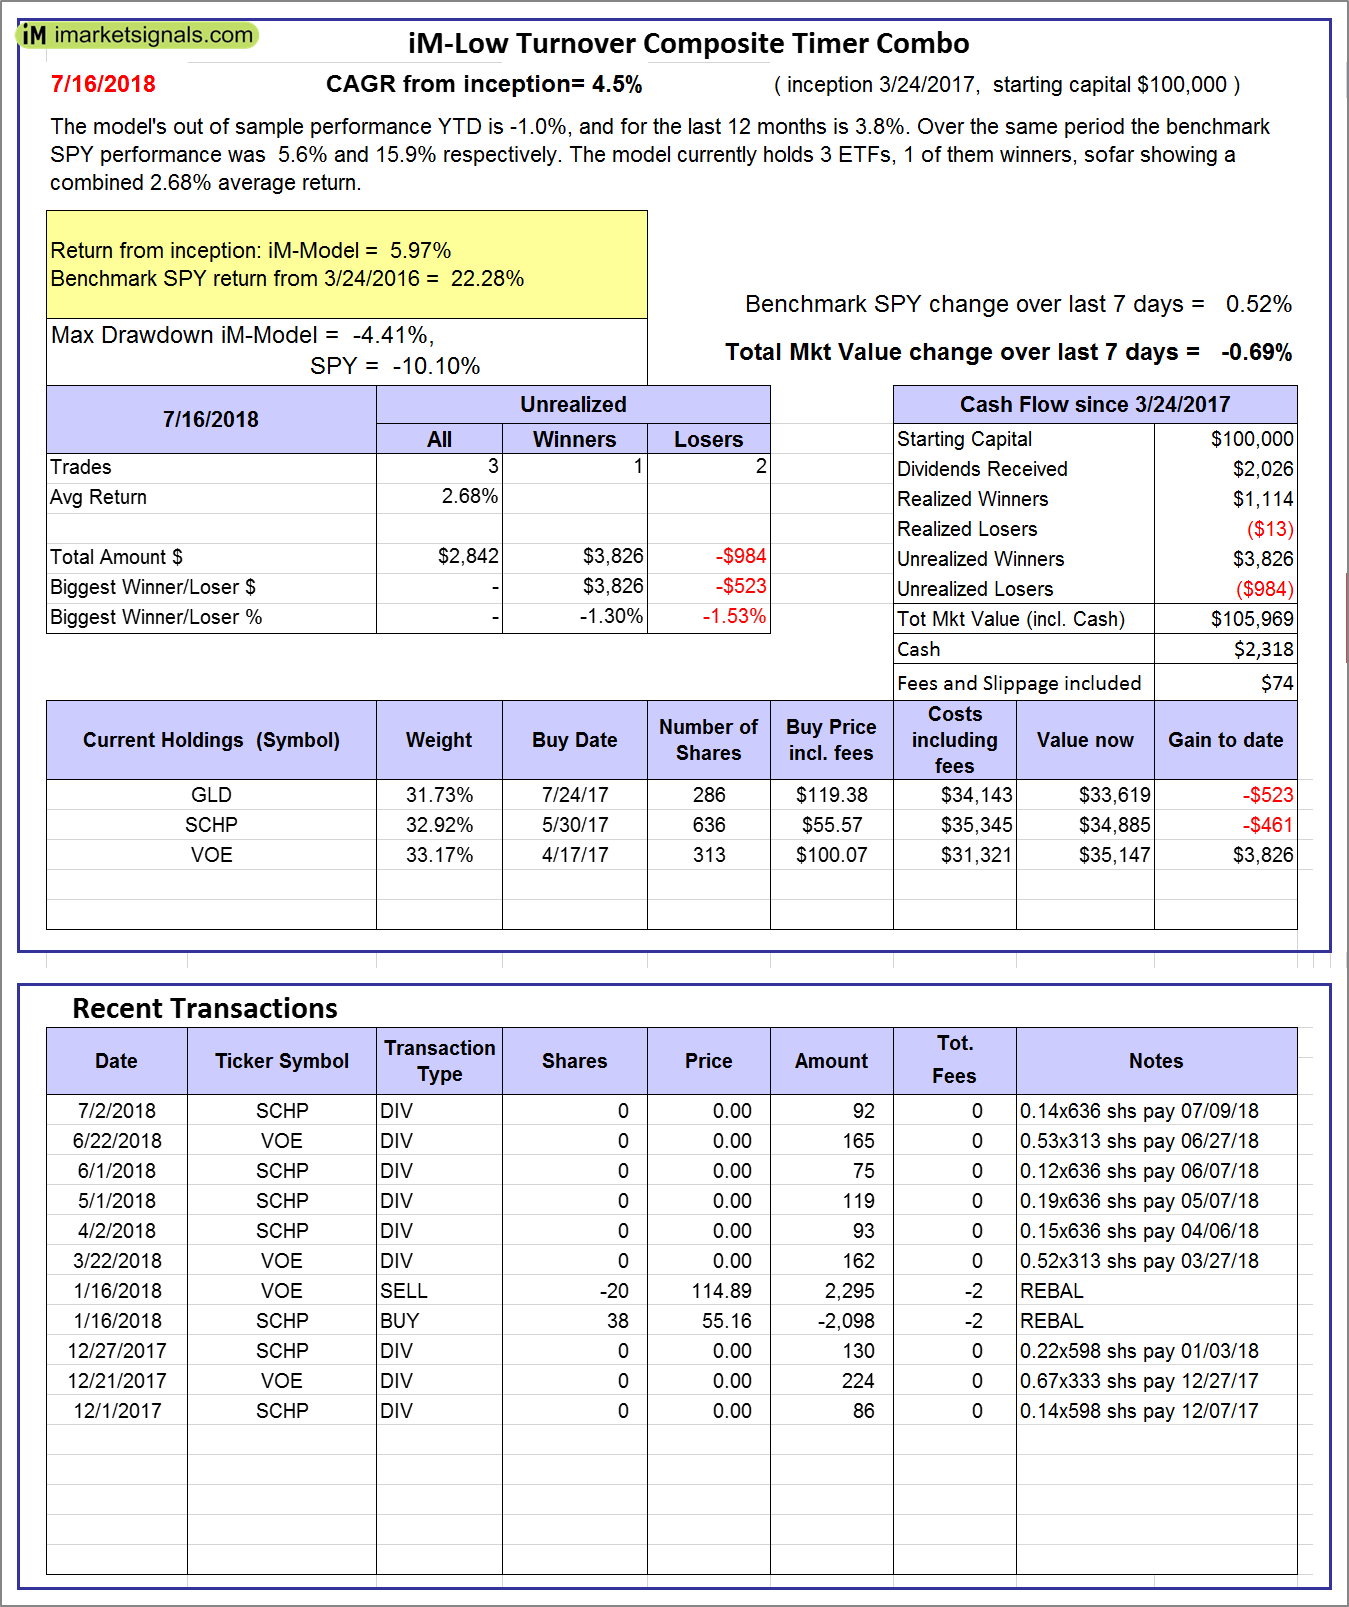 |
iM-Low Turnover Composite Timer Combo: The model’s out of sample performance YTD is -1.0%, and for the last 12 months is 3.8%. Over the same period the benchmark SPY performance was 5.6% and 15.9% respectively. Over the previous week the market value of the iM-Low Turnover Composite Timer Combo gained -0.69% at a time when SPY gained 0.52%. A starting capital of $100,000 at inception on 3/24/27 would have grown to $105,969 which includes $2,318 cash and excludes $74 spent on fees and slippage. |
 |
iM-Min Drawdown Combo: The model’s out of sample performance YTD is 0.5%, and for the last 12 months is 7.4%. Over the same period the benchmark SPY performance was 5.6% and 15.9% respectively. Over the previous week the market value of the iM-Min Drawdown Combo gained -0.20% at a time when SPY gained 0.52%. A starting capital of $100,000 at inception on 4/5/2017 would have grown to $108,291 which includes $3,128 cash and excludes $317 spent on fees and slippage. |
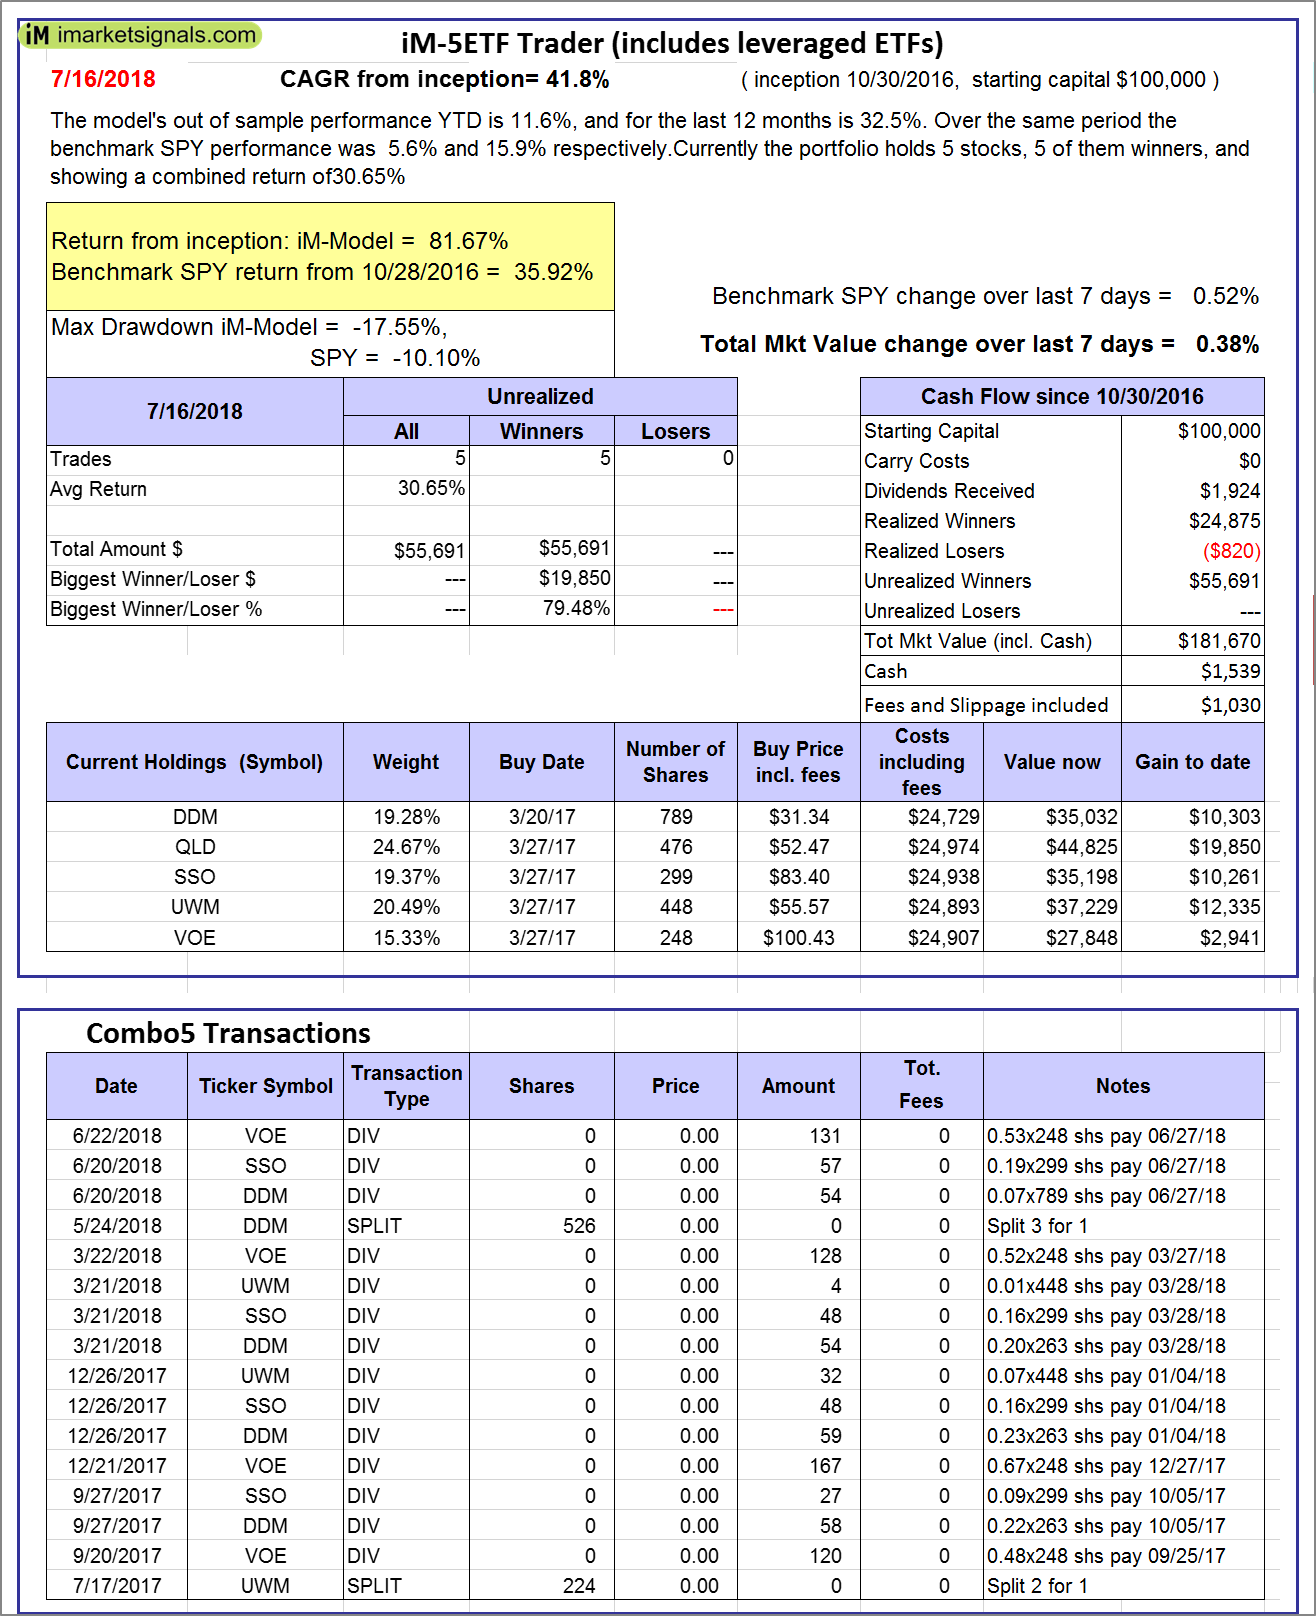 |
iM-5ETF Trader (includes leveraged ETFs): The model’s out of sample performance YTD is 11.6%, and for the last 12 months is 32.5%. Over the same period the benchmark SPY performance was 5.6% and 15.9% respectively. Over the previous week the market value of the iM-5ETF Trader (includes leveraged ETFs) gained 0.38% at a time when SPY gained 0.52%. A starting capital of $100,000 at inception on 10/30/2016 would have grown to $181,670 which includes $1,539 cash and excludes $1,030 spent on fees and slippage. |
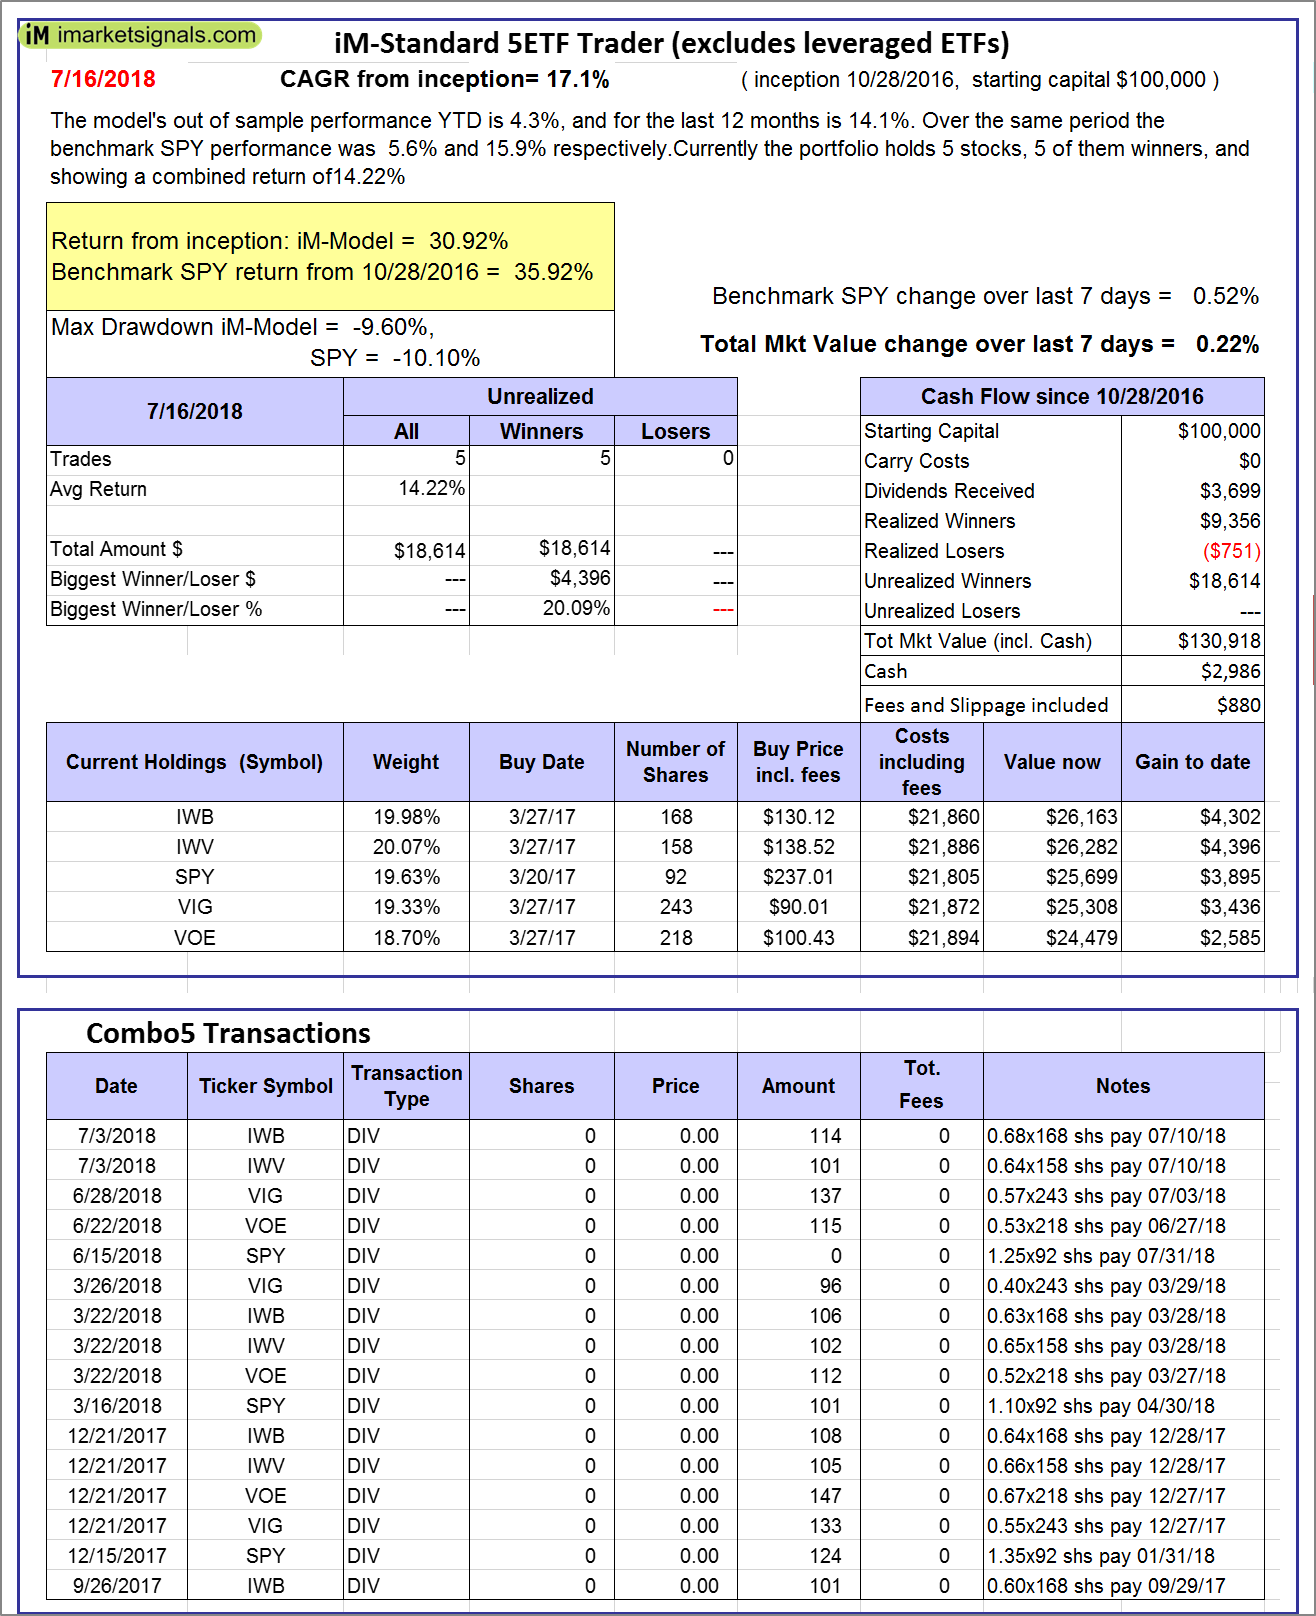 |
iM-Standard 5ETF Trader (excludes leveraged ETFs): The model’s out of sample performance YTD is 4.3%, and for the last 12 months is 14.1%. Over the same period the benchmark SPY performance was 5.6% and 15.9% respectively. Over the previous week the market value of the iM-Standard 5ETF Trader (excludes leveraged ETFs) gained 0.22% at a time when SPY gained 0.52%. A starting capital of $100,000 at inception on 10/30/2016 would have grown to $130,918 which includes $2,986 cash and excludes $880 spent on fees and slippage. |
iM-Best Reports – 7/16/2018
Posted in pmp SPY-SH
Leave a Reply
You must be logged in to post a comment.