
  |
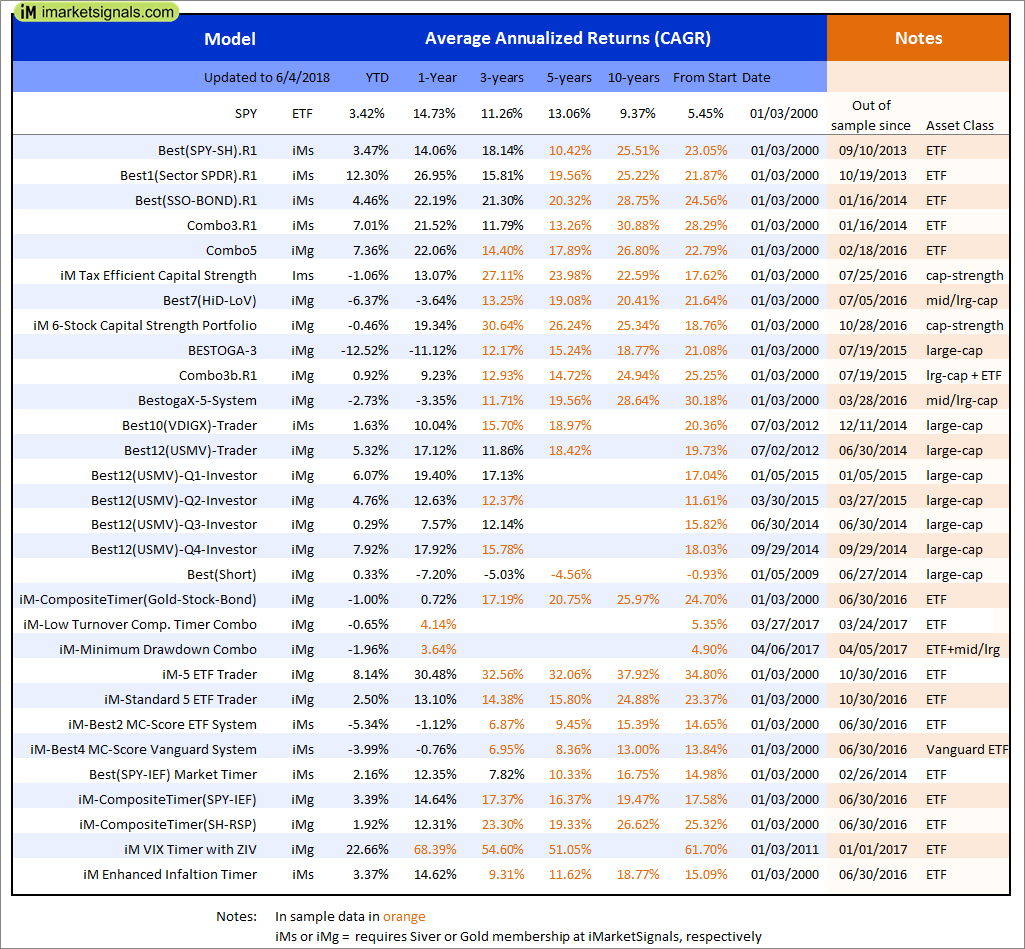
Out of sample performance summary of our models for the past 1, 2, 4 and 13 week periods. The active active return indicates how the models over- or underperformed the benchmark ETF SPY. Also the YTD, and the 1-, 3-, 5- and 10-year annualized returns are shown in the second table |
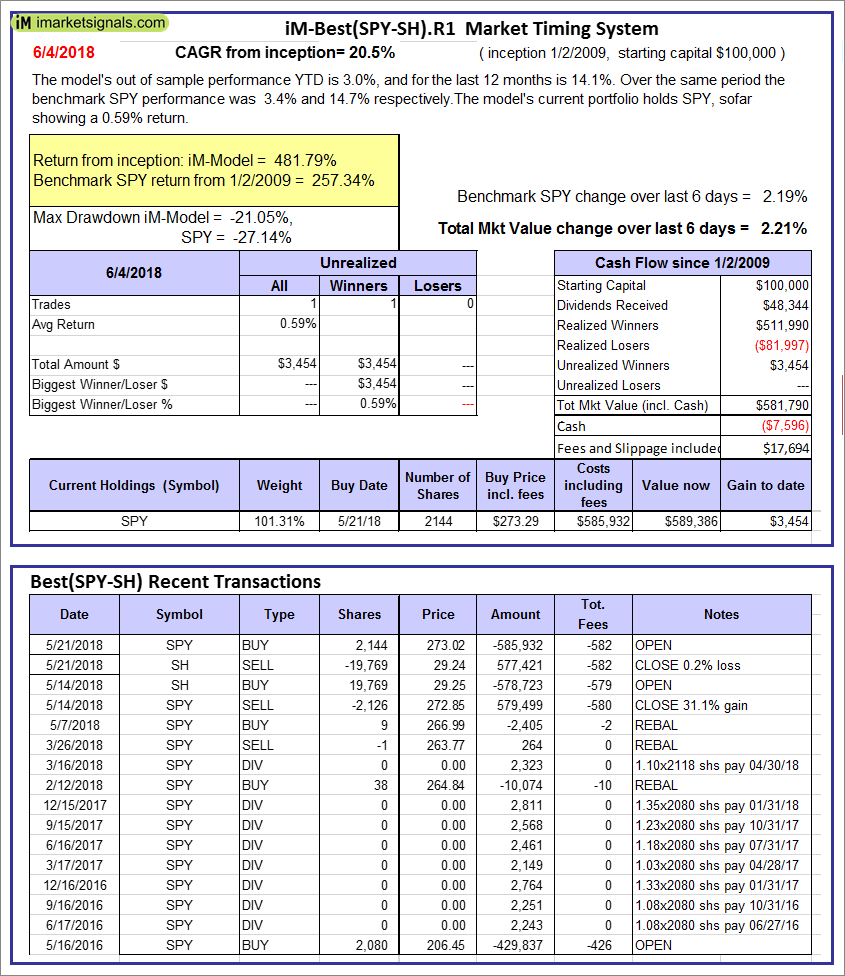 |
iM-Best(SPY-SH).R1: The model’s out of sample performance YTD is 3.0%, and for the last 12 months is 14.1%. Over the same period the benchmark SPY performance was 3.4% and 14.7% respectively. Over the previous week the market value of Best(SPY-SH) gained 2.21% at a time when SPY gained 2.19%. A starting capital of $100,000 at inception on 1/2/2009 would have grown to $581,790 which includes -$7,596 cash and excludes $17,694 spent on fees and slippage. |
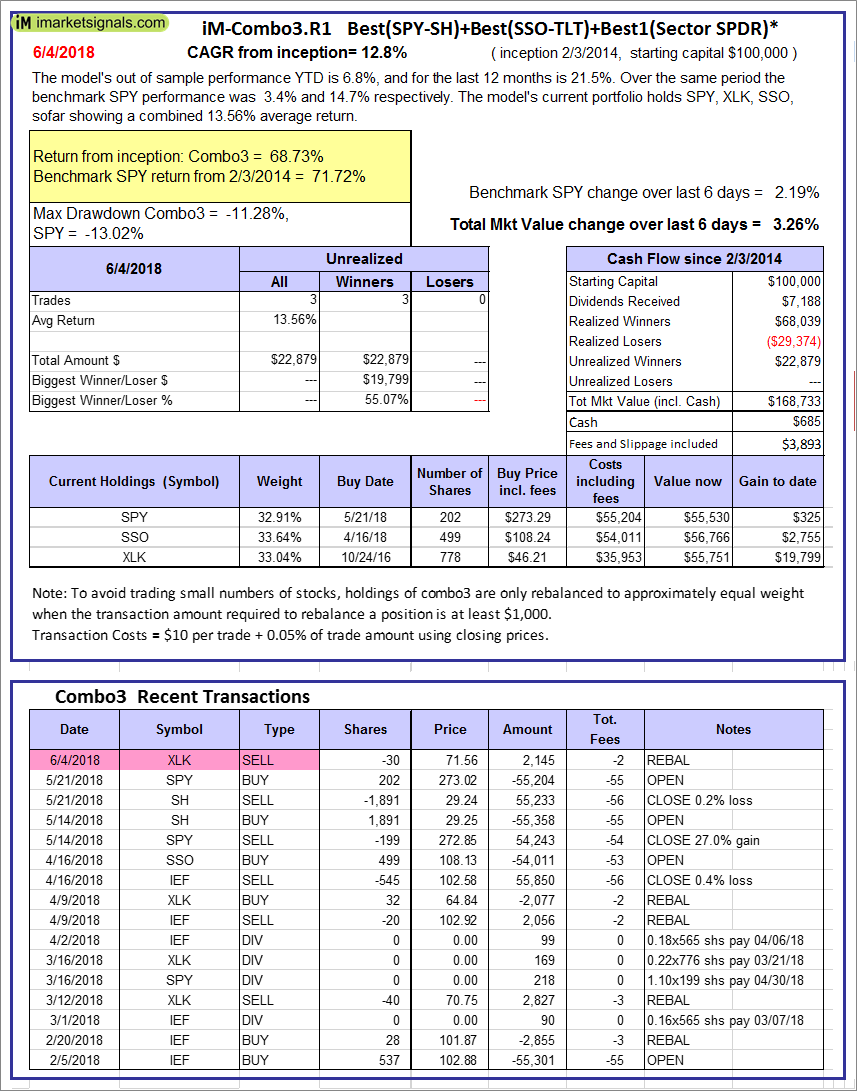 |
iM-Combo3.R1: The model’s out of sample performance YTD is 6.8%, and for the last 12 months is 21.5%. Over the same period the benchmark SPY performance was 3.4% and 14.7% respectively. Over the previous week the market value of iM-Combo3.R1 gained 3.26% at a time when SPY gained 2.19%. A starting capital of $100,000 at inception on 2/3/2014 would have grown to $168,733 which includes $685 cash and excludes $3,893 spent on fees and slippage. |
 |
iM-Combo5: The model’s out of sample performance YTD is 7.1%, and for the last 12 months is 22.1%. Over the same period the benchmark SPY performance was 3.4% and 14.7% respectively. Over the previous week the market value of iM-Combo5 gained 3.66% at a time when SPY gained 2.19%. A starting capital of $100,000 at inception on 2/22/2016 would have grown to $137,068 which includes $13 cash and excludes $926 spent on fees and slippage. |
 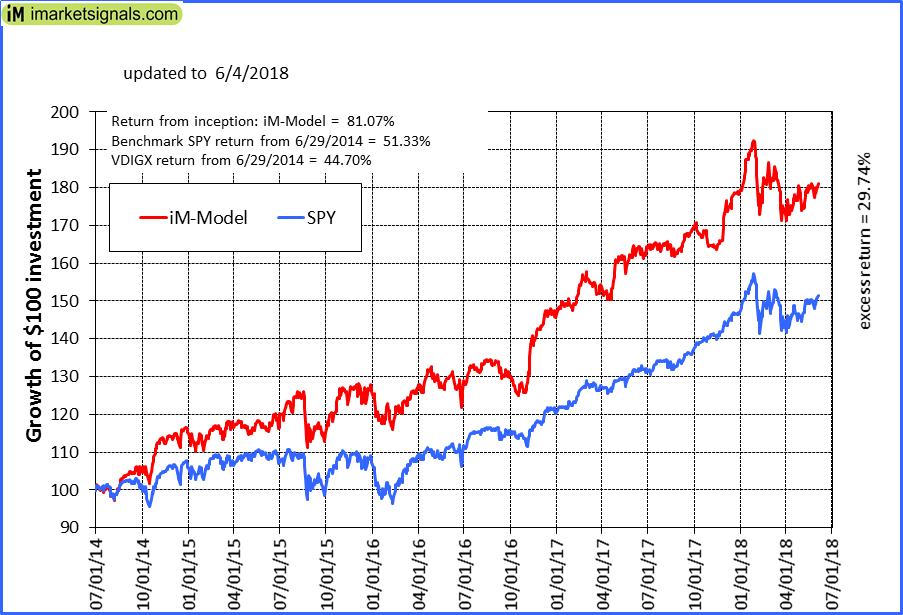 |
iM-Best10(VDIGX)-Trader: The model’s out of sample performance YTD is 1.6%, and for the last 12 months is 10.0%. Over the same period the benchmark SPY performance was 3.4% and 14.7% respectively. Since inception, on 7/1/2014, the model gained 81.07% while the benchmark SPY gained 51.33% and VDIGX gained 44.70% over the same period. Over the previous week the market value of iM-Best10(VDIGX) gained 2.02% at a time when SPY gained 2.19%. A starting capital of $100,000 at inception on 7/1/2014 would have grown to $180,776 which includes -$33 cash and excludes $2,246 spent on fees and slippage. |
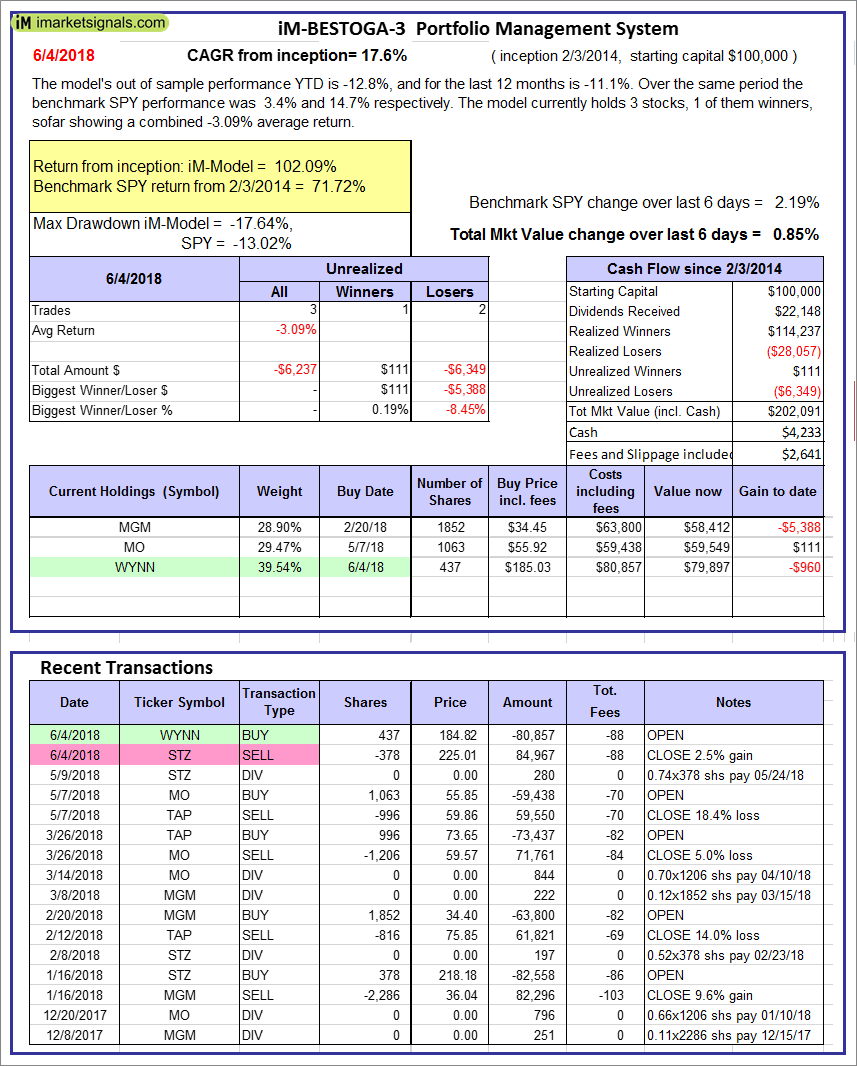 |
iM-BESTOGA-3: The model’s out of sample performance YTD is -12.8%, and for the last 12 months is -11.1%. Over the same period the benchmark SPY performance was 3.4% and 14.7% respectively. Over the previous week the market value of iM-BESTOGA-3 gained 0.85% at a time when SPY gained 2.19%. A starting capital of $100,000 at inception on 2/3/2014 would have grown to $202,091 which includes $4,233 cash and excludes $2,641 spent on fees and slippage. |
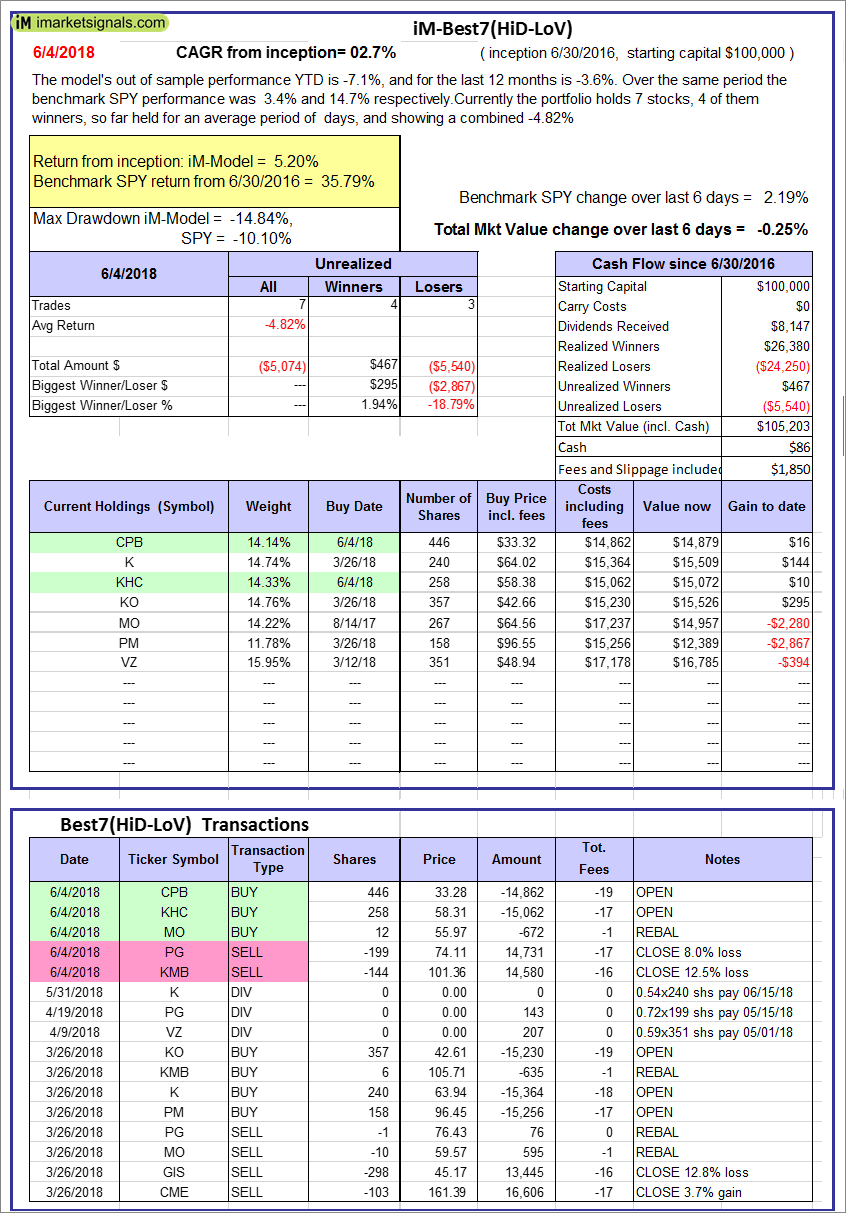 |
iM-Best7(HiD-LoV): The model’s out of sample performance YTD is -7.1%, and for the last 12 months is -3.6%. Over the same period the benchmark SPY performance was 3.4% and 14.7% respectively. Over the previous week the market value of iM-BESTOGA-3 gained -0.25% at a time when SPY gained 2.19%. A starting capital of $100,000 at inception on 6/30/2016 would have grown to $105,203 which includes $86 cash and excludes $1,850 spent on fees and slippage. |
 |
iM 6-Stock Capital Strength Portfolio: The model’s out of sample performance YTD is -0.8%, and for the last 12 months is 19.3%. Over the same period the benchmark SPY performance was 3.4% and 14.7% respectively. Over the previous week the market value of the iM 6-Stock Capital Strength Portfolio gained 0.64% at a time when SPY gained 2.19%. A starting capital of $100,000 at inception on 10/28/2016 would have grown to $150,325 which includes $1,019 cash and excludes $704 spent on fees and slippage. |
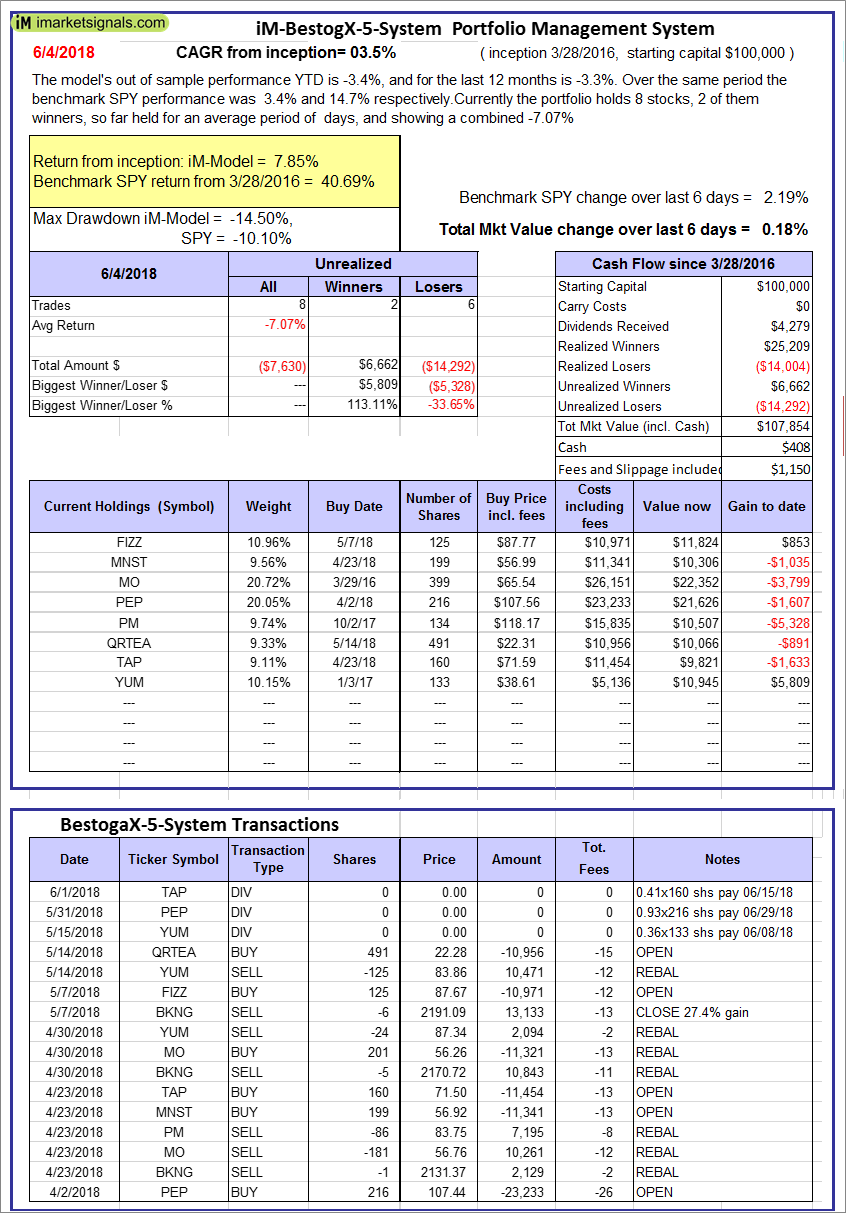 |
iM-BestogaX5-System: The model’s out of sample performance YTD is -3.4%, and for the last 12 months is -3.3%. Over the same period the benchmark SPY performance was 3.4% and 14.7% respectively. Over the previous week the market value of iM-BestogaX5-System gained 0.18% at a time when SPY gained 2.19%. A starting capital of $100,000 at inception on 3/28/2016 would have grown to $107,854 which includes $408 cash and excludes $1,150 spent on fees and slippage. |
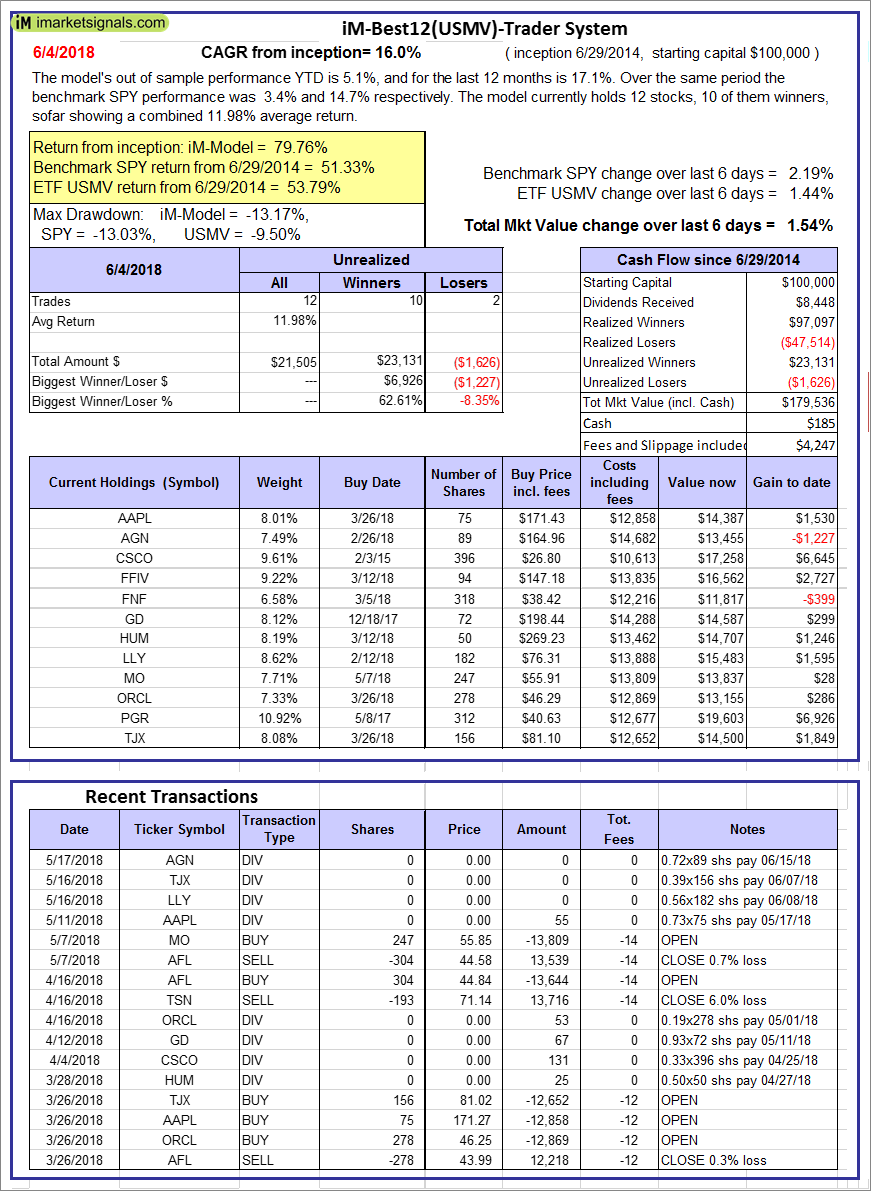  |
iM-Best12(USMV)-Trader: The model’s out of sample performance YTD is 5.1%, and for the last 12 months is 17.1%. Over the same period the benchmark SPY performance was 3.4% and 14.7% respectively. Since inception, on 6/30/2014, the model gained 79.76% while the benchmark SPY gained 51.33% and the ETF USMV gained 53.79% over the same period. Over the previous week the market value of iM-Best12(USMV)-Trader gained 1.54% at a time when SPY gained 2.19%. A starting capital of $100,000 at inception on 6/30/2014 would have grown to $179,536 which includes $185 cash and excludes $4,247 spent on fees and slippage. |
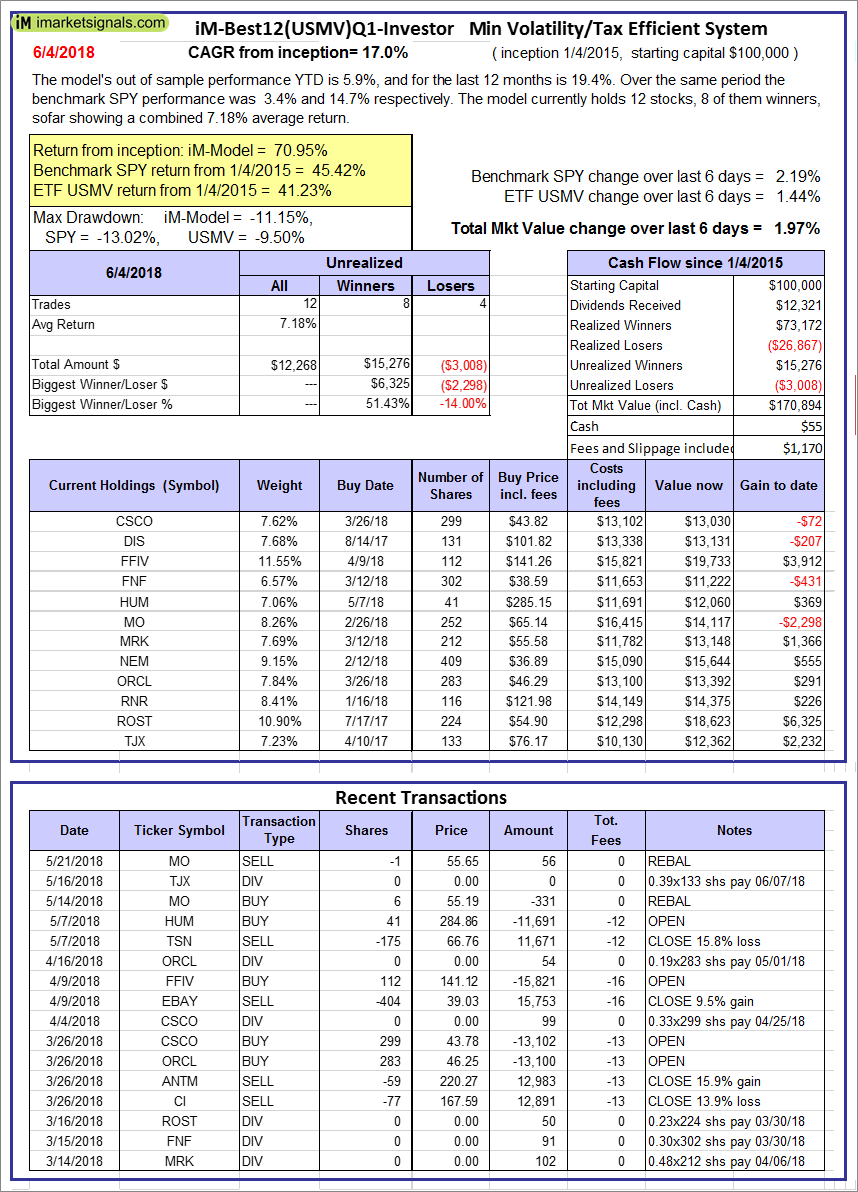 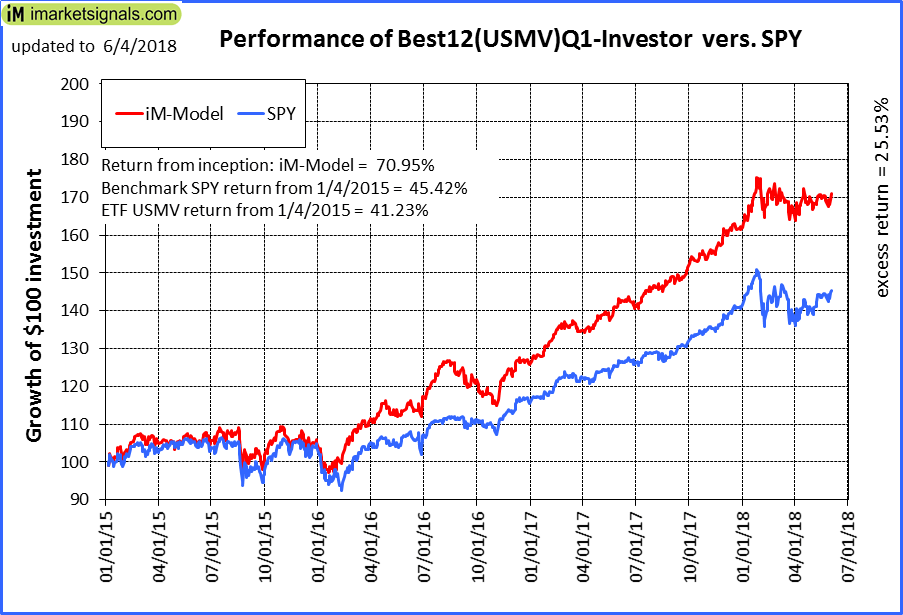 |
iM-Best12(USMV)Q1-Investor: The model’s out of sample performance YTD is 5.9%, and for the last 12 months is 19.4%. Over the same period the benchmark SPY performance was 3.4% and 14.7% respectively. Since inception, on 1/5/2015, the model gained 70.95% while the benchmark SPY gained 45.42% and the ETF USMV gained 41.23% over the same period. Over the previous week the market value of iM-Best12(USMV)Q1 gained 1.97% at a time when SPY gained 2.19%. A starting capital of $100,000 at inception on 1/5/2015 would have grown to $170,894 which includes $55 cash and excludes $1,170 spent on fees and slippage. |
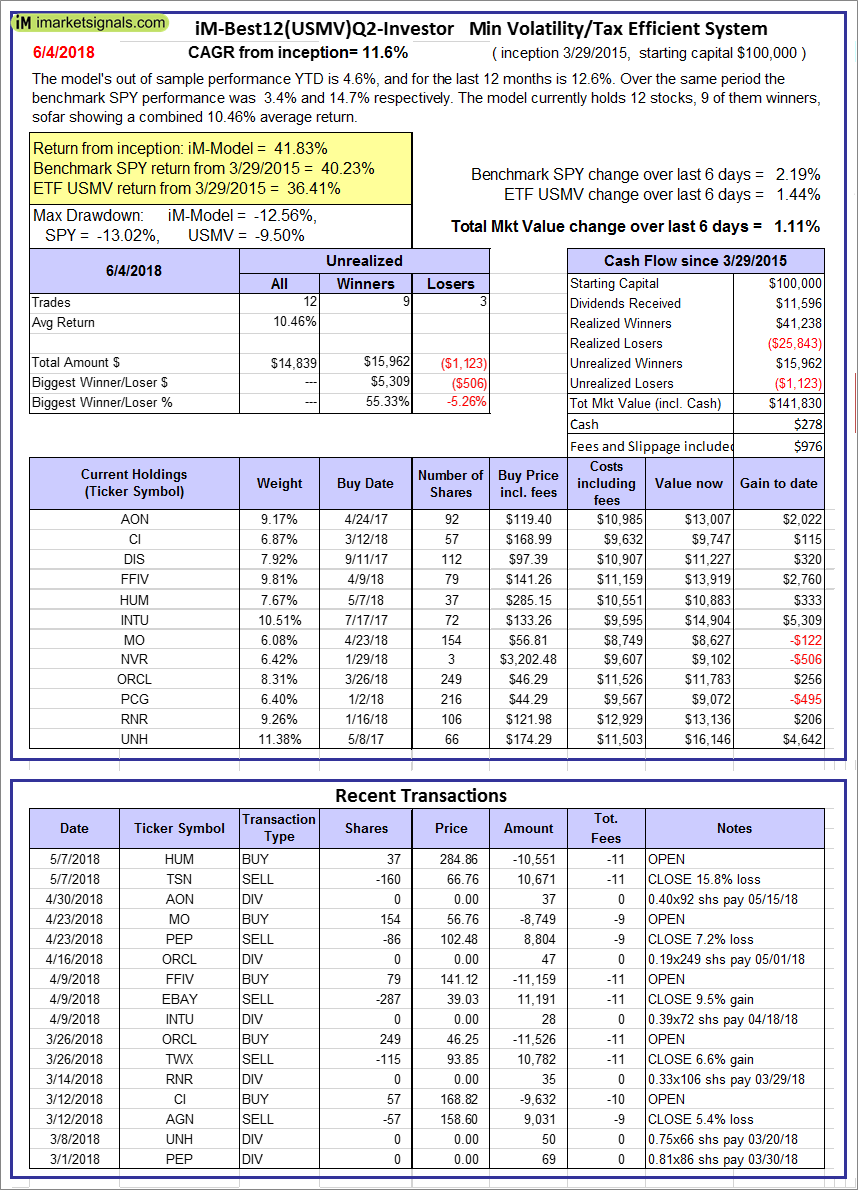 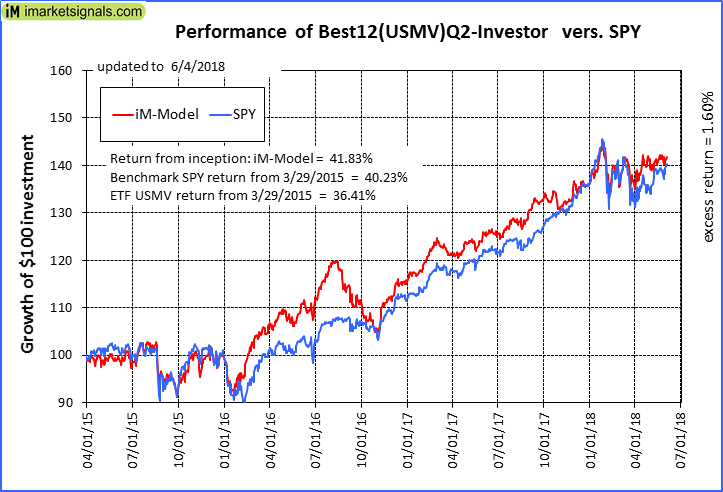 |
iM-Best12(USMV)Q2-Investor: The model’s out of sample performance YTD is 4.6%, and for the last 12 months is 12.6%. Over the same period the benchmark SPY performance was 3.4% and 14.7% respectively. Since inception, on 3/30/2015, the model gained 41.83% while the benchmark SPY gained 40.23% and the ETF USMV gained 36.41% over the same period. Over the previous week the market value of iM-Best12(USMV)Q2 gained 1.11% at a time when SPY gained 2.19%. A starting capital of $100,000 at inception on 3/30/2015 would have grown to $141,830 which includes $278 cash and excludes $976 spent on fees and slippage. |
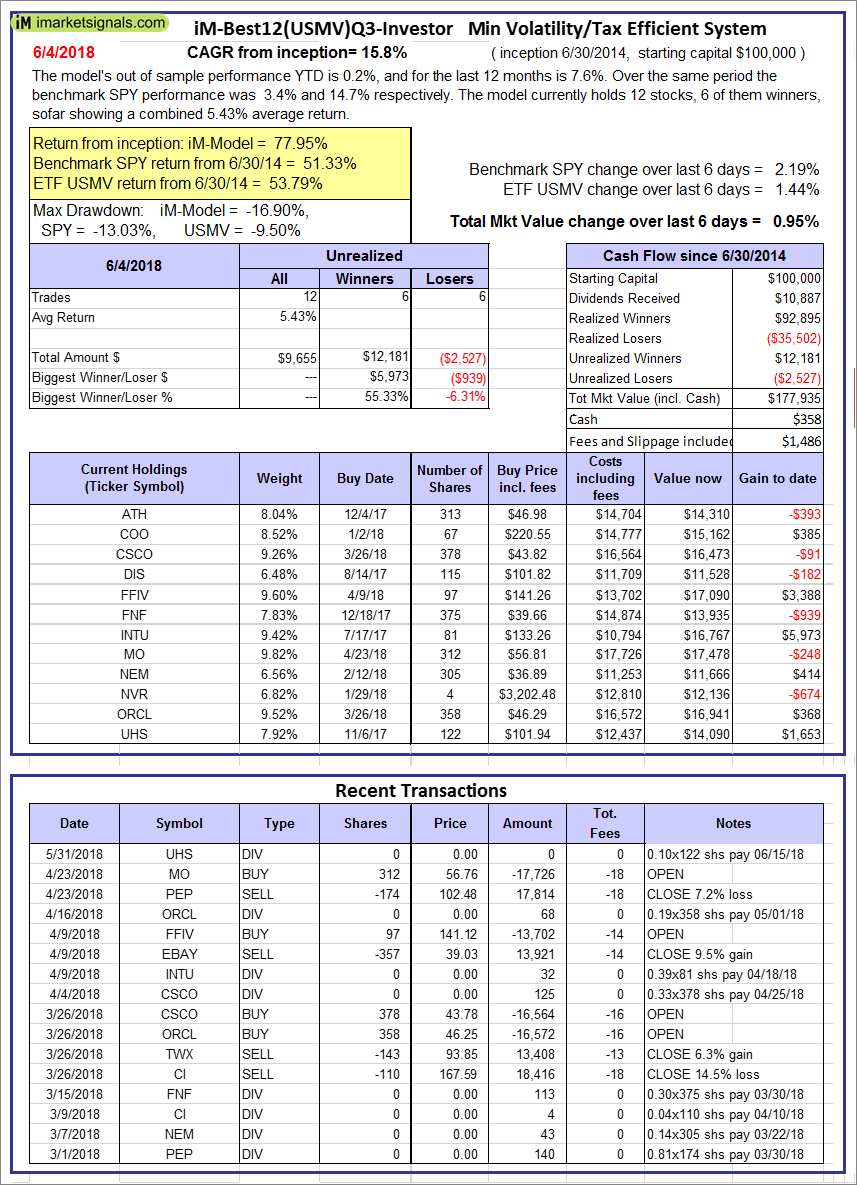 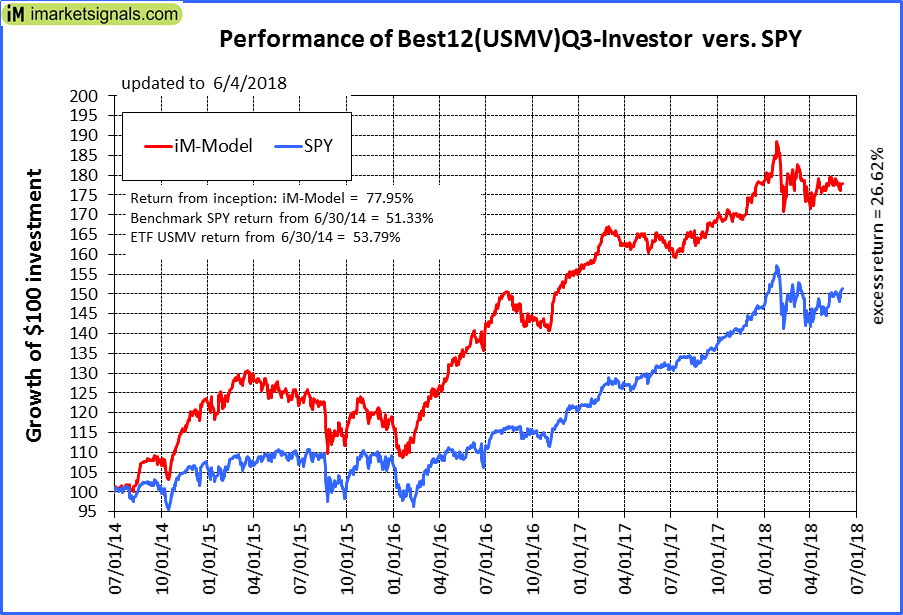 |
iM-Best12(USMV)Q3-Investor: The model’s out of sample performance YTD is 0.2%, and for the last 12 months is 7.6%. Over the same period the benchmark SPY performance was 3.4% and 14.7% respectively. Since inception, on 7/1/2014, the model gained 77.95% while the benchmark SPY gained 51.33% and the ETF USMV gained 53.79% over the same period. Over the previous week the market value of iM-Best12(USMV)Q3 gained 0.95% at a time when SPY gained 2.19%. A starting capital of $100,000 at inception on 7/1/2014 would have grown to $177,935 which includes $358 cash and excludes $1,486 spent on fees and slippage. |
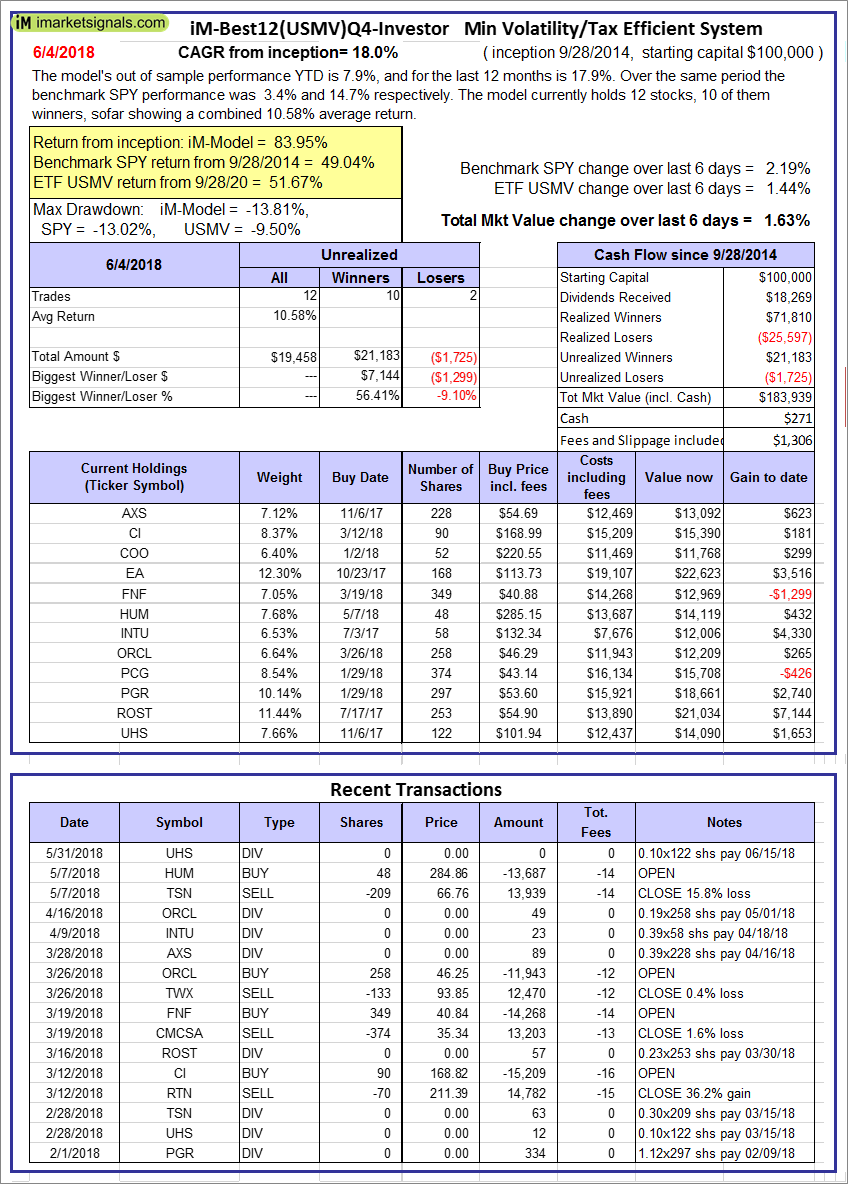 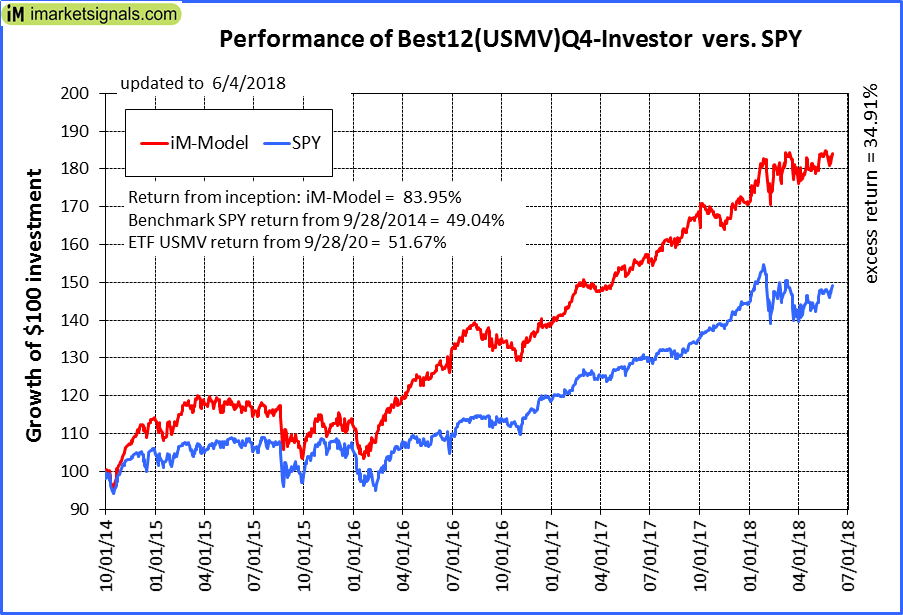 |
iM-Best12(USMV)Q4-Investor: Since inception, on 9/29/2014, the model gained 83.95% while the benchmark SPY gained 49.04% and the ETF USMV gained 51.67% over the same period. Over the previous week the market value of iM-Best12(USMV)Q4 gained 1.63% at a time when SPY gained 2.19%. A starting capital of $100,000 at inception on 9/29/2014 would have grown to $183,939 which includes $271 cash and excludes $1,306 spent on fees and slippage. |
 |
Average Performance of iM-Best12(USMV)Q1+Q2+Q3+Q4-Investor resulted in an excess return of 40.21% over SPY. (see iM-USMV Investor Portfolio) |
 |
iM-Best(Short): The model’s out of sample performance YTD is 0.3%, and for the last 12 months is -7.5%. Over the same period the benchmark SPY performance was 3.4% and 14.7% respectively. Over the previous week the market value of iM-Best(Short) gained -1.06% at a time when SPY gained 2.19%. Over the period 1/2/2009 to 6/4/2018 the starting capital of $100,000 would have grown to $91,529 which includes $166,490 cash and excludes $24,243 spent on fees and slippage. |
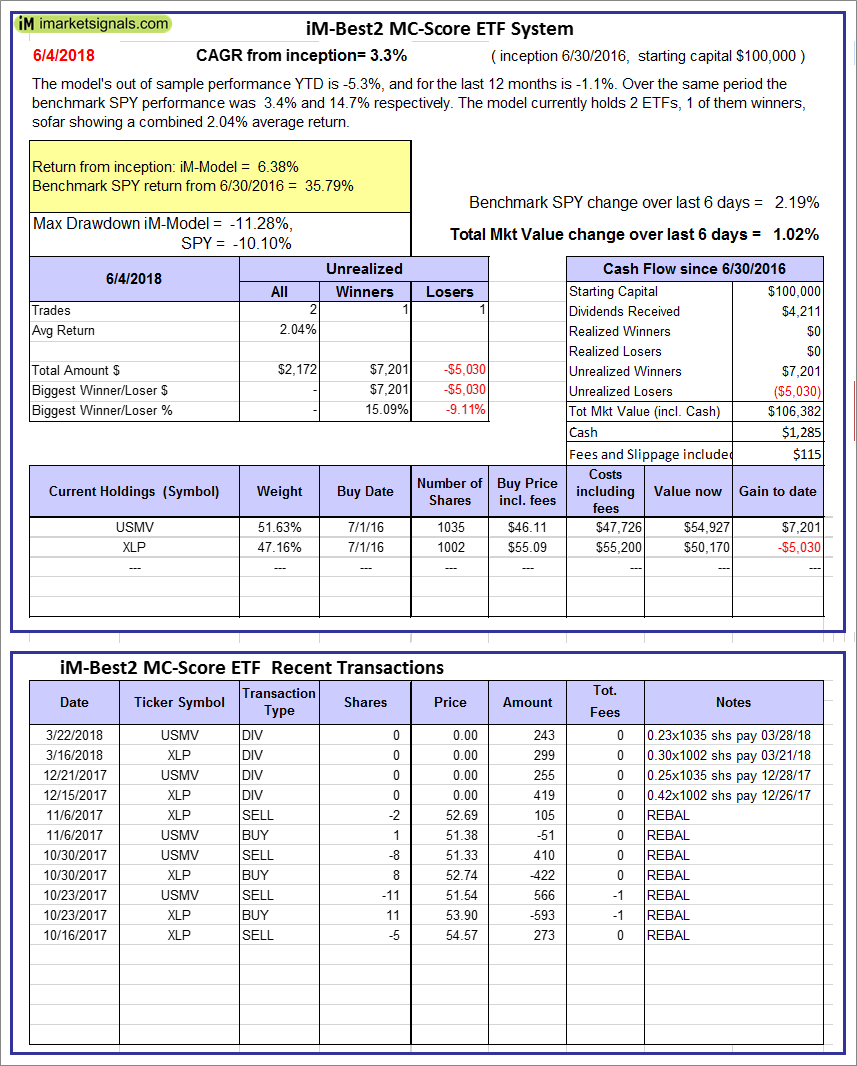 |
iM-Best2 MC-Score ETF System: The model’s out of sample performance YTD is -5.3%, and for the last 12 months is -1.1%. Over the same period the benchmark SPY performance was 3.4% and 14.7% respectively. Over the previous week the market value of the iM-Best2 MC-Score ETF System gained 1.02% at a time when SPY gained 2.19%. A starting capital of $100,000 at inception on 6/30/2016 would have grown to $106,382 which includes $1,285 cash and excludes $115 spent on fees and slippage. |
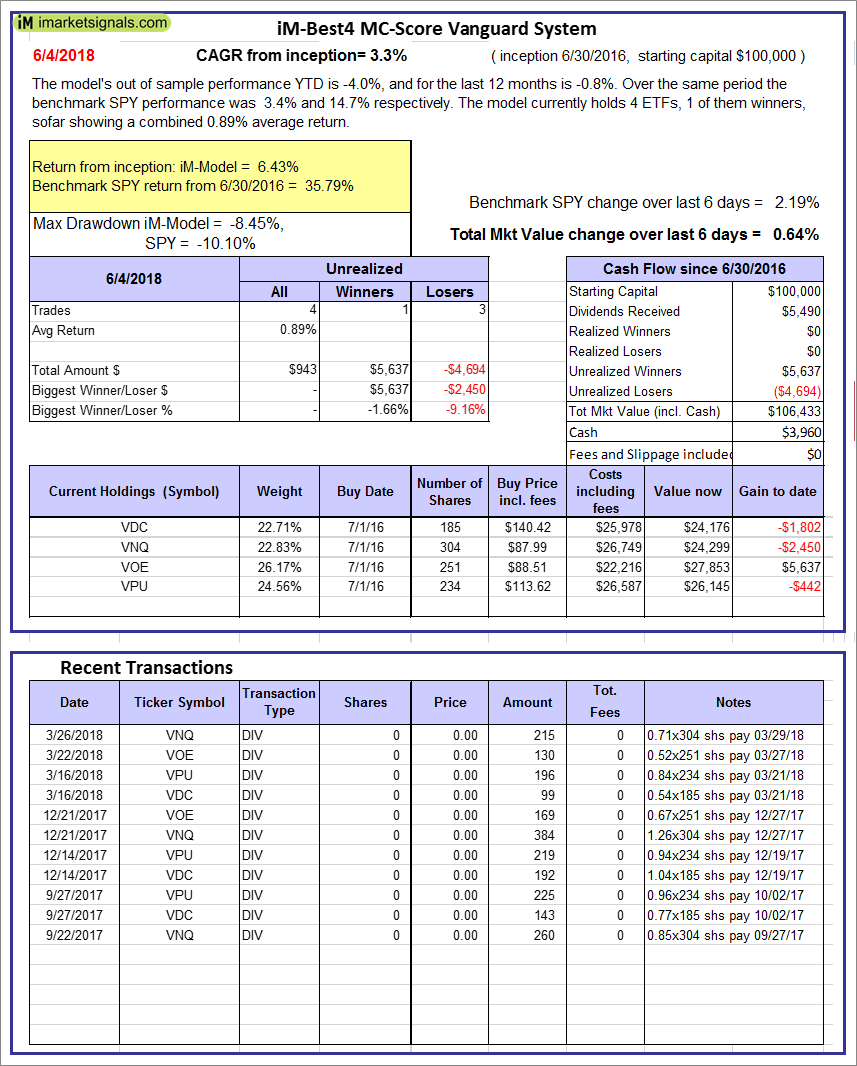 |
iM-Best4 MC-Score Vanguard System: The model’s out of sample performance YTD is -4.0%, and for the last 12 months is -0.8%. Over the same period the benchmark SPY performance was 3.4% and 14.7% respectively. Over the previous week the market value of the iM-Best4 MC-Score Vanguard System gained 0.64% at a time when SPY gained 2.19%. A starting capital of $100,000 at inception on 6/30/2016 would have grown to $106,433 which includes $3,960 cash and excludes $00 spent on fees and slippage. |
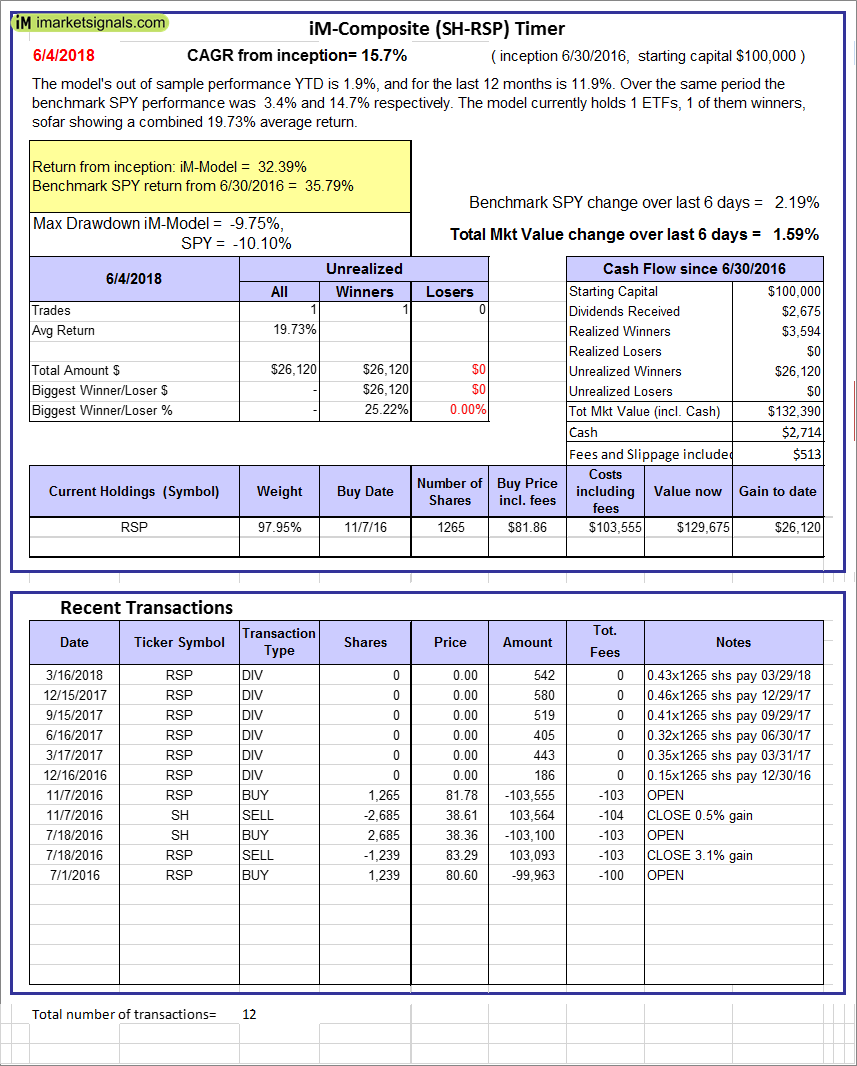 |
iM-Composite (SH-RSP) Timer: The model’s out of sample performance YTD is 1.9%, and for the last 12 months is 11.9%. Over the same period the benchmark SPY performance was 3.4% and 14.7% respectively. Over the previous week the market value of the iM-Composite (SH-RSP) Timer gained 1.59% at a time when SPY gained 2.19%. A starting capital of $100,000 at inception on 6/30/2016 would have grown to $132,390 which includes $2,714 cash and excludes $513 spent on fees and slippage. |
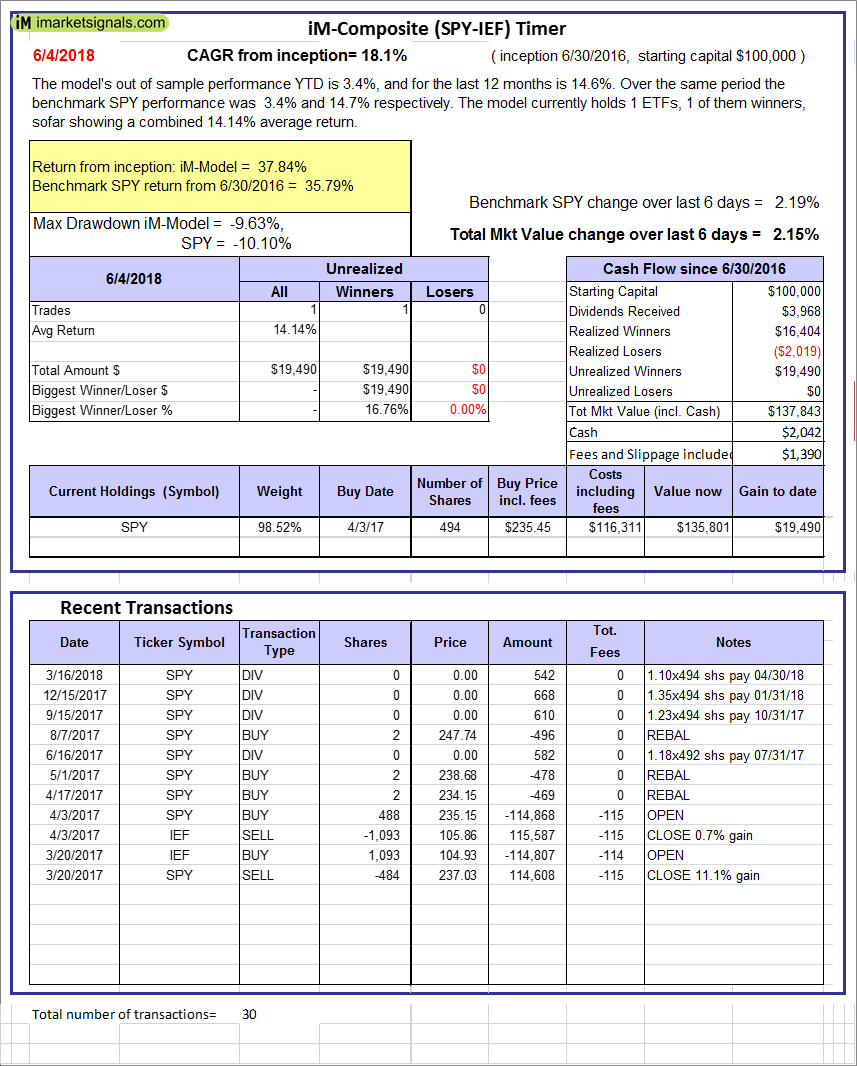 |
iM-Composite (SPY-IEF) Timer: The model’s out of sample performance YTD is 3.4%, and for the last 12 months is 14.6%. Over the same period the benchmark SPY performance was 3.4% and 14.7% respectively. Over the previous week the market value of the iM-Composite (SPY-IEF) Timer gained 2.15% at a time when SPY gained 2.19%. A starting capital of $100,000 at inception on 6/30/2016 would have grown to $137,843 which includes $2,042 cash and excludes $1,390 spent on fees and slippage. |
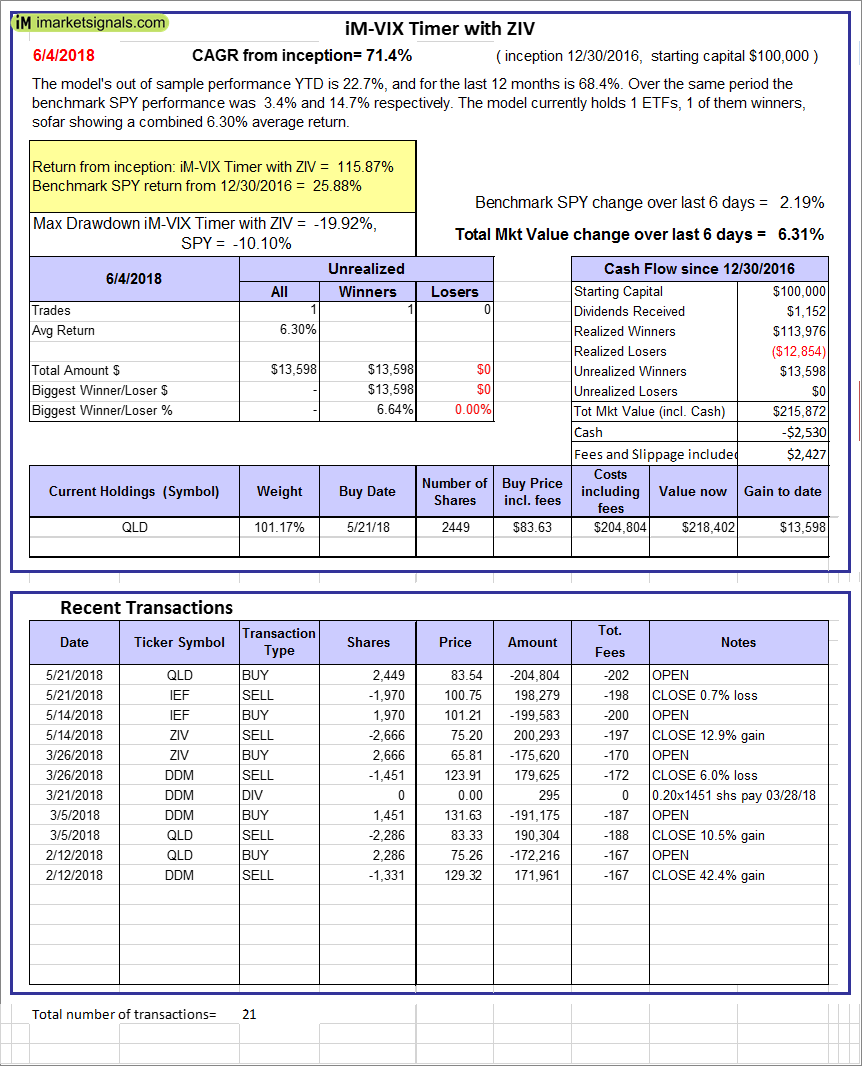 |
iM-VIX Timer with ZIV: The model’s out of sample performance YTD is 22.7%, and for the last 12 months is 68.4%. Over the same period the benchmark SPY performance was 3.4% and 14.7% respectively. Over the previous week the market value of the iM-VIX Timer with ZIV gained 6.31% at a time when SPY gained 2.19%. A starting capital of $100,000 at inception on 6/30/2016 would have grown to $215,872 which includes -$2,530 cash and excludes $2,427 spent on fees and slippage. |
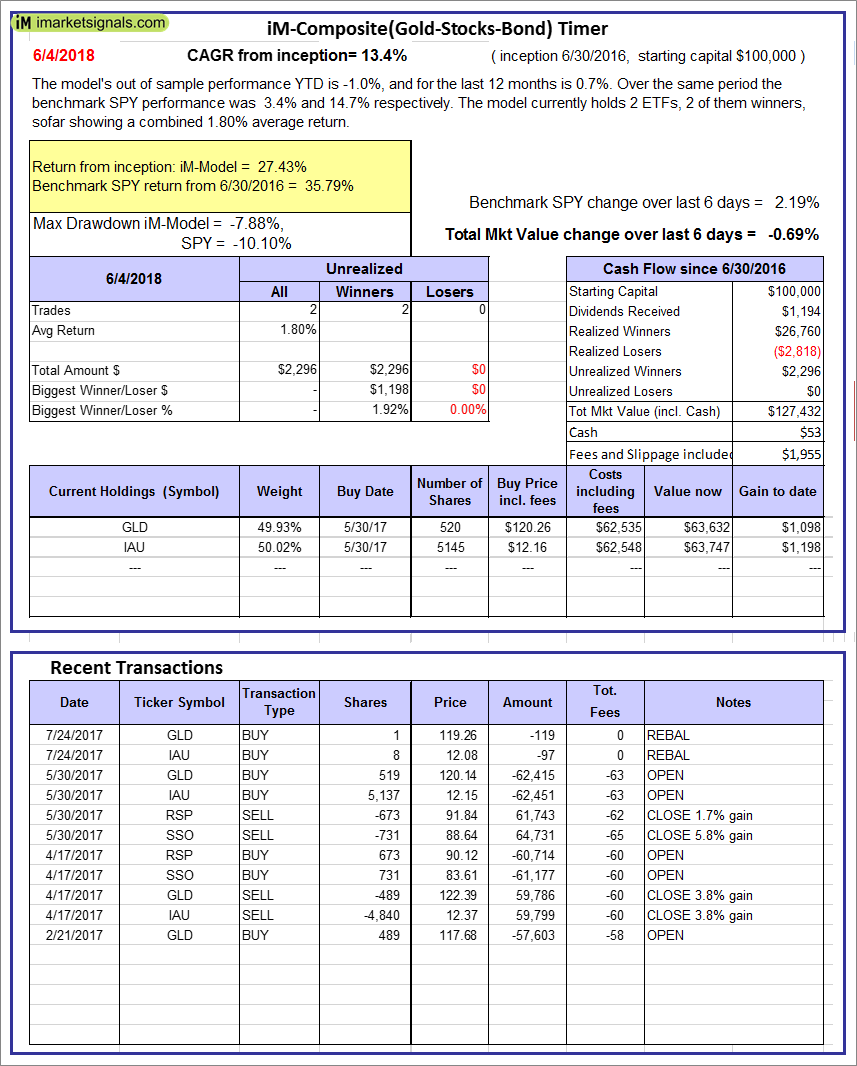 |
iM-Composite(Gold-Stocks-Bond) Timer: The model’s out of sample performance YTD is -1.0%, and for the last 12 months is 0.7%. Over the same period the benchmark SPY performance was 3.4% and 14.7% respectively. Over the previous week the market value of the iM-Composite(Gold-Stocks-Bond) Timer gained -0.69% at a time when SPY gained 2.19%. A starting capital of $100,000 at inception on 6/30/2016 would have grown to $127,432 which includes $53 cash and excludes $1,955 spent on fees and slippage. |
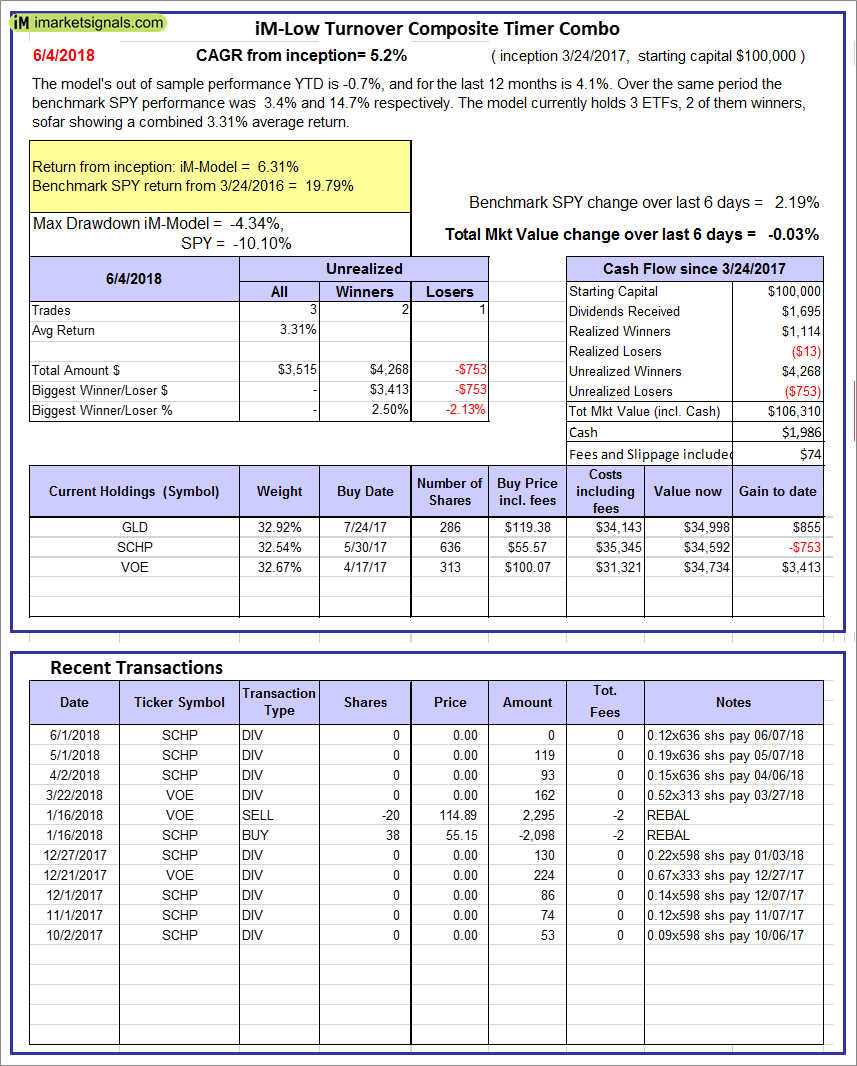 |
iM-Low Turnover Composite Timer Combo: The model’s out of sample performance YTD is -0.7%, and for the last 12 months is 4.1%. Over the same period the benchmark SPY performance was 3.4% and 14.7% respectively. Over the previous week the market value of the iM-Low Turnover Composite Timer Combo gained -0.03% at a time when SPY gained 2.19%. A starting capital of $100,000 at inception on 3/24/27 would have grown to $106,310 which includes $1,986 cash and excludes $74 spent on fees and slippage. |
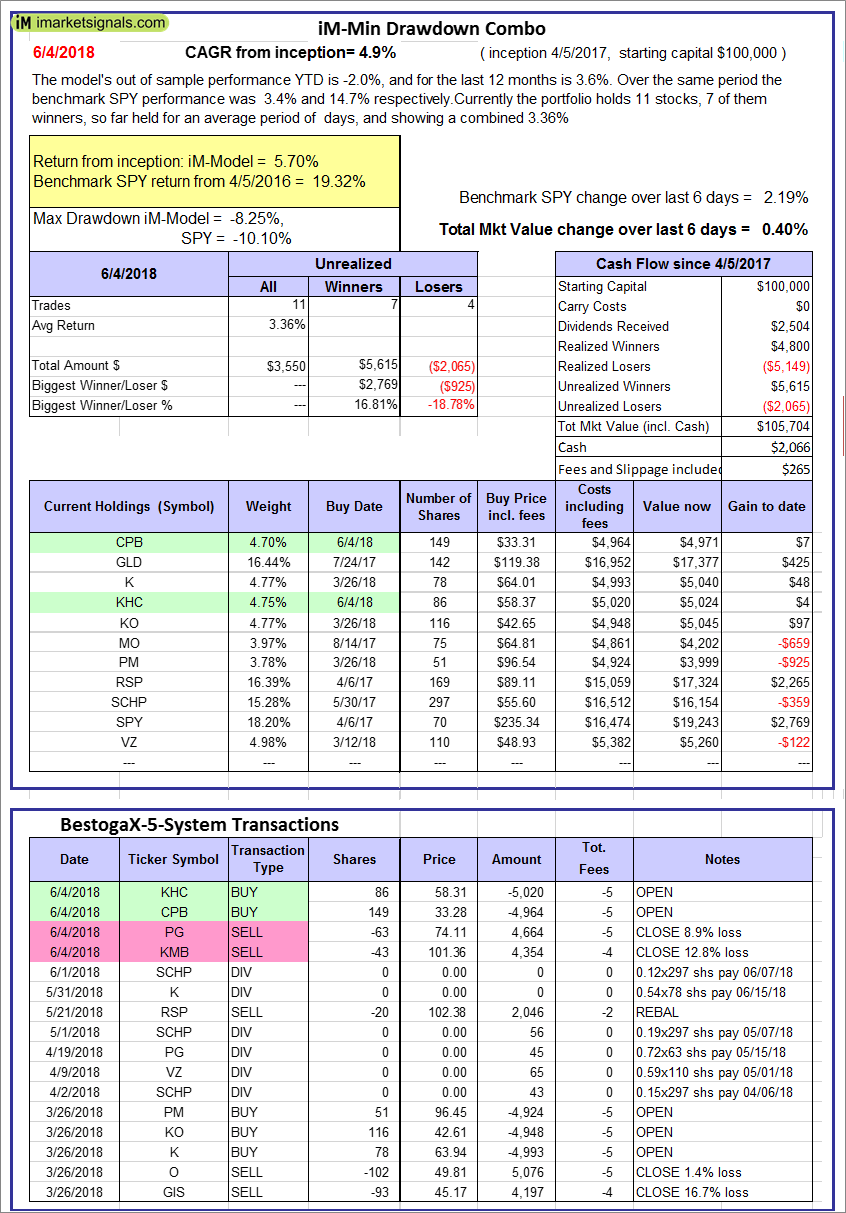 |
iM-Min Drawdown Combo: The model’s out of sample performance YTD is -2.0%, and for the last 12 months is 3.6%. Over the same period the benchmark SPY performance was 3.4% and 14.7% respectively. Over the previous week the market value of the iM-Min Drawdown Combo gained 0.40% at a time when SPY gained 2.19%. A starting capital of $100,000 at inception on 4/5/2017 would have grown to $105,704 which includes $2,066 cash and excludes $265 spent on fees and slippage. |
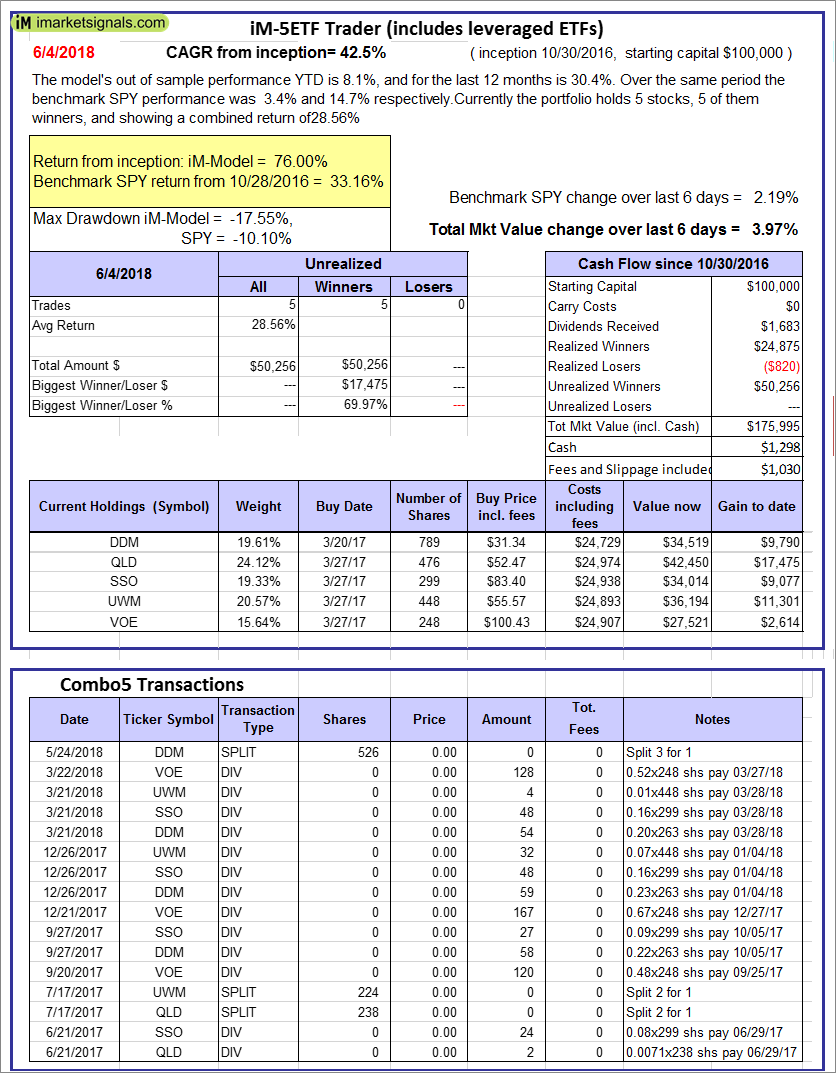 |
iM-5ETF Trader (includes leveraged ETFs): The model’s out of sample performance YTD is 8.1%, and for the last 12 months is 30.4%. Over the same period the benchmark SPY performance was 3.4% and 14.7% respectively. Over the previous week the market value of the iM-5ETF Trader (includes leveraged ETFs) gained 3.97% at a time when SPY gained 2.19%. A starting capital of $100,000 at inception on 10/30/2016 would have grown to $175,995 which includes $1,298 cash and excludes $1,030 spent on fees and slippage. |
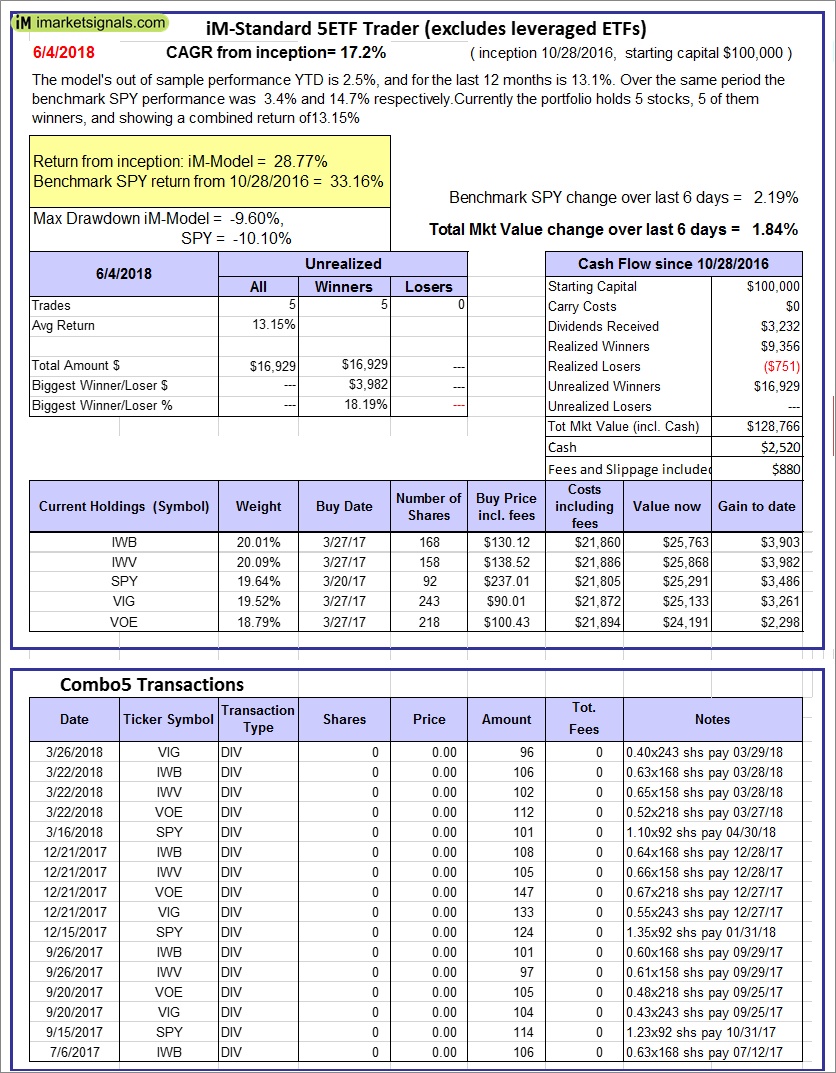 |
iM-Standard 5ETF Trader (excludes leveraged ETFs): The model’s out of sample performance YTD is 2.5%, and for the last 12 months is 13.1%. Over the same period the benchmark SPY performance was 3.4% and 14.7% respectively. Over the previous week the market value of the iM-Standard 5ETF Trader (excludes leveraged ETFs) gained 1.84% at a time when SPY gained 2.19%. A starting capital of $100,000 at inception on 10/30/2016 would have grown to $128,766 which includes $2,520 cash and excludes $880 spent on fees and slippage. |
iM-Best Reports – 6/4/2018
Posted in pmp SPY-SH
Leave a Reply
You must be logged in to post a comment.