
  |
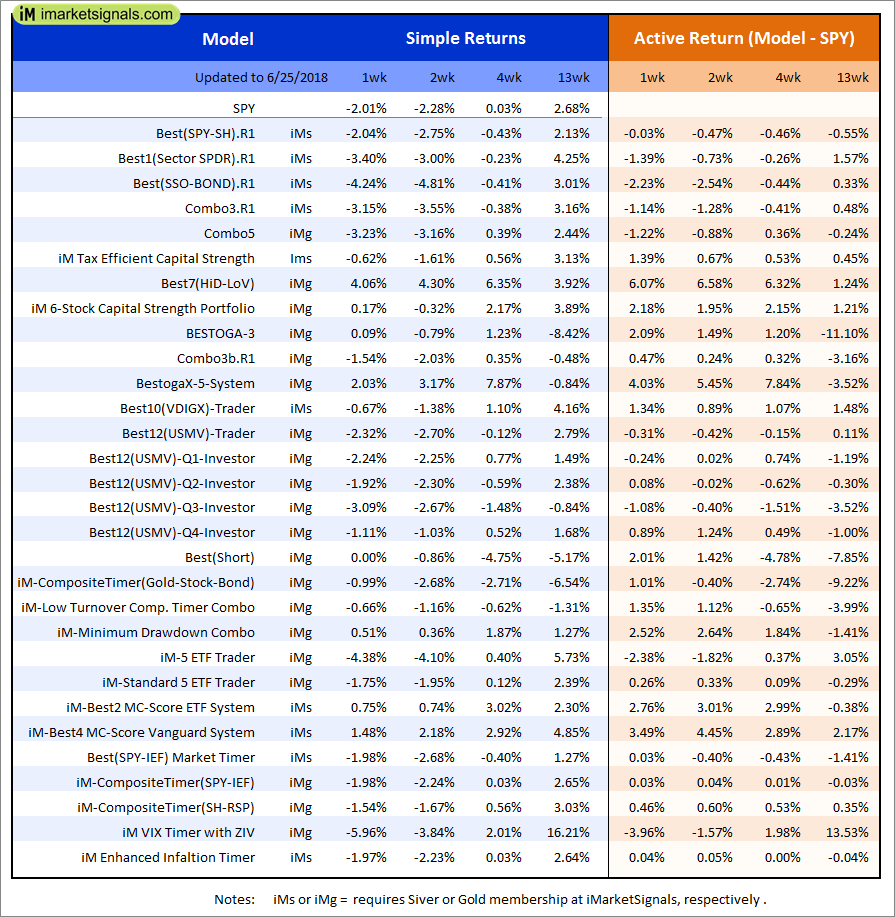
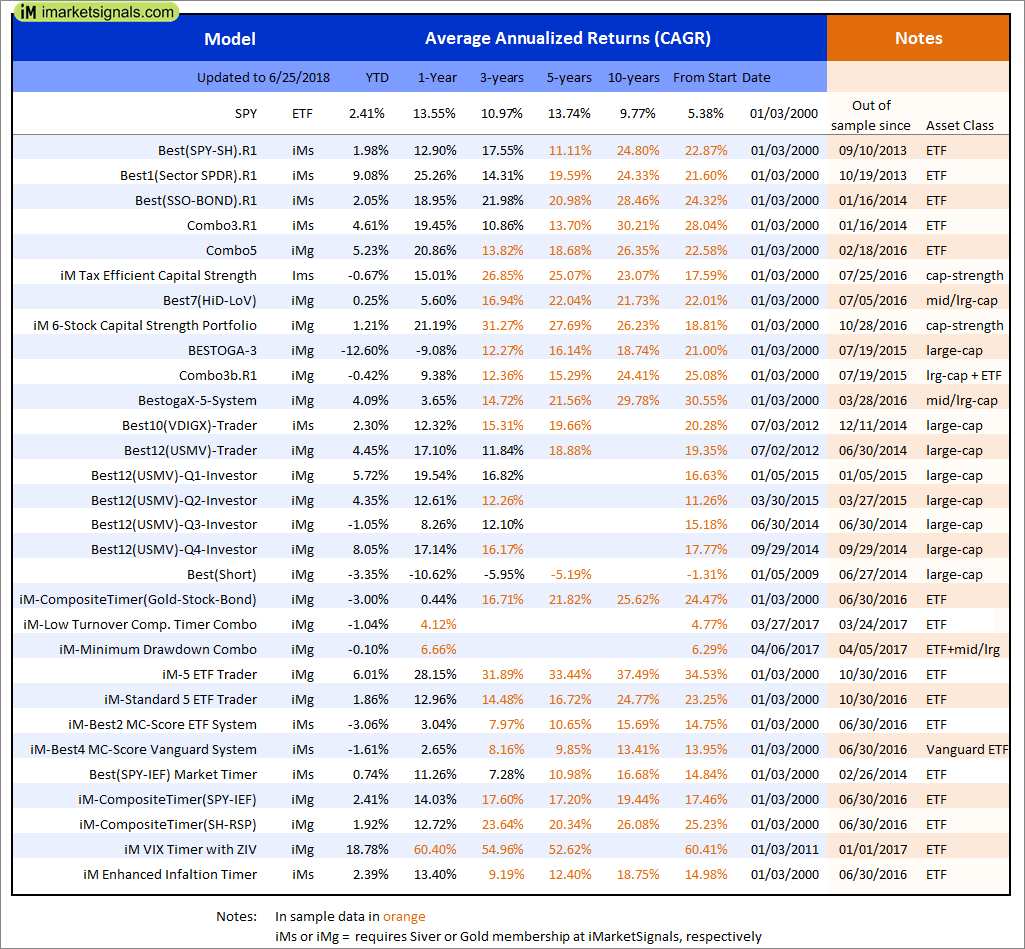
Out of sample performance summary of our models for the past 1, 2, 4 and 13 week periods. The active active return indicates how the models over- or underperformed the benchmark ETF SPY. Also the YTD, and the 1-, 3-, 5- and 10-year annualized returns are shown in the second table |
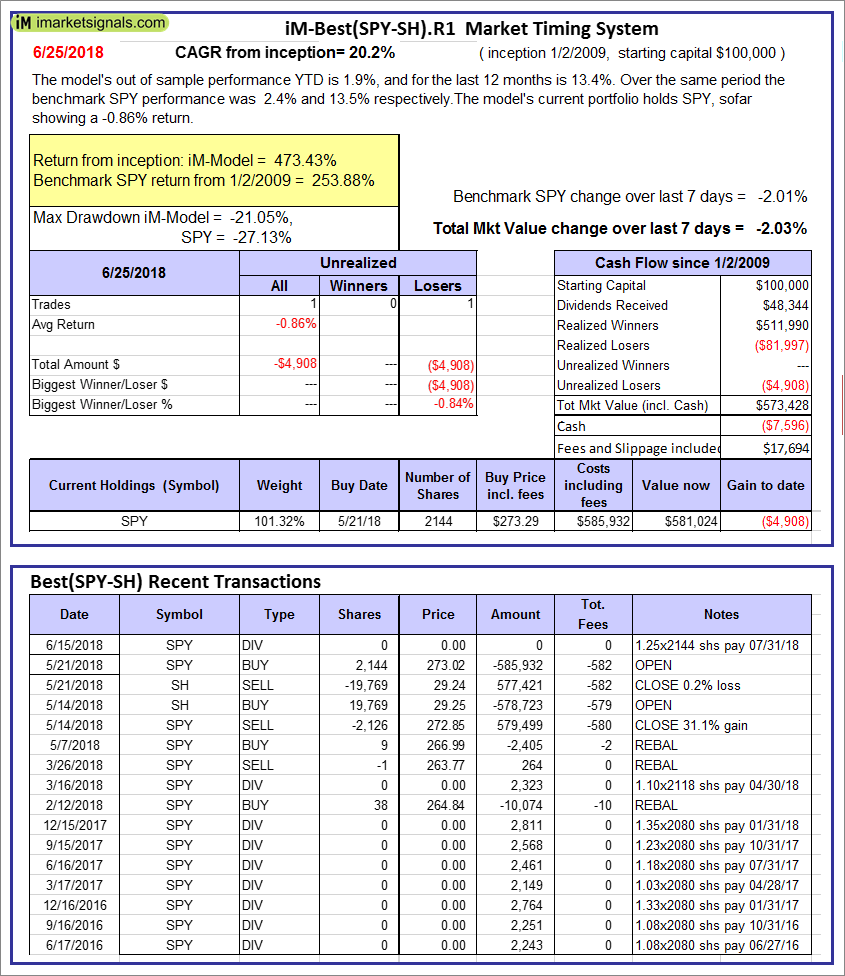 |
iM-Best(SPY-SH).R1: The model’s out of sample performance YTD is 1.9%, and for the last 12 months is 13.4%. Over the same period the benchmark SPY performance was 2.4% and 13.5% respectively. Over the previous week the market value of Best(SPY-SH) gained -2.03% at a time when SPY gained -2.01%. A starting capital of $100,000 at inception on 1/2/2009 would have grown to $573,428 which includes -$7,596 cash and excludes $17,694 spent on fees and slippage. |
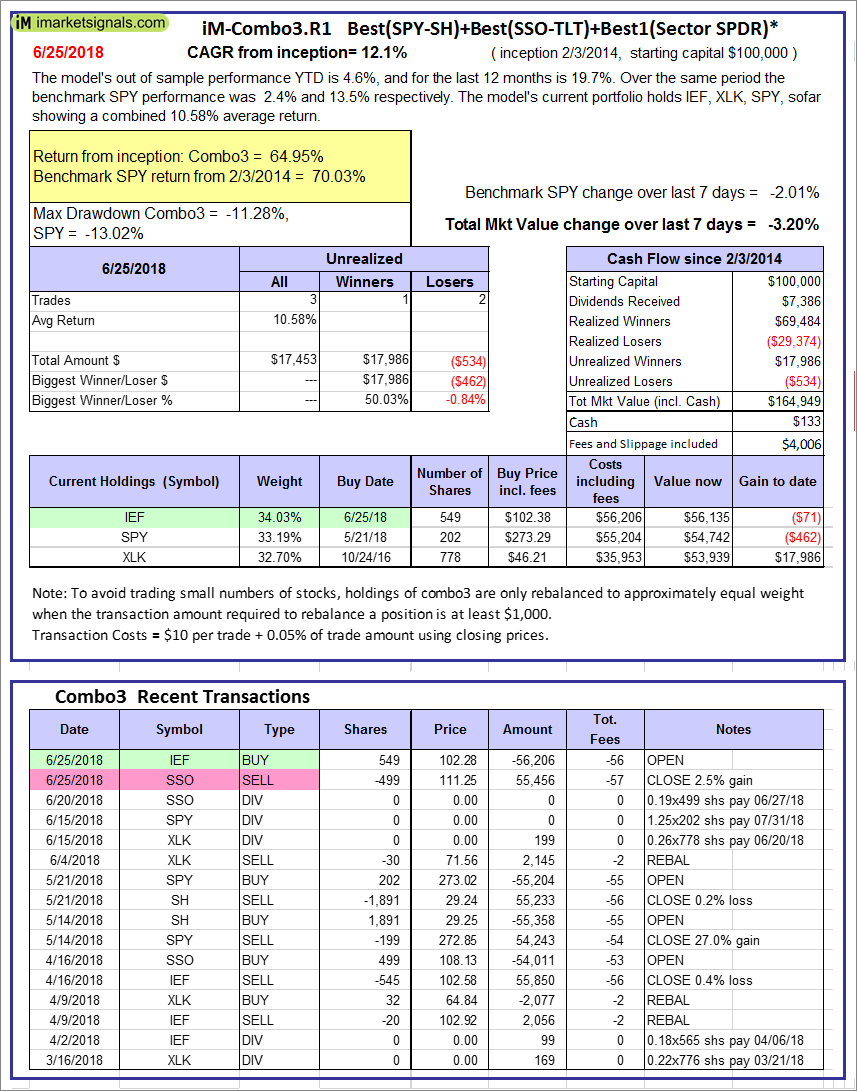 |
iM-Combo3.R1: The model’s out of sample performance YTD is 4.6%, and for the last 12 months is 19.7%. Over the same period the benchmark SPY performance was 2.4% and 13.5% respectively. Over the previous week the market value of iM-Combo3.R1 gained -3.20% at a time when SPY gained -2.01%. A starting capital of $100,000 at inception on 2/3/2014 would have grown to $164,949 which includes $133 cash and excludes $4,006 spent on fees and slippage. |
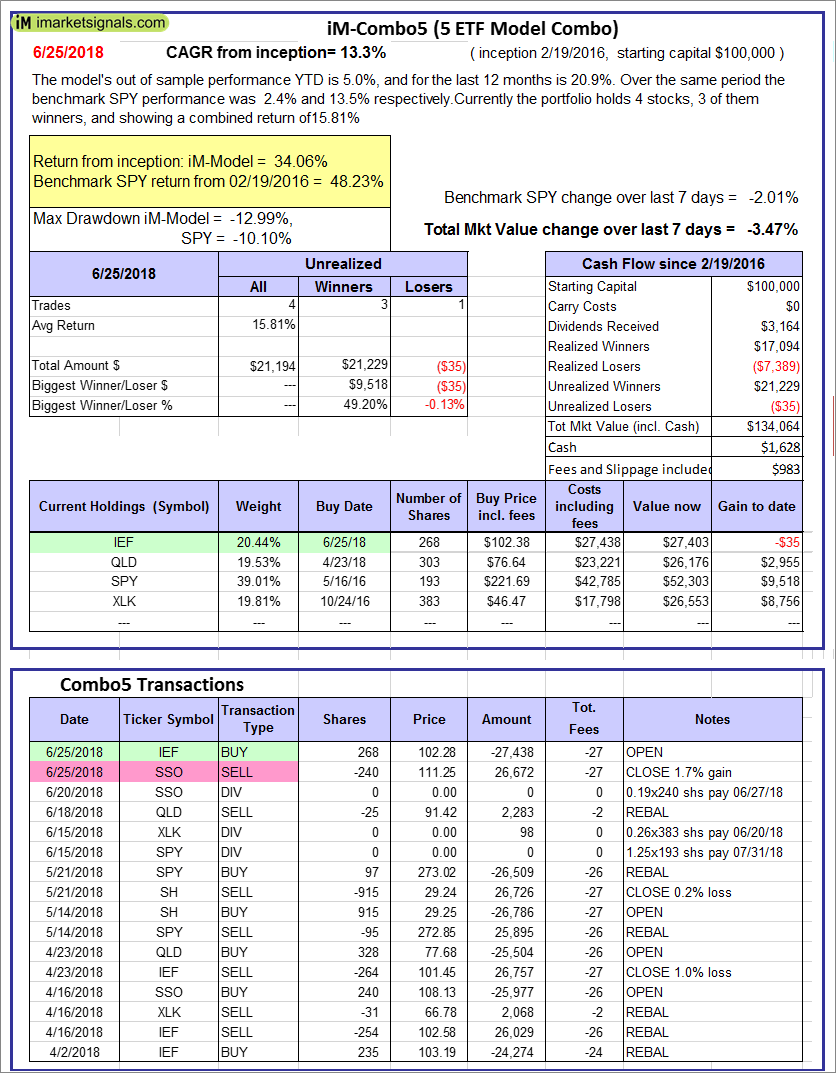 |
iM-Combo5: The model’s out of sample performance YTD is 5.0%, and for the last 12 months is 20.9%. Over the same period the benchmark SPY performance was 2.4% and 13.5% respectively. Over the previous week the market value of iM-Combo5 gained -3.47% at a time when SPY gained -2.01%. A starting capital of $100,000 at inception on 2/22/2016 would have grown to $134,064 which includes $1,628 cash and excludes $983 spent on fees and slippage. |
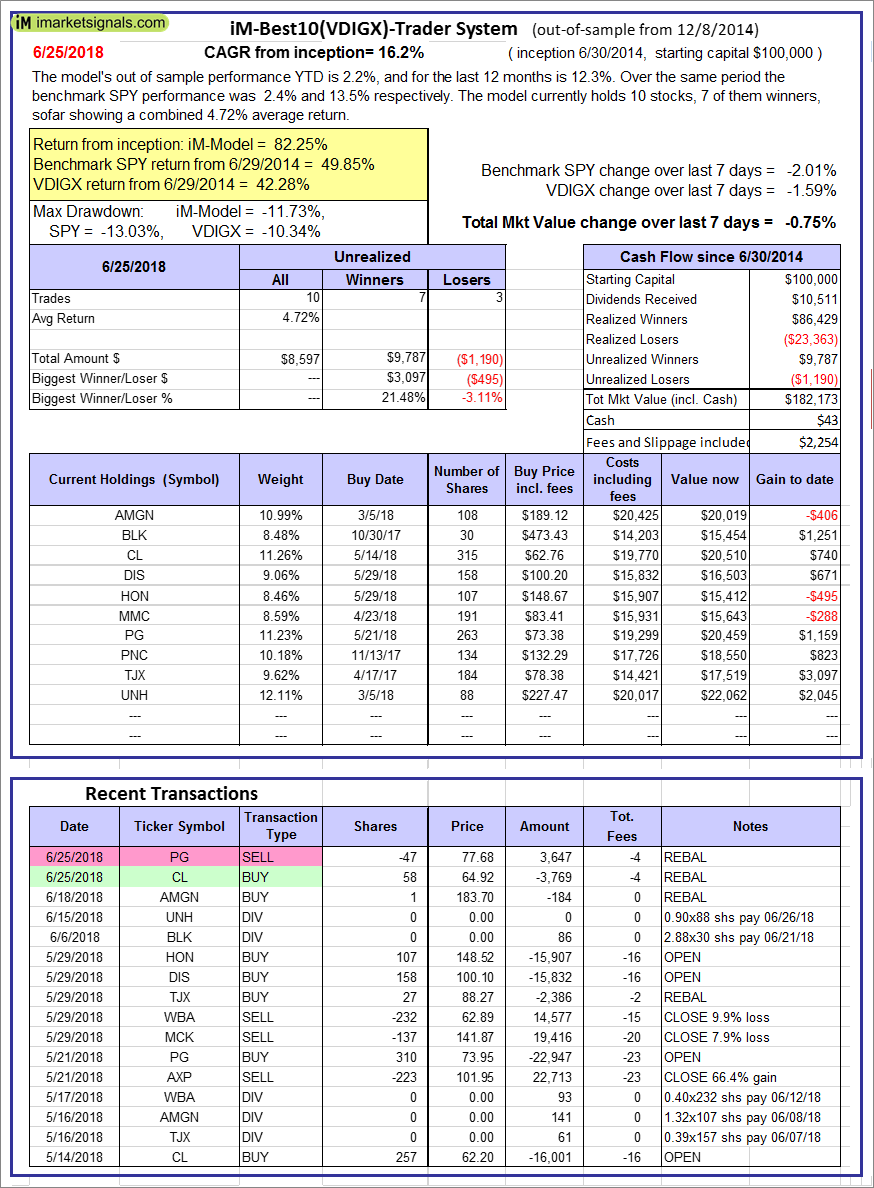 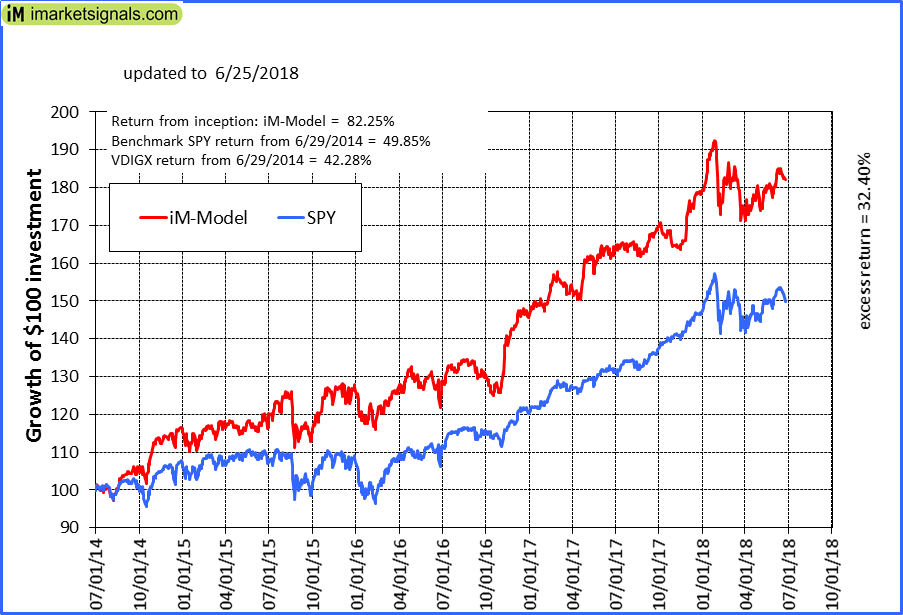 |
iM-Best10(VDIGX)-Trader: The model’s out of sample performance YTD is 2.2%, and for the last 12 months is 12.3%. Over the same period the benchmark SPY performance was 2.4% and 13.5% respectively. Since inception, on 7/1/2014, the model gained 82.25% while the benchmark SPY gained 49.85% and VDIGX gained 42.28% over the same period. Over the previous week the market value of iM-Best10(VDIGX) gained -0.75% at a time when SPY gained -2.01%. A starting capital of $100,000 at inception on 7/1/2014 would have grown to $182,173 which includes $43 cash and excludes $2,254 spent on fees and slippage. |
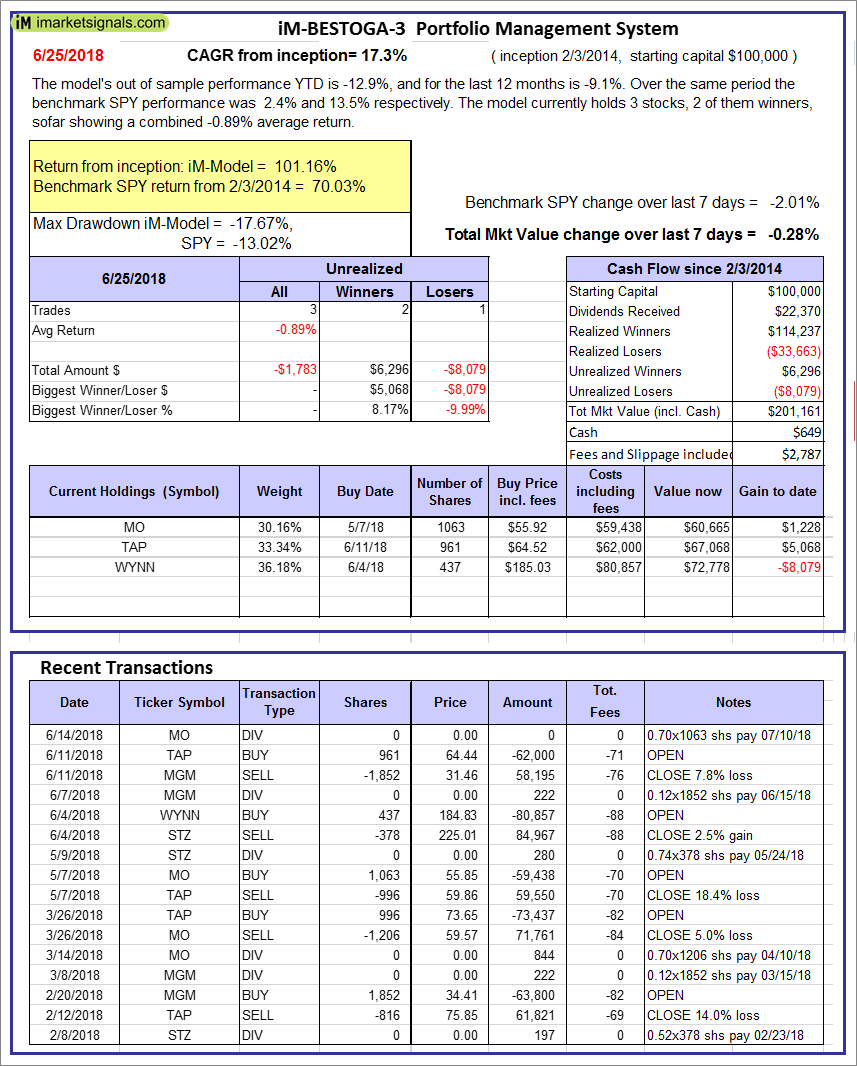 |
iM-BESTOGA-3: The model’s out of sample performance YTD is -12.9%, and for the last 12 months is -9.1%. Over the same period the benchmark SPY performance was 2.4% and 13.5% respectively. Over the previous week the market value of iM-BESTOGA-3 gained -0.28% at a time when SPY gained -2.01%. A starting capital of $100,000 at inception on 2/3/2014 would have grown to $201,161 which includes $649 cash and excludes $2,787 spent on fees and slippage. |
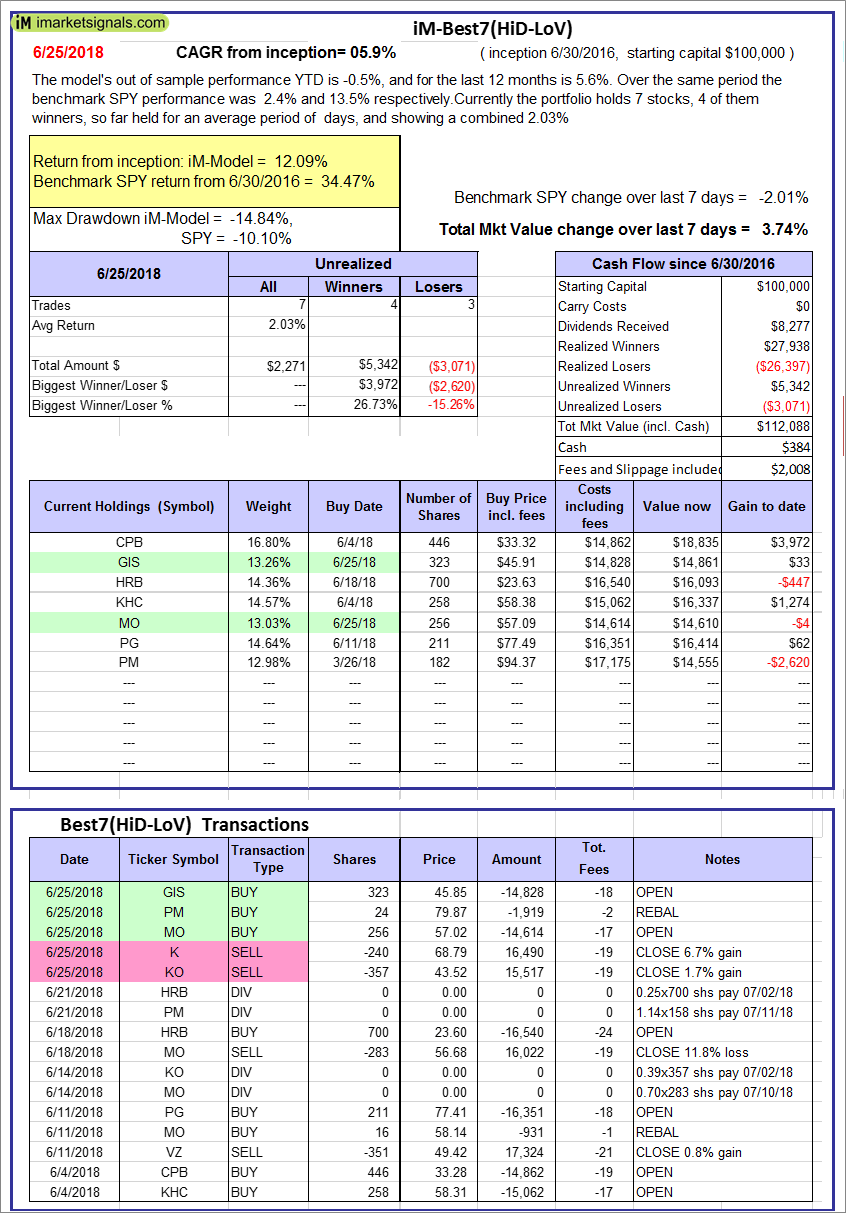 |
iM-Best7(HiD-LoV): The model’s out of sample performance YTD is -0.5%, and for the last 12 months is 5.6%. Over the same period the benchmark SPY performance was 2.4% and 13.5% respectively. Over the previous week the market value of iM-BESTOGA-3 gained 3.74% at a time when SPY gained -2.01%. A starting capital of $100,000 at inception on 6/30/2016 would have grown to $112,088 which includes $384 cash and excludes $2,008 spent on fees and slippage. |
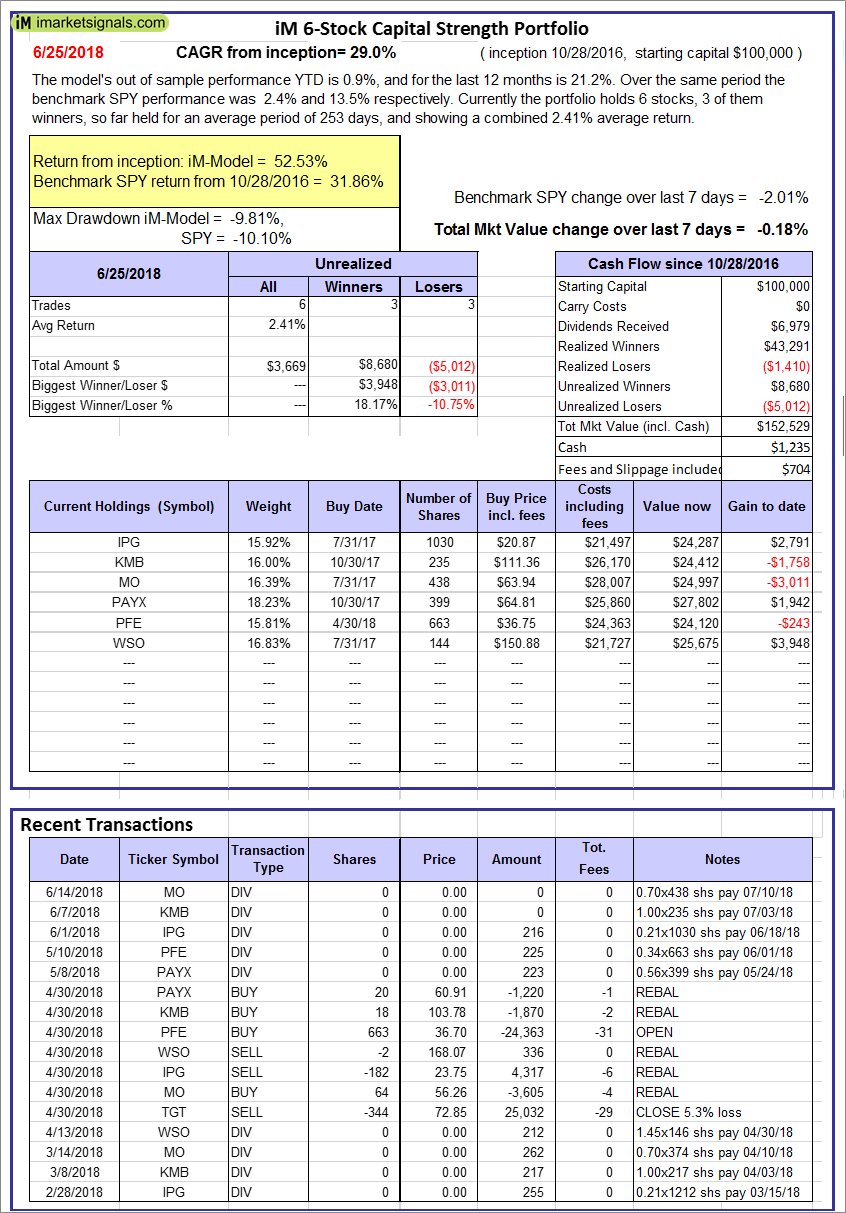 |
iM 6-Stock Capital Strength Portfolio: The model’s out of sample performance YTD is 0.9%, and for the last 12 months is 21.2%. Over the same period the benchmark SPY performance was 2.4% and 13.5% respectively. Over the previous week the market value of the iM 6-Stock Capital Strength Portfolio gained -0.18% at a time when SPY gained -2.01%. A starting capital of $100,000 at inception on 10/28/2016 would have grown to $152,529 which includes $1,235 cash and excludes $704 spent on fees and slippage. |
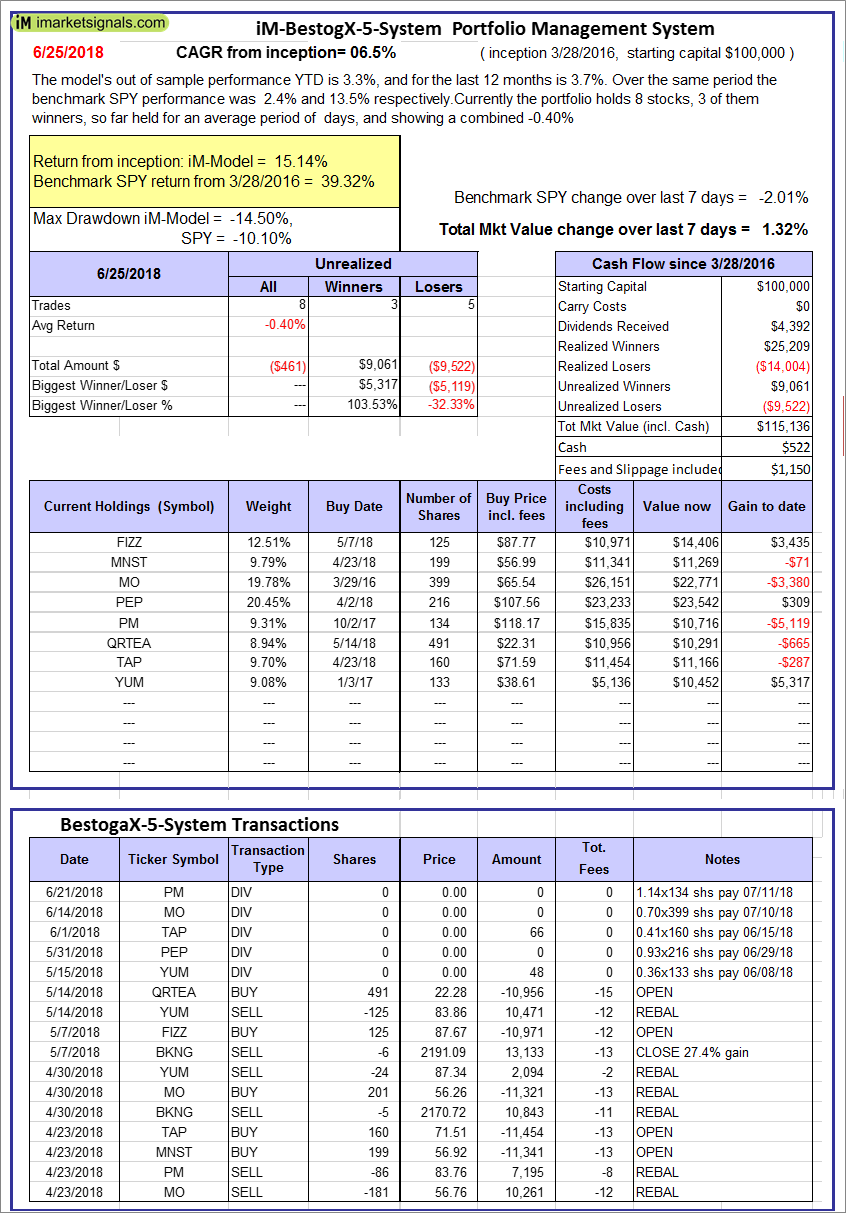 |
iM-BestogaX5-System: The model’s out of sample performance YTD is 3.3%, and for the last 12 months is 3.7%. Over the same period the benchmark SPY performance was 2.4% and 13.5% respectively. Over the previous week the market value of iM-BestogaX5-System gained 1.32% at a time when SPY gained -2.01%. A starting capital of $100,000 at inception on 3/28/2016 would have grown to $115,136 which includes $522 cash and excludes $1,150 spent on fees and slippage. |
  |
iM-Best12(USMV)-Trader: The model’s out of sample performance YTD is 4.2%, and for the last 12 months is 17.1%. Over the same period the benchmark SPY performance was 2.4% and 13.5% respectively. Since inception, on 6/30/2014, the model gained 78.28% while the benchmark SPY gained 49.85% and the ETF USMV gained 54.74% over the same period. Over the previous week the market value of iM-Best12(USMV)-Trader gained -2.46% at a time when SPY gained -2.01%. A starting capital of $100,000 at inception on 6/30/2014 would have grown to $178,014 which includes $190 cash and excludes $4,304 spent on fees and slippage. |
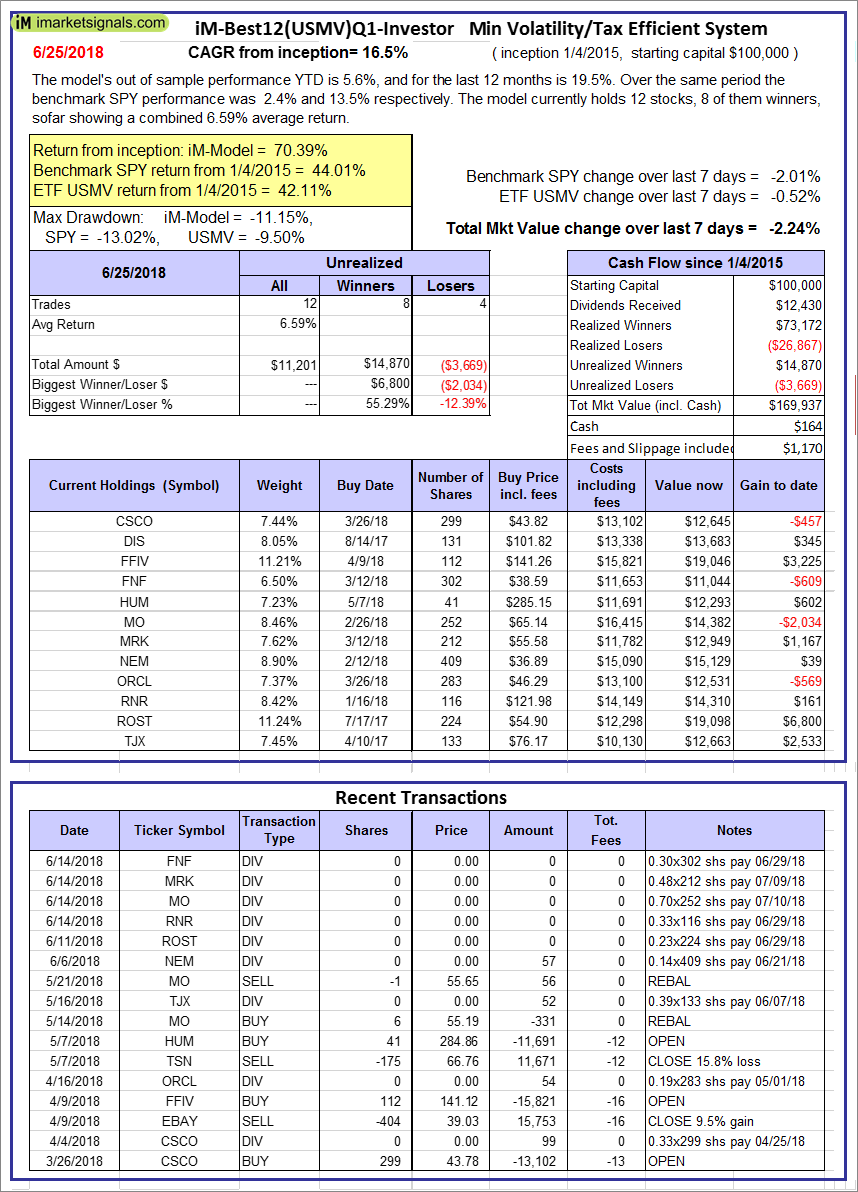 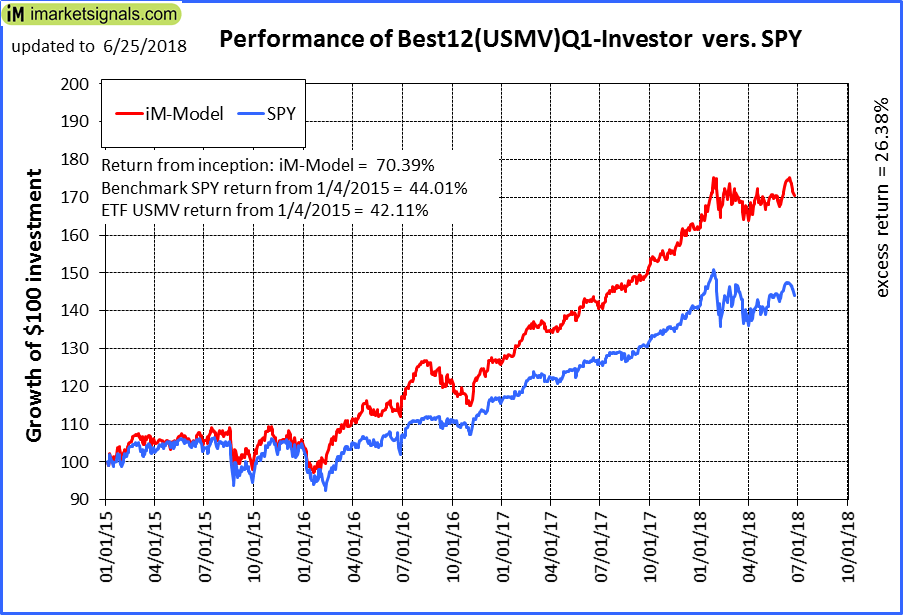 |
iM-Best12(USMV)Q1-Investor: The model’s out of sample performance YTD is 5.6%, and for the last 12 months is 19.5%. Over the same period the benchmark SPY performance was 2.4% and 13.5% respectively. Since inception, on 1/5/2015, the model gained 70.39% while the benchmark SPY gained 44.01% and the ETF USMV gained 42.11% over the same period. Over the previous week the market value of iM-Best12(USMV)Q1 gained -2.24% at a time when SPY gained -2.01%. A starting capital of $100,000 at inception on 1/5/2015 would have grown to $169,937 which includes $164 cash and excludes $1,170 spent on fees and slippage. |
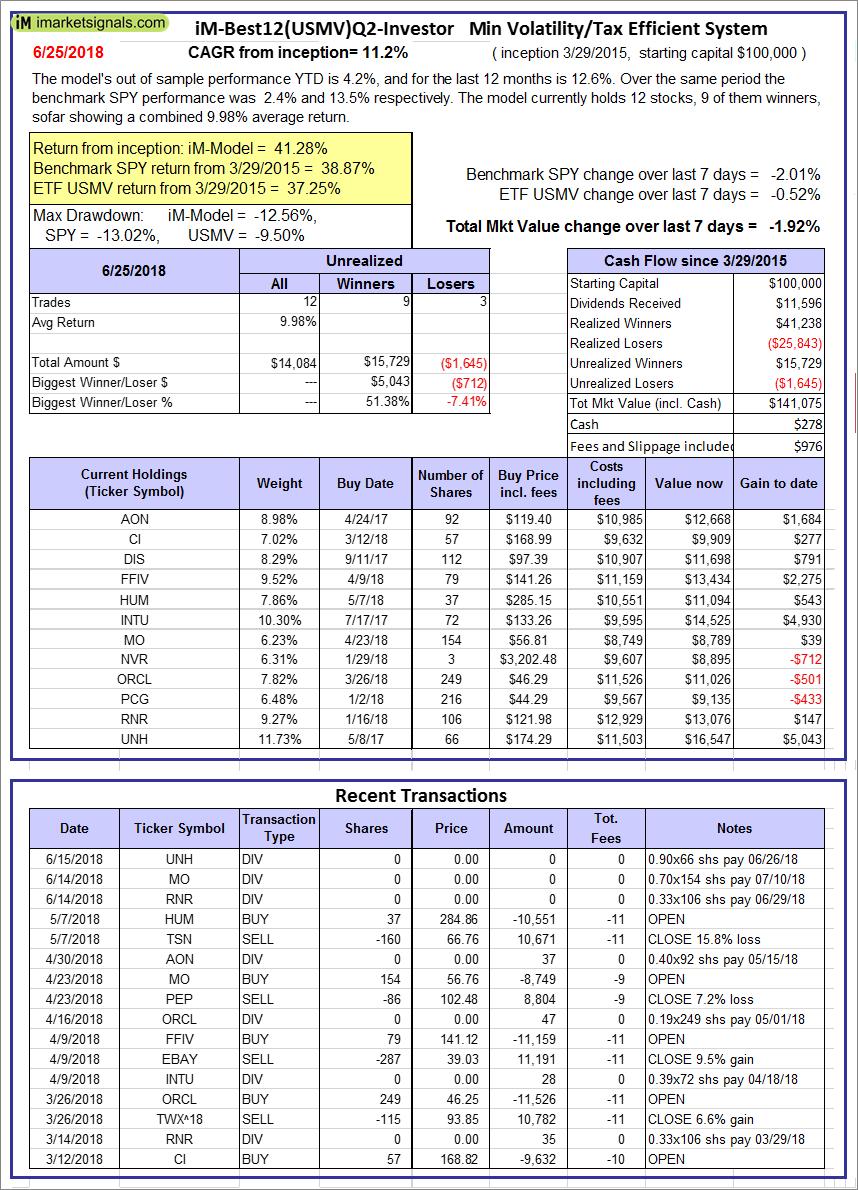 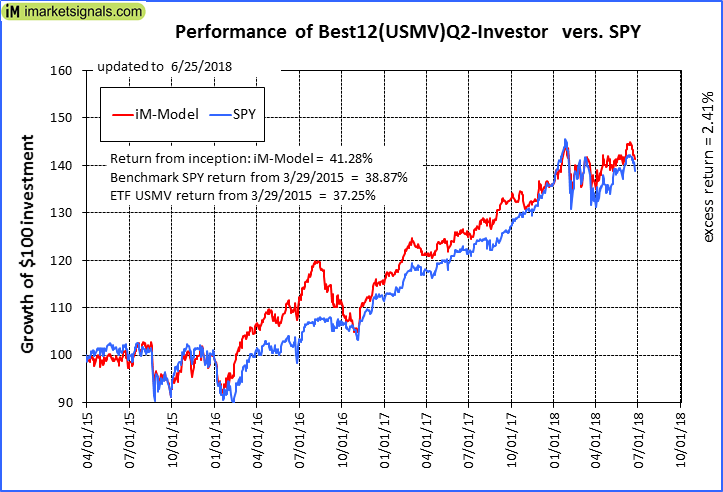 |
iM-Best12(USMV)Q2-Investor: The model’s out of sample performance YTD is 4.2%, and for the last 12 months is 12.6%. Over the same period the benchmark SPY performance was 2.4% and 13.5% respectively. Since inception, on 3/30/2015, the model gained 41.28% while the benchmark SPY gained 38.87% and the ETF USMV gained 37.25% over the same period. Over the previous week the market value of iM-Best12(USMV)Q2 gained -1.92% at a time when SPY gained -2.01%. A starting capital of $100,000 at inception on 3/30/2015 would have grown to $141,075 which includes $278 cash and excludes $976 spent on fees and slippage. |
 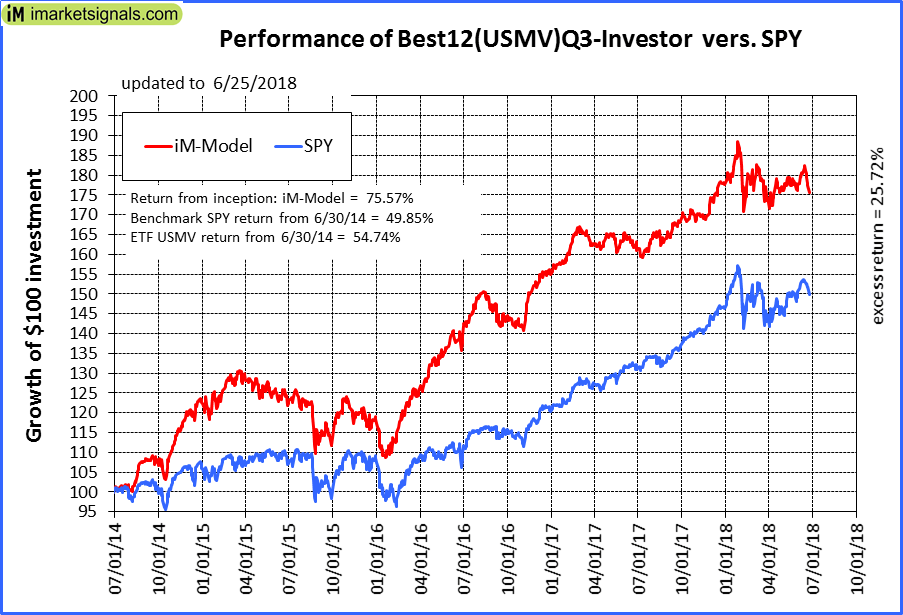 |
iM-Best12(USMV)Q3-Investor: The model’s out of sample performance YTD is -1.2%, and for the last 12 months is 8.3%. Over the same period the benchmark SPY performance was 2.4% and 13.5% respectively. Since inception, on 7/1/2014, the model gained 75.57% while the benchmark SPY gained 49.85% and the ETF USMV gained 54.74% over the same period. Over the previous week the market value of iM-Best12(USMV)Q3 gained -3.09% at a time when SPY gained -2.01%. A starting capital of $100,000 at inception on 7/1/2014 would have grown to $175,239 which includes $139 cash and excludes $1,514 spent on fees and slippage. |
  |
iM-Best12(USMV)Q4-Investor: Since inception, on 9/29/2014, the model gained 84.18% while the benchmark SPY gained 47.59% and the ETF USMV gained 52.60% over the same period. Over the previous week the market value of iM-Best12(USMV)Q4 gained -1.20% at a time when SPY gained -2.01%. A starting capital of $100,000 at inception on 9/29/2014 would have grown to $184,015 which includes $284 cash and excludes $1,306 spent on fees and slippage. |
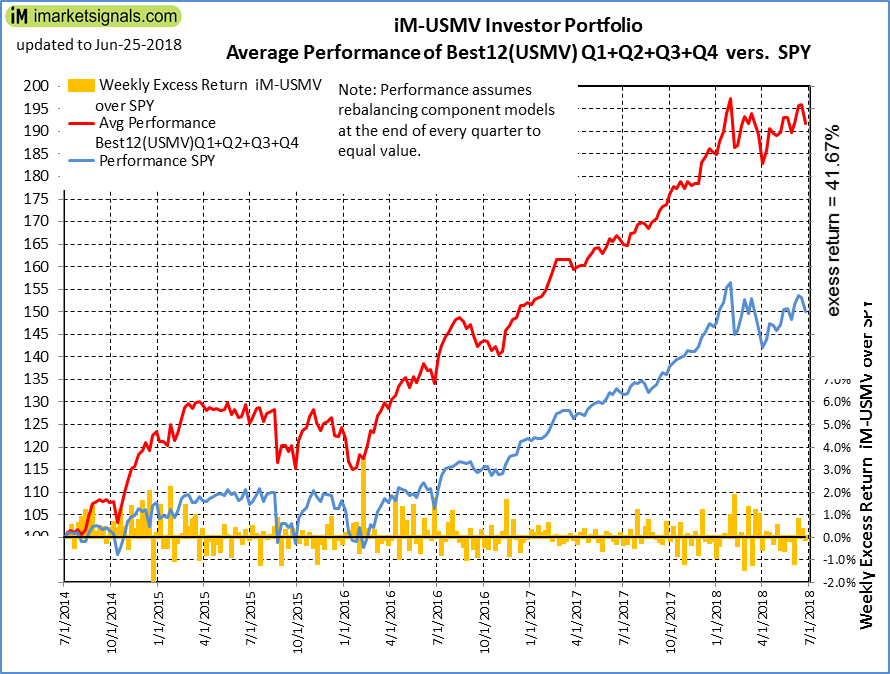 |
Average Performance of iM-Best12(USMV)Q1+Q2+Q3+Q4-Investor resulted in an excess return of 41.67% over SPY. (see iM-USMV Investor Portfolio) |
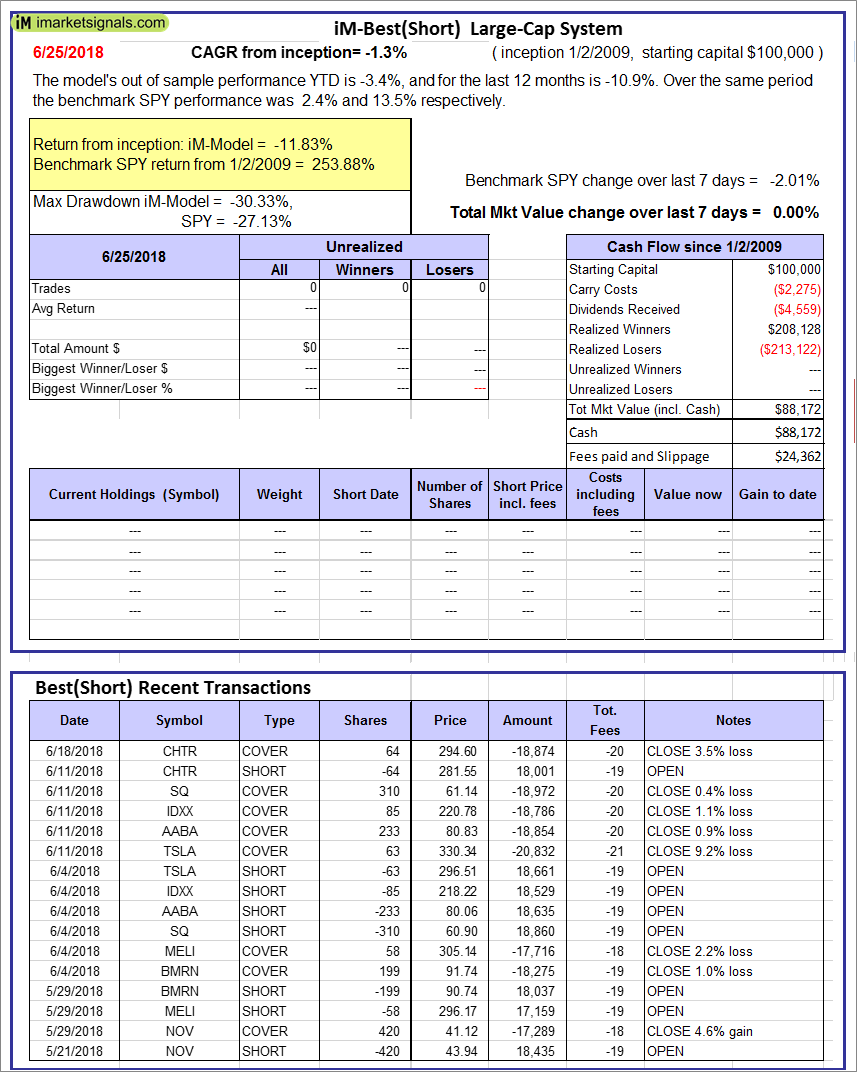 |
iM-Best(Short): The model’s out of sample performance YTD is -3.4%, and for the last 12 months is -10.9%. Over the same period the benchmark SPY performance was 2.4% and 13.5% respectively. Over the previous week the market value of iM-Best(Short) gained 0.00% at a time when SPY gained -2.01%. Over the period 1/2/2009 to 6/25/2018 the starting capital of $100,000 would have grown to $88,172 which includes $88,172 cash and excludes $24,362 spent on fees and slippage. |
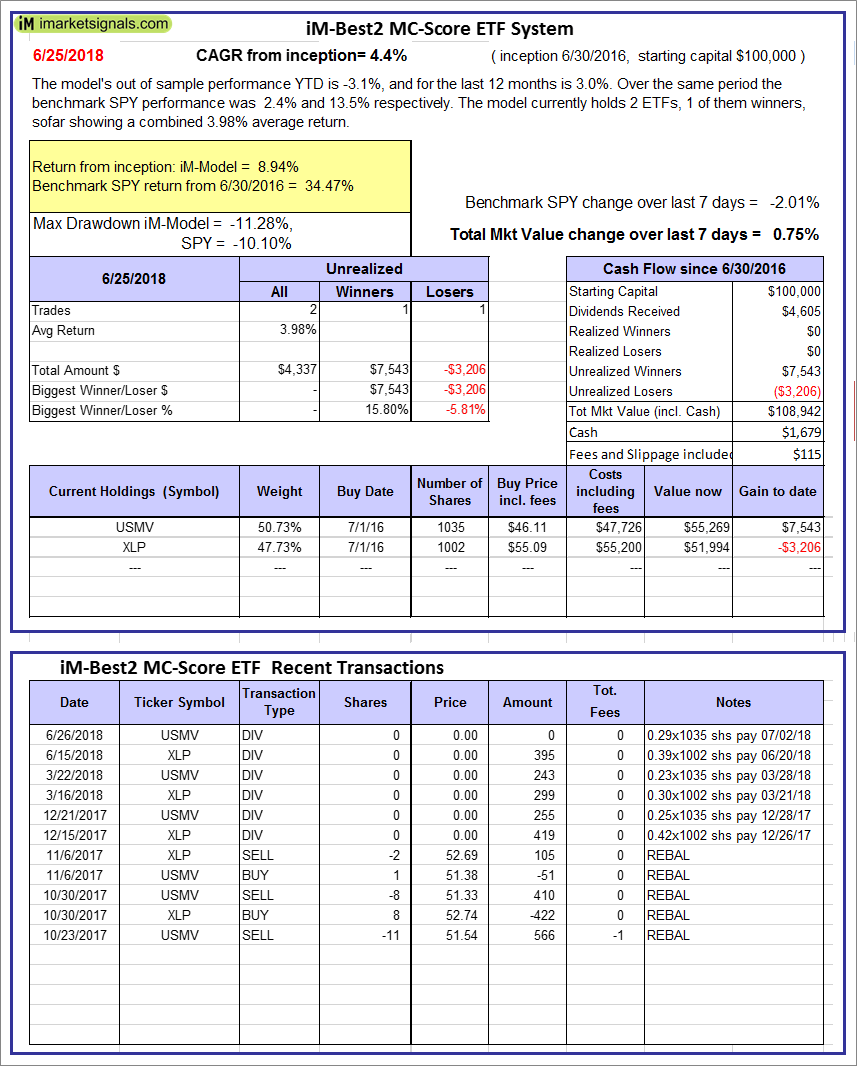 |
iM-Best2 MC-Score ETF System: The model’s out of sample performance YTD is -3.1%, and for the last 12 months is 3.0%. Over the same period the benchmark SPY performance was 2.4% and 13.5% respectively. Over the previous week the market value of the iM-Best2 MC-Score ETF System gained 0.75% at a time when SPY gained -2.01%. A starting capital of $100,000 at inception on 6/30/2016 would have grown to $108,942 which includes $1,679 cash and excludes $115 spent on fees and slippage. |
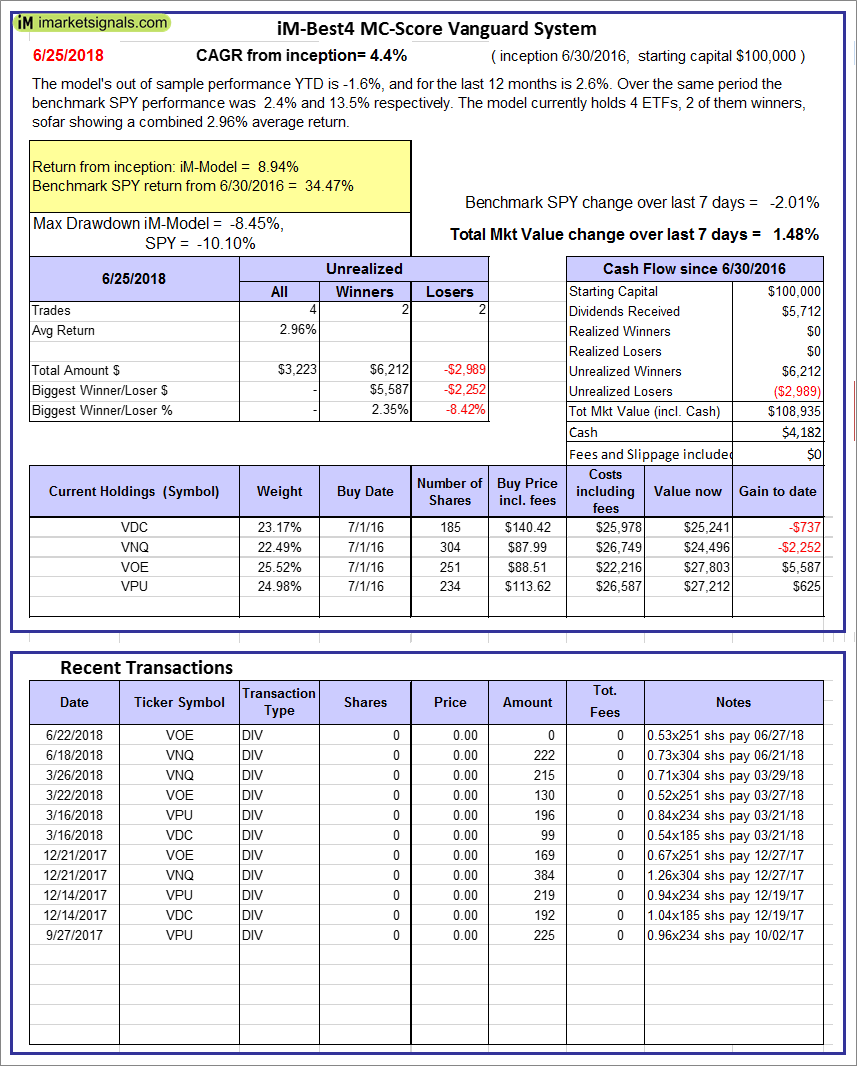 |
iM-Best4 MC-Score Vanguard System: The model’s out of sample performance YTD is -1.6%, and for the last 12 months is 2.6%. Over the same period the benchmark SPY performance was 2.4% and 13.5% respectively. Over the previous week the market value of the iM-Best4 MC-Score Vanguard System gained 1.48% at a time when SPY gained -2.01%. A starting capital of $100,000 at inception on 6/30/2016 would have grown to $108,935 which includes $4,182 cash and excludes $00 spent on fees and slippage. |
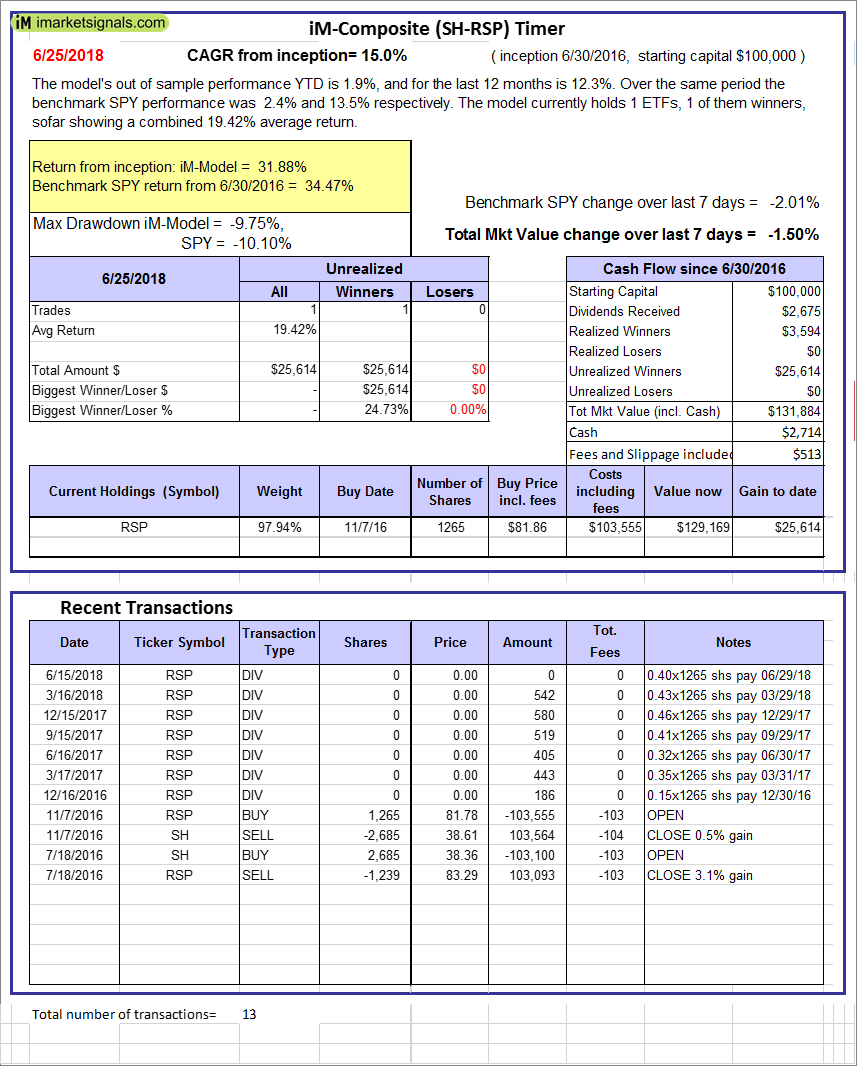 |
iM-Composite (SH-RSP) Timer: The model’s out of sample performance YTD is 1.9%, and for the last 12 months is 12.3%. Over the same period the benchmark SPY performance was 2.4% and 13.5% respectively. Over the previous week the market value of the iM-Composite (SH-RSP) Timer gained -1.50% at a time when SPY gained -2.01%. A starting capital of $100,000 at inception on 6/30/2016 would have grown to $131,884 which includes $2,714 cash and excludes $513 spent on fees and slippage. |
 |
iM-Composite (SPY-IEF) Timer: The model’s out of sample performance YTD is 2.4%, and for the last 12 months is 14.0%. Over the same period the benchmark SPY performance was 2.4% and 13.5% respectively. Over the previous week the market value of the iM-Composite (SPY-IEF) Timer gained -1.97% at a time when SPY gained -2.01%. A starting capital of $100,000 at inception on 6/30/2016 would have grown to $135,916 which includes $2,042 cash and excludes $1,390 spent on fees and slippage. |
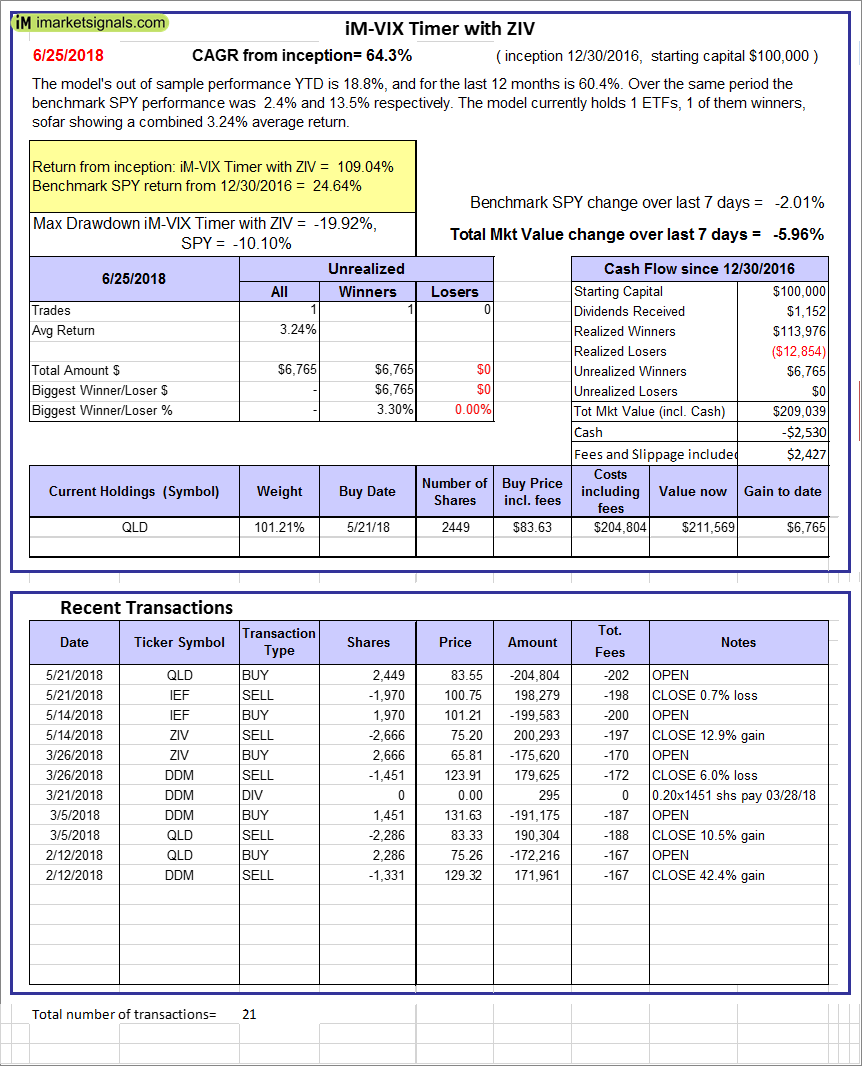 |
iM-VIX Timer with ZIV: The model’s out of sample performance YTD is 18.8%, and for the last 12 months is 60.4%. Over the same period the benchmark SPY performance was 2.4% and 13.5% respectively. Over the previous week the market value of the iM-VIX Timer with ZIV gained -5.96% at a time when SPY gained -2.01%. A starting capital of $100,000 at inception on 6/30/2016 would have grown to $209,039 which includes -$2,530 cash and excludes $2,427 spent on fees and slippage. |
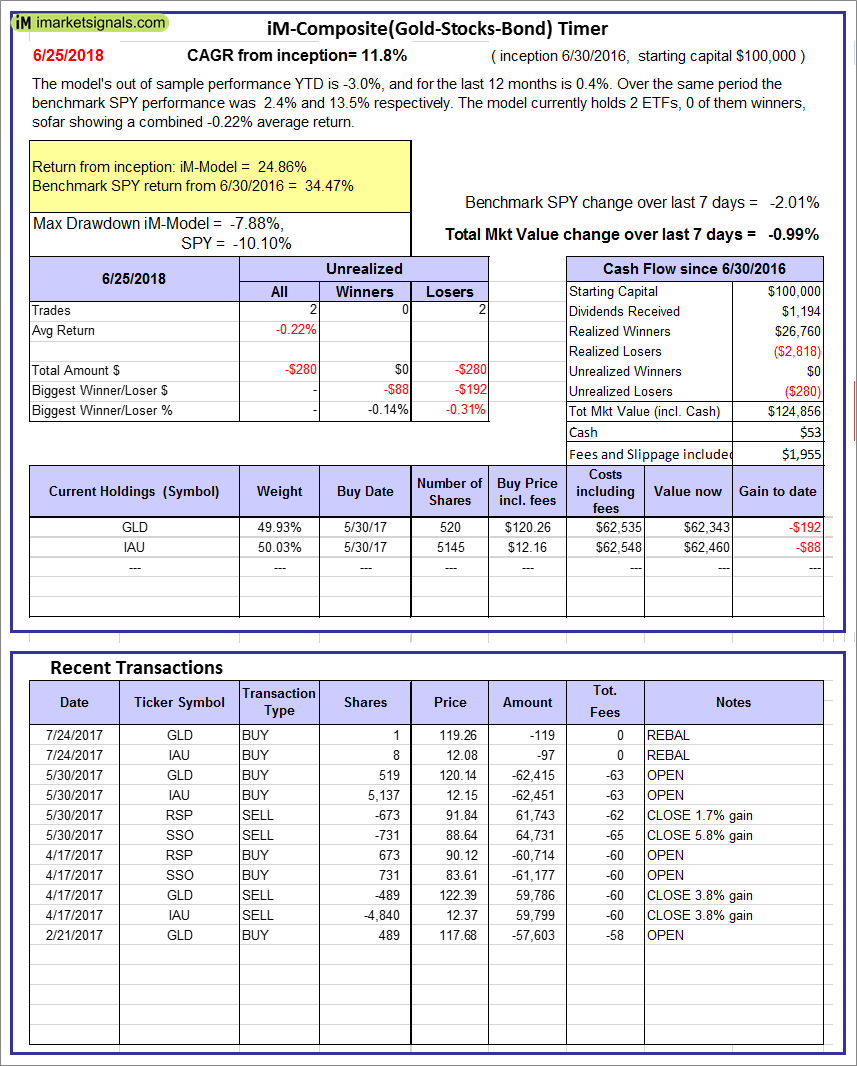 |
iM-Composite(Gold-Stocks-Bond) Timer: The model’s out of sample performance YTD is -3.0%, and for the last 12 months is 0.4%. Over the same period the benchmark SPY performance was 2.4% and 13.5% respectively. Over the previous week the market value of the iM-Composite(Gold-Stocks-Bond) Timer gained -0.99% at a time when SPY gained -2.01%. A starting capital of $100,000 at inception on 6/30/2016 would have grown to $124,856 which includes $53 cash and excludes $1,955 spent on fees and slippage. |
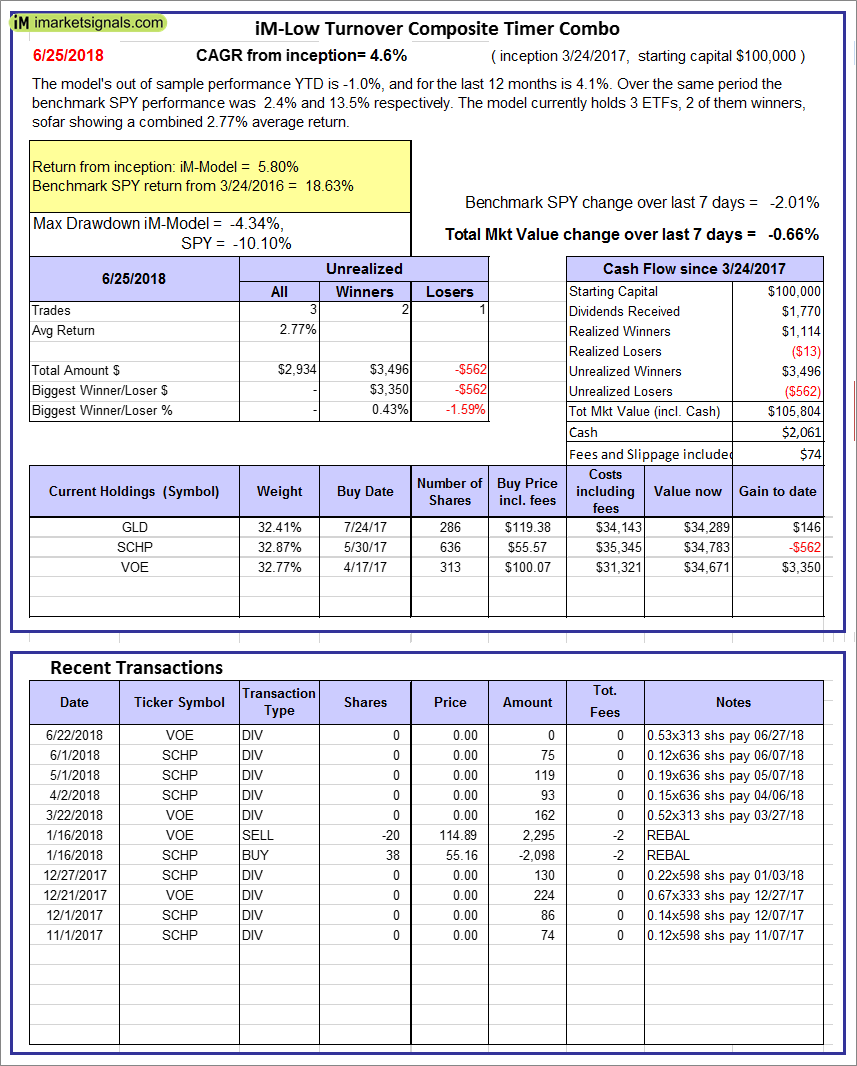 |
iM-Low Turnover Composite Timer Combo: The model’s out of sample performance YTD is -1.0%, and for the last 12 months is 4.1%. Over the same period the benchmark SPY performance was 2.4% and 13.5% respectively. Over the previous week the market value of the iM-Low Turnover Composite Timer Combo gained -0.66% at a time when SPY gained -2.01%. A starting capital of $100,000 at inception on 3/24/27 would have grown to $105,804 which includes $2,061 cash and excludes $74 spent on fees and slippage. |
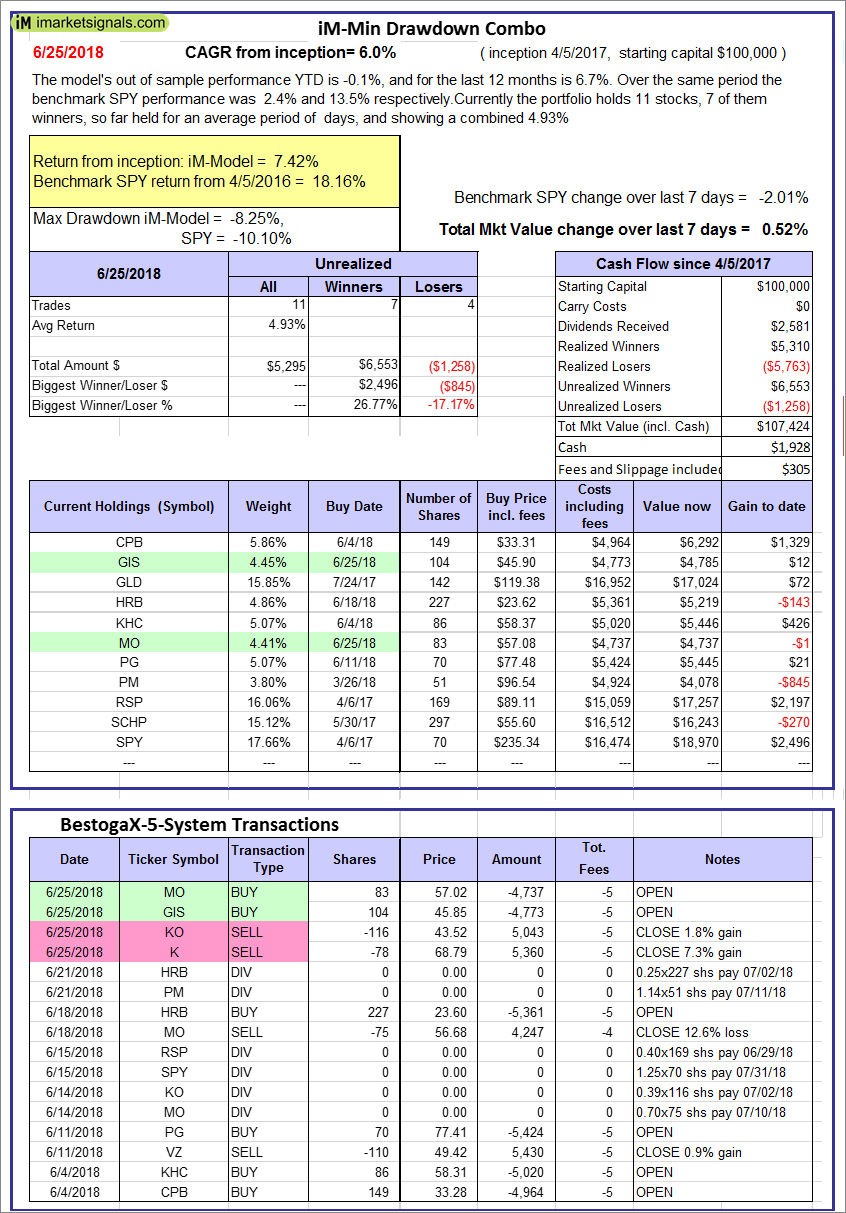 |
iM-Min Drawdown Combo: The model’s out of sample performance YTD is -0.1%, and for the last 12 months is 6.7%. Over the same period the benchmark SPY performance was 2.4% and 13.5% respectively. Over the previous week the market value of the iM-Min Drawdown Combo gained 0.52% at a time when SPY gained -2.01%. A starting capital of $100,000 at inception on 4/5/2017 would have grown to $107,424 which includes $1,928 cash and excludes $305 spent on fees and slippage. |
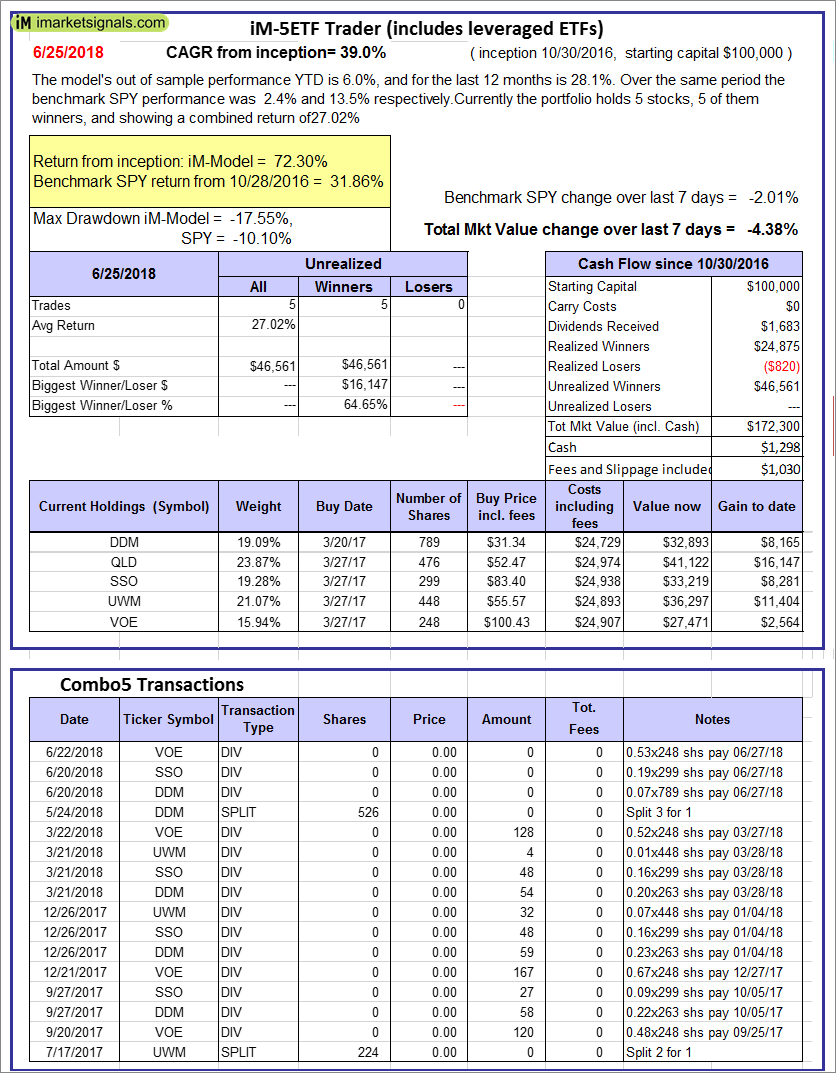 |
iM-5ETF Trader (includes leveraged ETFs): The model’s out of sample performance YTD is 6.0%, and for the last 12 months is 28.1%. Over the same period the benchmark SPY performance was 2.4% and 13.5% respectively. Over the previous week the market value of the iM-5ETF Trader (includes leveraged ETFs) gained -4.38% at a time when SPY gained -2.01%. A starting capital of $100,000 at inception on 10/30/2016 would have grown to $172,300 which includes $1,298 cash and excludes $1,030 spent on fees and slippage. |
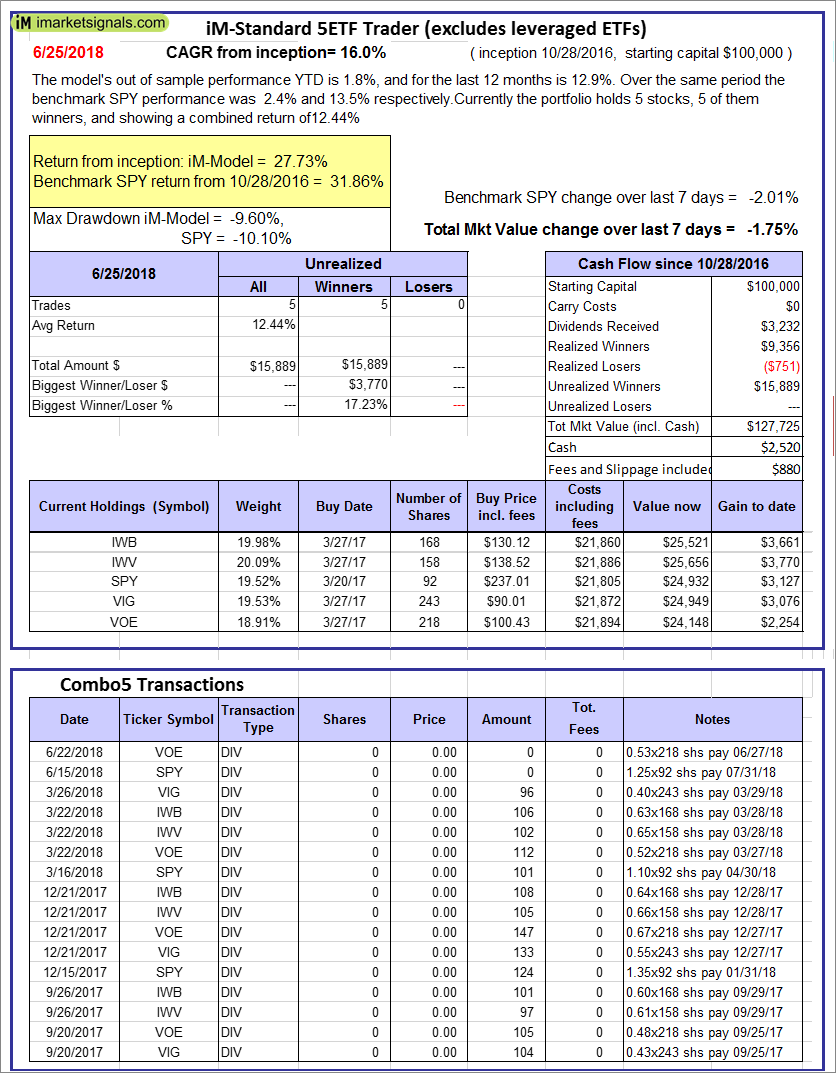 |
iM-Standard 5ETF Trader (excludes leveraged ETFs): The model’s out of sample performance YTD is 1.8%, and for the last 12 months is 12.9%. Over the same period the benchmark SPY performance was 2.4% and 13.5% respectively. Over the previous week the market value of the iM-Standard 5ETF Trader (excludes leveraged ETFs) gained -1.75% at a time when SPY gained -2.01%. A starting capital of $100,000 at inception on 10/30/2016 would have grown to $127,725 which includes $2,520 cash and excludes $880 spent on fees and slippage. |
iM-Best Reports – 6/25/2018
Posted in pmp SPY-SH
Leave a Reply
You must be logged in to post a comment.