
  |
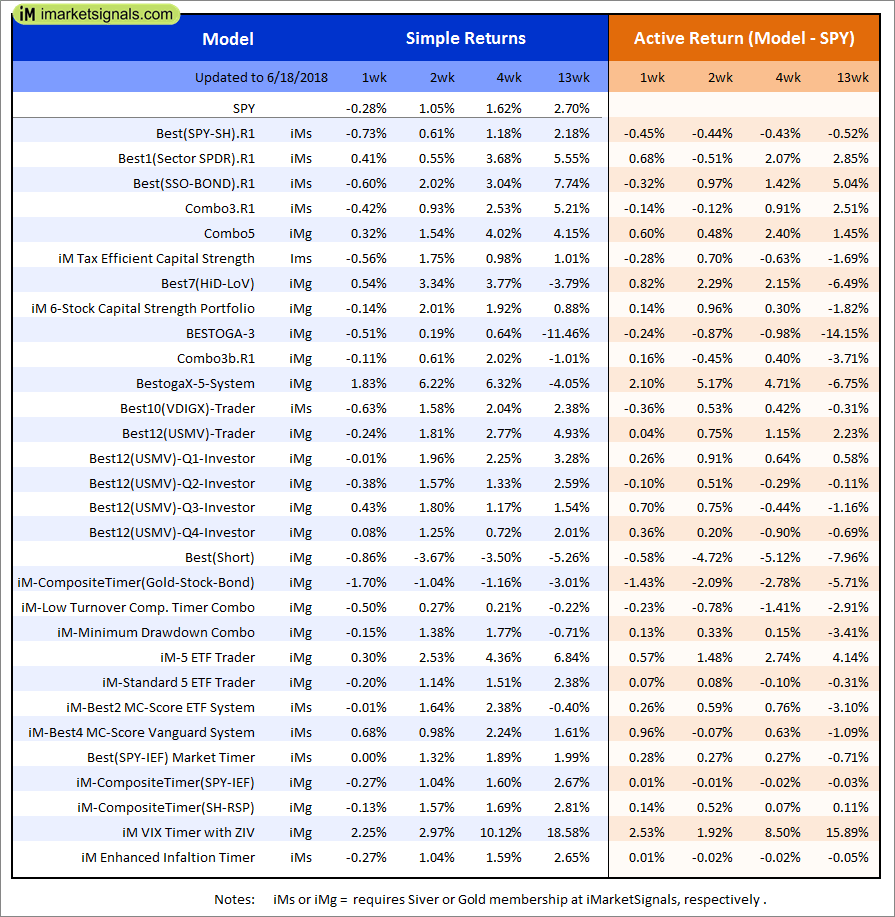
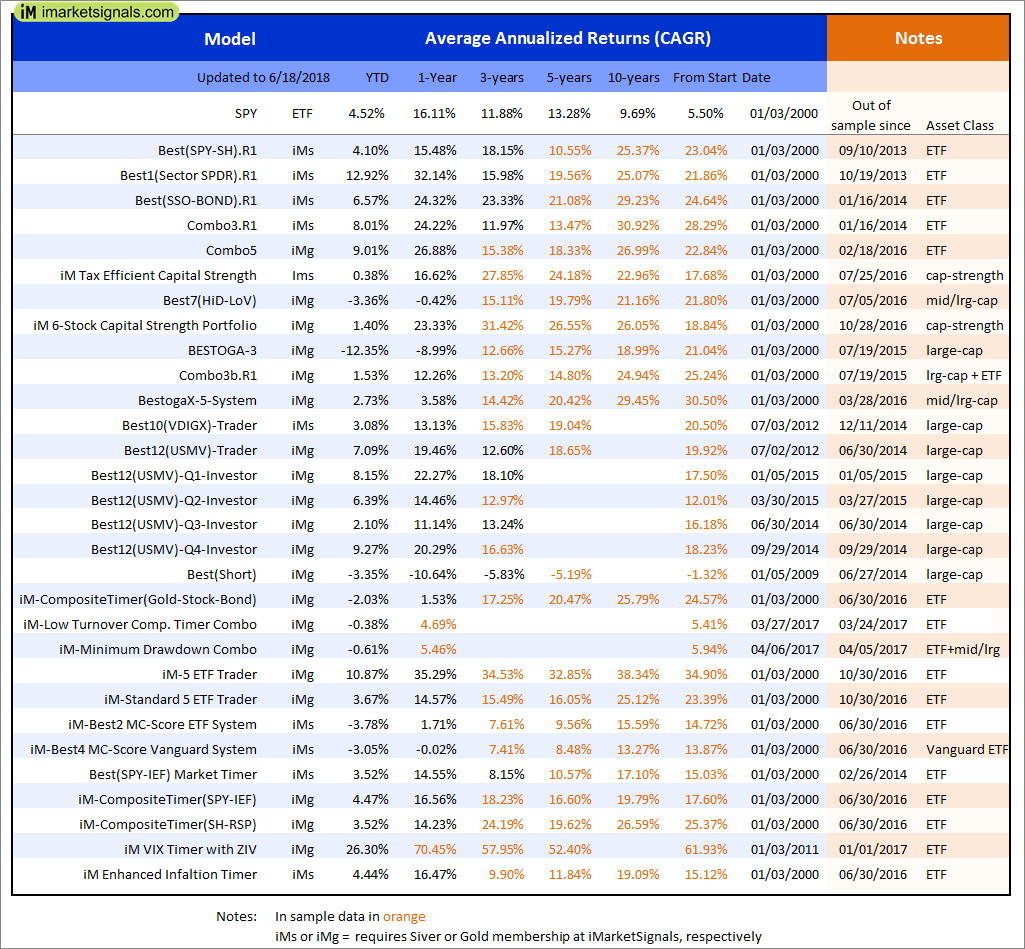
Out of sample performance summary of our models for the past 1, 2, 4 and 13 week periods. The active active return indicates how the models over- or underperformed the benchmark ETF SPY. Also the YTD, and the 1-, 3-, 5- and 10-year annualized returns are shown in the second table |
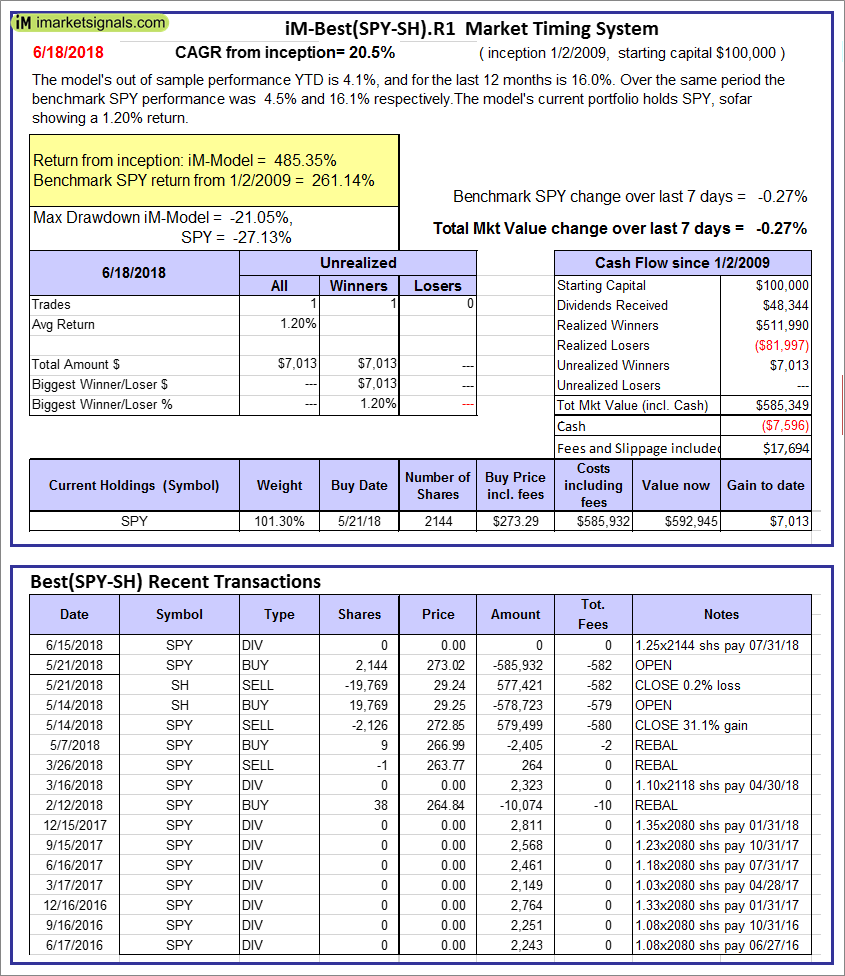 |
iM-Best(SPY-SH).R1: The model’s out of sample performance YTD is 4.1%, and for the last 12 months is 16.0%. Over the same period the benchmark SPY performance was 4.5% and 16.1% respectively. Over the previous week the market value of Best(SPY-SH) gained -0.27% at a time when SPY gained -0.27%. A starting capital of $100,000 at inception on 1/2/2009 would have grown to $585,349 which includes -$7,596 cash and excludes $17,694 spent on fees and slippage. |
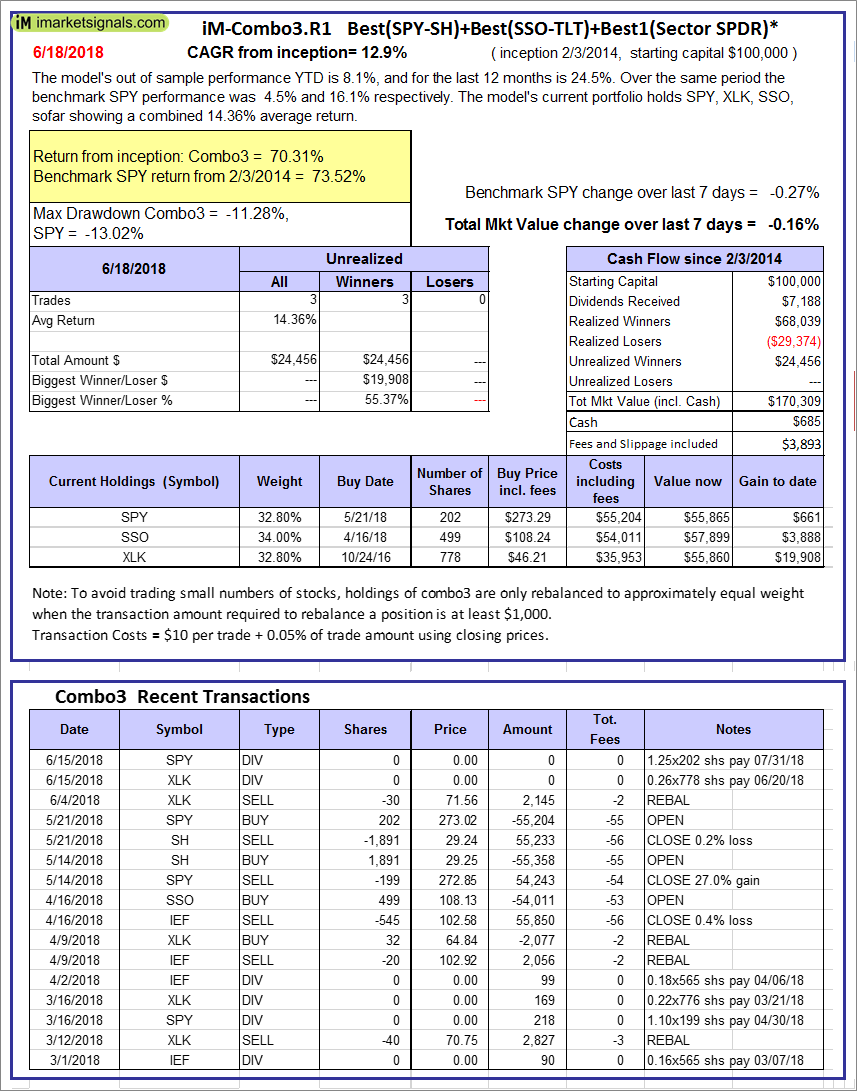 |
iM-Combo3.R1: The model’s out of sample performance YTD is 8.1%, and for the last 12 months is 24.5%. Over the same period the benchmark SPY performance was 4.5% and 16.1% respectively. Over the previous week the market value of iM-Combo3.R1 gained -0.16% at a time when SPY gained -0.27%. A starting capital of $100,000 at inception on 2/3/2014 would have grown to $170,309 which includes $685 cash and excludes $3,893 spent on fees and slippage. |
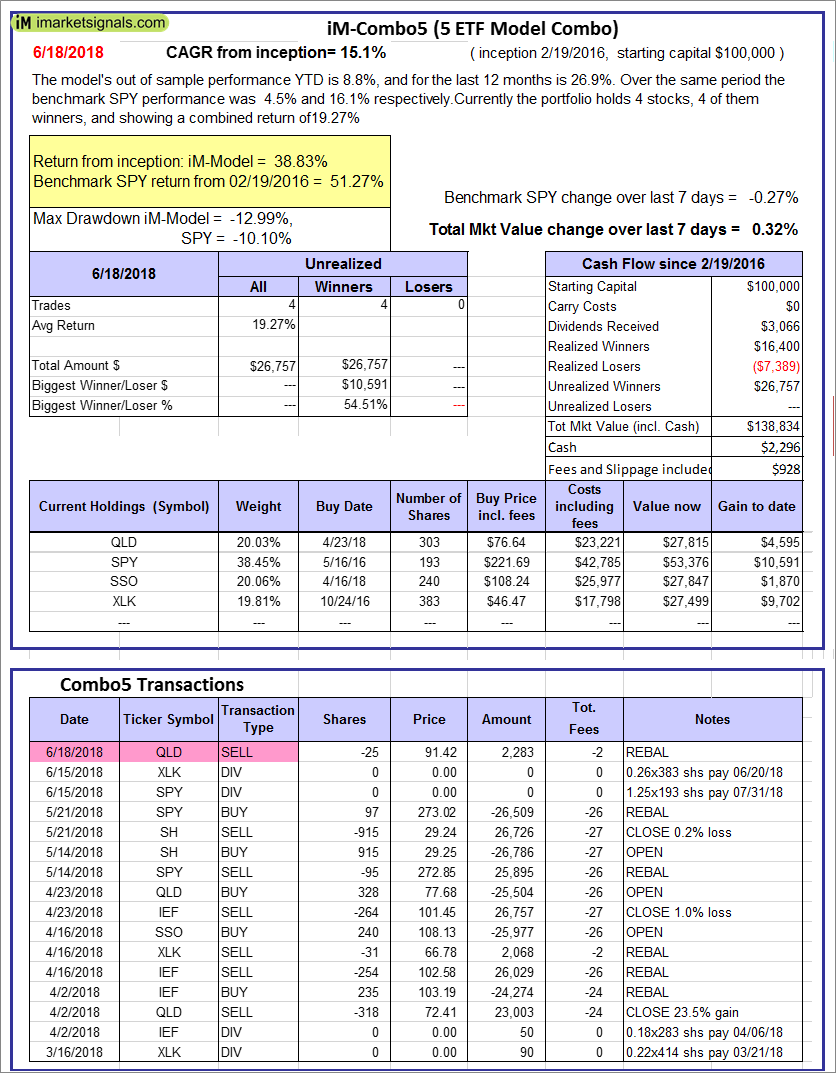 |
iM-Combo5: The model’s out of sample performance YTD is 8.8%, and for the last 12 months is 26.9%. Over the same period the benchmark SPY performance was 4.5% and 16.1% respectively. Over the previous week the market value of iM-Combo5 gained 0.32% at a time when SPY gained -0.27%. A starting capital of $100,000 at inception on 2/22/2016 would have grown to $138,834 which includes $2,296 cash and excludes $928 spent on fees and slippage. |
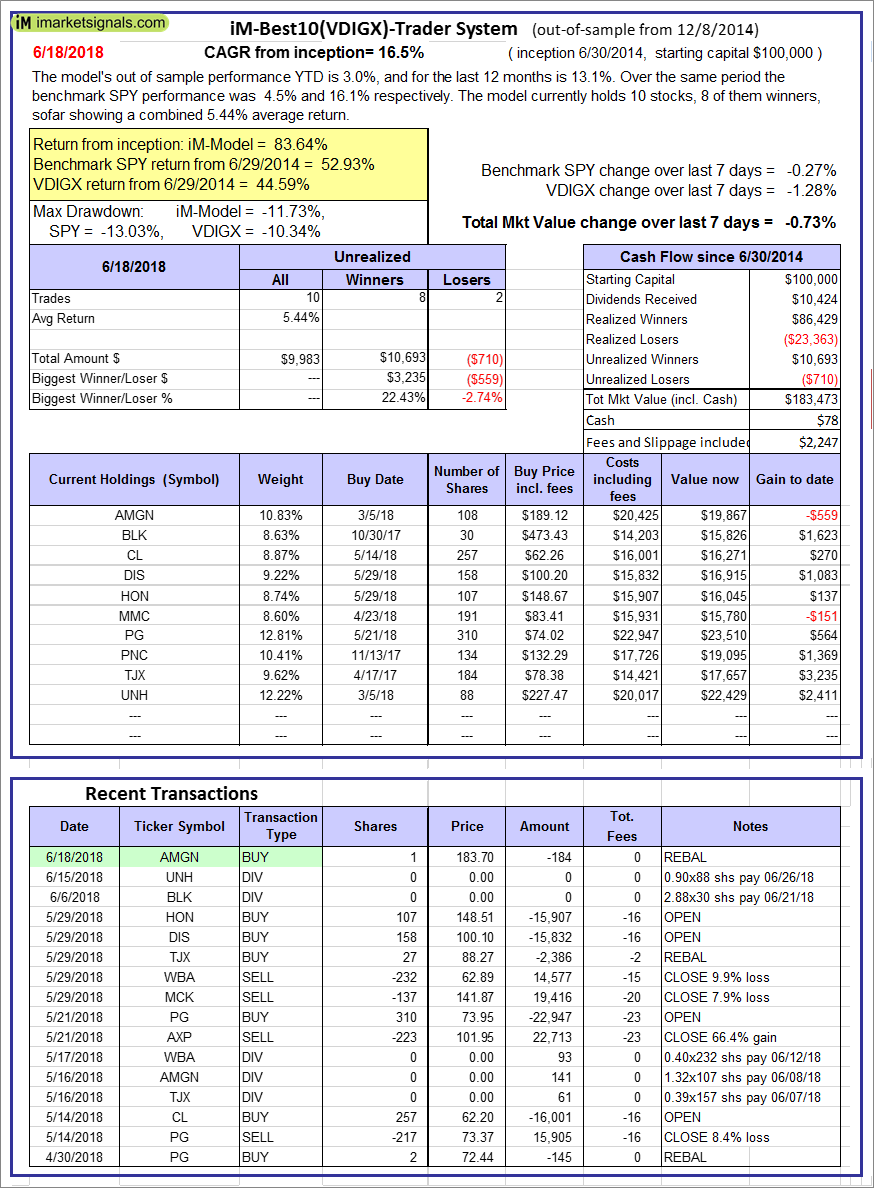 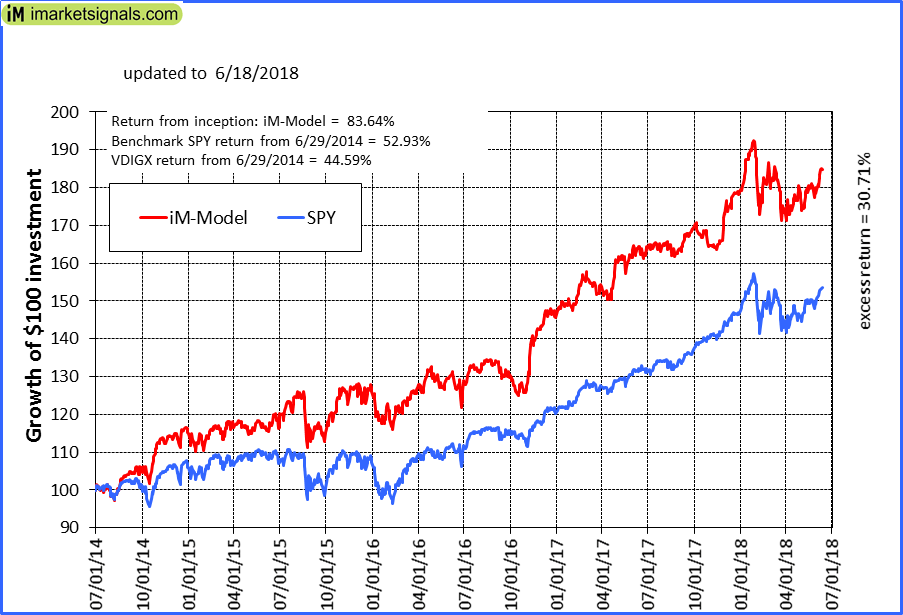 |
iM-Best10(VDIGX)-Trader: The model’s out of sample performance YTD is 3.0%, and for the last 12 months is 13.1%. Over the same period the benchmark SPY performance was 4.5% and 16.1% respectively. Since inception, on 7/1/2014, the model gained 83.64% while the benchmark SPY gained 52.93% and VDIGX gained 44.59% over the same period. Over the previous week the market value of iM-Best10(VDIGX) gained -0.73% at a time when SPY gained -0.27%. A starting capital of $100,000 at inception on 7/1/2014 would have grown to $183,473 which includes $78 cash and excludes $2,247 spent on fees and slippage. |
 |
iM-BESTOGA-3: The model’s out of sample performance YTD is -12.7%, and for the last 12 months is -9.0%. Over the same period the benchmark SPY performance was 4.5% and 16.1% respectively. Over the previous week the market value of iM-BESTOGA-3 gained -0.62% at a time when SPY gained -0.27%. A starting capital of $100,000 at inception on 2/3/2014 would have grown to $201,726 which includes $649 cash and excludes $2,787 spent on fees and slippage. |
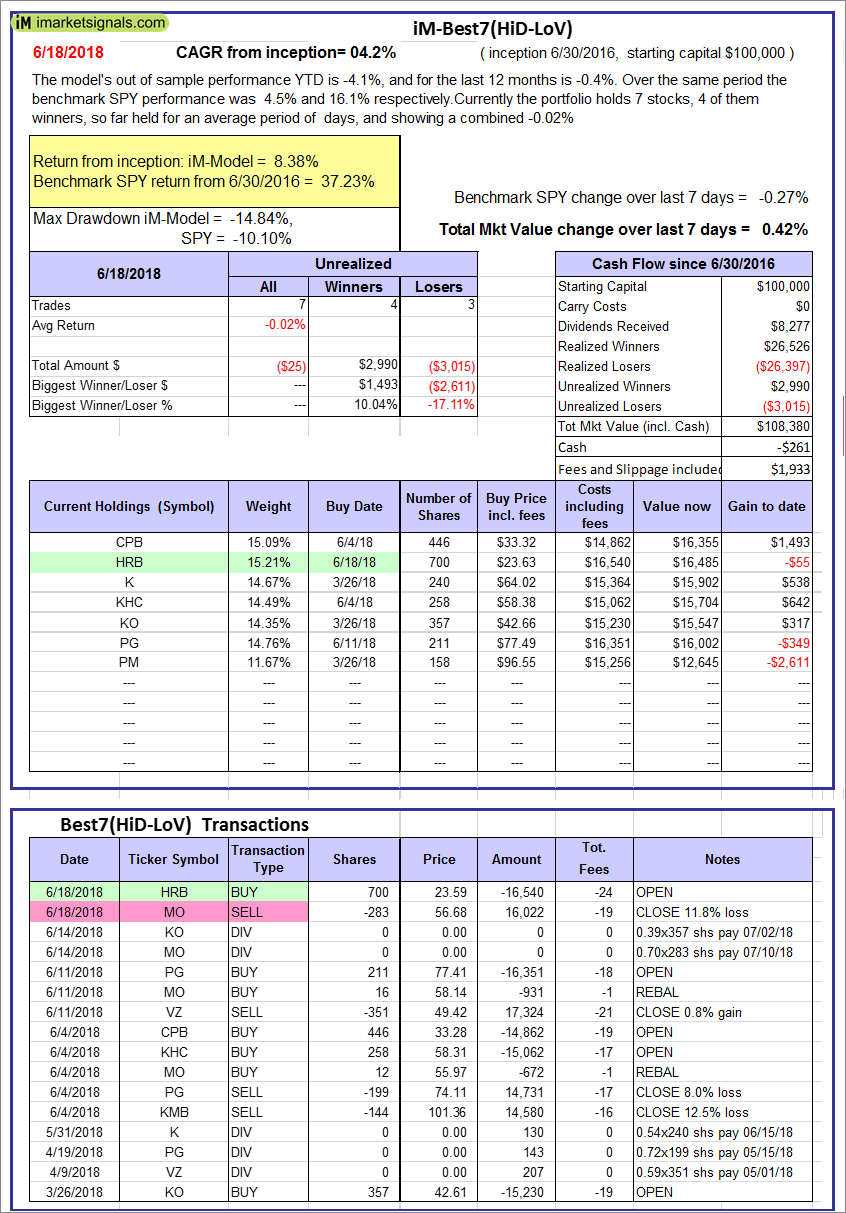 |
iM-Best7(HiD-LoV): The model’s out of sample performance YTD is -4.1%, and for the last 12 months is -0.4%. Over the same period the benchmark SPY performance was 4.5% and 16.1% respectively. Over the previous week the market value of iM-BESTOGA-3 gained 0.42% at a time when SPY gained -0.27%. A starting capital of $100,000 at inception on 6/30/2016 would have grown to $108,380 which includes -$261 cash and excludes $1,933 spent on fees and slippage. |
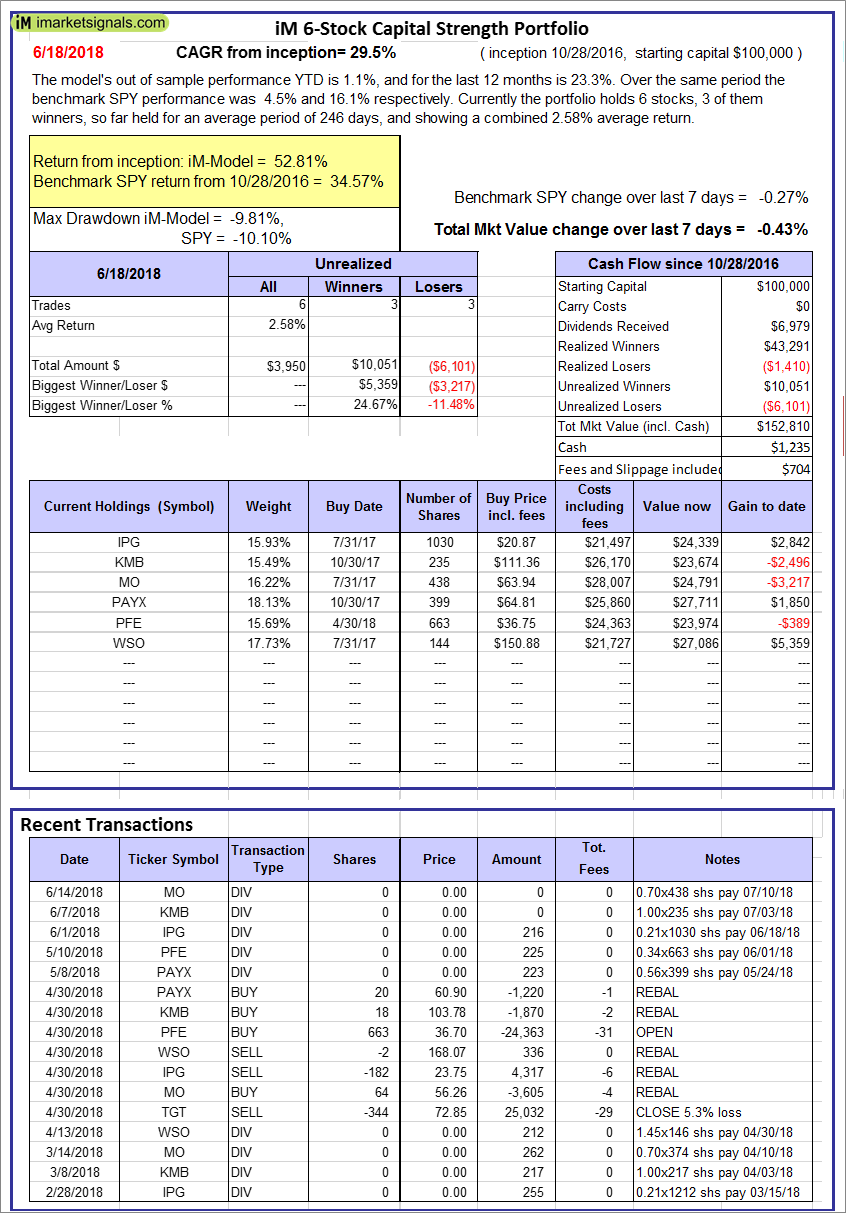 |
iM 6-Stock Capital Strength Portfolio: The model’s out of sample performance YTD is 1.1%, and for the last 12 months is 23.3%. Over the same period the benchmark SPY performance was 4.5% and 16.1% respectively. Over the previous week the market value of the iM 6-Stock Capital Strength Portfolio gained -0.43% at a time when SPY gained -0.27%. A starting capital of $100,000 at inception on 10/28/2016 would have grown to $152,810 which includes $1,235 cash and excludes $704 spent on fees and slippage. |
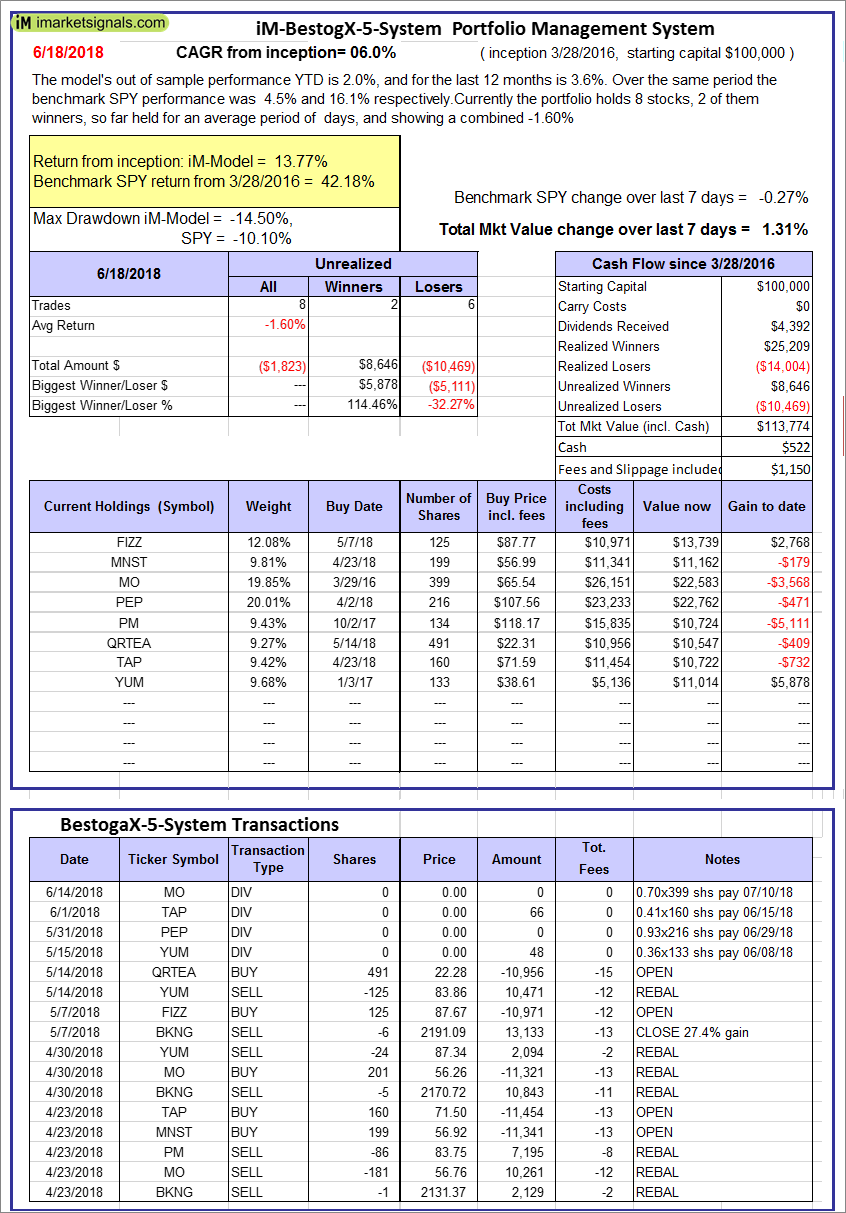 |
iM-BestogaX5-System: The model’s out of sample performance YTD is 2.0%, and for the last 12 months is 3.6%. Over the same period the benchmark SPY performance was 4.5% and 16.1% respectively. Over the previous week the market value of iM-BestogaX5-System gained 1.31% at a time when SPY gained -0.27%. A starting capital of $100,000 at inception on 3/28/2016 would have grown to $113,774 which includes $522 cash and excludes $1,150 spent on fees and slippage. |
 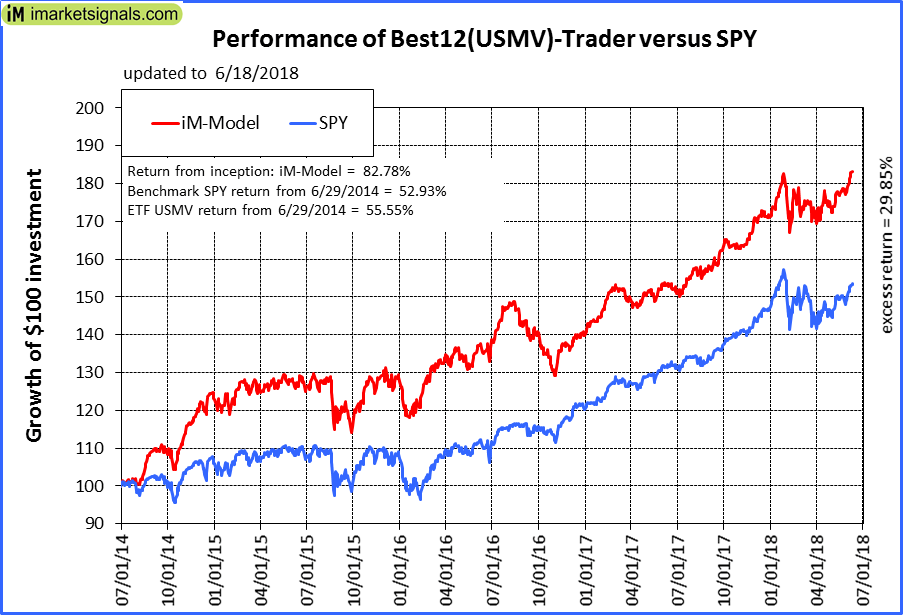 |
iM-Best12(USMV)-Trader: The model’s out of sample performance YTD is 6.9%, and for the last 12 months is 19.5%. Over the same period the benchmark SPY performance was 4.5% and 16.1% respectively. Since inception, on 6/30/2014, the model gained 82.78% while the benchmark SPY gained 52.93% and the ETF USMV gained 55.55% over the same period. Over the previous week the market value of iM-Best12(USMV)-Trader gained -0.27% at a time when SPY gained -0.27%. A starting capital of $100,000 at inception on 6/30/2014 would have grown to $182,514 which includes $190 cash and excludes $4,304 spent on fees and slippage. |
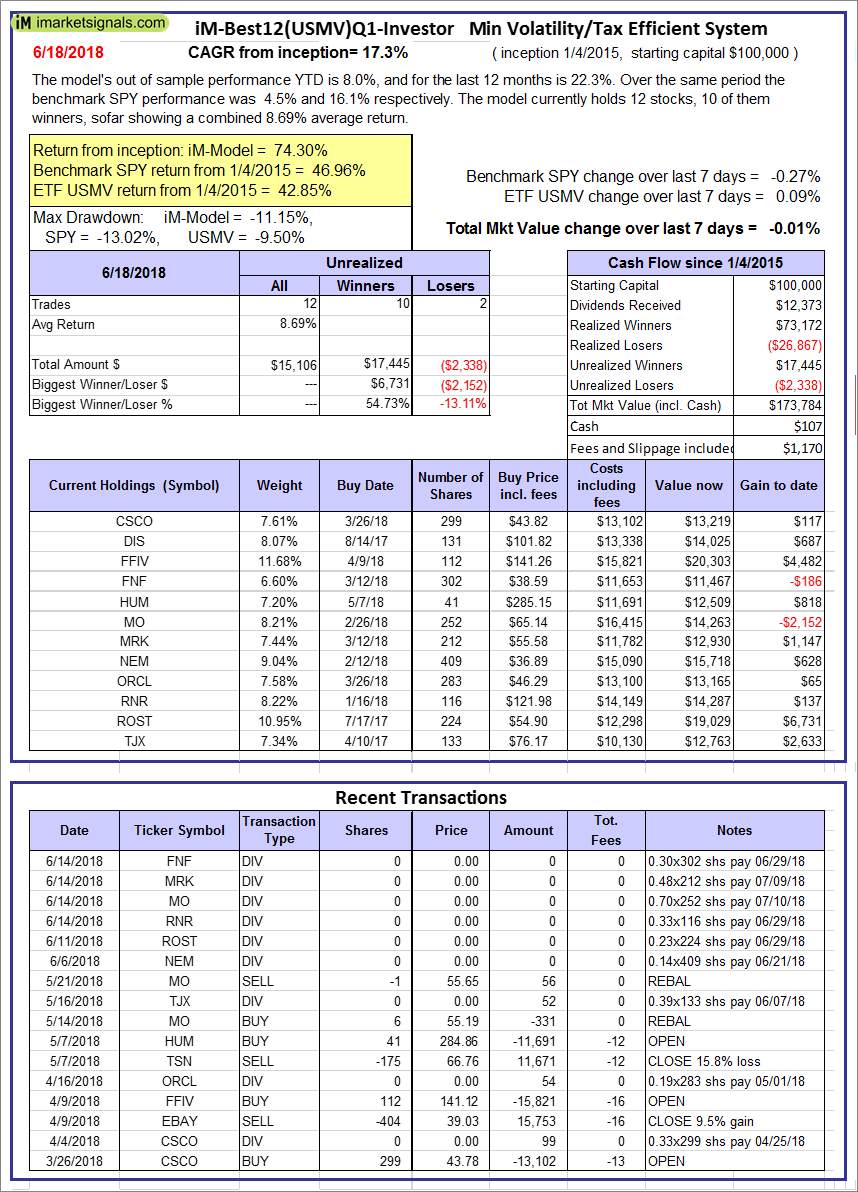 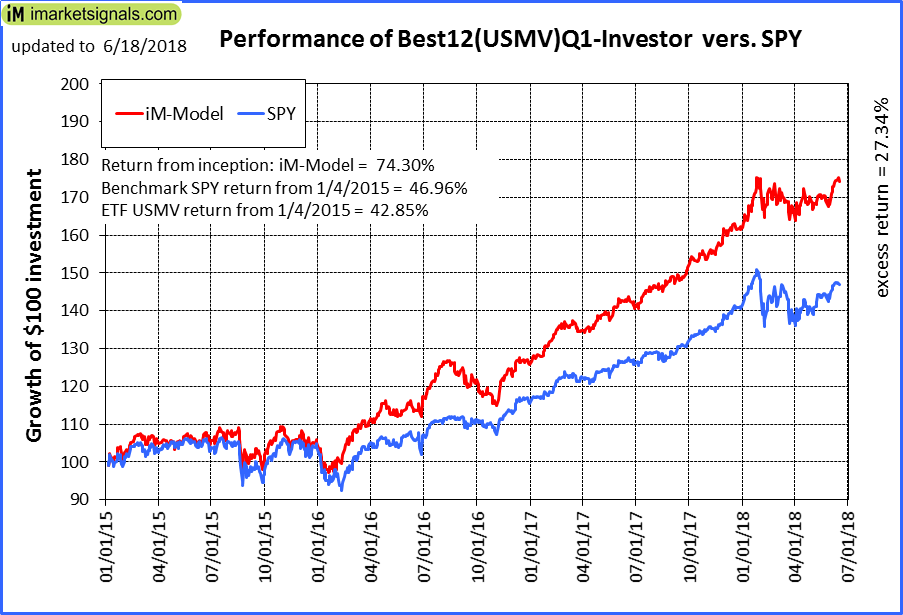 |
iM-Best12(USMV)Q1-Investor: The model’s out of sample performance YTD is 8.0%, and for the last 12 months is 22.3%. Over the same period the benchmark SPY performance was 4.5% and 16.1% respectively. Since inception, on 1/5/2015, the model gained 74.30% while the benchmark SPY gained 46.96% and the ETF USMV gained 42.85% over the same period. Over the previous week the market value of iM-Best12(USMV)Q1 gained -0.01% at a time when SPY gained -0.27%. A starting capital of $100,000 at inception on 1/5/2015 would have grown to $173,784 which includes $107 cash and excludes $1,170 spent on fees and slippage. |
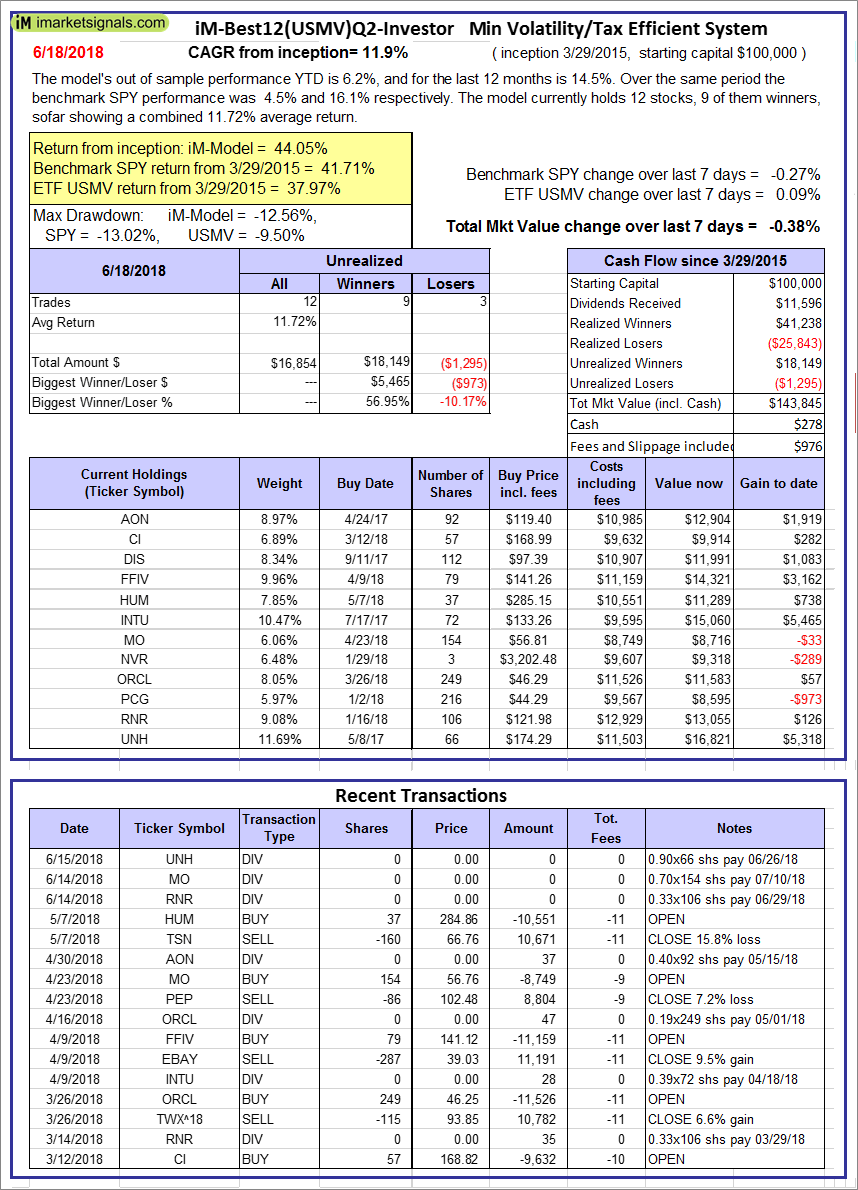 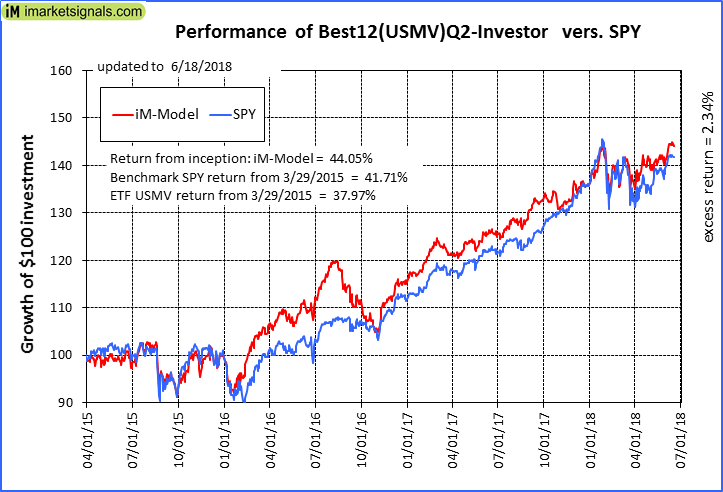 |
iM-Best12(USMV)Q2-Investor: The model’s out of sample performance YTD is 6.2%, and for the last 12 months is 14.5%. Over the same period the benchmark SPY performance was 4.5% and 16.1% respectively. Since inception, on 3/30/2015, the model gained 44.05% while the benchmark SPY gained 41.71% and the ETF USMV gained 37.97% over the same period. Over the previous week the market value of iM-Best12(USMV)Q2 gained -0.38% at a time when SPY gained -0.27%. A starting capital of $100,000 at inception on 3/30/2015 would have grown to $143,845 which includes $278 cash and excludes $976 spent on fees and slippage. |
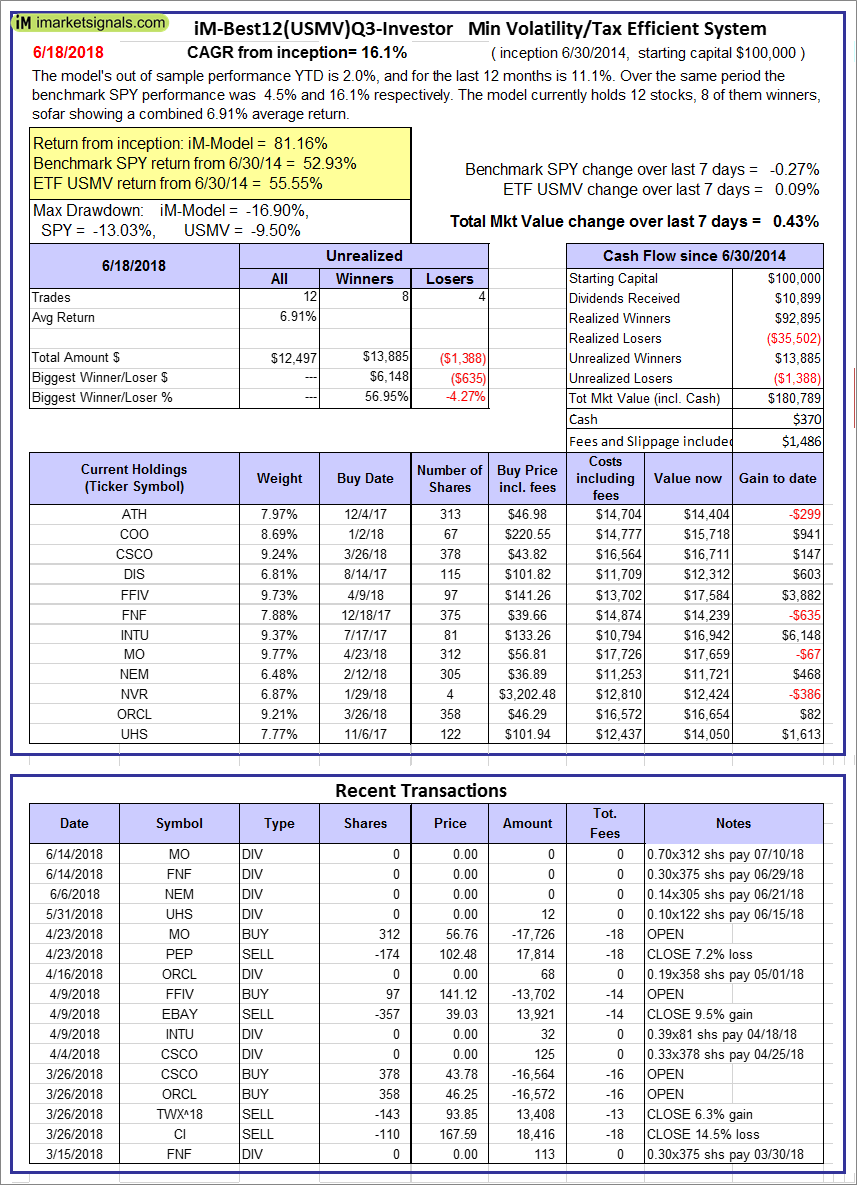 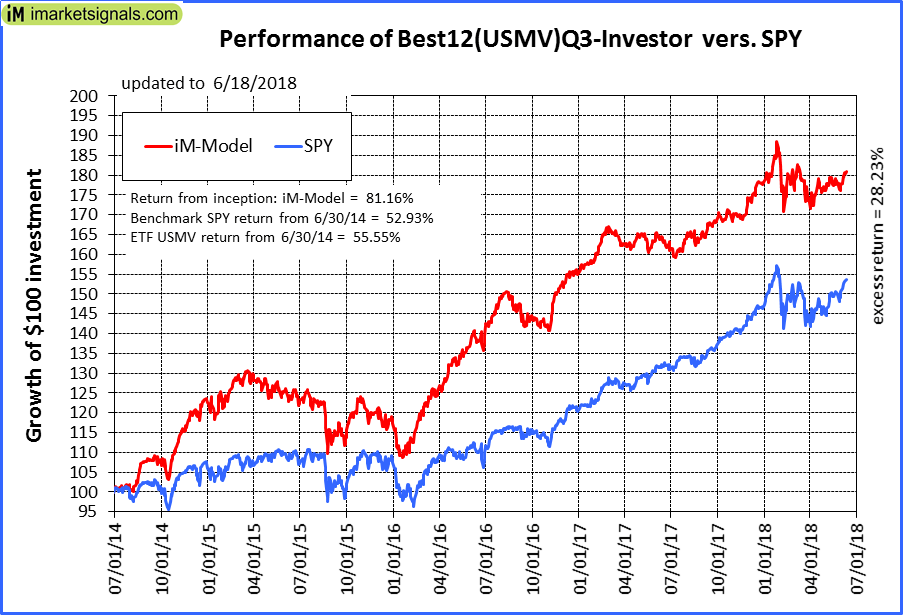 |
iM-Best12(USMV)Q3-Investor: The model’s out of sample performance YTD is 2.0%, and for the last 12 months is 11.1%. Over the same period the benchmark SPY performance was 4.5% and 16.1% respectively. Since inception, on 7/1/2014, the model gained 81.16% while the benchmark SPY gained 52.93% and the ETF USMV gained 55.55% over the same period. Over the previous week the market value of iM-Best12(USMV)Q3 gained 0.43% at a time when SPY gained -0.27%. A starting capital of $100,000 at inception on 7/1/2014 would have grown to $180,789 which includes $370 cash and excludes $1,486 spent on fees and slippage. |
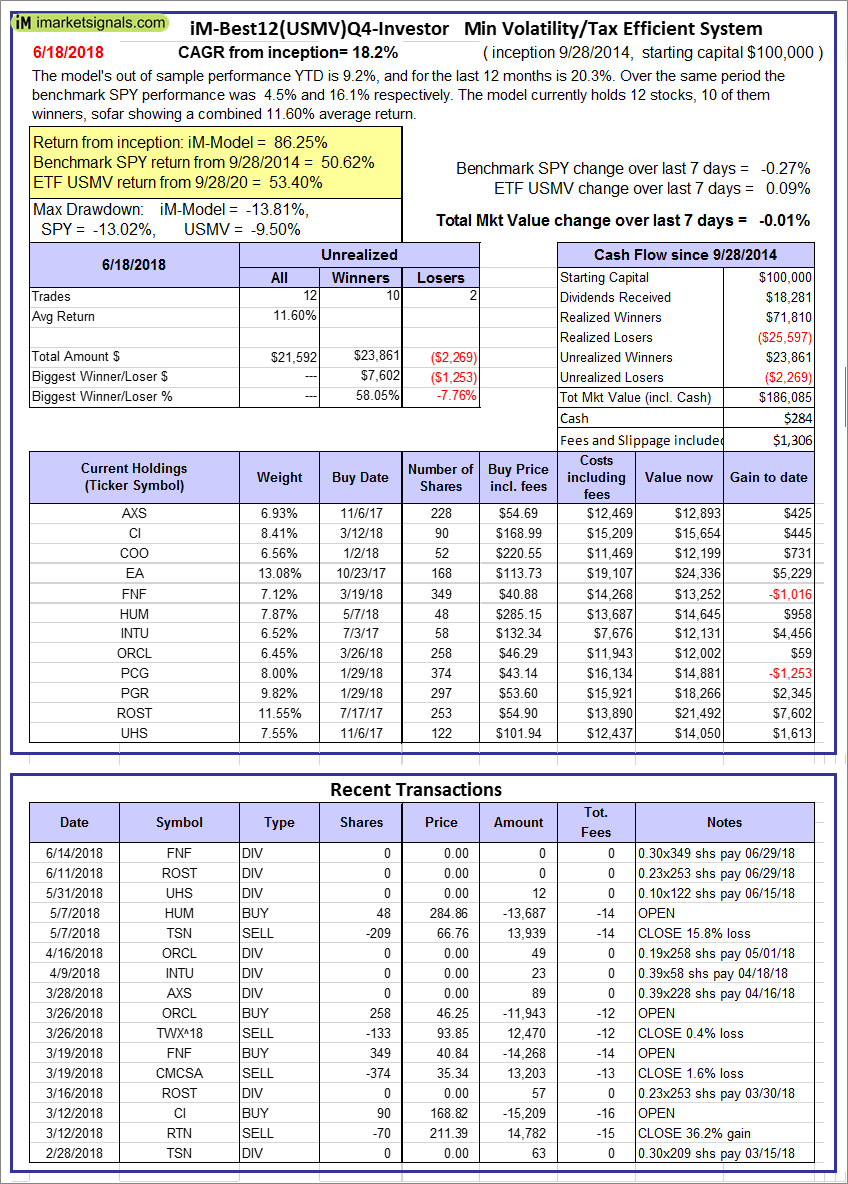 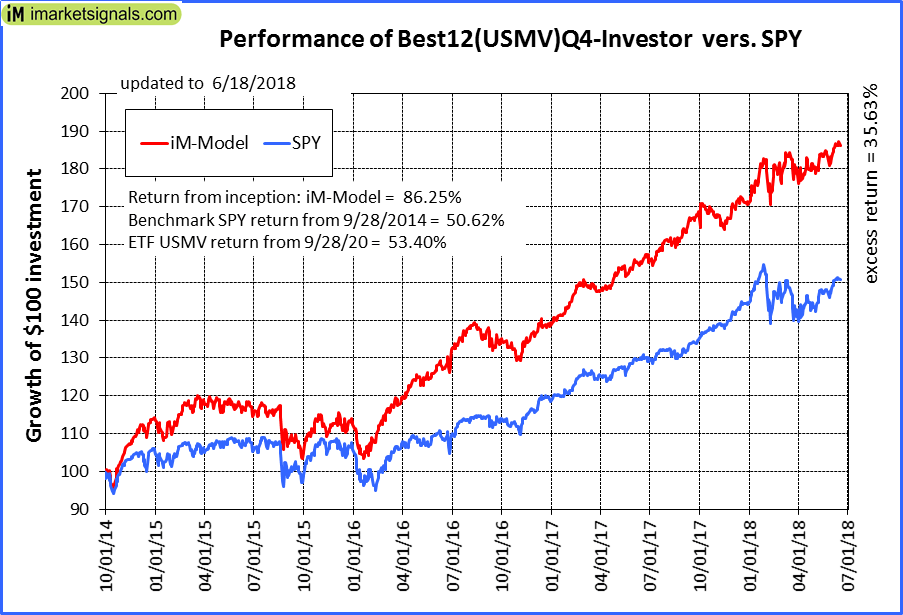 |
iM-Best12(USMV)Q4-Investor: Since inception, on 9/29/2014, the model gained 86.25% while the benchmark SPY gained 50.62% and the ETF USMV gained 53.40% over the same period. Over the previous week the market value of iM-Best12(USMV)Q4 gained -0.01% at a time when SPY gained -0.27%. A starting capital of $100,000 at inception on 9/29/2014 would have grown to $186,085 which includes $284 cash and excludes $1,306 spent on fees and slippage. |
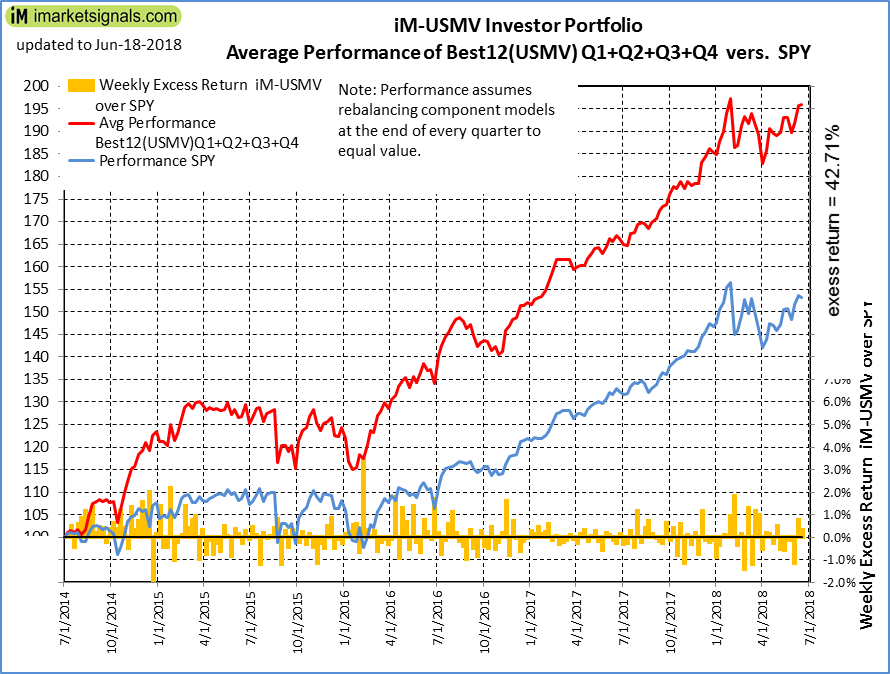 |
Average Performance of iM-Best12(USMV)Q1+Q2+Q3+Q4-Investor resulted in an excess return of 42.71% over SPY. (see iM-USMV Investor Portfolio) |
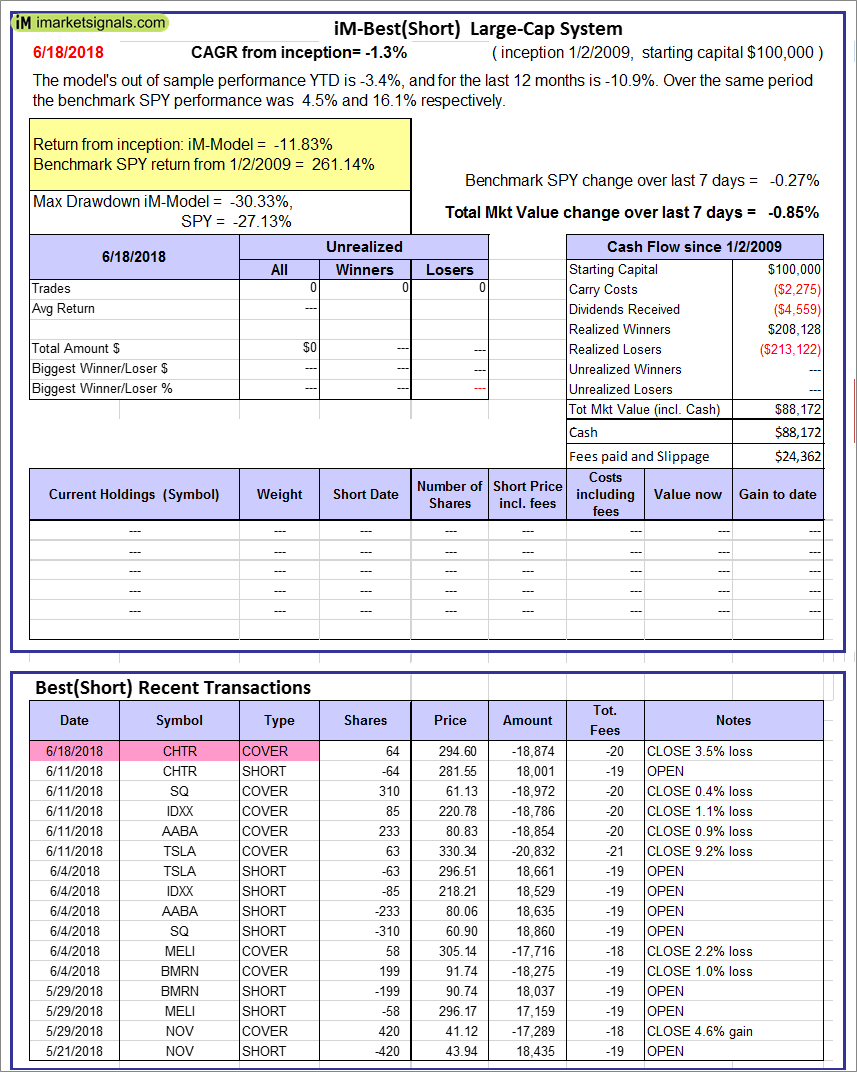 |
iM-Best(Short): The model’s out of sample performance YTD is -3.4%, and for the last 12 months is -10.9%. Over the same period the benchmark SPY performance was 4.5% and 16.1% respectively. Over the previous week the market value of iM-Best(Short) gained -0.85% at a time when SPY gained -0.27%. Over the period 1/2/2009 to 6/18/2018 the starting capital of $100,000 would have grown to $88,172 which includes $88,172 cash and excludes $24,362 spent on fees and slippage. |
 |
iM-Best2 MC-Score ETF System: The model’s out of sample performance YTD is -3.8%, and for the last 12 months is 1.7%. Over the same period the benchmark SPY performance was 4.5% and 16.1% respectively. Over the previous week the market value of the iM-Best2 MC-Score ETF System gained -0.01% at a time when SPY gained -0.27%. A starting capital of $100,000 at inception on 6/30/2016 would have grown to $107,735 which includes $1,285 cash and excludes $115 spent on fees and slippage. |
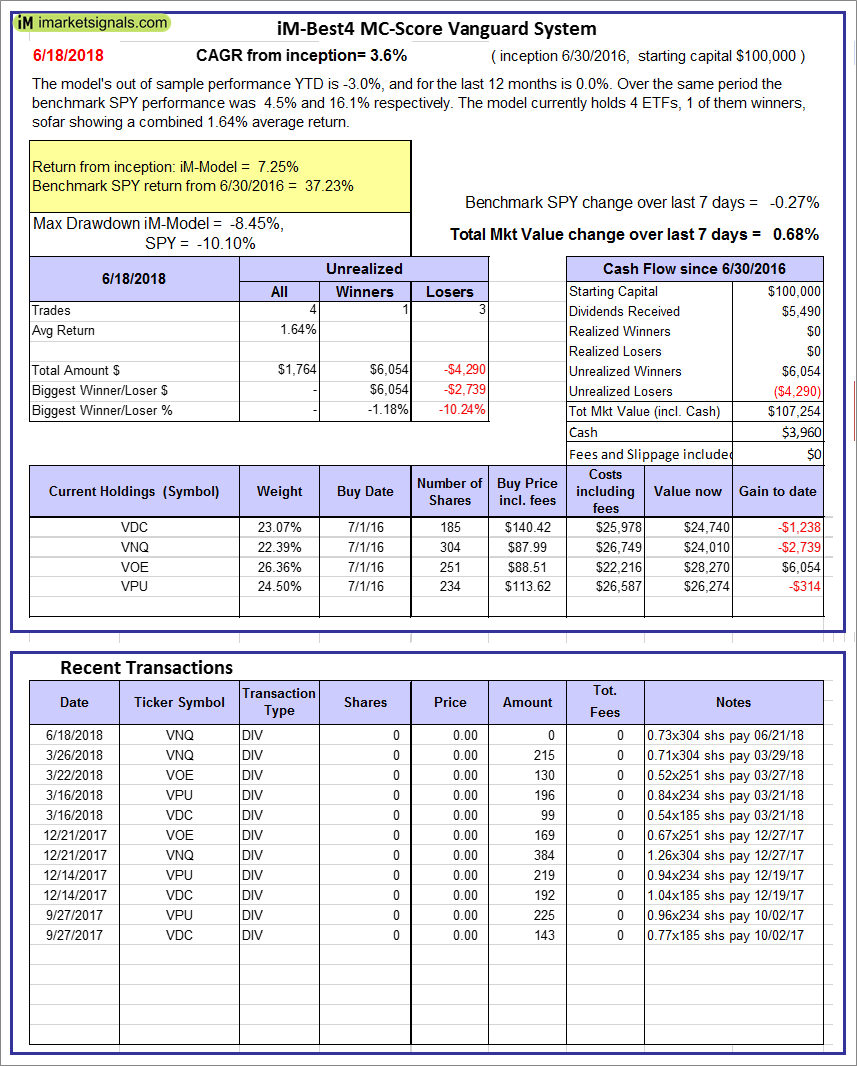 |
iM-Best4 MC-Score Vanguard System: The model’s out of sample performance YTD is -3.0%, and for the last 12 months is 0.0%. Over the same period the benchmark SPY performance was 4.5% and 16.1% respectively. Over the previous week the market value of the iM-Best4 MC-Score Vanguard System gained 0.68% at a time when SPY gained -0.27%. A starting capital of $100,000 at inception on 6/30/2016 would have grown to $107,254 which includes $3,960 cash and excludes $00 spent on fees and slippage. |
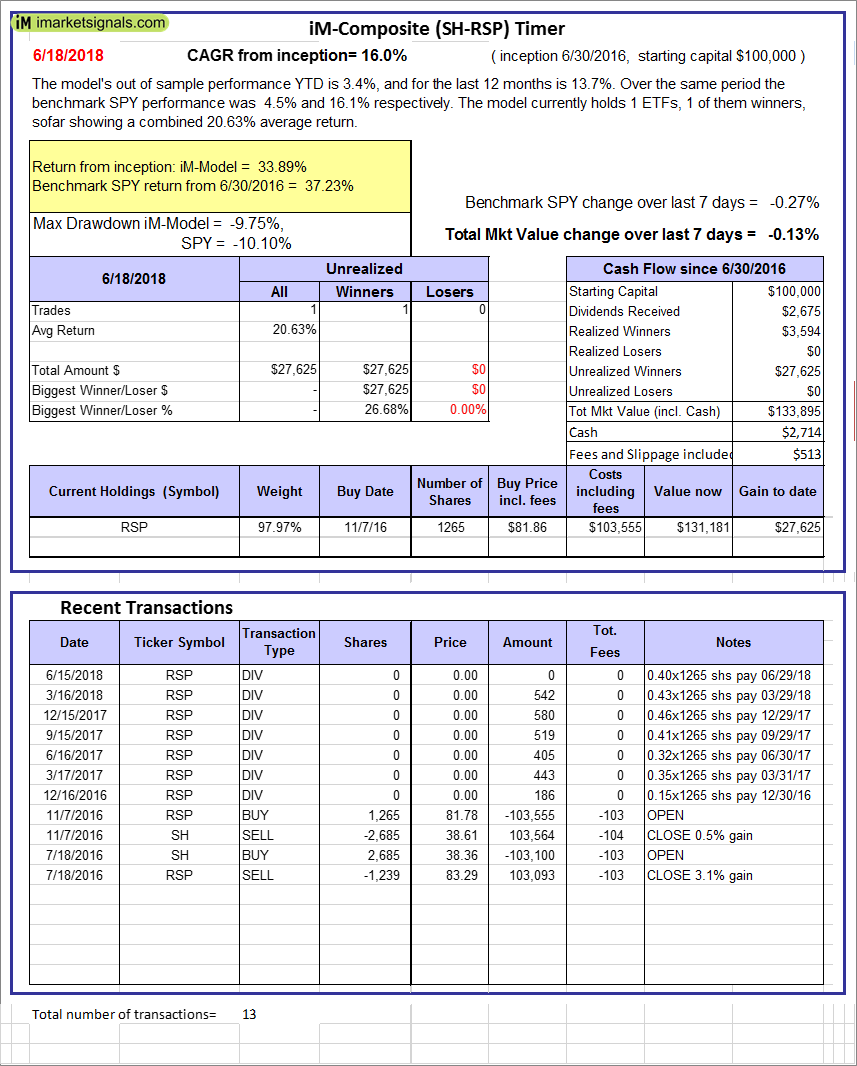 |
iM-Composite (SH-RSP) Timer: The model’s out of sample performance YTD is 3.4%, and for the last 12 months is 13.7%. Over the same period the benchmark SPY performance was 4.5% and 16.1% respectively. Over the previous week the market value of the iM-Composite (SH-RSP) Timer gained -0.13% at a time when SPY gained -0.27%. A starting capital of $100,000 at inception on 6/30/2016 would have grown to $133,895 which includes $2,714 cash and excludes $513 spent on fees and slippage. |
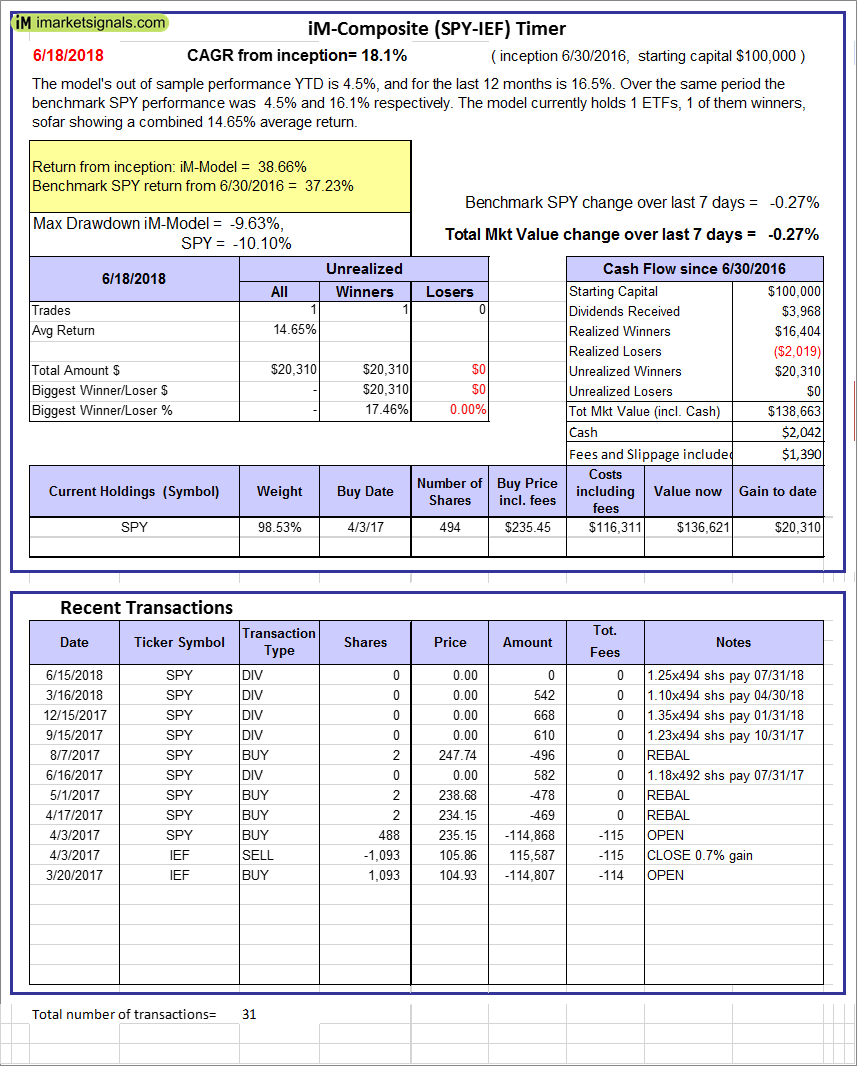 |
iM-Composite (SPY-IEF) Timer: The model’s out of sample performance YTD is 4.5%, and for the last 12 months is 16.5%. Over the same period the benchmark SPY performance was 4.5% and 16.1% respectively. Over the previous week the market value of the iM-Composite (SPY-IEF) Timer gained -0.27% at a time when SPY gained -0.27%. A starting capital of $100,000 at inception on 6/30/2016 would have grown to $138,663 which includes $2,042 cash and excludes $1,390 spent on fees and slippage. |
 |
iM-VIX Timer with ZIV: The model’s out of sample performance YTD is 26.3%, and for the last 12 months is 70.4%. Over the same period the benchmark SPY performance was 4.5% and 16.1% respectively. Over the previous week the market value of the iM-VIX Timer with ZIV gained 2.25% at a time when SPY gained -0.27%. A starting capital of $100,000 at inception on 6/30/2016 would have grown to $222,288 which includes -$2,530 cash and excludes $2,427 spent on fees and slippage. |
 |
iM-Composite(Gold-Stocks-Bond) Timer: The model’s out of sample performance YTD is -2.0%, and for the last 12 months is 1.5%. Over the same period the benchmark SPY performance was 4.5% and 16.1% respectively. Over the previous week the market value of the iM-Composite(Gold-Stocks-Bond) Timer gained -1.70% at a time when SPY gained -0.27%. A starting capital of $100,000 at inception on 6/30/2016 would have grown to $126,108 which includes $53 cash and excludes $1,955 spent on fees and slippage. |
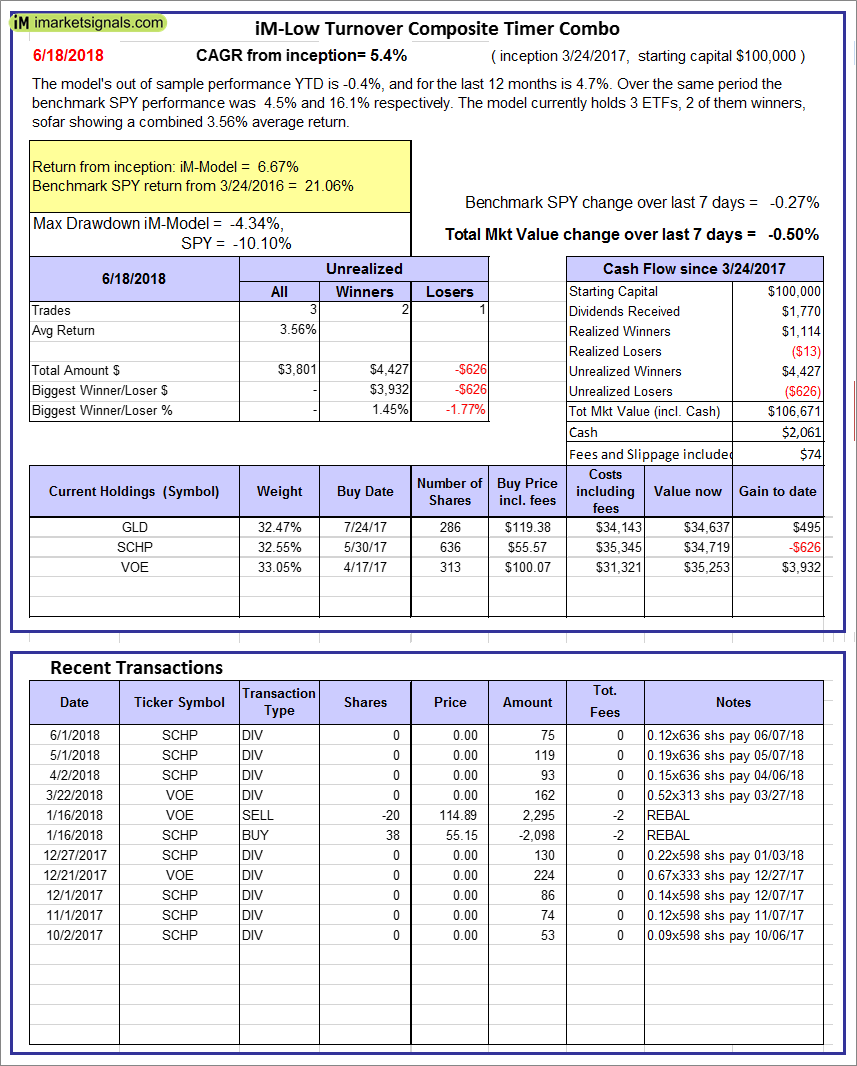 |
iM-Low Turnover Composite Timer Combo: The model’s out of sample performance YTD is -0.4%, and for the last 12 months is 4.7%. Over the same period the benchmark SPY performance was 4.5% and 16.1% respectively. Over the previous week the market value of the iM-Low Turnover Composite Timer Combo gained -0.50% at a time when SPY gained -0.27%. A starting capital of $100,000 at inception on 3/24/27 would have grown to $106,671 which includes $2,061 cash and excludes $74 spent on fees and slippage. |
 |
iM-Min Drawdown Combo: The model’s out of sample performance YTD is -0.6%, and for the last 12 months is 5.5%. Over the same period the benchmark SPY performance was 4.5% and 16.1% respectively. Over the previous week the market value of the iM-Min Drawdown Combo gained -0.15% at a time when SPY gained -0.27%. A starting capital of $100,000 at inception on 4/5/2017 would have grown to $106,985 which includes $1,035 cash and excludes $286 spent on fees and slippage. |
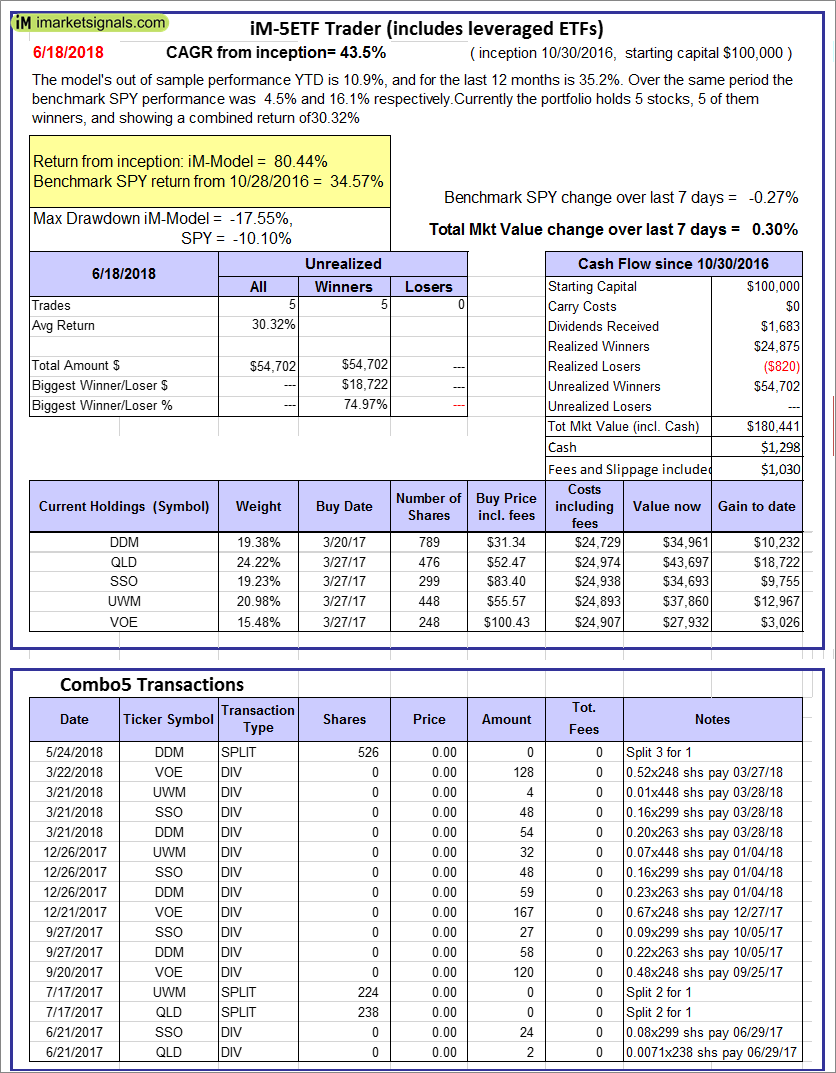 |
iM-5ETF Trader (includes leveraged ETFs): The model’s out of sample performance YTD is 10.9%, and for the last 12 months is 35.2%. Over the same period the benchmark SPY performance was 4.5% and 16.1% respectively. Over the previous week the market value of the iM-5ETF Trader (includes leveraged ETFs) gained 0.30% at a time when SPY gained -0.27%. A starting capital of $100,000 at inception on 10/30/2016 would have grown to $180,441 which includes $1,298 cash and excludes $1,030 spent on fees and slippage. |
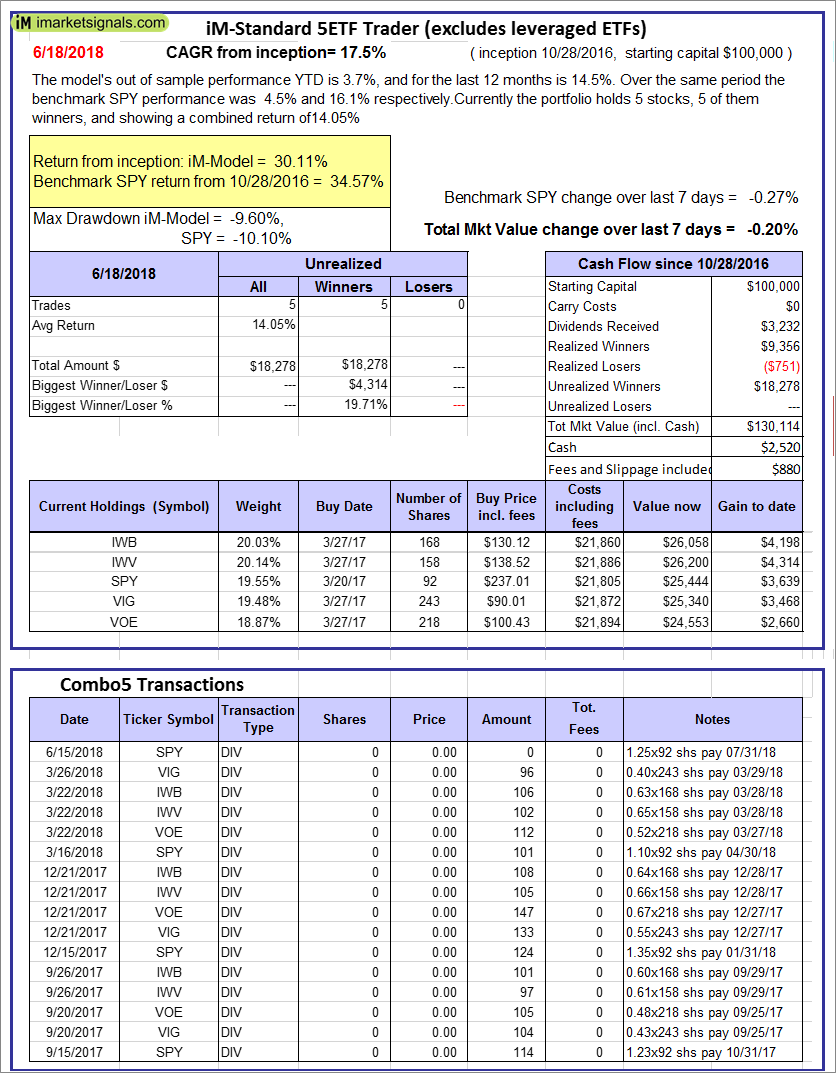 |
iM-Standard 5ETF Trader (excludes leveraged ETFs): The model’s out of sample performance YTD is 3.7%, and for the last 12 months is 14.5%. Over the same period the benchmark SPY performance was 4.5% and 16.1% respectively. Over the previous week the market value of the iM-Standard 5ETF Trader (excludes leveraged ETFs) gained -0.20% at a time when SPY gained -0.27%. A starting capital of $100,000 at inception on 10/30/2016 would have grown to $130,114 which includes $2,520 cash and excludes $880 spent on fees and slippage. |
iM-Best Reports – 6/18/2018
Posted in pmp SPY-SH
Leave a Reply
You must be logged in to post a comment.