  |
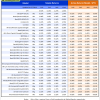
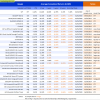
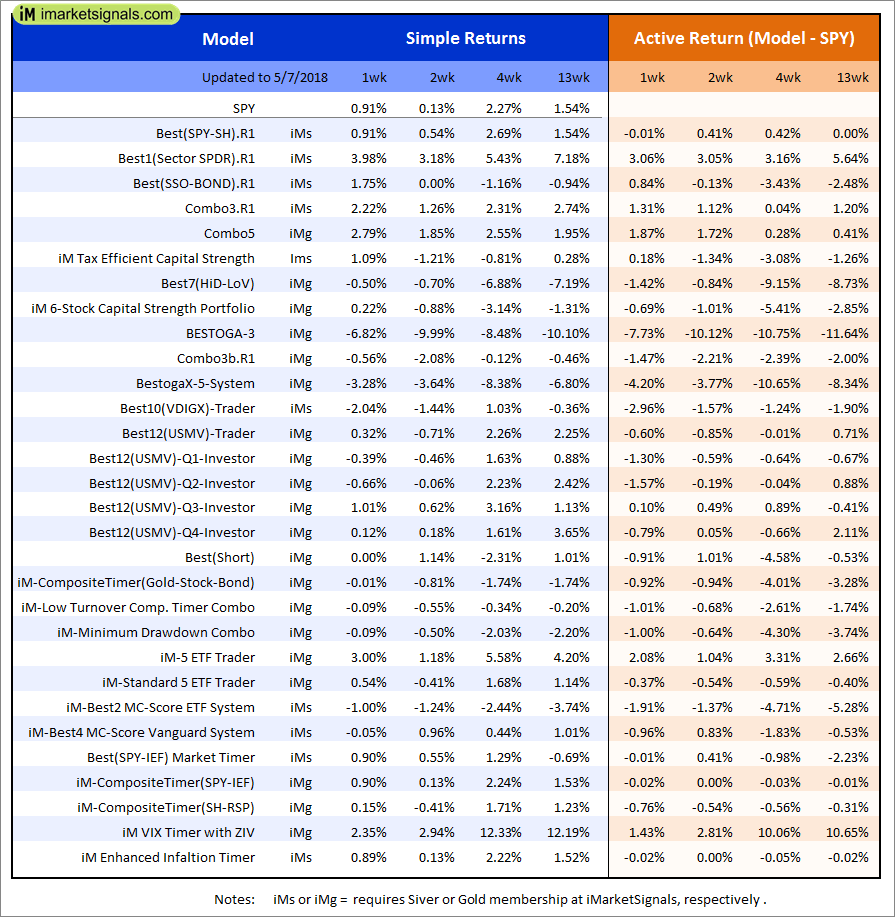
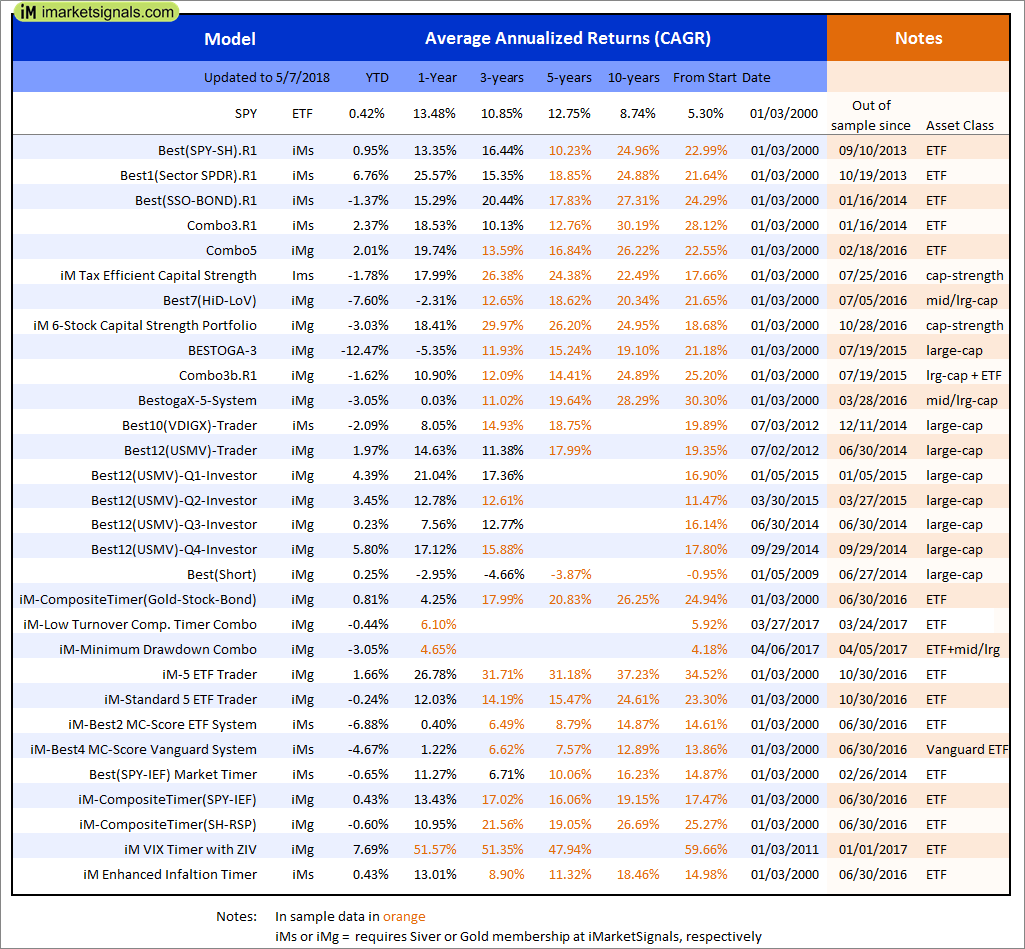
Out of sample performance summary of our models for the past 1, 2, 4 and 13 week periods. The active active return indicates how the models over- or underperformed the benchmark ETF SPY. Also the YTD, and the 1-, 3-, 5- and 10-year annualized returns are shown in the second table |
|
|
iM-Best(SPY-SH).R1: The model’s out of sample performance YTD is 0.4%, and for the last 12 months is 13.3%. Over the same period the benchmark SPY performance was 0.4% and 13.5% respectively. Over the previous week the market value of Best(SPY-SH) gained 0.91% at a time when SPY gained 0.91%. A starting capital of $100,000 at inception on 1/2/2009 would have grown to $567,612 which includes $140 cash and excludes $15,371 spent on fees and slippage. |
|
|
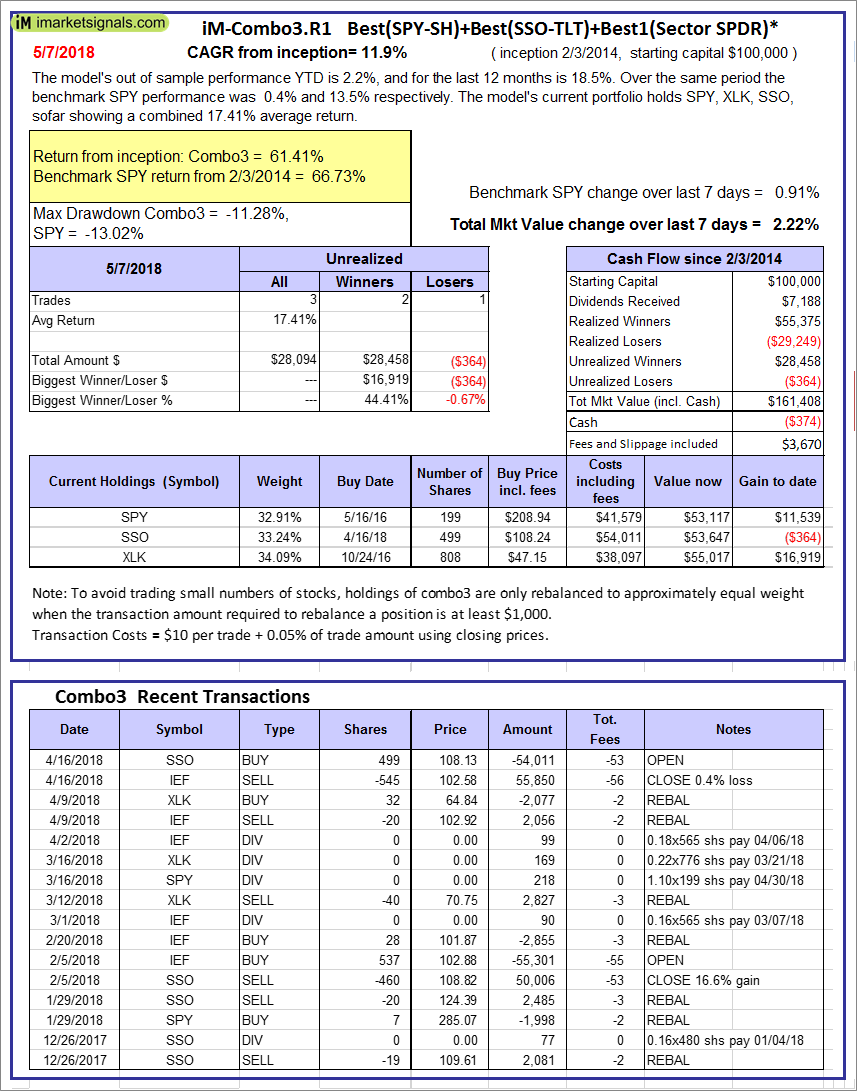
iM-Combo3.R1: The model’s out of sample performance YTD is 2.2%, and for the last 12 months is 18.5%. Over the same period the benchmark SPY performance was 0.4% and 13.5% respectively. Over the previous week the market value of iM-Combo3.R1 gained 2.22% at a time when SPY gained 0.91%. A starting capital of $100,000 at inception on 2/3/2014 would have grown to $161,408 which includes -$374 cash and excludes $3,670 spent on fees and slippage. |
|
|
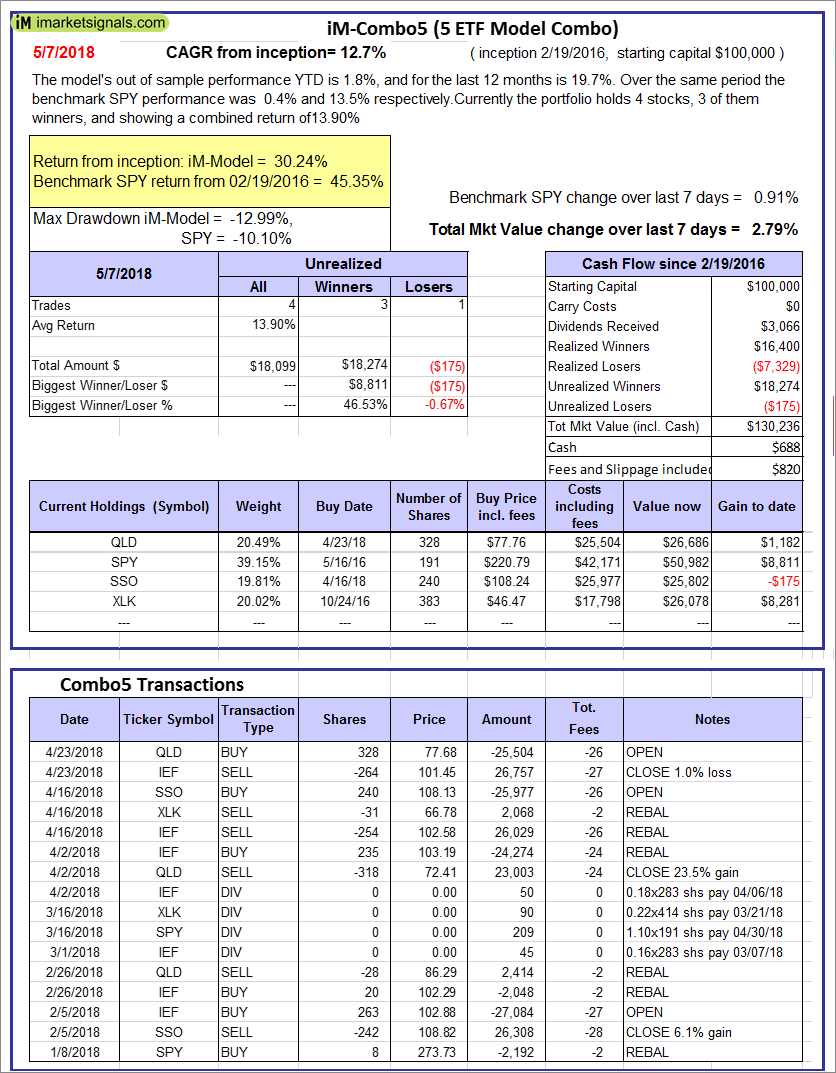
iM-Combo5: The model’s out of sample performance YTD is 1.8%, and for the last 12 months is 19.7%. Over the same period the benchmark SPY performance was 0.4% and 13.5% respectively. Over the previous week the market value of iM-Combo5 gained 2.79% at a time when SPY gained 0.91%. A starting capital of $100,000 at inception on 2/22/2016 would have grown to $130,236 which includes $688 cash and excludes $820 spent on fees and slippage. |
|
|
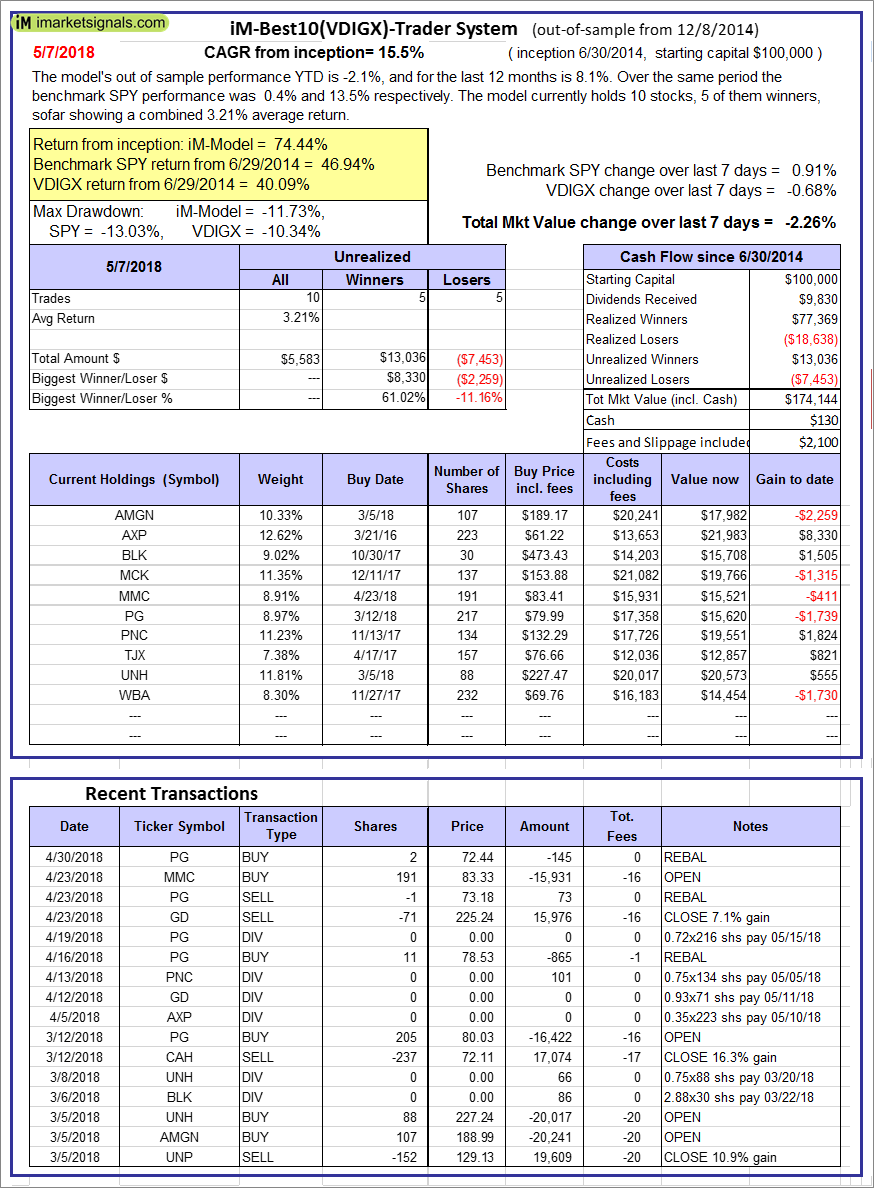
iM-Best10(VDIGX)-Trader: The model’s out of sample performance YTD is -2.1%, and for the last 12 months is 8.1%. Over the same period the benchmark SPY performance was 0.4% and 13.5% respectively. Since inception, on 7/1/2014, the model gained 74.44% while the benchmark SPY gained 46.94% and VDIGX gained 40.09% over the same period. Over the previous week the market value of iM-Best10(VDIGX) gained -2.26% at a time when SPY gained 0.91%. A starting capital of $100,000 at inception on 7/1/2014 would have grown to $174,144 which includes $130 cash and excludes $2,100 spent on fees and slippage. |
|
|
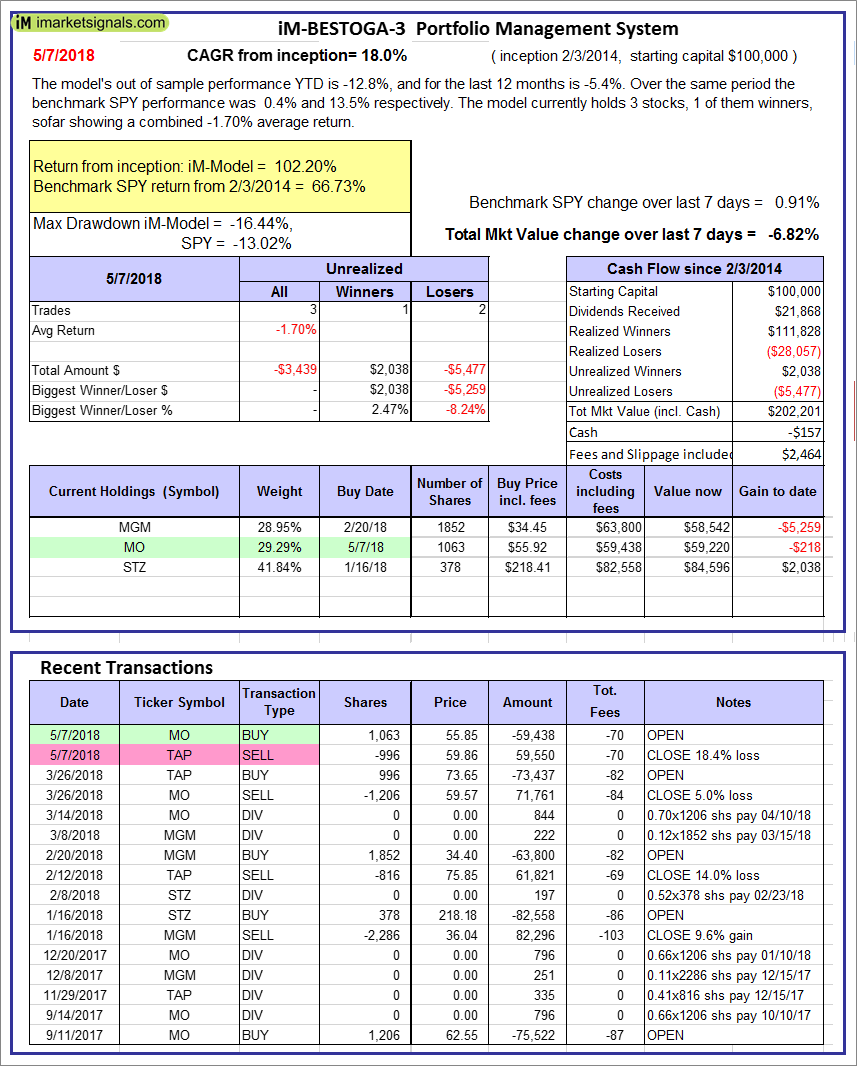
iM-BESTOGA-3: The model’s out of sample performance YTD is -12.8%, and for the last 12 months is -5.4%. Over the same period the benchmark SPY performance was 0.4% and 13.5% respectively. Over the previous week the market value of iM-BESTOGA-3 gained -6.82% at a time when SPY gained 0.91%. A starting capital of $100,000 at inception on 2/3/2014 would have grown to $202,201 which includes -$157 cash and excludes $2,464 spent on fees and slippage. |
|
|
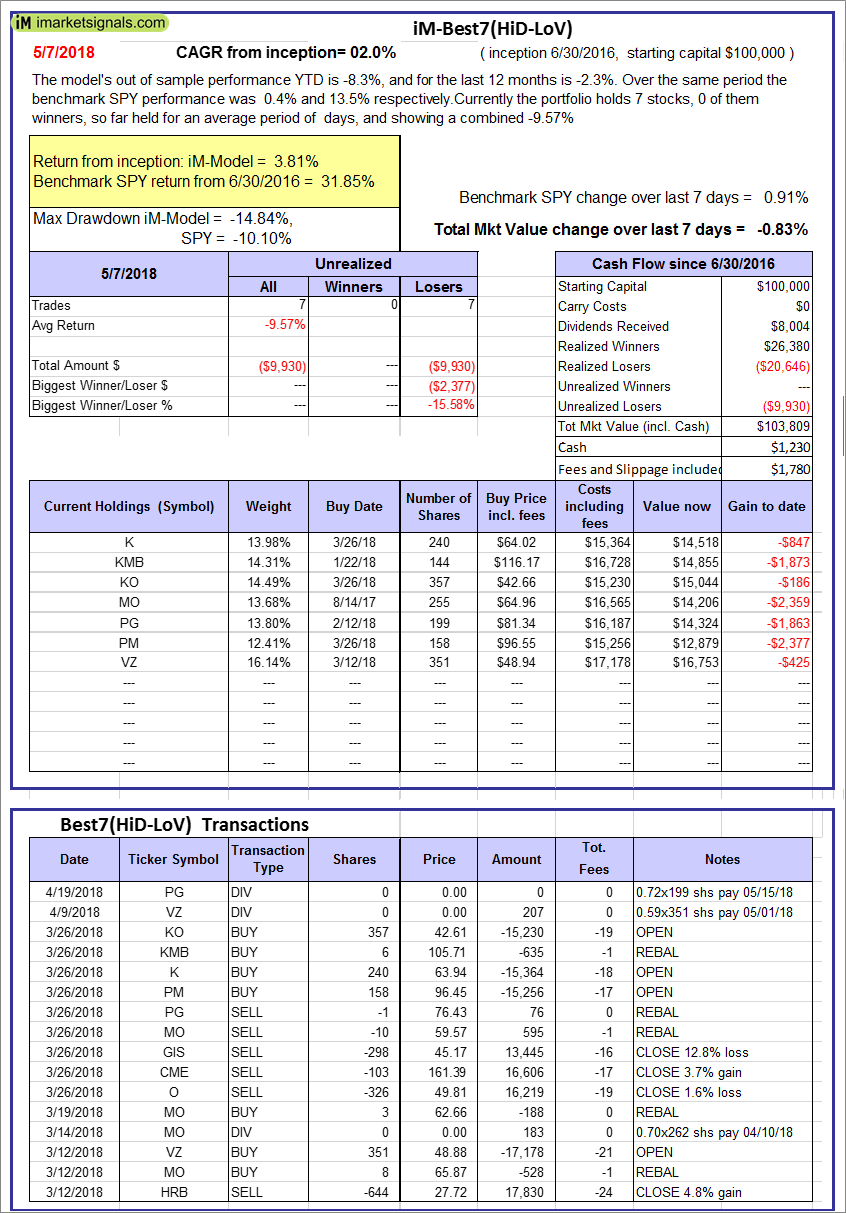
iM-Best7(HiD-LoV): The model’s out of sample performance YTD is -8.3%, and for the last 12 months is -2.3%. Over the same period the benchmark SPY performance was 0.4% and 13.5% respectively. Over the previous week the market value of iM-BESTOGA-3 gained -0.83% at a time when SPY gained 0.91%. A starting capital of $100,000 at inception on 6/30/2016 would have grown to $103,809 which includes $1,230 cash and excludes $1,780 spent on fees and slippage. |
|
|
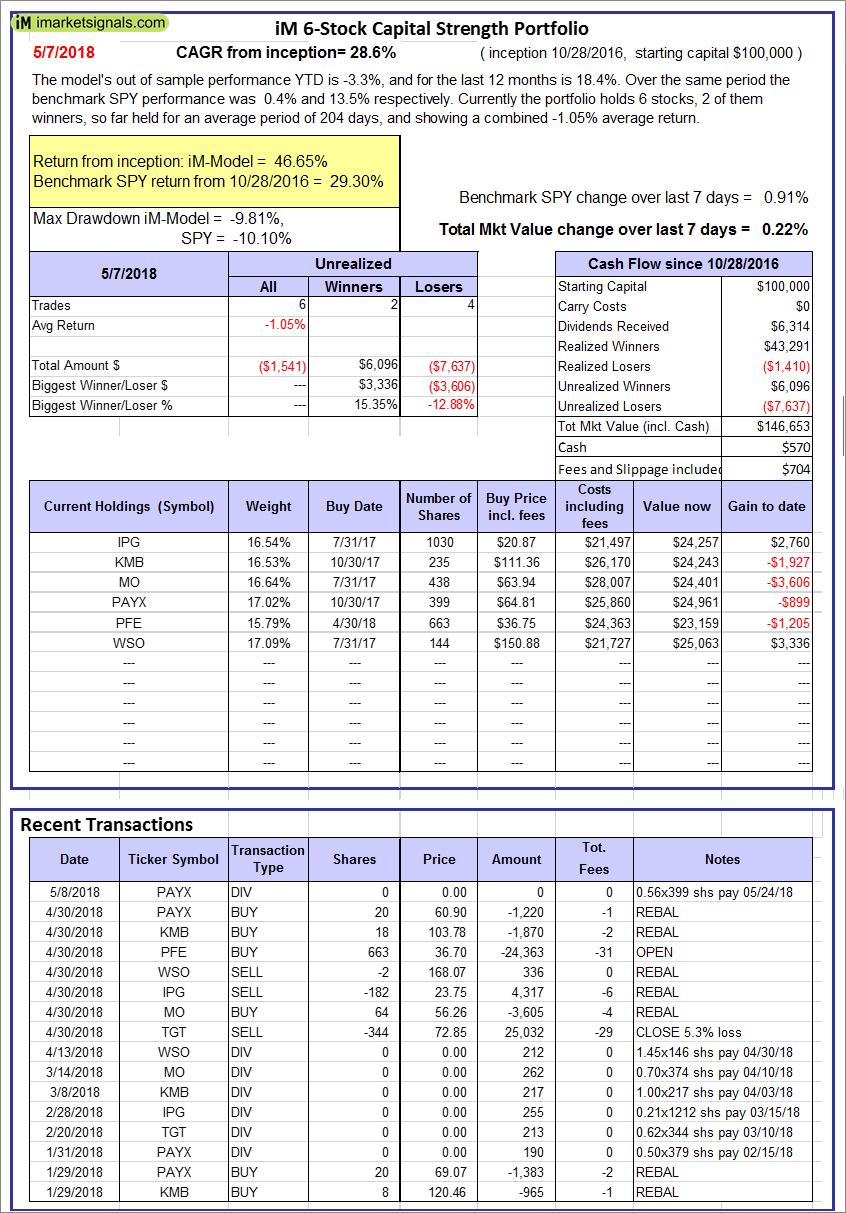
iM 6-Stock Capital Strength Portfolio: The model’s out of sample performance YTD is -3.3%, and for the last 12 months is 18.4%. Over the same period the benchmark SPY performance was 0.4% and 13.5% respectively. Over the previous week the market value of the iM 6-Stock Capital Strength Portfolio gained 0.22% at a time when SPY gained 0.91%. A starting capital of $100,000 at inception on 10/28/2016 would have grown to $146,653 which includes $570 cash and excludes $704 spent on fees and slippage. |
|
|
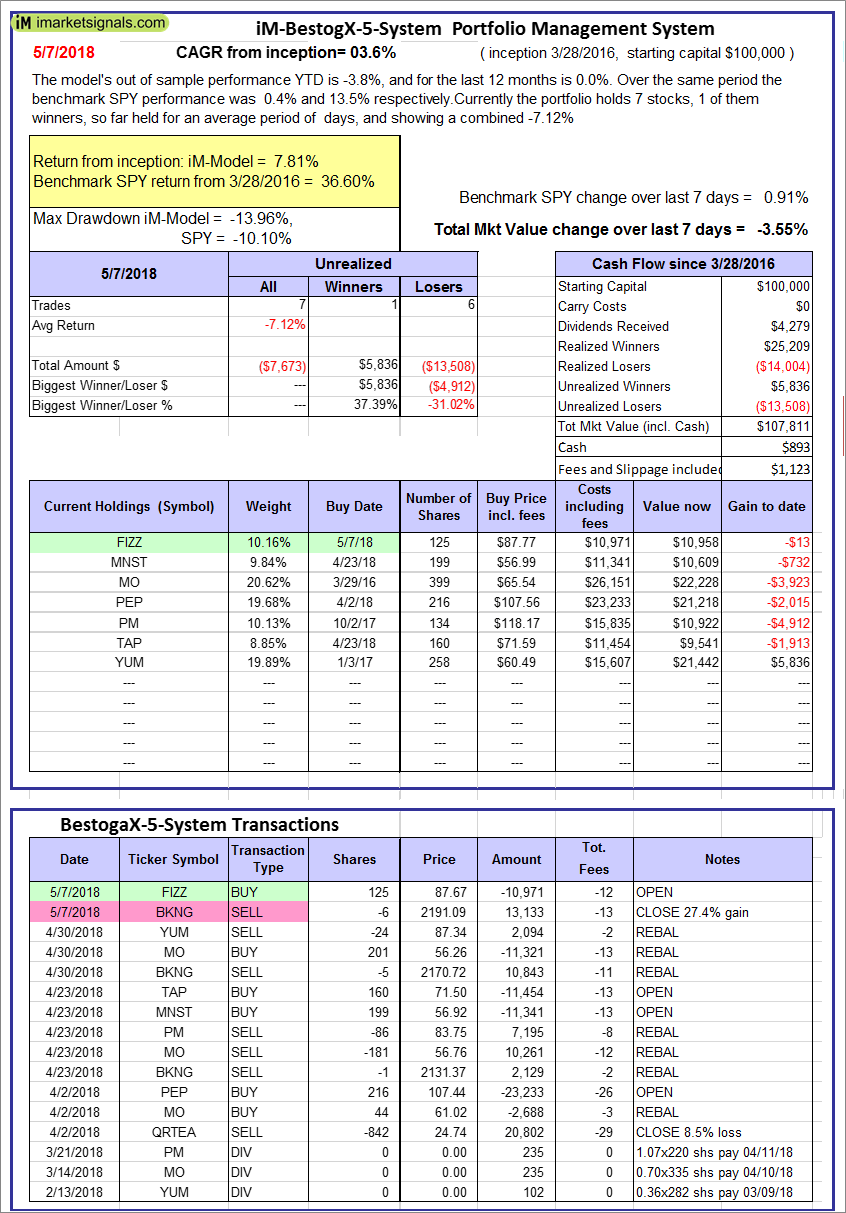
iM-BestogaX5-System: The model’s out of sample performance YTD is -3.8%, and for the last 12 months is 0.0%. Over the same period the benchmark SPY performance was 0.4% and 13.5% respectively. Over the previous week the market value of iM-BestogaX5-System gained -3.55% at a time when SPY gained 0.91%. A starting capital of $100,000 at inception on 3/28/2016 would have grown to $107,811 which includes $893 cash and excludes $1,123 spent on fees and slippage. |
|
|
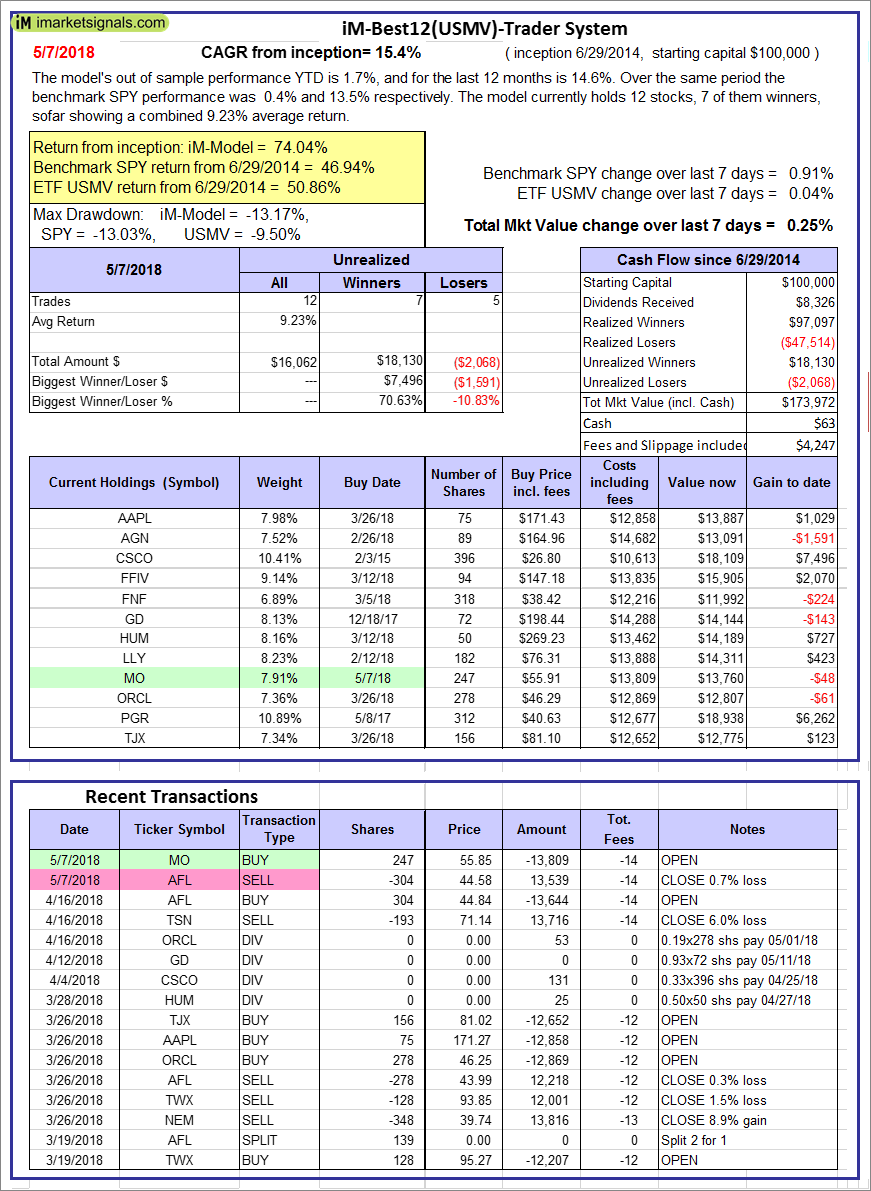
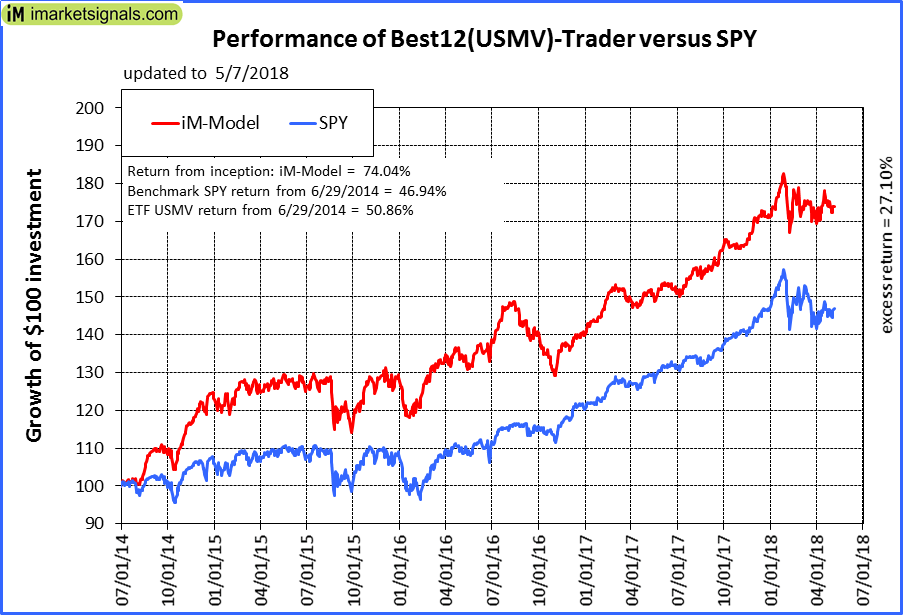
iM-Best12(USMV)-Trader: The model’s out of sample performance YTD is 1.7%, and for the last 12 months is 14.6%. Over the same period the benchmark SPY performance was 0.4% and 13.5% respectively. Since inception, on 6/30/2014, the model gained 74.04% while the benchmark SPY gained 46.94% and the ETF USMV gained 50.86% over the same period. Over the previous week the market value of iM-Best12(USMV)-Trader gained 0.25% at a time when SPY gained 0.91%. A starting capital of $100,000 at inception on 6/30/2014 would have grown to $173,972 which includes $63 cash and excludes $4,247 spent on fees and slippage. |
|
|
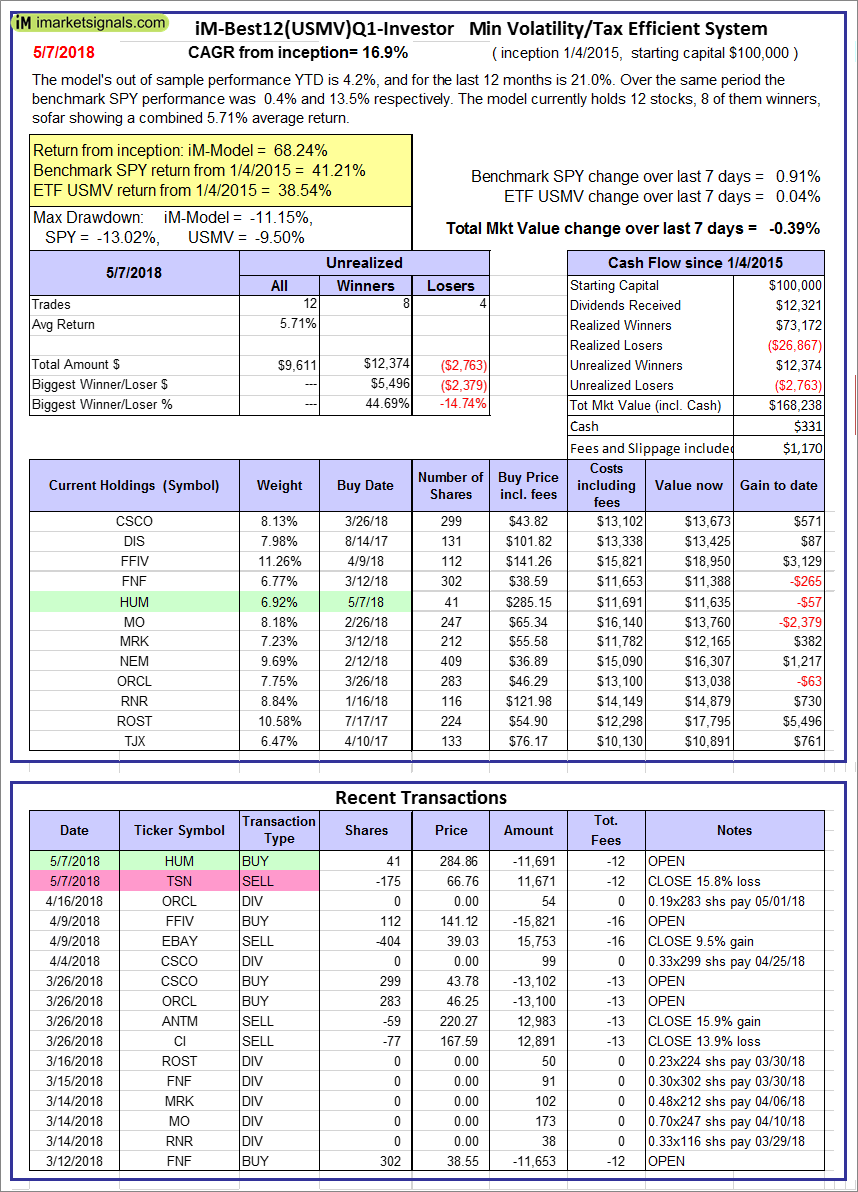
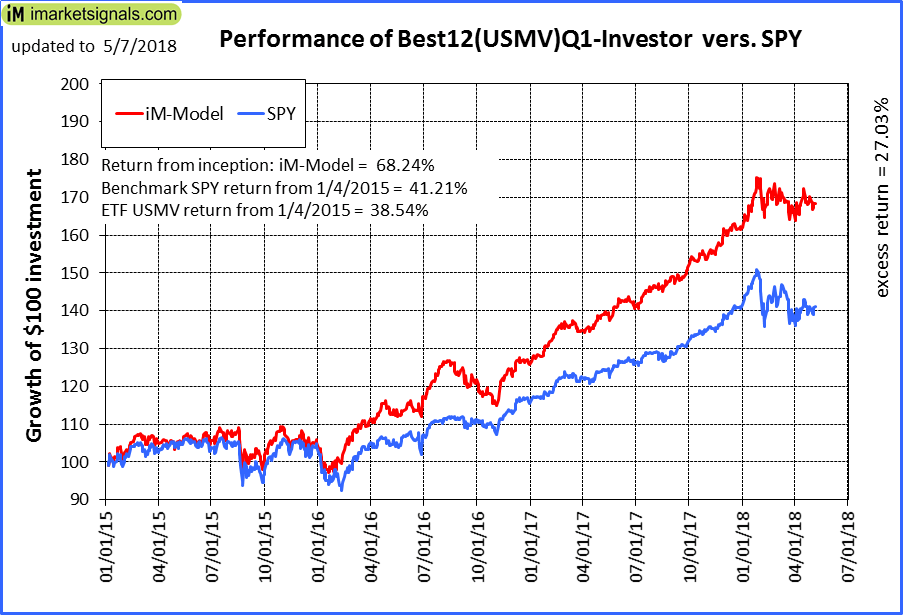
iM-Best12(USMV)Q1-Investor: The model’s out of sample performance YTD is 4.2%, and for the last 12 months is 21.0%. Over the same period the benchmark SPY performance was 0.4% and 13.5% respectively. Since inception, on 1/5/2015, the model gained 68.24% while the benchmark SPY gained 41.21% and the ETF USMV gained 38.54% over the same period. Over the previous week the market value of iM-Best12(USMV)Q1 gained -0.39% at a time when SPY gained 0.91%. A starting capital of $100,000 at inception on 1/5/2015 would have grown to $168,238 which includes $331 cash and excludes $1,170 spent on fees and slippage. |
|
|
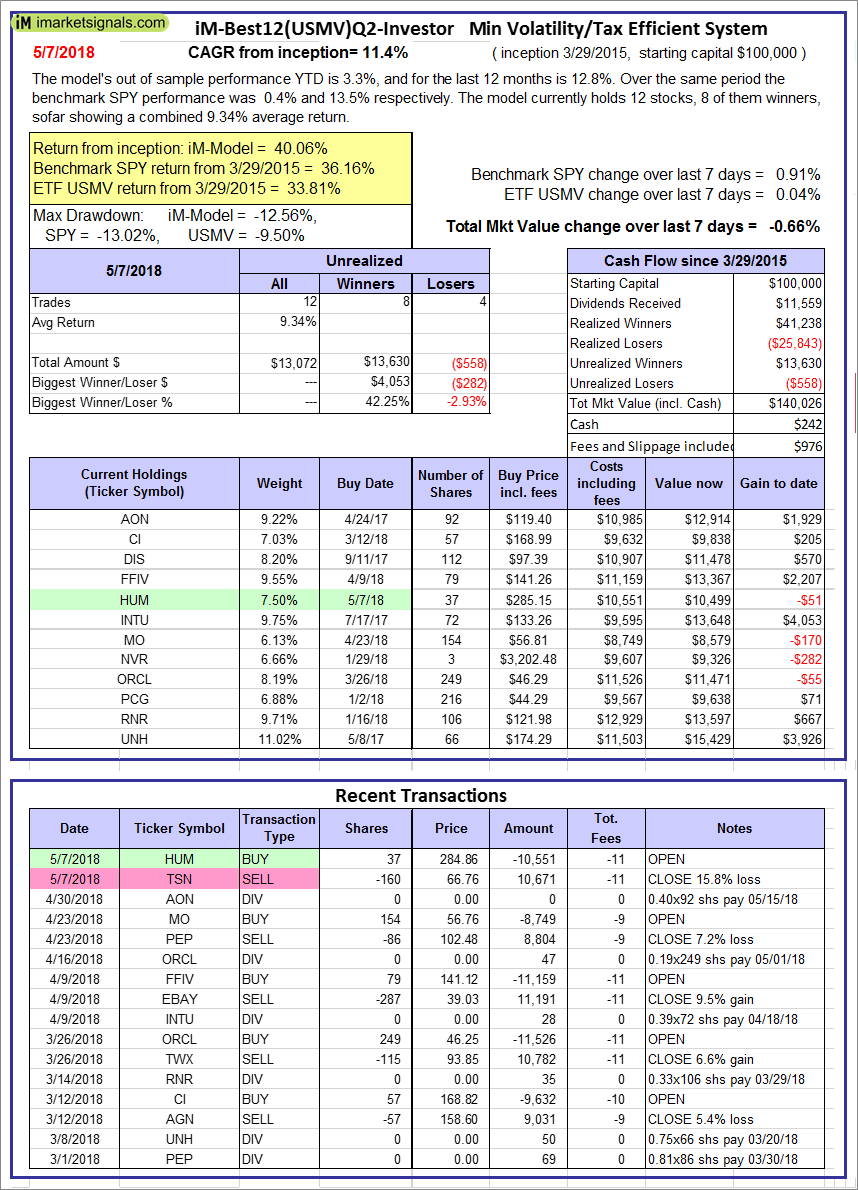
iM-Best12(USMV)Q2-Investor: The model’s out of sample performance YTD is 3.3%, and for the last 12 months is 12.8%. Over the same period the benchmark SPY performance was 0.4% and 13.5% respectively. Since inception, on 3/30/2015, the model gained 40.06% while the benchmark SPY gained 36.16% and the ETF USMV gained 33.81% over the same period. Over the previous week the market value of iM-Best12(USMV)Q2 gained -0.66% at a time when SPY gained 0.91%. A starting capital of $100,000 at inception on 3/30/2015 would have grown to $140,026 which includes $242 cash and excludes $976 spent on fees and slippage. |
|
|
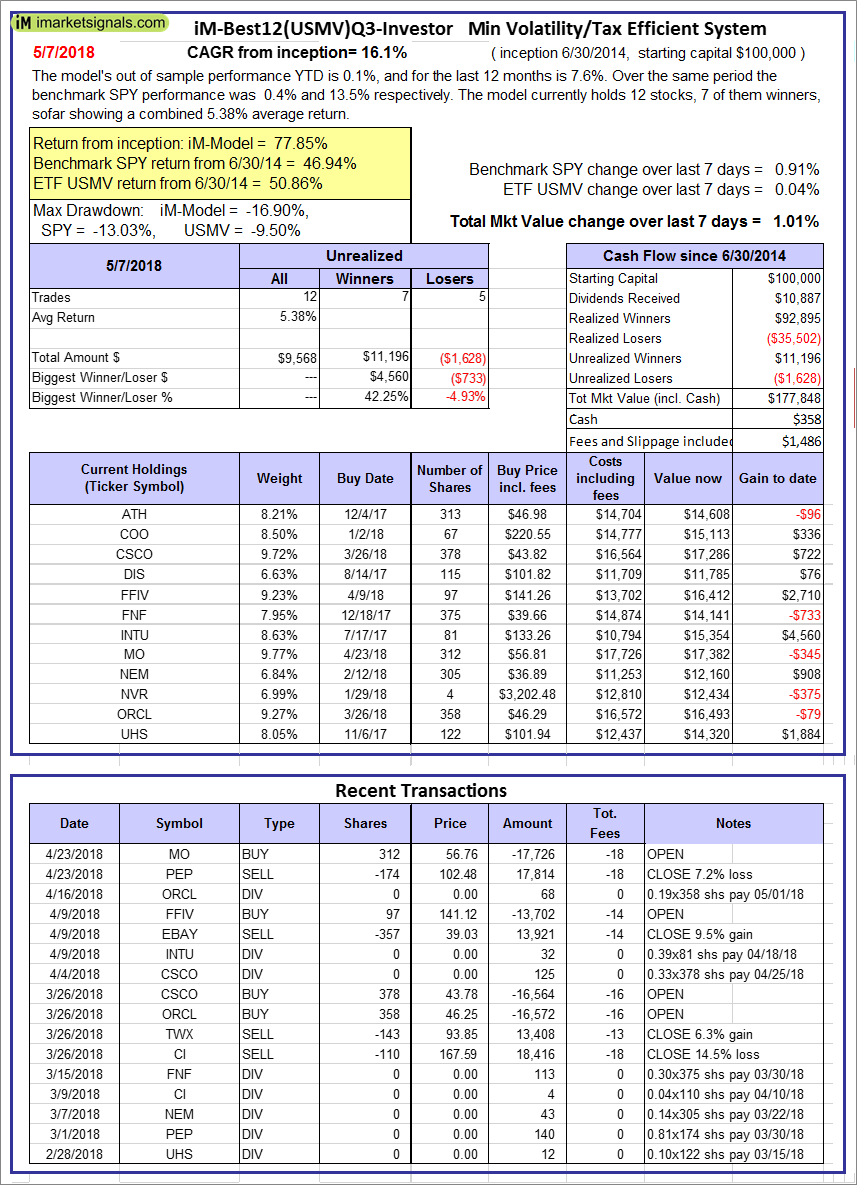
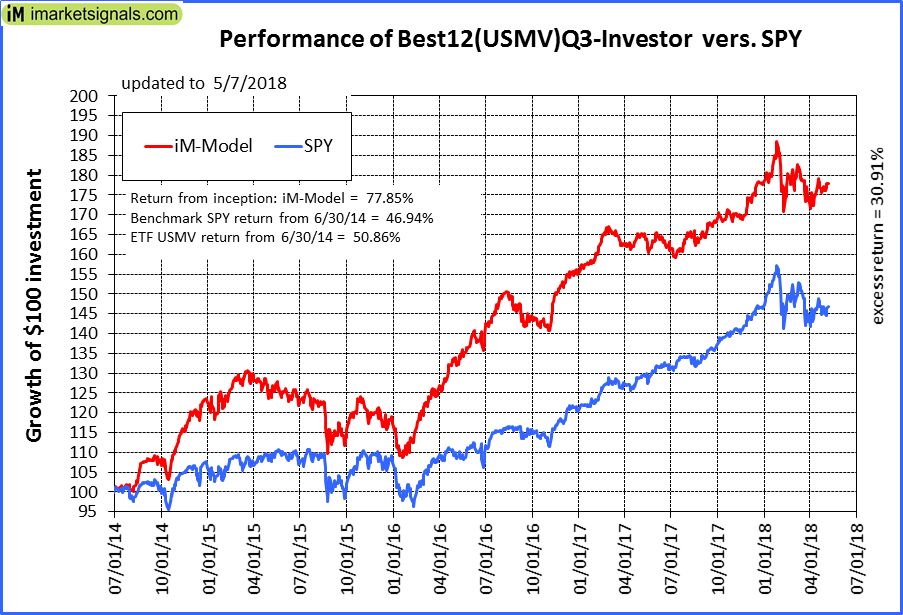
iM-Best12(USMV)Q3-Investor: The model’s out of sample performance YTD is 0.1%, and for the last 12 months is 7.6%. Over the same period the benchmark SPY performance was 0.4% and 13.5% respectively. Since inception, on 7/1/2014, the model gained 77.85% while the benchmark SPY gained 46.94% and the ETF USMV gained 50.86% over the same period. Over the previous week the market value of iM-Best12(USMV)Q3 gained 1.01% at a time when SPY gained 0.91%. A starting capital of $100,000 at inception on 7/1/2014 would have grown to $177,848 which includes $358 cash and excludes $1,486 spent on fees and slippage. |
|
|
iM-Best12(USMV)Q4-Investor: Since inception, on 9/29/2014, the model gained 80.34% while the benchmark SPY gained 44.72% and the ETF USMV gained 48.78% over the same period. Over the previous week the market value of iM-Best12(USMV)Q4 gained 0.12% at a time when SPY gained 0.91%. A starting capital of $100,000 at inception on 9/29/2014 would have grown to $180,337 which includes $271 cash and excludes $1,306 spent on fees and slippage. |
|
|
Average Performance of iM-Best12(USMV)Q1+Q2+Q3+Q4-Investor resulted in an excess return of 42.65% over SPY. (see iM-USMV Investor Portfolio) |
|
|
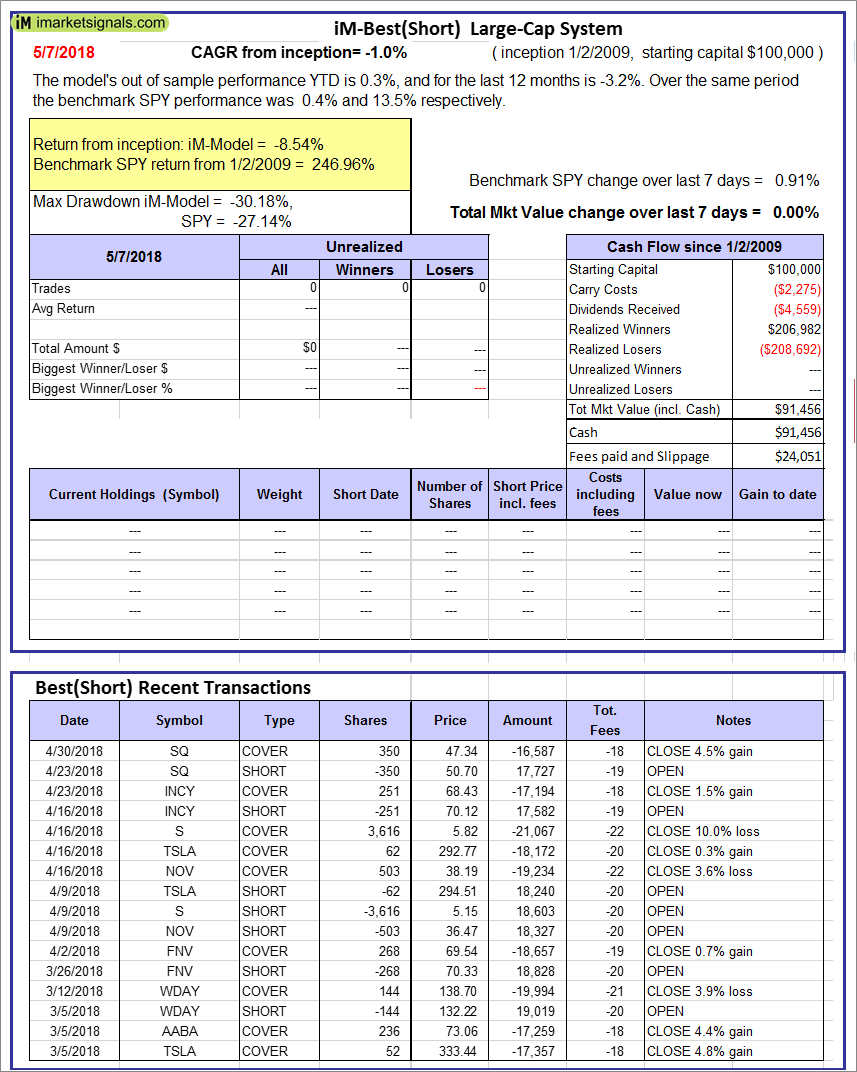
iM-Best(Short): The model’s out of sample performance YTD is 0.3%, and for the last 12 months is -3.2%. Over the same period the benchmark SPY performance was 0.4% and 13.5% respectively. Over the previous week the market value of iM-Best(Short) gained 0.00% at a time when SPY gained 0.91%. Over the period 1/2/2009 to 5/7/2018 the starting capital of $100,000 would have grown to $91,456 which includes $91,456 cash and excludes $24,051 spent on fees and slippage. |
|
|
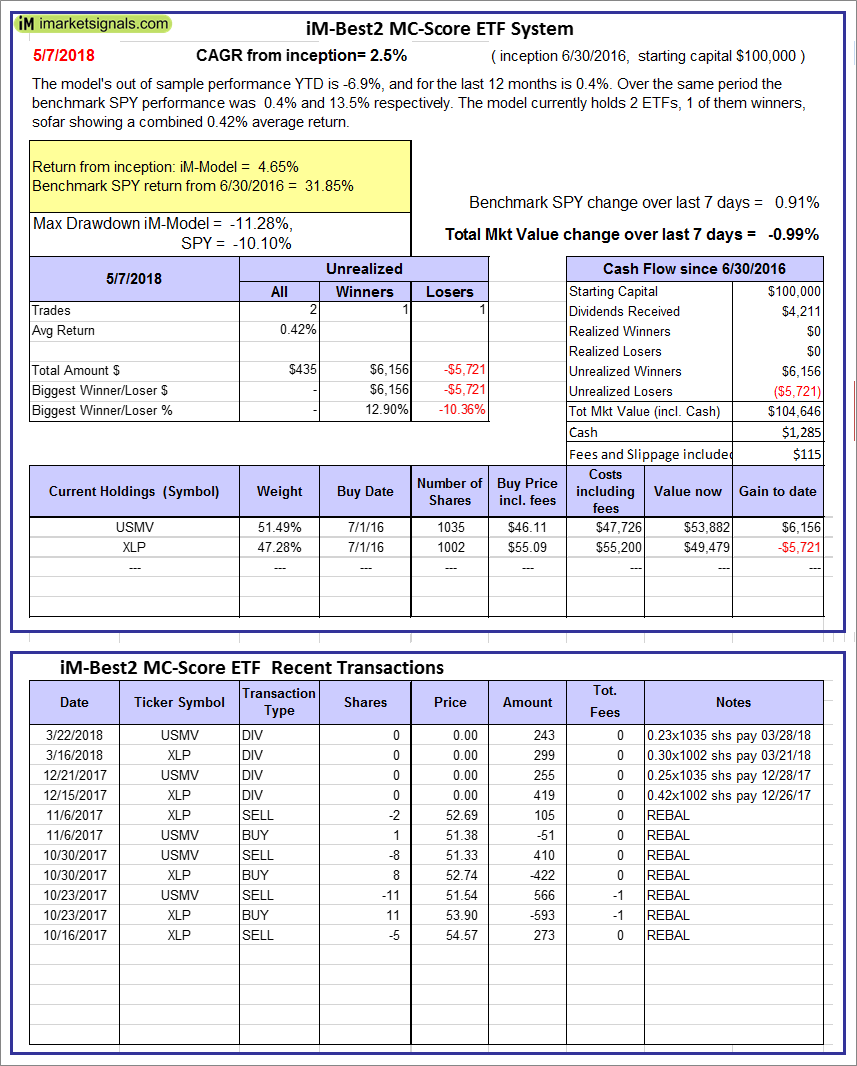
iM-Best2 MC-Score ETF System: The model’s out of sample performance YTD is -6.9%, and for the last 12 months is 0.4%. Over the same period the benchmark SPY performance was 0.4% and 13.5% respectively. Over the previous week the market value of the iM-Best2 MC-Score ETF System gained -0.99% at a time when SPY gained 0.91%. A starting capital of $100,000 at inception on 6/30/2016 would have grown to $104,646 which includes $1,285 cash and excludes $115 spent on fees and slippage. |
|
|
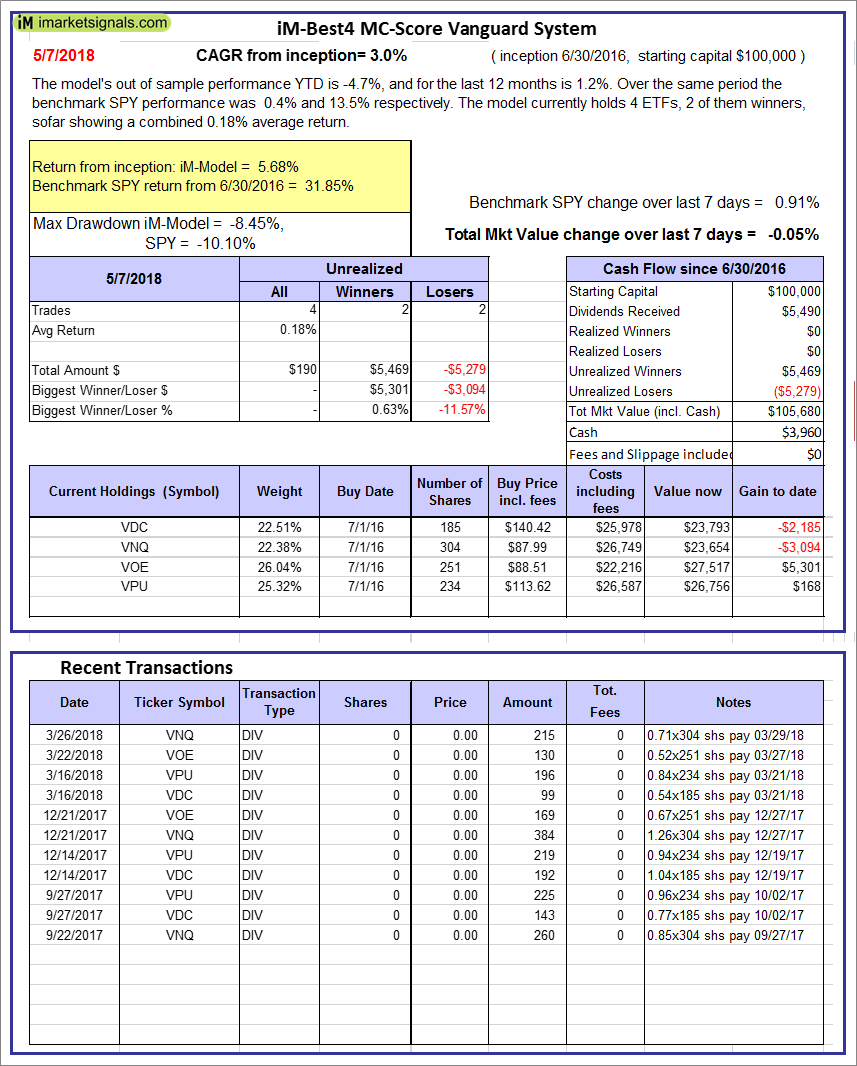
iM-Best4 MC-Score Vanguard System: The model’s out of sample performance YTD is -4.7%, and for the last 12 months is 1.2%. Over the same period the benchmark SPY performance was 0.4% and 13.5% respectively. Over the previous week the market value of the iM-Best4 MC-Score Vanguard System gained -0.05% at a time when SPY gained 0.91%. A starting capital of $100,000 at inception on 6/30/2016 would have grown to $105,680 which includes $3,960 cash and excludes $00 spent on fees and slippage. |
|
|
iM-Composite (SH-RSP) Timer: The model’s out of sample performance YTD is -0.6%, and for the last 12 months is 10.6%. Over the same period the benchmark SPY performance was 0.4% and 13.5% respectively. Over the previous week the market value of the iM-Composite (SH-RSP) Timer gained 0.15% at a time when SPY gained 0.91%. A starting capital of $100,000 at inception on 6/30/2016 would have grown to $129,214 which includes $2,714 cash and excludes $513 spent on fees and slippage. |
|
|
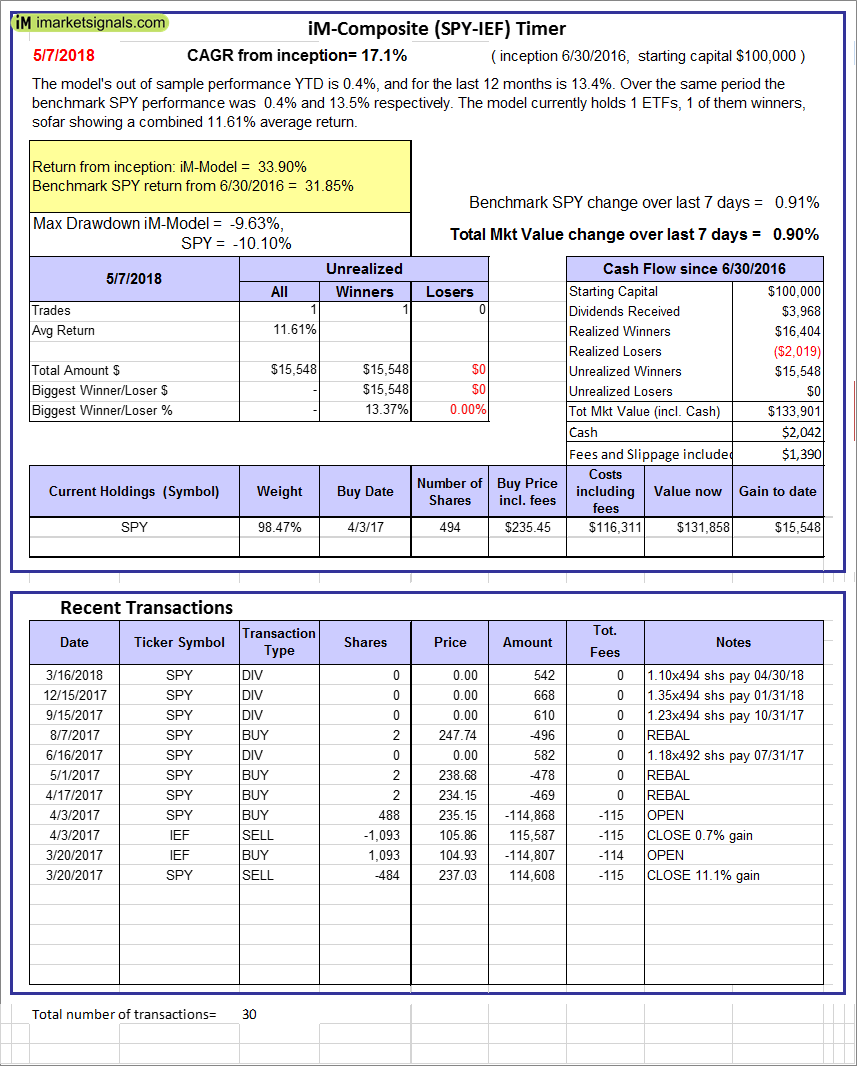
iM-Composite (SPY-IEF) Timer: The model’s out of sample performance YTD is 0.4%, and for the last 12 months is 13.4%. Over the same period the benchmark SPY performance was 0.4% and 13.5% respectively. Over the previous week the market value of the iM-Composite (SPY-IEF) Timer gained 0.90% at a time when SPY gained 0.91%. A starting capital of $100,000 at inception on 6/30/2016 would have grown to $133,901 which includes $2,042 cash and excludes $1,390 spent on fees and slippage. |
|
|
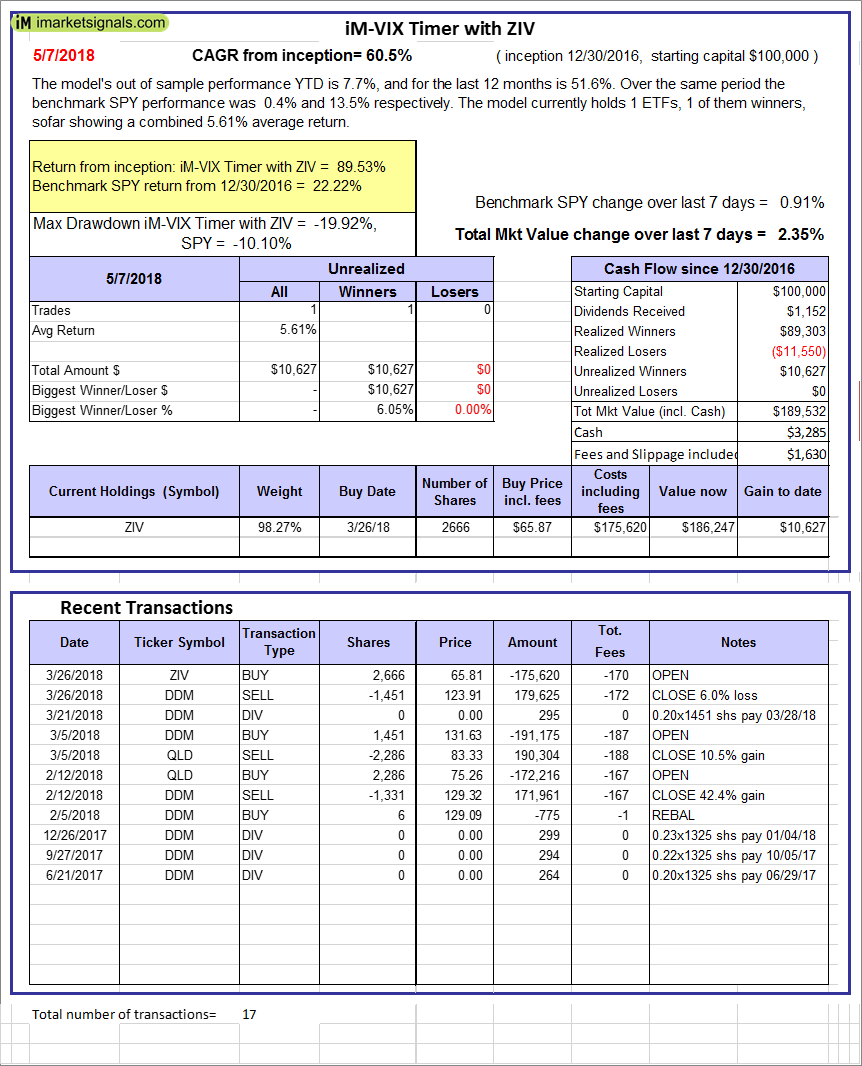
iM-VIX Timer with ZIV: The model’s out of sample performance YTD is 7.7%, and for the last 12 months is 51.6%. Over the same period the benchmark SPY performance was 0.4% and 13.5% respectively. Over the previous week the market value of the iM-VIX Timer with ZIV gained 2.35% at a time when SPY gained 0.91%. A starting capital of $100,000 at inception on 6/30/2016 would have grown to $189,532 which includes $3,285 cash and excludes $1,630 spent on fees and slippage. |
|
|
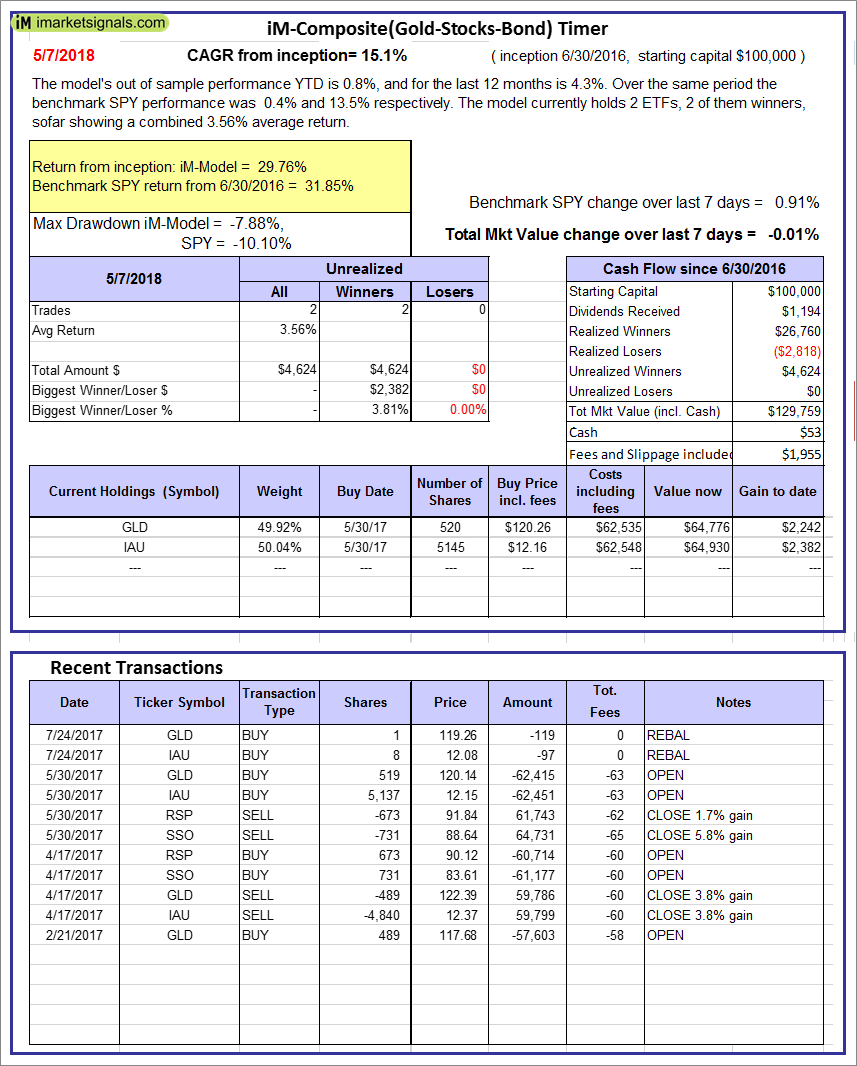
iM-Composite(Gold-Stocks-Bond) Timer: The model’s out of sample performance YTD is 0.8%, and for the last 12 months is 4.3%. Over the same period the benchmark SPY performance was 0.4% and 13.5% respectively. Over the previous week the market value of the iM-Composite(Gold-Stocks-Bond) Timer gained -0.01% at a time when SPY gained 0.91%. A starting capital of $100,000 at inception on 6/30/2016 would have grown to $129,759 which includes $53 cash and excludes $1,955 spent on fees and slippage. |
|
|
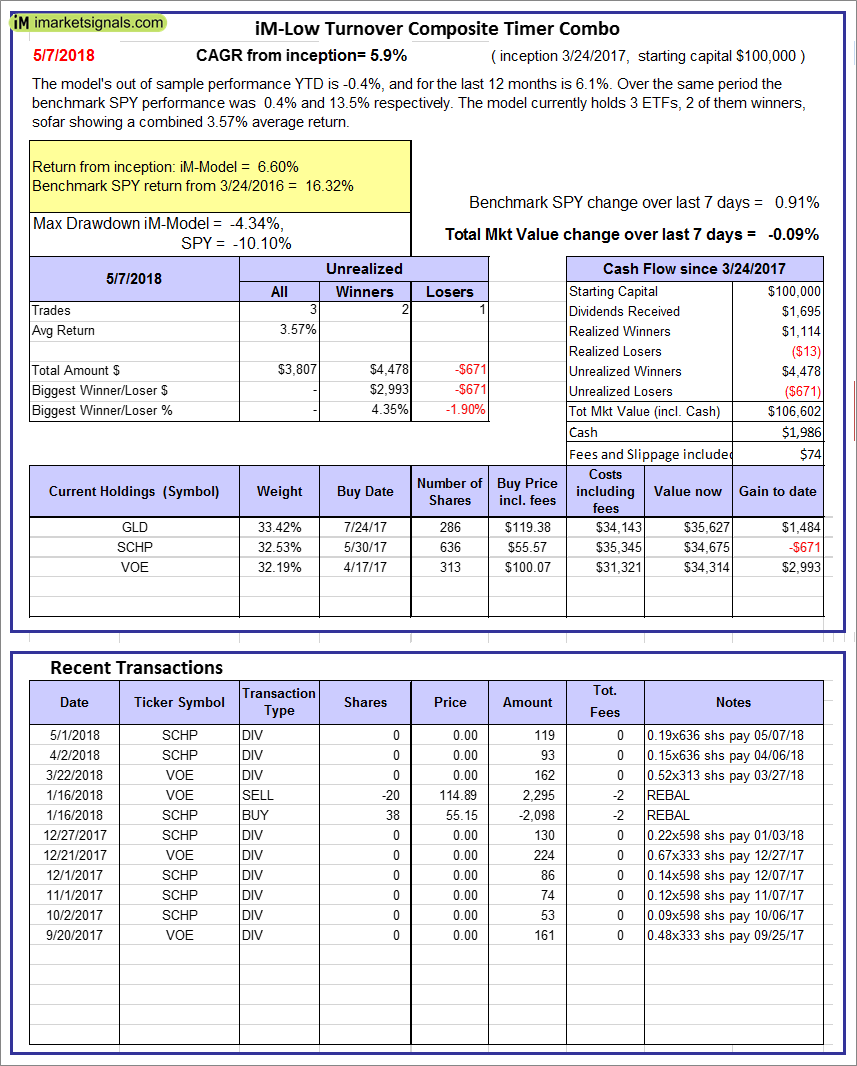
iM-Low Turnover Composite Timer Combo: The model’s out of sample performance YTD is -0.4%, and for the last 12 months is 6.1%. Over the same period the benchmark SPY performance was 0.4% and 13.5% respectively. Over the previous week the market value of the iM-Low Turnover Composite Timer Combo gained -0.09% at a time when SPY gained 0.91%. A starting capital of $100,000 at inception on 3/24/27 would have grown to $106,602 which includes $1,986 cash and excludes $74 spent on fees and slippage. |
|
|
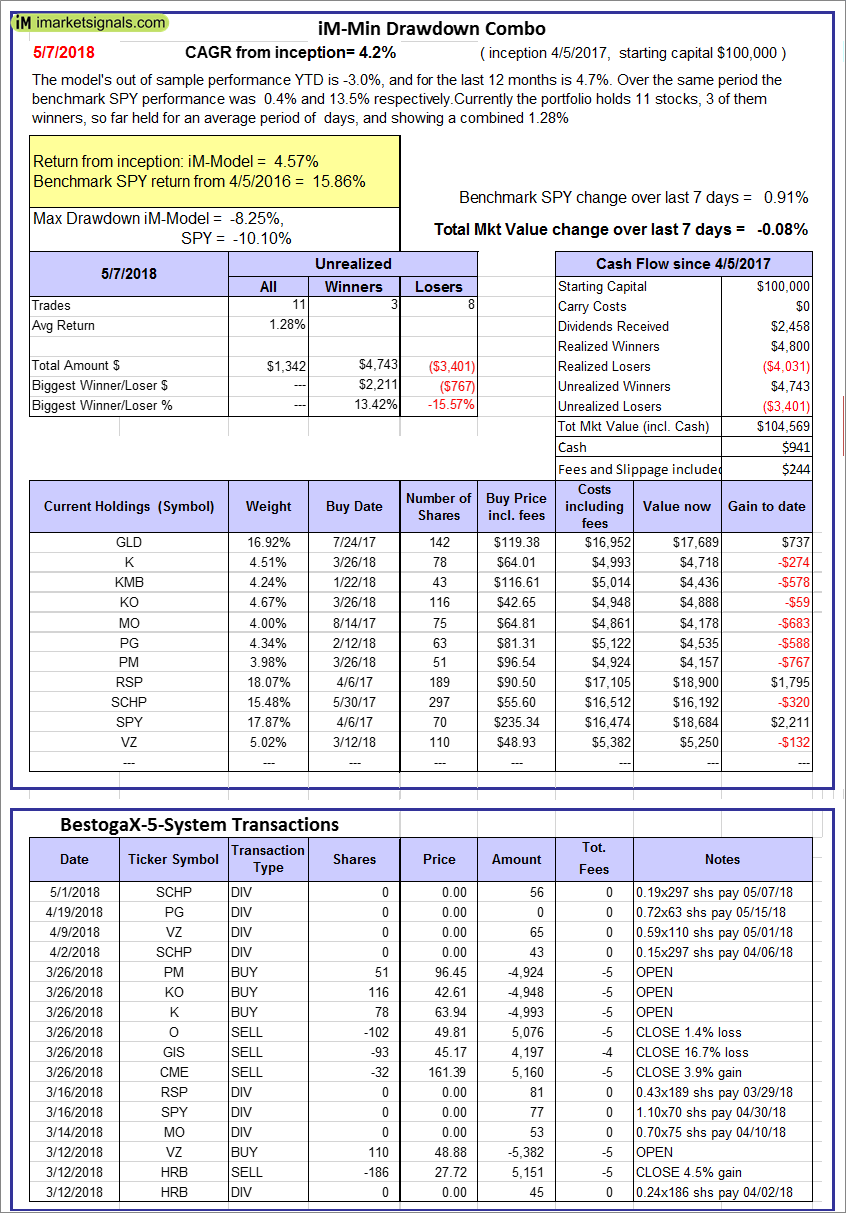
iM-Min Drawdown Combo: The model’s out of sample performance YTD is -3.0%, and for the last 12 months is 4.7%. Over the same period the benchmark SPY performance was 0.4% and 13.5% respectively. Over the previous week the market value of the iM-Min Drawdown Combo gained -0.08% at a time when SPY gained 0.91%. A starting capital of $100,000 at inception on 4/5/2017 would have grown to $104,569 which includes $941 cash and excludes $244 spent on fees and slippage. |
|
|
iM-5ETF Trader (includes leveraged ETFs): The model’s out of sample performance YTD is 1.7%, and for the last 12 months is 26.7%. Over the same period the benchmark SPY performance was 0.4% and 13.5% respectively. Over the previous week the market value of the iM-5ETF Trader (includes leveraged ETFs) gained 2.99% at a time when SPY gained 0.91%. A starting capital of $100,000 at inception on 10/30/2016 would have grown to $165,468 which includes $1,298 cash and excludes $1,030 spent on fees and slippage. |
|
|
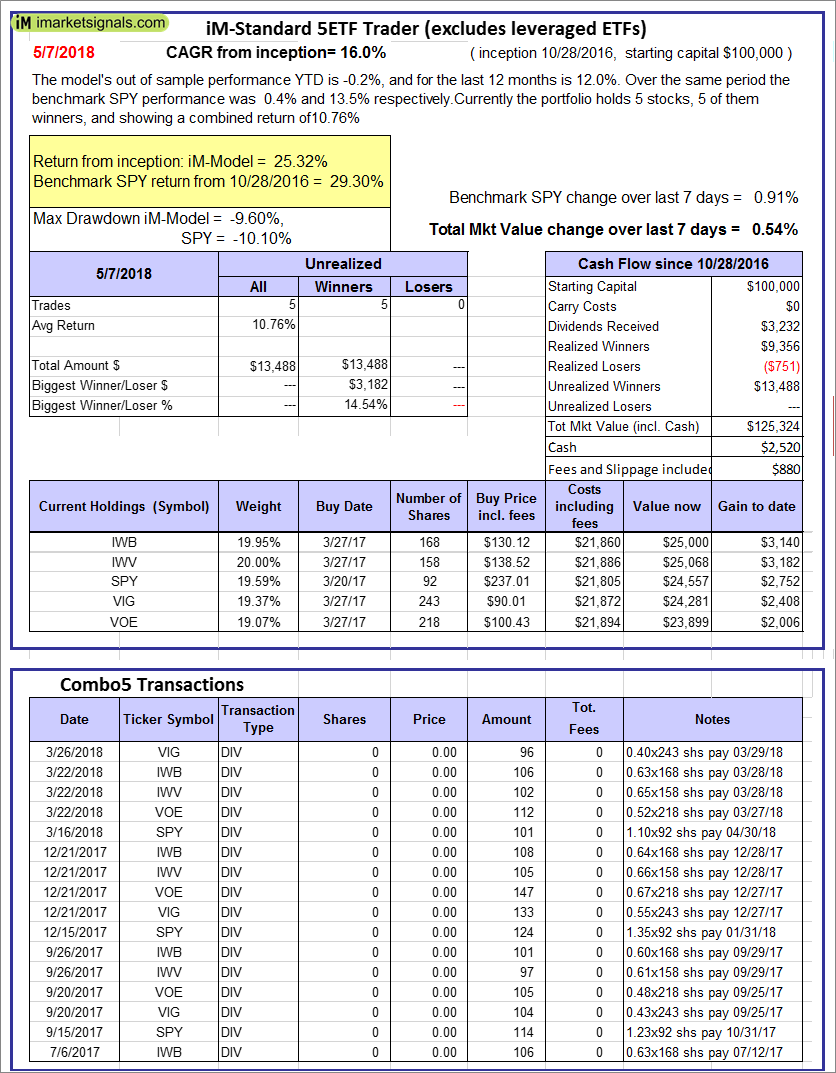
iM-Standard 5ETF Trader (excludes leveraged ETFs): The model’s out of sample performance YTD is -0.2%, and for the last 12 months is 12.0%. Over the same period the benchmark SPY performance was 0.4% and 13.5% respectively. Over the previous week the market value of the iM-Standard 5ETF Trader (excludes leveraged ETFs) gained 0.54% at a time when SPY gained 0.91%. A starting capital of $100,000 at inception on 10/30/2016 would have grown to $125,324 which includes $2,520 cash and excludes $880 spent on fees and slippage. |


Leave a Reply
You must be logged in to post a comment.