
  |
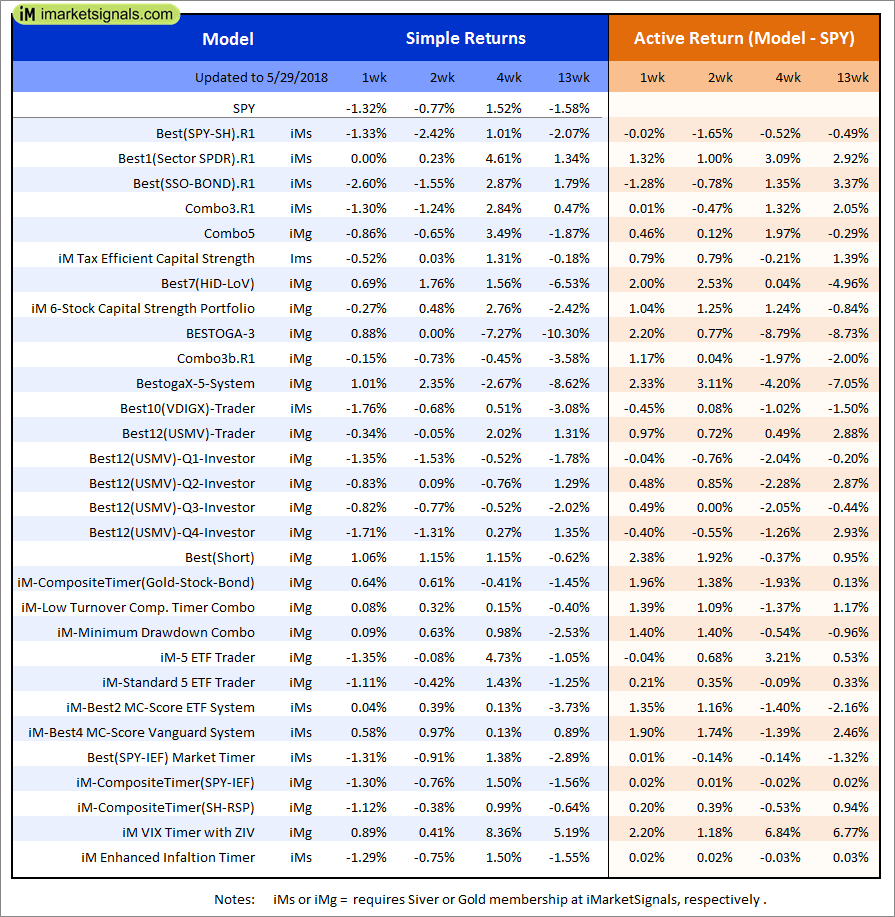
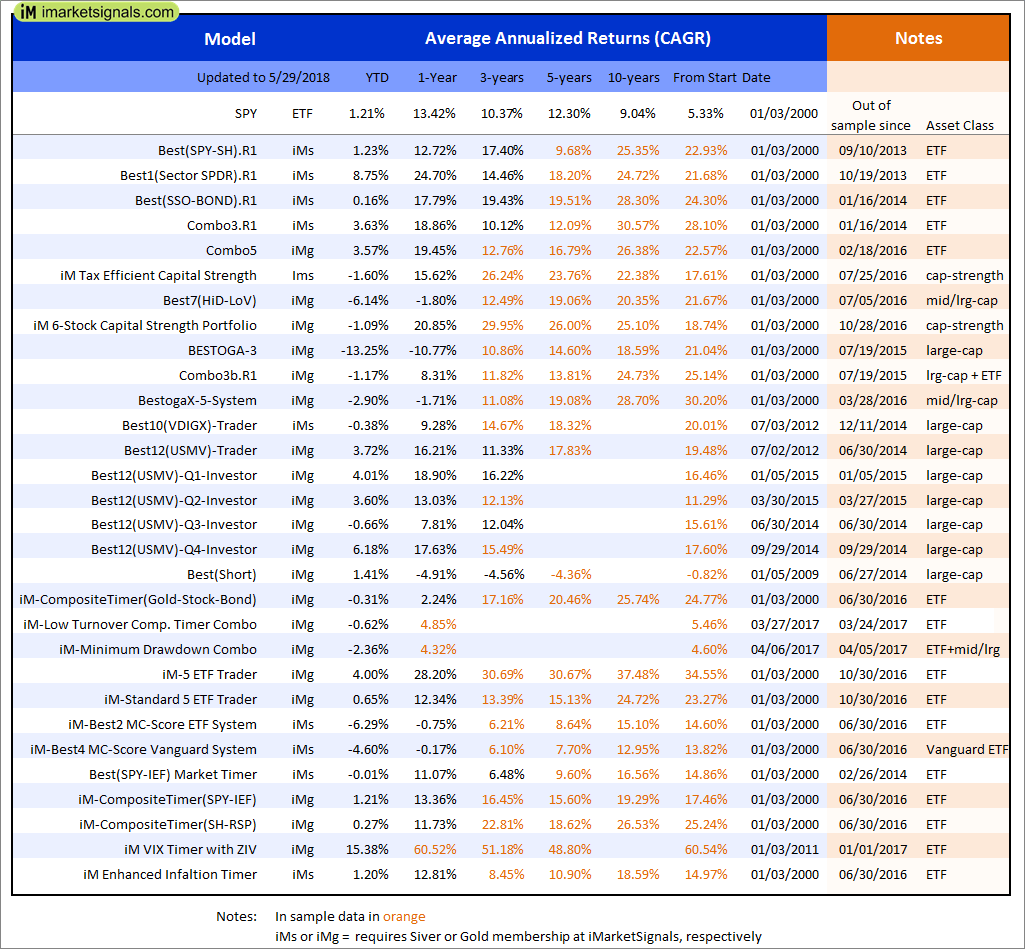
Out of sample performance summary of our models for the past 1, 2, 4 and 13 week periods. The active active return indicates how the models over- or underperformed the benchmark ETF SPY. Also the YTD, and the 1-, 3-, 5- and 10-year annualized returns are shown in the second table |
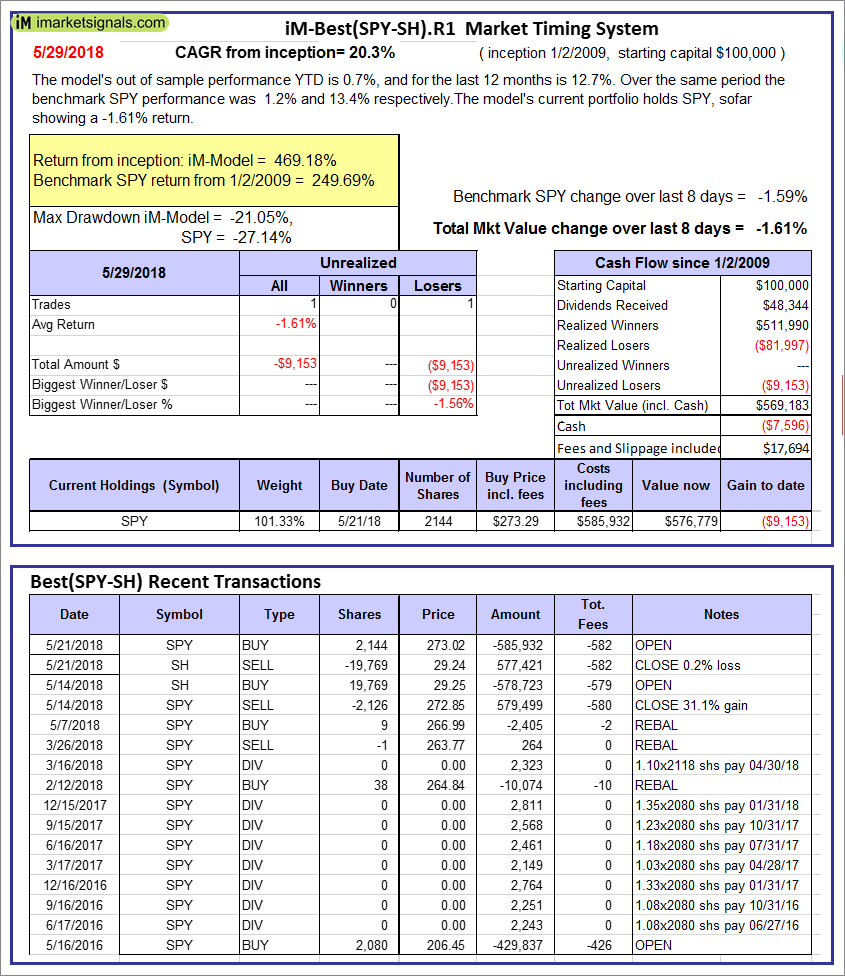 |
iM-Best(SPY-SH).R1: The model’s out of sample performance YTD is 0.7%, and for the last 12 months is 12.7%. Over the same period the benchmark SPY performance was 1.2% and 13.4% respectively. Over the previous week the market value of Best(SPY-SH) gained -1.61% at a time when SPY gained -1.59%. A starting capital of $100,000 at inception on 1/2/2009 would have grown to $569,183 which includes -$7,596 cash and excludes $17,694 spent on fees and slippage. |
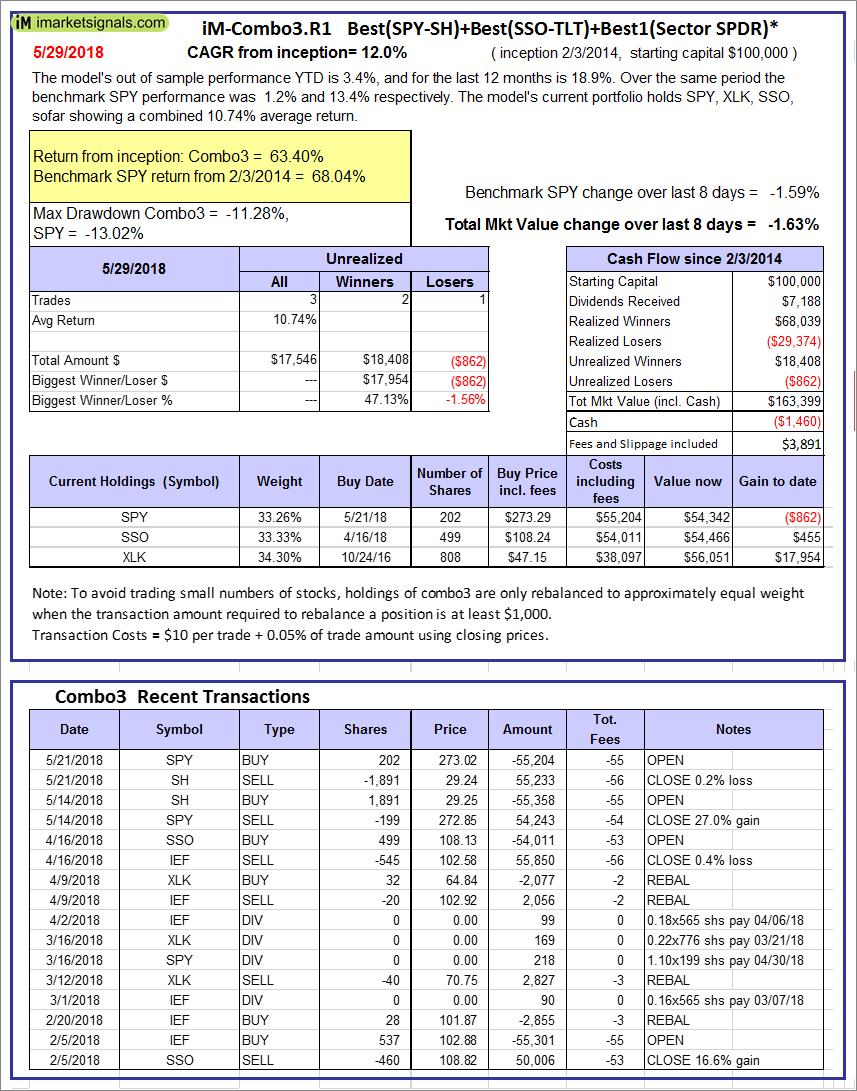 |
iM-Combo3.R1: The model’s out of sample performance YTD is 3.4%, and for the last 12 months is 18.9%. Over the same period the benchmark SPY performance was 1.2% and 13.4% respectively. Over the previous week the market value of iM-Combo3.R1 gained -1.63% at a time when SPY gained -1.59%. A starting capital of $100,000 at inception on 2/3/2014 would have grown to $163,399 which includes -$1,460 cash and excludes $3,891 spent on fees and slippage. |
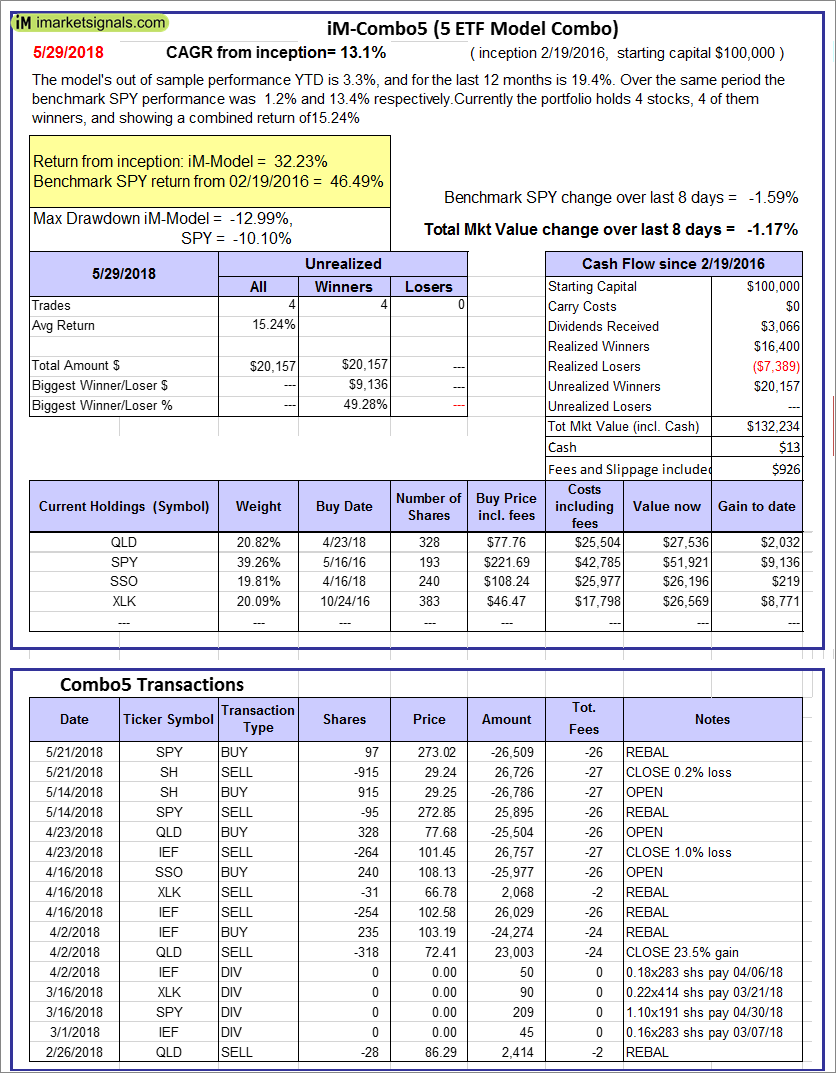 |
iM-Combo5: The model’s out of sample performance YTD is 3.3%, and for the last 12 months is 19.4%. Over the same period the benchmark SPY performance was 1.2% and 13.4% respectively. Over the previous week the market value of iM-Combo5 gained -1.17% at a time when SPY gained -1.59%. A starting capital of $100,000 at inception on 2/22/2016 would have grown to $132,234 which includes $13 cash and excludes $926 spent on fees and slippage. |
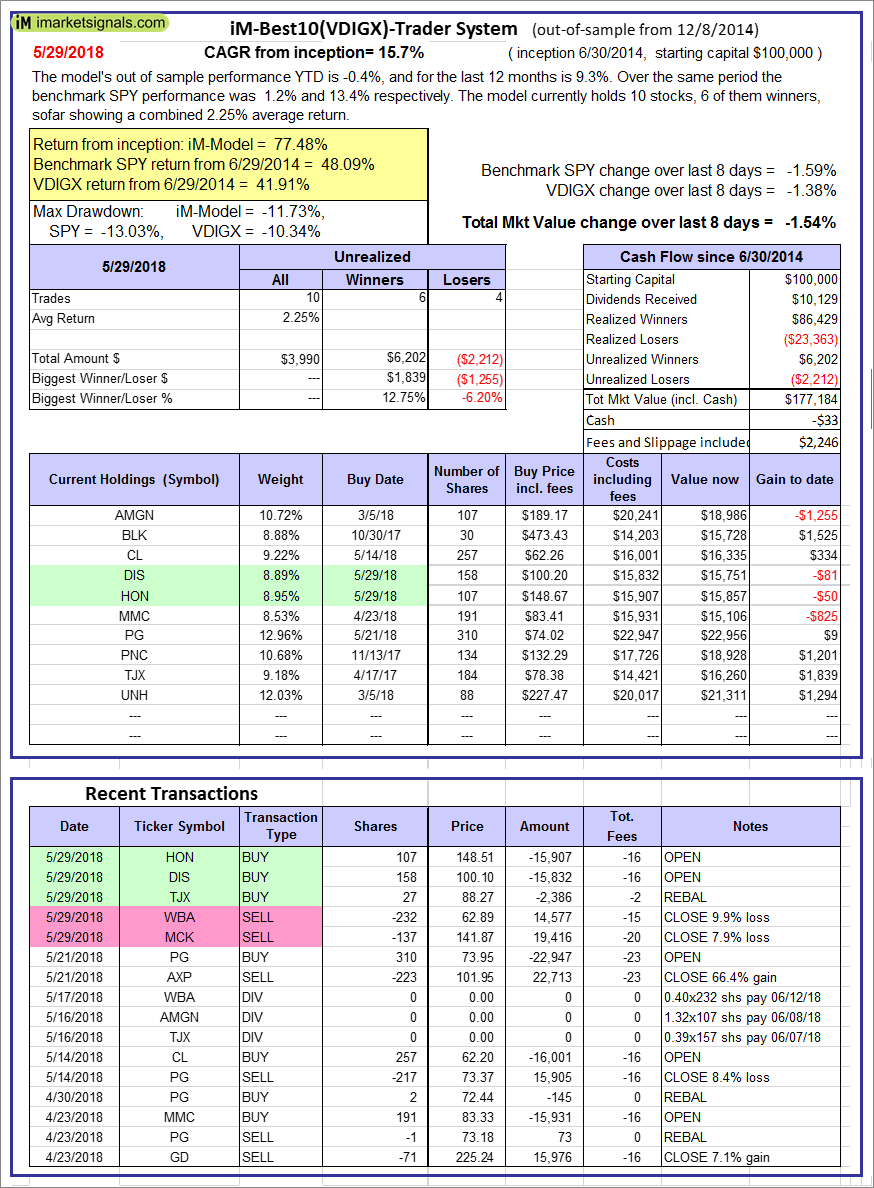 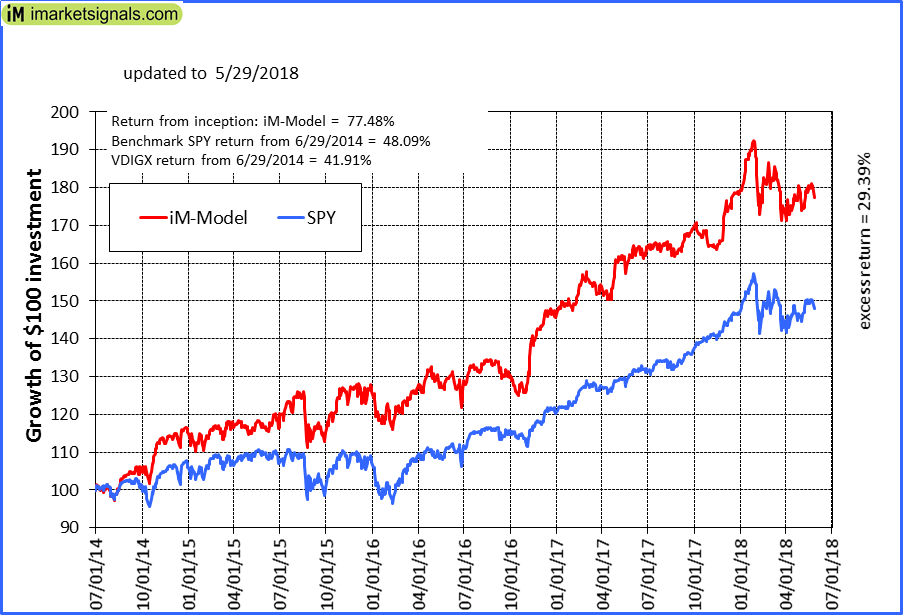 |
iM-Best10(VDIGX)-Trader: The model’s out of sample performance YTD is -0.4%, and for the last 12 months is 9.3%. Over the same period the benchmark SPY performance was 1.2% and 13.4% respectively. Since inception, on 7/1/2014, the model gained 77.48% while the benchmark SPY gained 48.09% and VDIGX gained 41.91% over the same period. Over the previous week the market value of iM-Best10(VDIGX) gained -1.54% at a time when SPY gained -1.59%. A starting capital of $100,000 at inception on 7/1/2014 would have grown to $177,184 which includes -$33 cash and excludes $2,246 spent on fees and slippage. |
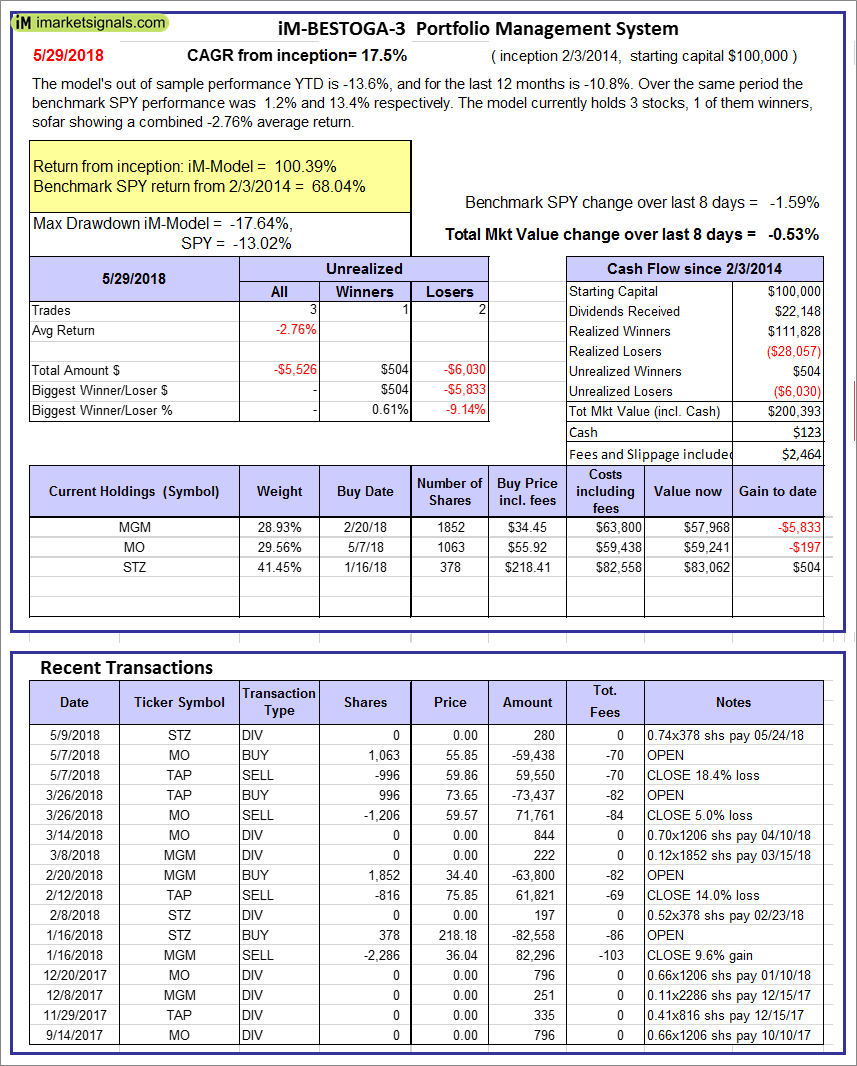 |
iM-BESTOGA-3: The model’s out of sample performance YTD is -13.6%, and for the last 12 months is -10.8%. Over the same period the benchmark SPY performance was 1.2% and 13.4% respectively. Over the previous week the market value of iM-BESTOGA-3 gained -0.53% at a time when SPY gained -1.59%. A starting capital of $100,000 at inception on 2/3/2014 would have grown to $200,393 which includes $123 cash and excludes $2,464 spent on fees and slippage. |
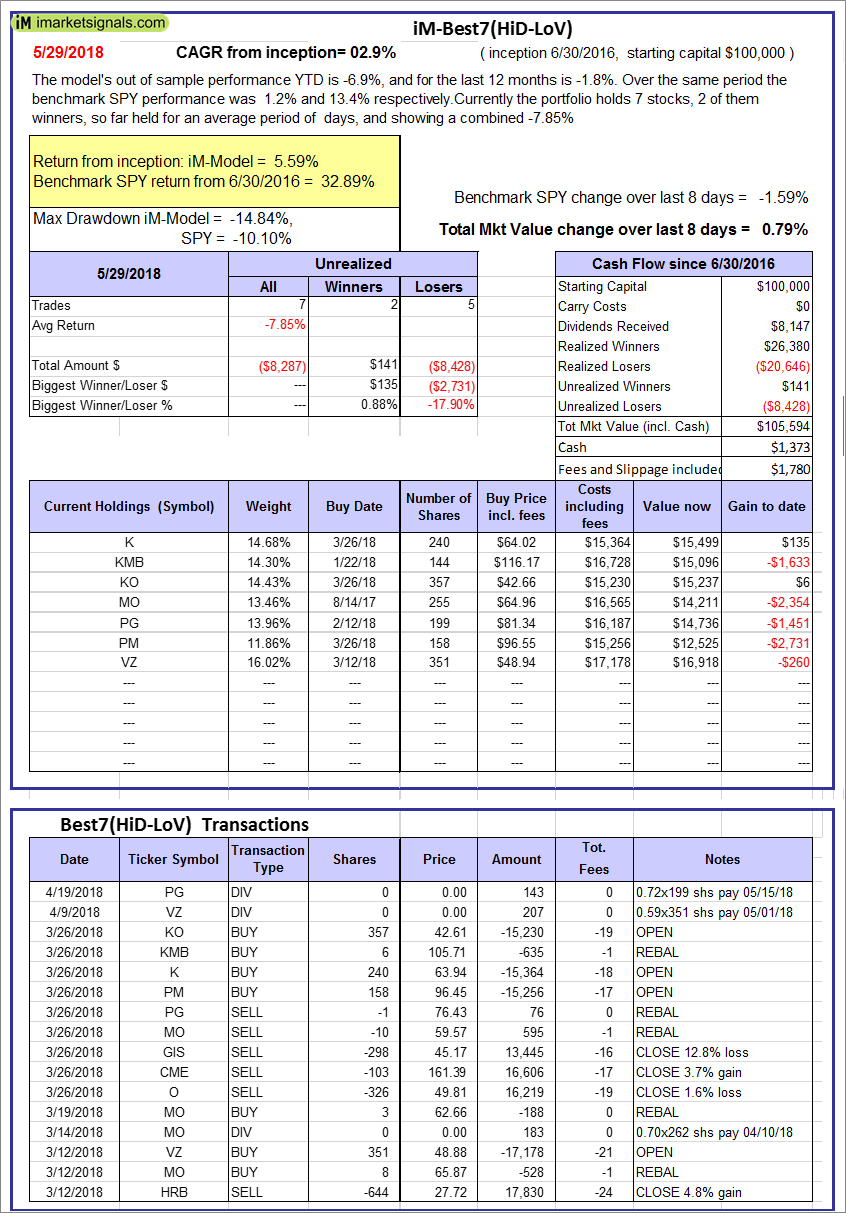 |
iM-Best7(HiD-LoV): The model’s out of sample performance YTD is -6.9%, and for the last 12 months is -1.8%. Over the same period the benchmark SPY performance was 1.2% and 13.4% respectively. Over the previous week the market value of iM-BESTOGA-3 gained 0.79% at a time when SPY gained -1.59%. A starting capital of $100,000 at inception on 6/30/2016 would have grown to $105,594 which includes $1,373 cash and excludes $1,780 spent on fees and slippage. |
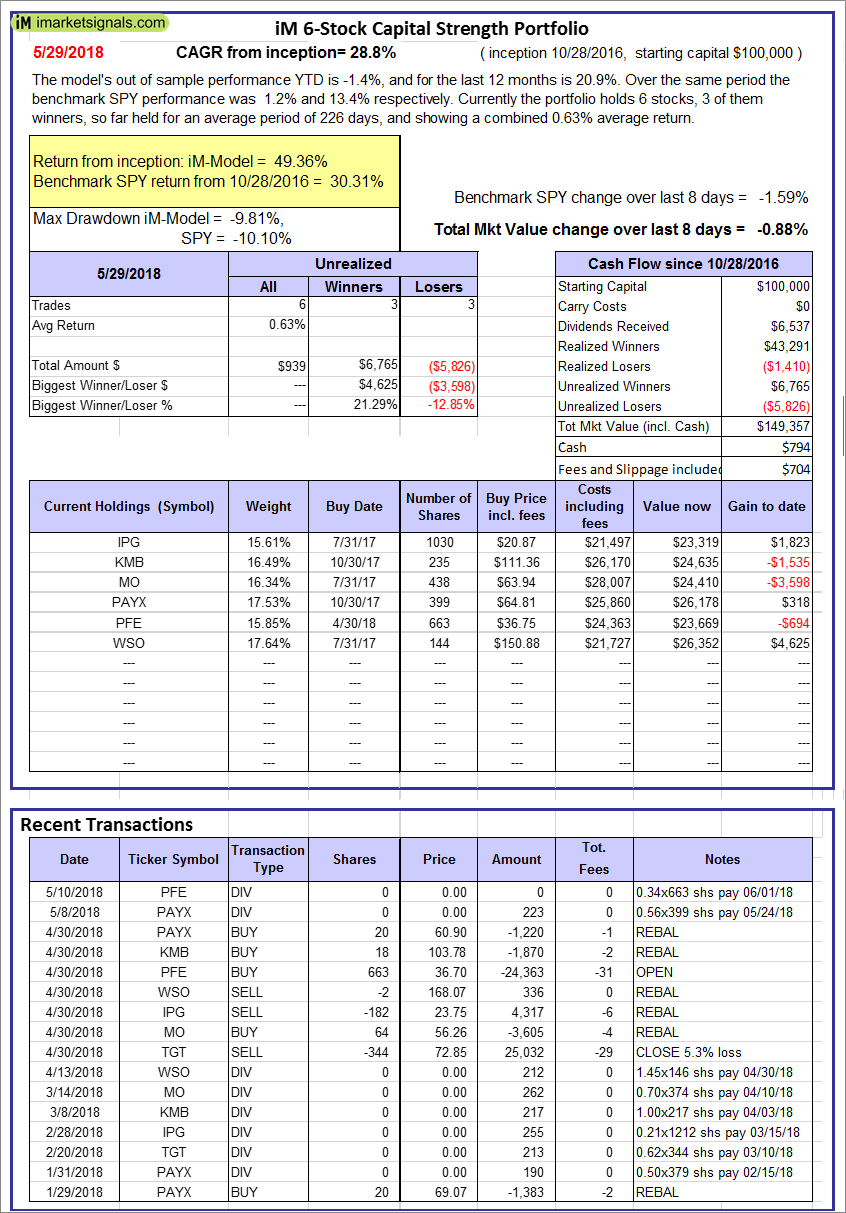 |
iM 6-Stock Capital Strength Portfolio: The model’s out of sample performance YTD is -1.4%, and for the last 12 months is 20.9%. Over the same period the benchmark SPY performance was 1.2% and 13.4% respectively. Over the previous week the market value of the iM 6-Stock Capital Strength Portfolio gained -0.88% at a time when SPY gained -1.59%. A starting capital of $100,000 at inception on 10/28/2016 would have grown to $149,357 which includes $794 cash and excludes $704 spent on fees and slippage. |
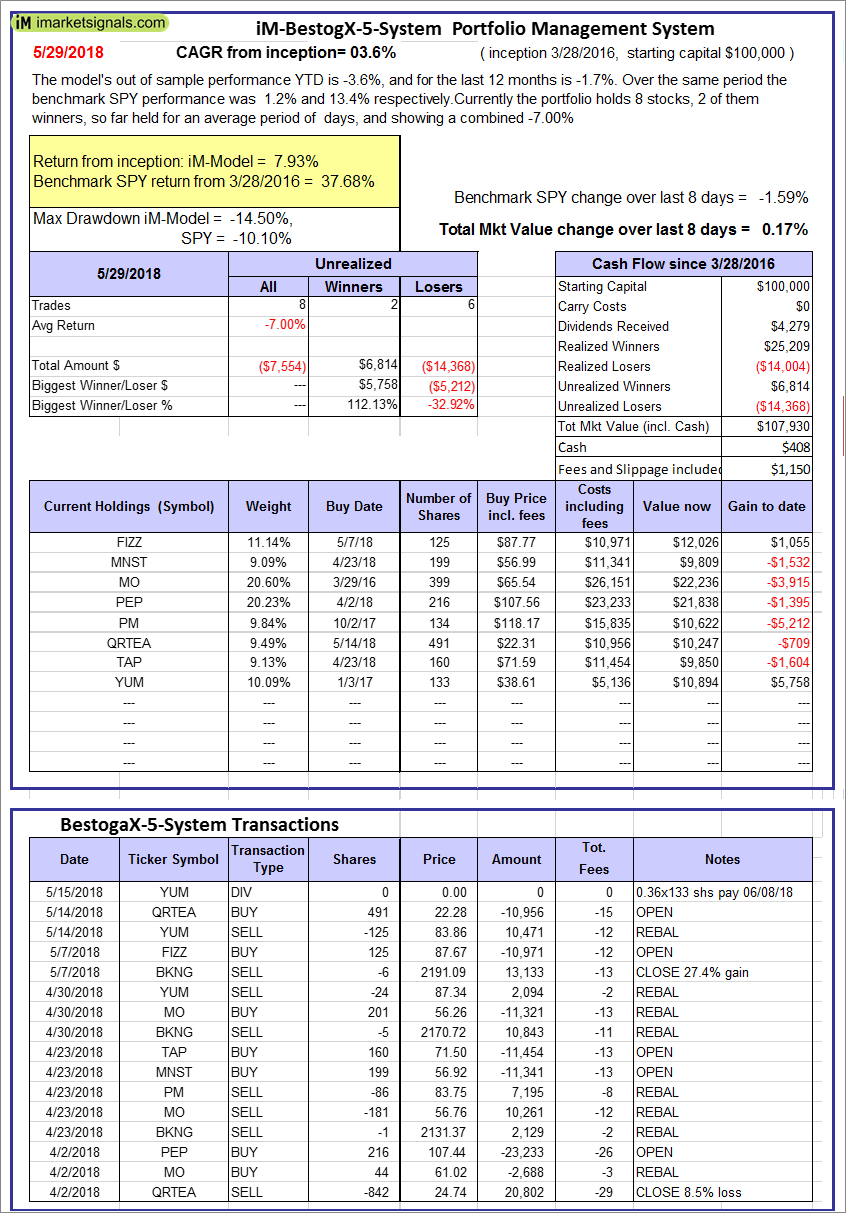 |
iM-BestogaX5-System: The model’s out of sample performance YTD is -3.6%, and for the last 12 months is -1.7%. Over the same period the benchmark SPY performance was 1.2% and 13.4% respectively. Over the previous week the market value of iM-BestogaX5-System gained 0.17% at a time when SPY gained -1.59%. A starting capital of $100,000 at inception on 3/28/2016 would have grown to $107,930 which includes $408 cash and excludes $1,150 spent on fees and slippage. |
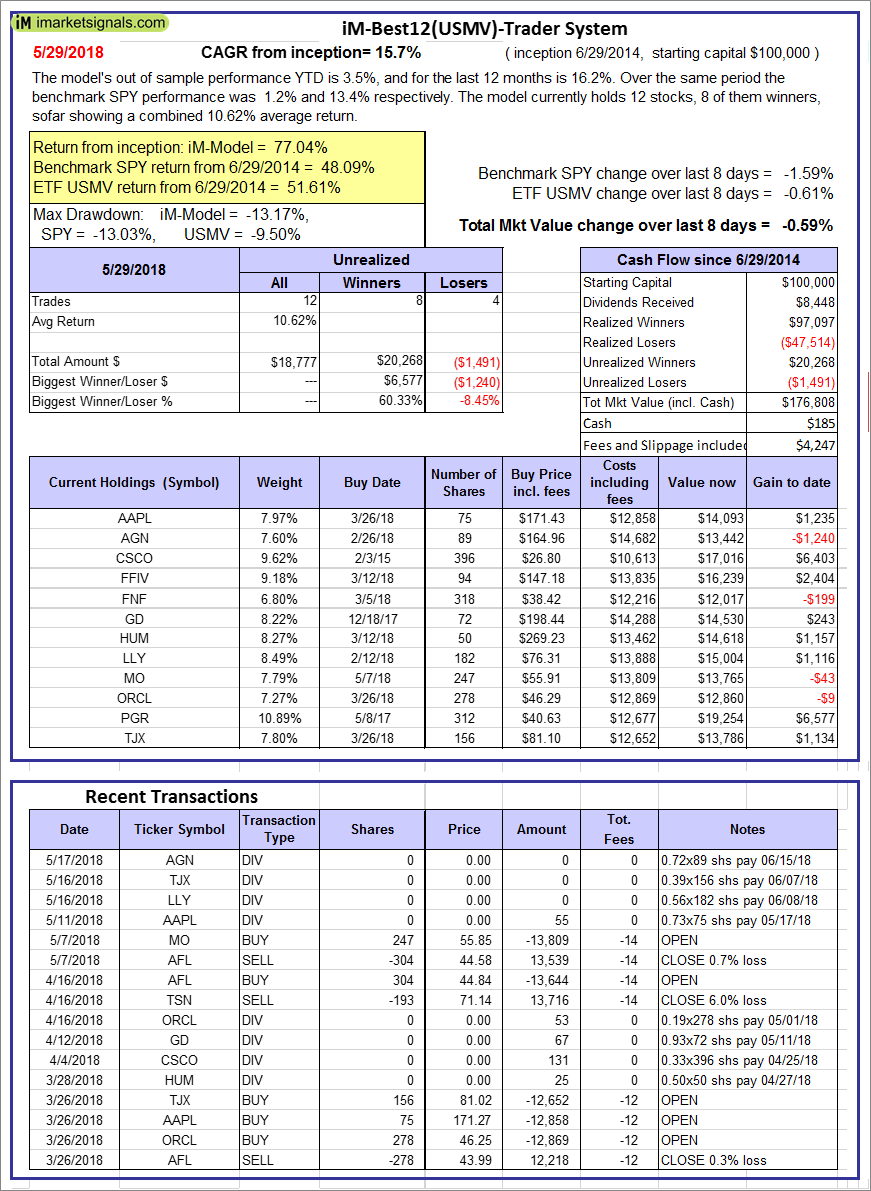 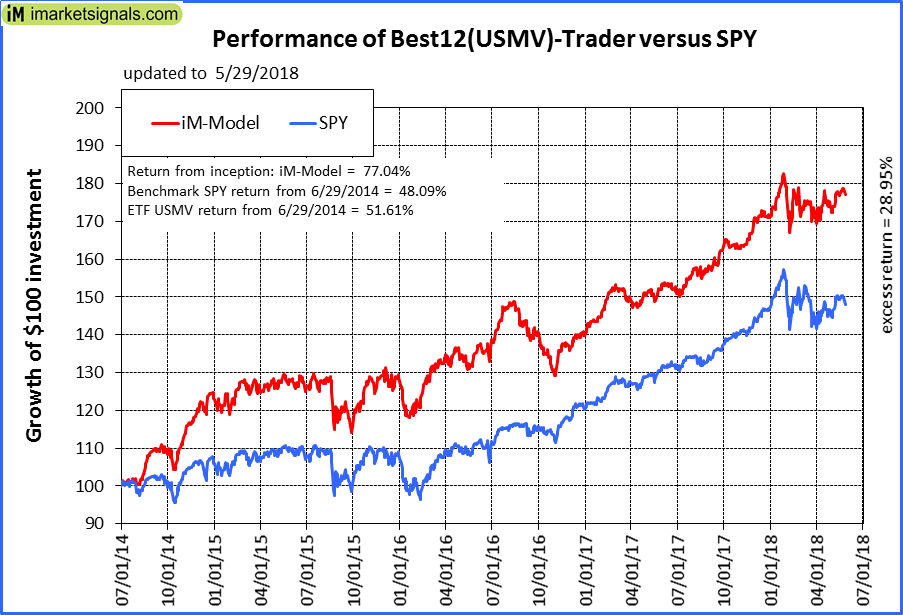 |
iM-Best12(USMV)-Trader: The model’s out of sample performance YTD is 3.5%, and for the last 12 months is 16.2%. Over the same period the benchmark SPY performance was 1.2% and 13.4% respectively. Since inception, on 6/30/2014, the model gained 77.04% while the benchmark SPY gained 48.09% and the ETF USMV gained 51.61% over the same period. Over the previous week the market value of iM-Best12(USMV)-Trader gained -0.59% at a time when SPY gained -1.59%. A starting capital of $100,000 at inception on 6/30/2014 would have grown to $176,808 which includes $185 cash and excludes $4,247 spent on fees and slippage. |
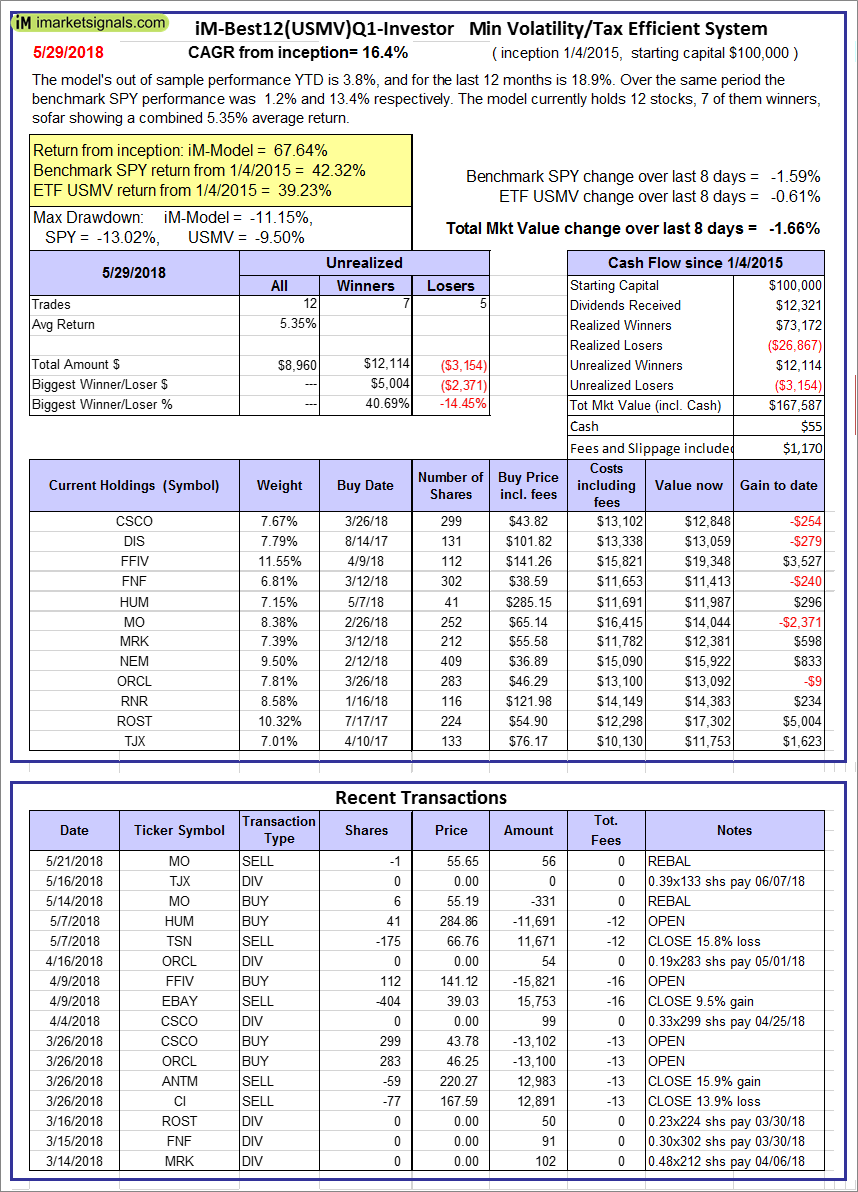 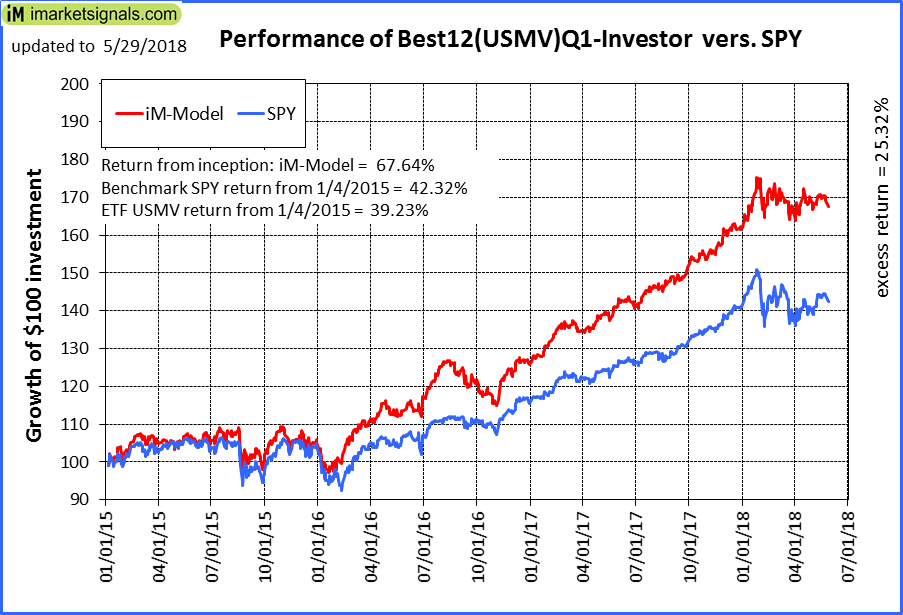 |
iM-Best12(USMV)Q1-Investor: The model’s out of sample performance YTD is 3.8%, and for the last 12 months is 18.9%. Over the same period the benchmark SPY performance was 1.2% and 13.4% respectively. Since inception, on 1/5/2015, the model gained 67.64% while the benchmark SPY gained 42.32% and the ETF USMV gained 39.23% over the same period. Over the previous week the market value of iM-Best12(USMV)Q1 gained -1.66% at a time when SPY gained -1.59%. A starting capital of $100,000 at inception on 1/5/2015 would have grown to $167,587 which includes $55 cash and excludes $1,170 spent on fees and slippage. |
 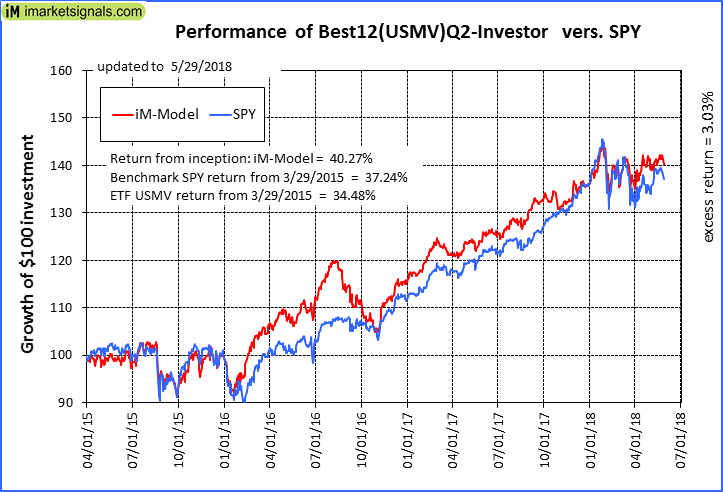 |
iM-Best12(USMV)Q2-Investor: The model’s out of sample performance YTD is 3.4%, and for the last 12 months is 13.0%. Over the same period the benchmark SPY performance was 1.2% and 13.4% respectively. Since inception, on 3/30/2015, the model gained 40.27% while the benchmark SPY gained 37.24% and the ETF USMV gained 34.48% over the same period. Over the previous week the market value of iM-Best12(USMV)Q2 gained -1.33% at a time when SPY gained -1.59%. A starting capital of $100,000 at inception on 3/30/2015 would have grown to $140,267 which includes $278 cash and excludes $976 spent on fees and slippage. |
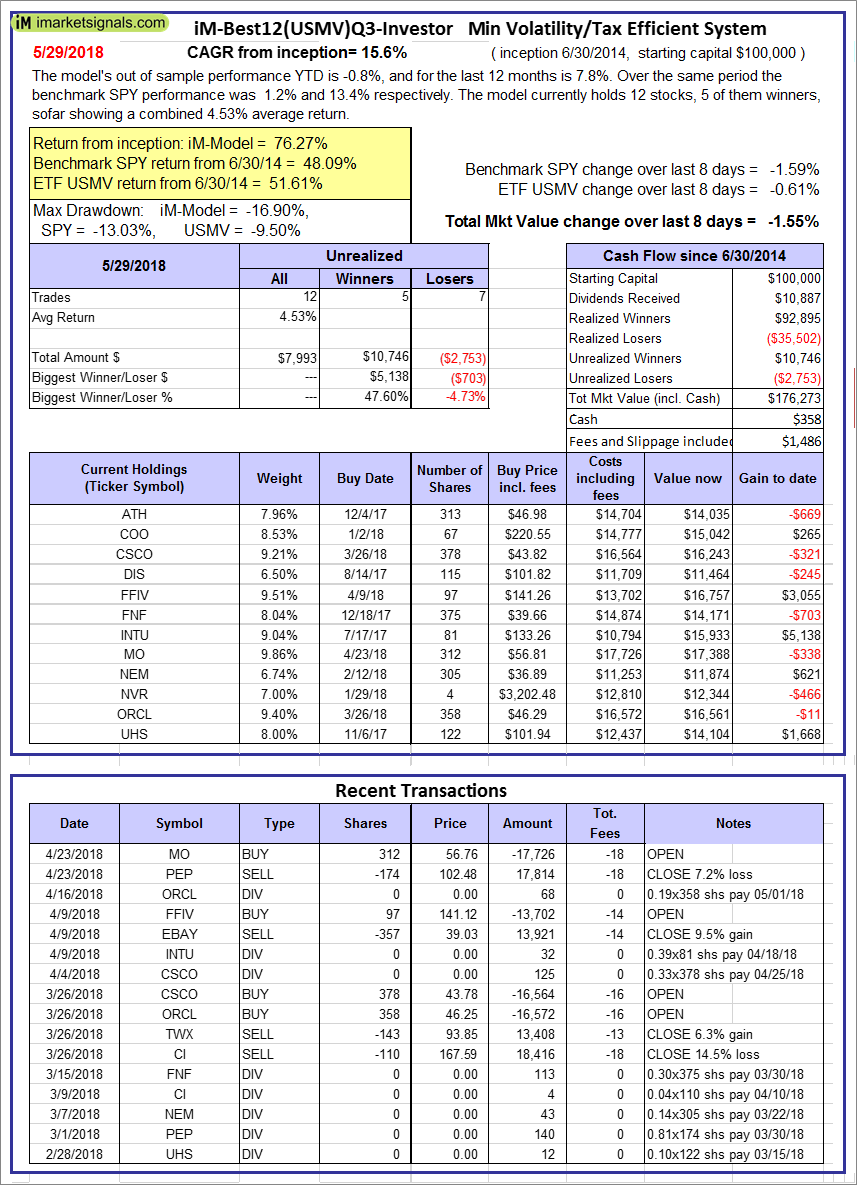 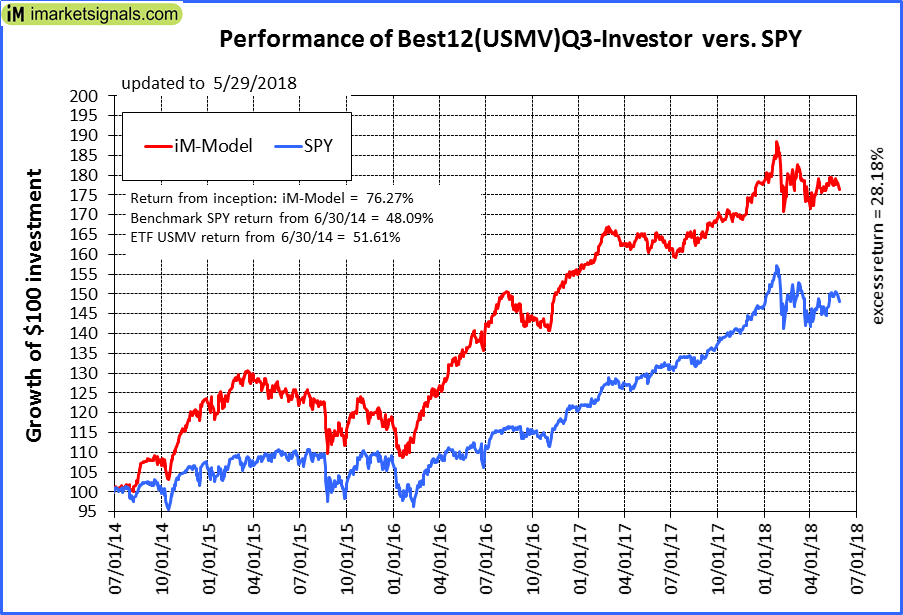 |
iM-Best12(USMV)Q3-Investor: The model’s out of sample performance YTD is -0.8%, and for the last 12 months is 7.8%. Over the same period the benchmark SPY performance was 1.2% and 13.4% respectively. Since inception, on 7/1/2014, the model gained 76.27% while the benchmark SPY gained 48.09% and the ETF USMV gained 51.61% over the same period. Over the previous week the market value of iM-Best12(USMV)Q3 gained -1.55% at a time when SPY gained -1.59%. A starting capital of $100,000 at inception on 7/1/2014 would have grown to $176,273 which includes $358 cash and excludes $1,486 spent on fees and slippage. |
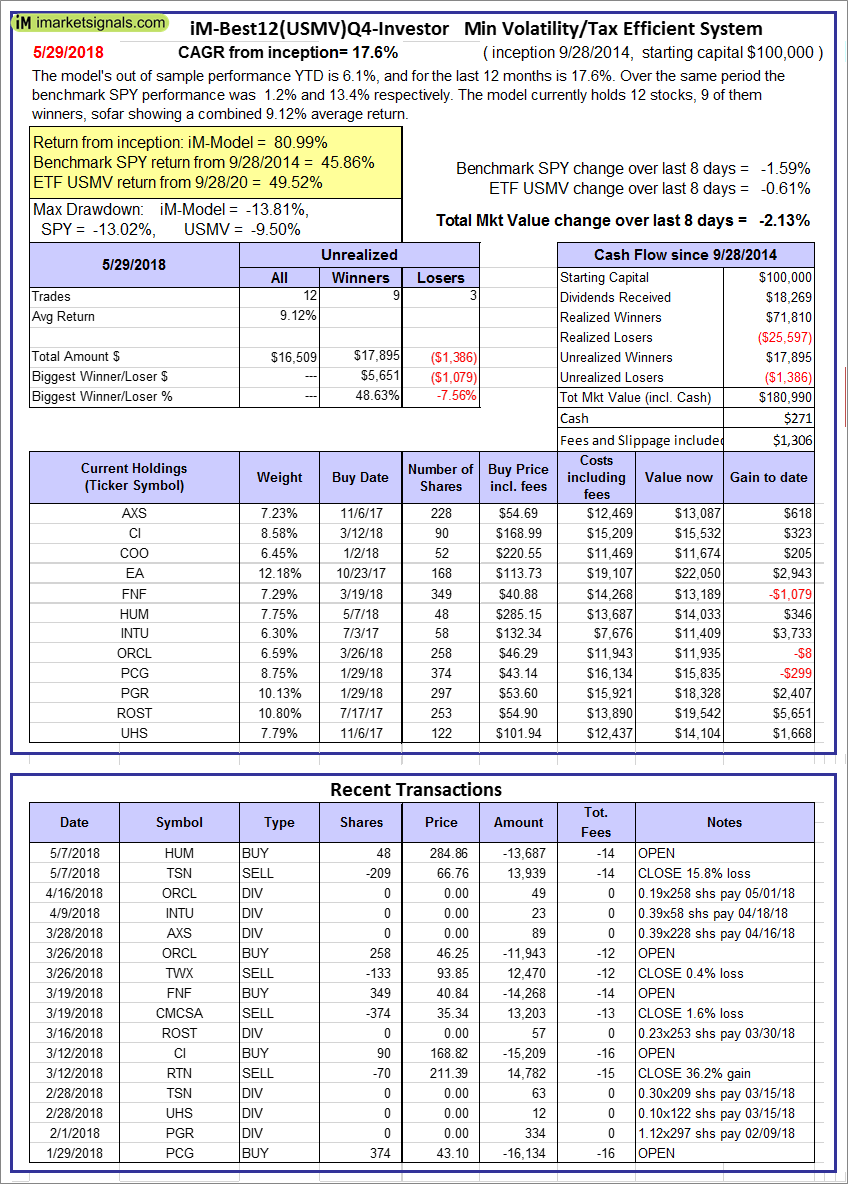 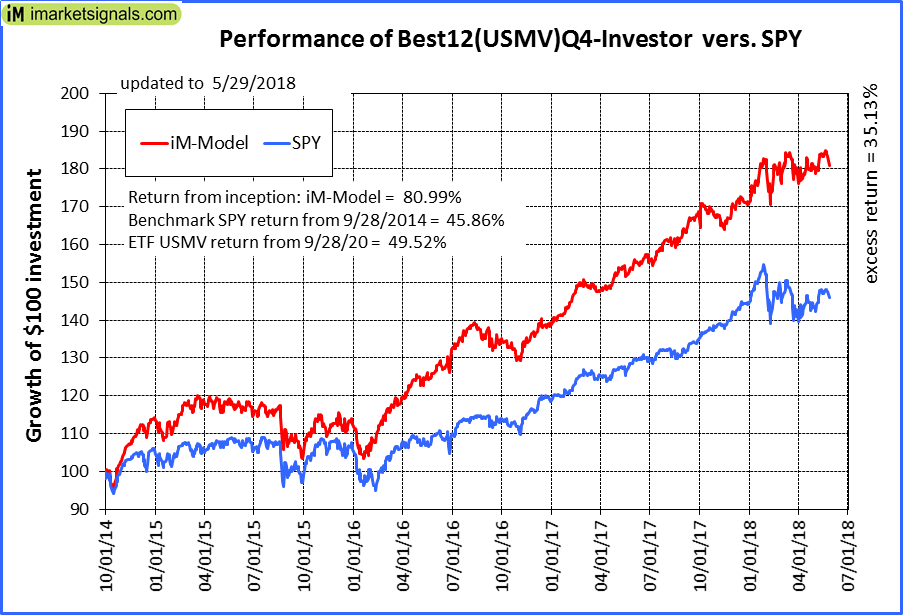 |
iM-Best12(USMV)Q4-Investor: Since inception, on 9/29/2014, the model gained 80.99% while the benchmark SPY gained 45.86% and the ETF USMV gained 49.52% over the same period. Over the previous week the market value of iM-Best12(USMV)Q4 gained -2.13% at a time when SPY gained -1.59%. A starting capital of $100,000 at inception on 9/29/2014 would have grown to $180,990 which includes $271 cash and excludes $1,306 spent on fees and slippage. |
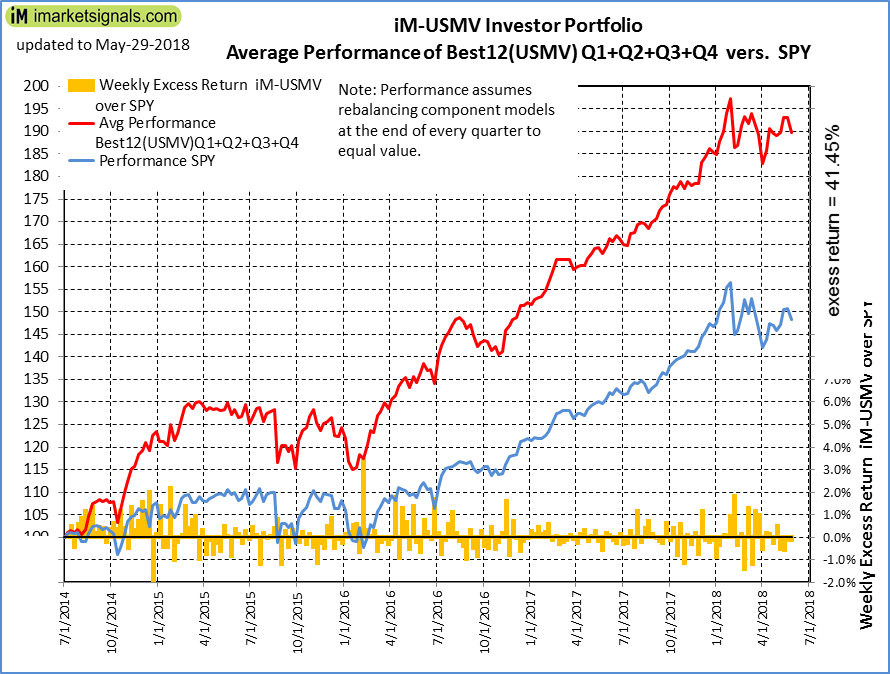 |
Average Performance of iM-Best12(USMV)Q1+Q2+Q3+Q4-Investor resulted in an excess return of 41.45% over SPY. (see iM-USMV Investor Portfolio) |
 |
iM-Best(Short): The model’s out of sample performance YTD is 1.4%, and for the last 12 months is -5.2%. Over the same period the benchmark SPY performance was 1.2% and 13.4% respectively. Over the previous week the market value of iM-Best(Short) gained 1.26% at a time when SPY gained -1.59%. Over the period 1/2/2009 to 5/29/2018 the starting capital of $100,000 would have grown to $92,513 which includes $127,798 cash and excludes $24,128 spent on fees and slippage. |
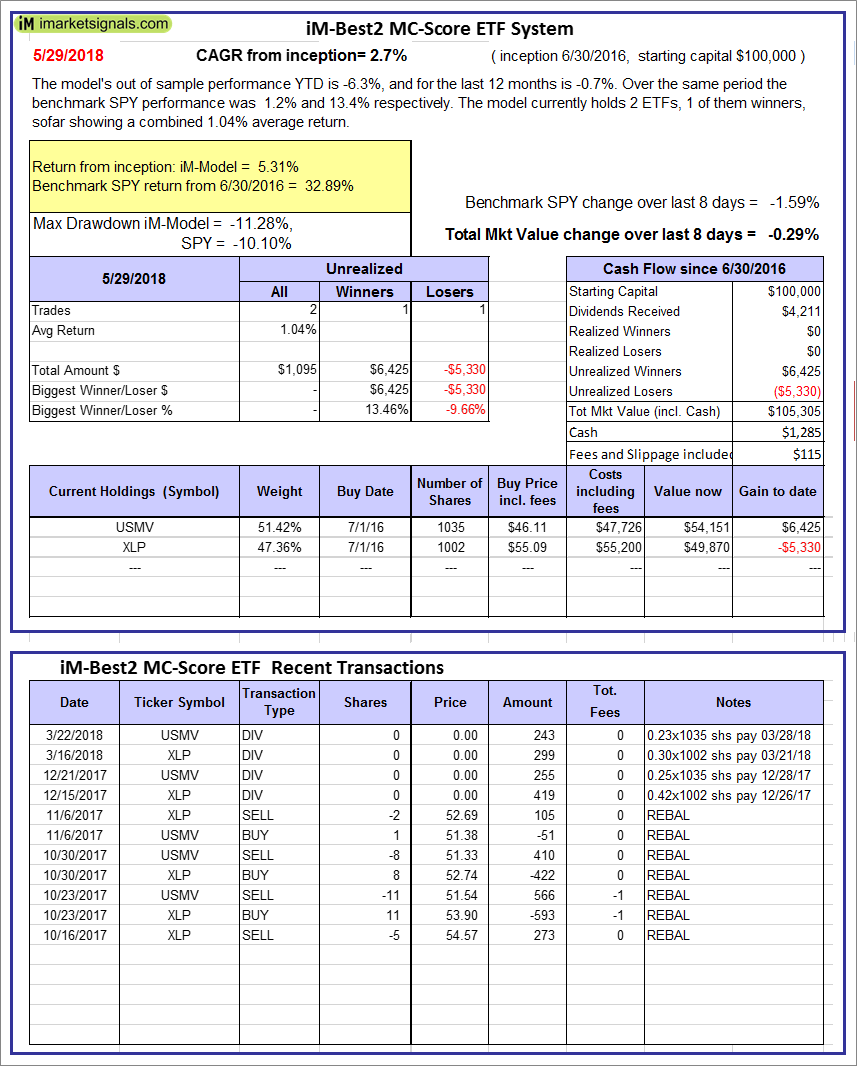 |
iM-Best2 MC-Score ETF System: The model’s out of sample performance YTD is -6.3%, and for the last 12 months is -0.7%. Over the same period the benchmark SPY performance was 1.2% and 13.4% respectively. Over the previous week the market value of the iM-Best2 MC-Score ETF System gained -0.29% at a time when SPY gained -1.59%. A starting capital of $100,000 at inception on 6/30/2016 would have grown to $105,305 which includes $1,285 cash and excludes $115 spent on fees and slippage. |
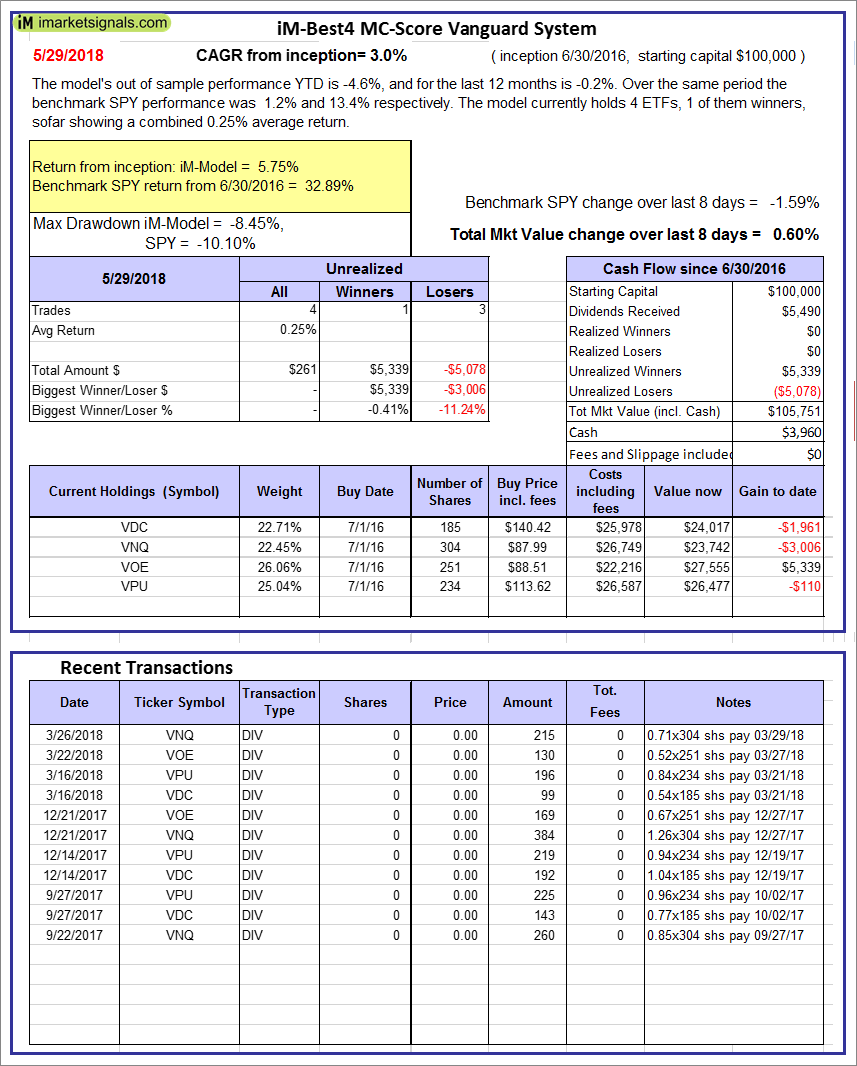 |
iM-Best4 MC-Score Vanguard System: The model’s out of sample performance YTD is -4.6%, and for the last 12 months is -0.2%. Over the same period the benchmark SPY performance was 1.2% and 13.4% respectively. Over the previous week the market value of the iM-Best4 MC-Score Vanguard System gained 0.60% at a time when SPY gained -1.59%. A starting capital of $100,000 at inception on 6/30/2016 would have grown to $105,751 which includes $3,960 cash and excludes $00 spent on fees and slippage. |
 |
iM-Composite (SH-RSP) Timer: The model’s out of sample performance YTD is 0.3%, and for the last 12 months is 11.3%. Over the same period the benchmark SPY performance was 1.2% and 13.4% respectively. Over the previous week the market value of the iM-Composite (SH-RSP) Timer gained -1.45% at a time when SPY gained -1.59%. A starting capital of $100,000 at inception on 6/30/2016 would have grown to $130,315 which includes $2,714 cash and excludes $513 spent on fees and slippage. |
 |
iM-Composite (SPY-IEF) Timer: The model’s out of sample performance YTD is 1.2%, and for the last 12 months is 13.3%. Over the same period the benchmark SPY performance was 1.2% and 13.4% respectively. Over the previous week the market value of the iM-Composite (SPY-IEF) Timer gained -1.57% at a time when SPY gained -1.59%. A starting capital of $100,000 at inception on 6/30/2016 would have grown to $134,938 which includes $2,042 cash and excludes $1,390 spent on fees and slippage. |
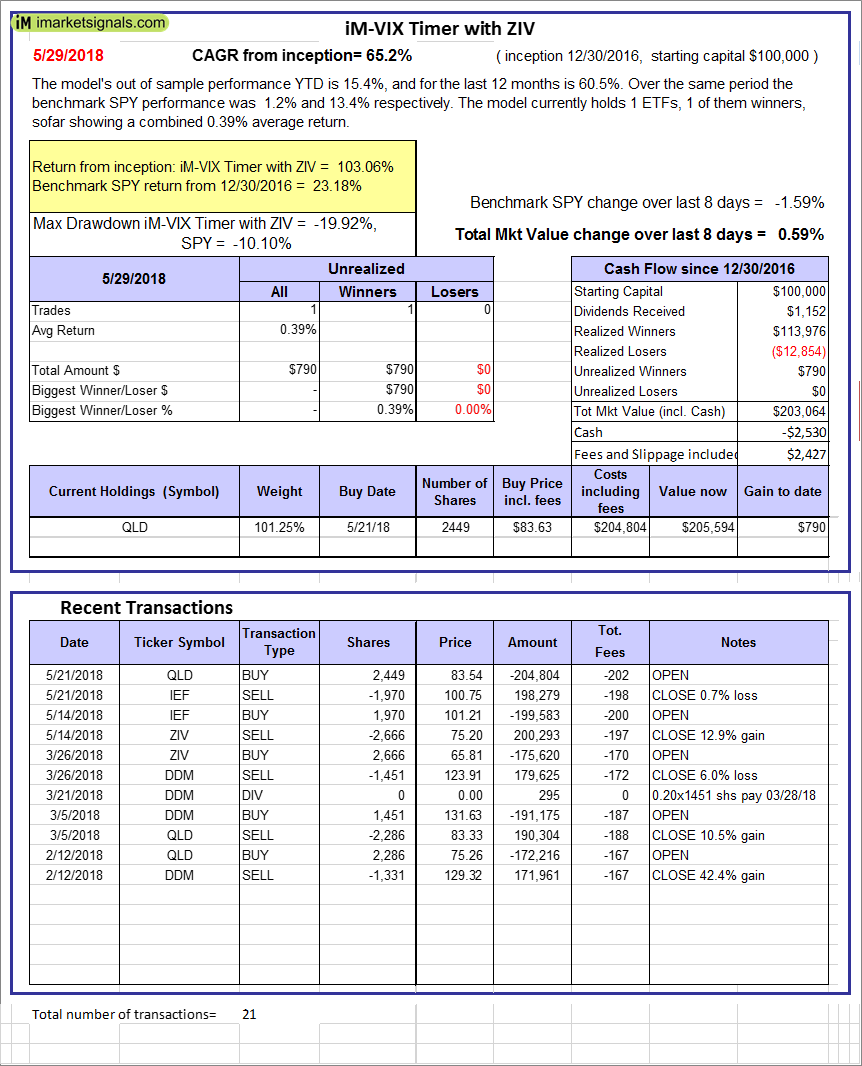 |
iM-VIX Timer with ZIV: The model’s out of sample performance YTD is 15.4%, and for the last 12 months is 60.5%. Over the same period the benchmark SPY performance was 1.2% and 13.4% respectively. Over the previous week the market value of the iM-VIX Timer with ZIV gained 0.59% at a time when SPY gained -1.59%. A starting capital of $100,000 at inception on 6/30/2016 would have grown to $203,064 which includes -$2,530 cash and excludes $2,427 spent on fees and slippage. |
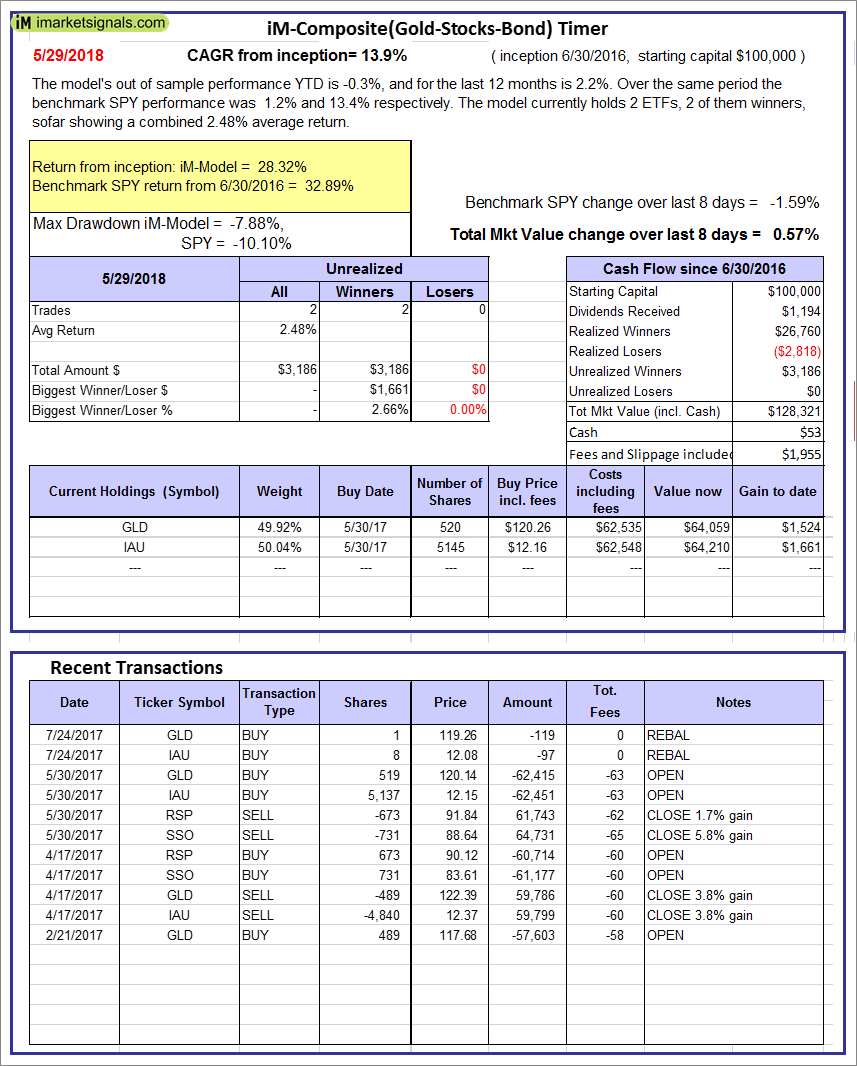 |
iM-Composite(Gold-Stocks-Bond) Timer: The model’s out of sample performance YTD is -0.3%, and for the last 12 months is 2.2%. Over the same period the benchmark SPY performance was 1.2% and 13.4% respectively. Over the previous week the market value of the iM-Composite(Gold-Stocks-Bond) Timer gained 0.57% at a time when SPY gained -1.59%. A starting capital of $100,000 at inception on 6/30/2016 would have grown to $128,321 which includes $53 cash and excludes $1,955 spent on fees and slippage. |
 |
iM-Low Turnover Composite Timer Combo: The model’s out of sample performance YTD is -0.6%, and for the last 12 months is 4.8%. Over the same period the benchmark SPY performance was 1.2% and 13.4% respectively. Over the previous week the market value of the iM-Low Turnover Composite Timer Combo gained -0.03% at a time when SPY gained -1.59%. A starting capital of $100,000 at inception on 3/24/27 would have grown to $106,420 which includes $1,986 cash and excludes $74 spent on fees and slippage. |
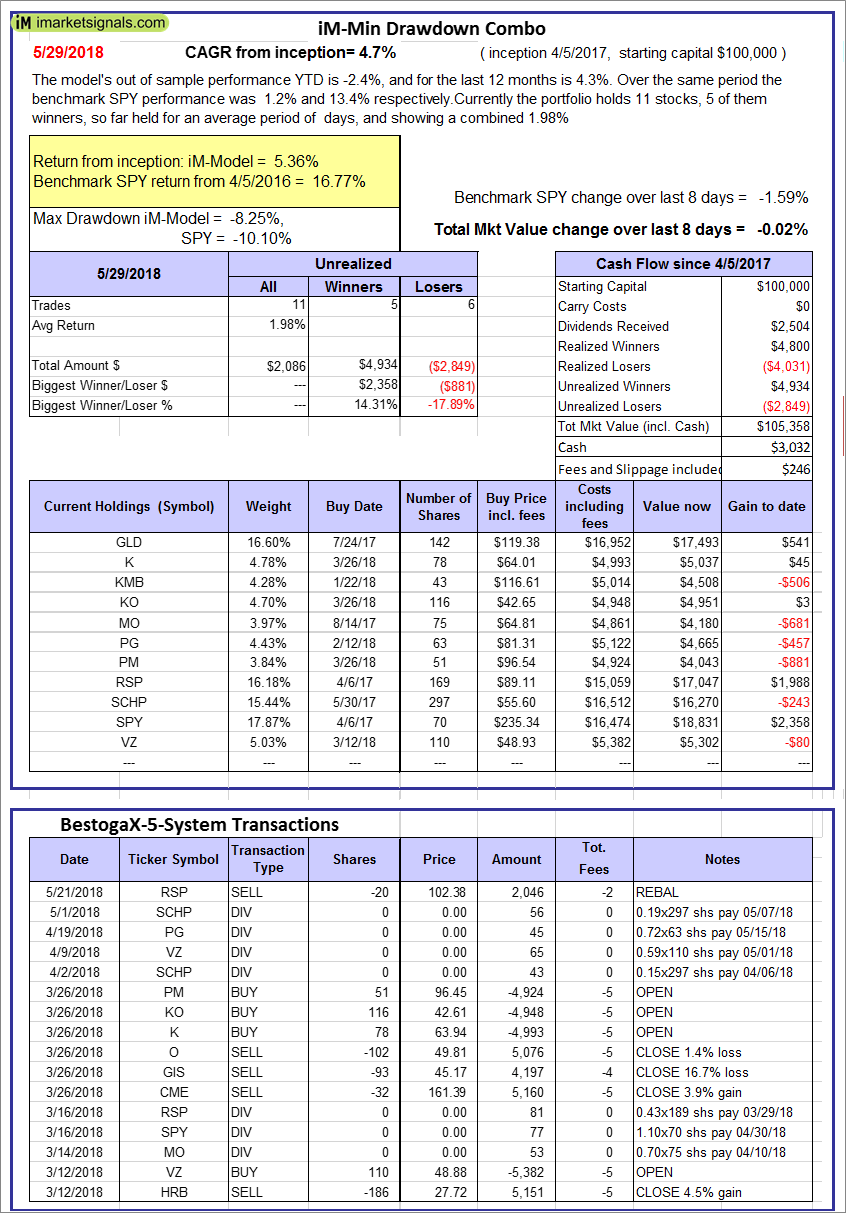 |
iM-Min Drawdown Combo: The model’s out of sample performance YTD is -2.4%, and for the last 12 months is 4.3%. Over the same period the benchmark SPY performance was 1.2% and 13.4% respectively. Over the previous week the market value of the iM-Min Drawdown Combo gained -0.02% at a time when SPY gained -1.59%. A starting capital of $100,000 at inception on 4/5/2017 would have grown to $105,358 which includes $3,032 cash and excludes $246 spent on fees and slippage. |
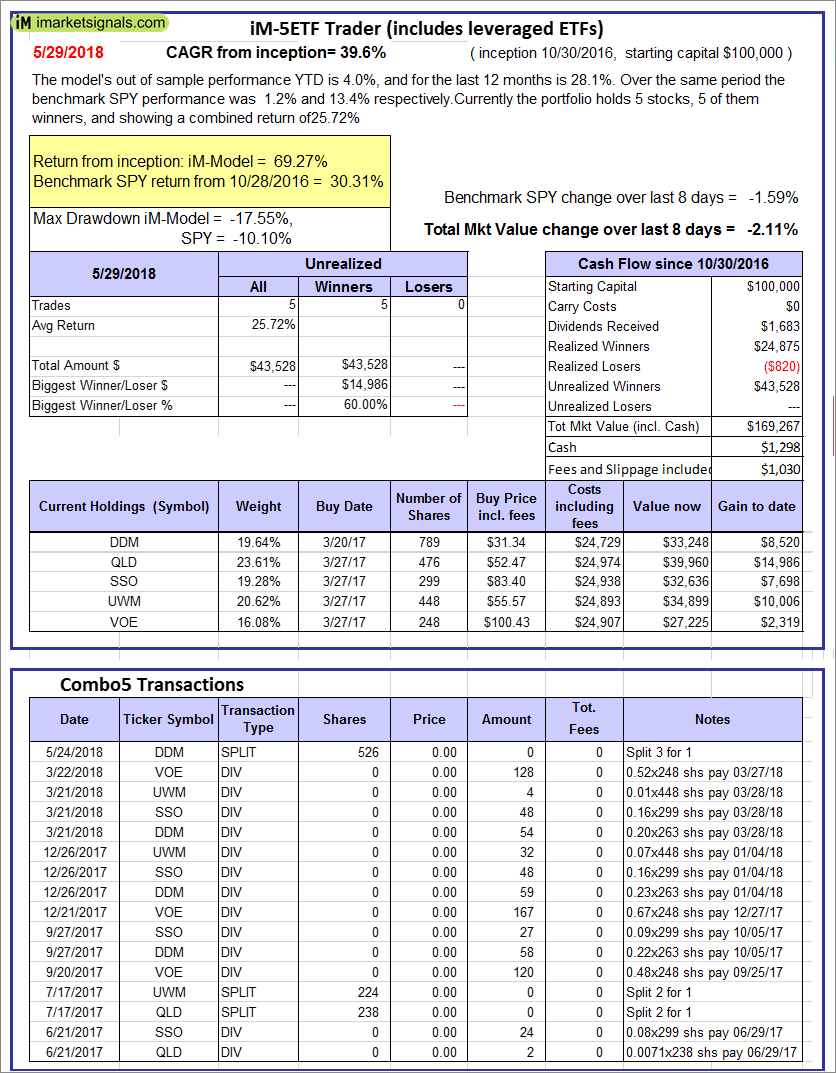 |
iM-5ETF Trader (includes leveraged ETFs): The model’s out of sample performance YTD is 4.0%, and for the last 12 months is 28.1%. Over the same period the benchmark SPY performance was 1.2% and 13.4% respectively. Over the previous week the market value of the iM-5ETF Trader (includes leveraged ETFs) gained -2.11% at a time when SPY gained -1.59%. A starting capital of $100,000 at inception on 10/30/2016 would have grown to $169,267 which includes $1,298 cash and excludes $1,030 spent on fees and slippage. |
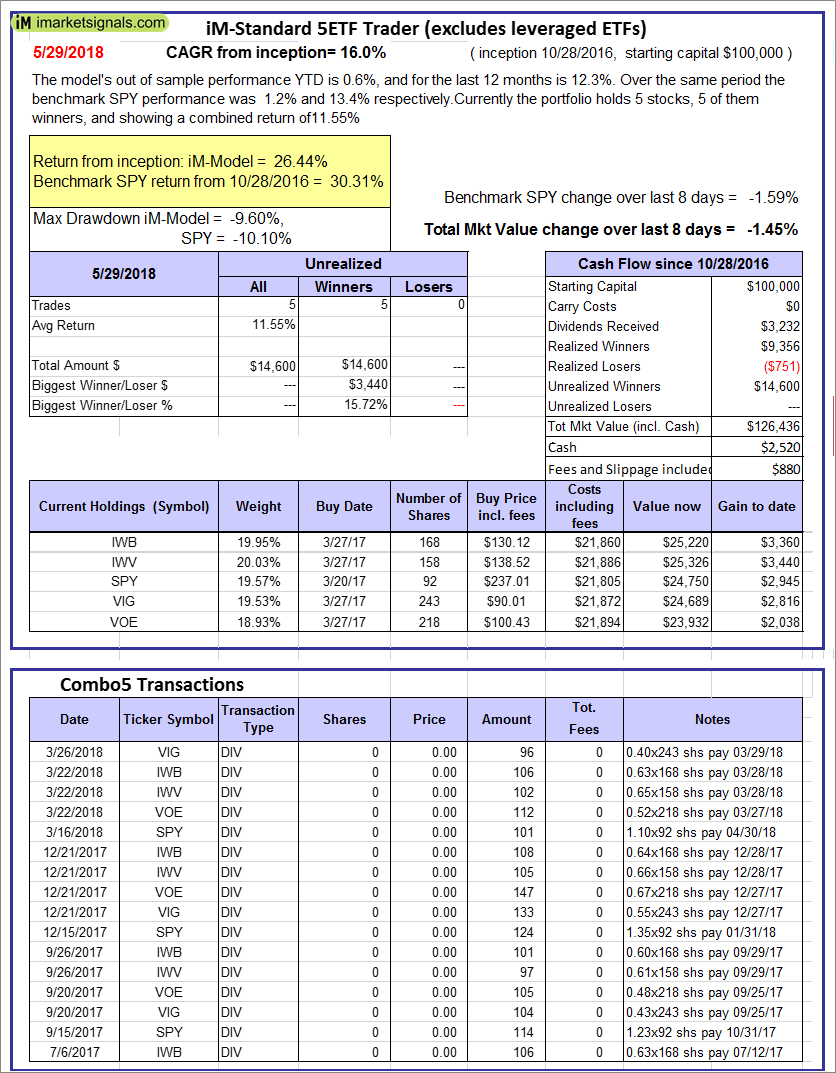 |
iM-Standard 5ETF Trader (excludes leveraged ETFs): The model’s out of sample performance YTD is 0.6%, and for the last 12 months is 12.3%. Over the same period the benchmark SPY performance was 1.2% and 13.4% respectively. Over the previous week the market value of the iM-Standard 5ETF Trader (excludes leveraged ETFs) gained -1.45% at a time when SPY gained -1.59%. A starting capital of $100,000 at inception on 10/30/2016 would have grown to $126,436 which includes $2,520 cash and excludes $880 spent on fees and slippage. |
iM-Best Reports – 5/29/2018
Posted in pmp SPY-SH
Leave a Reply
You must be logged in to post a comment.