
  |
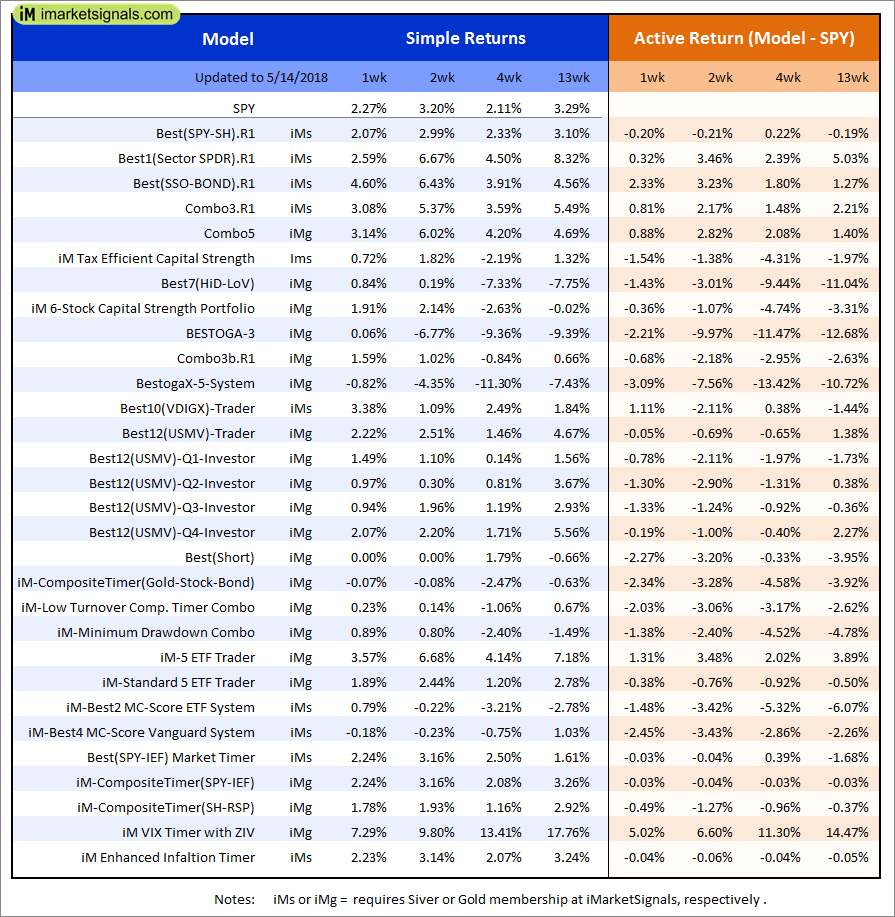
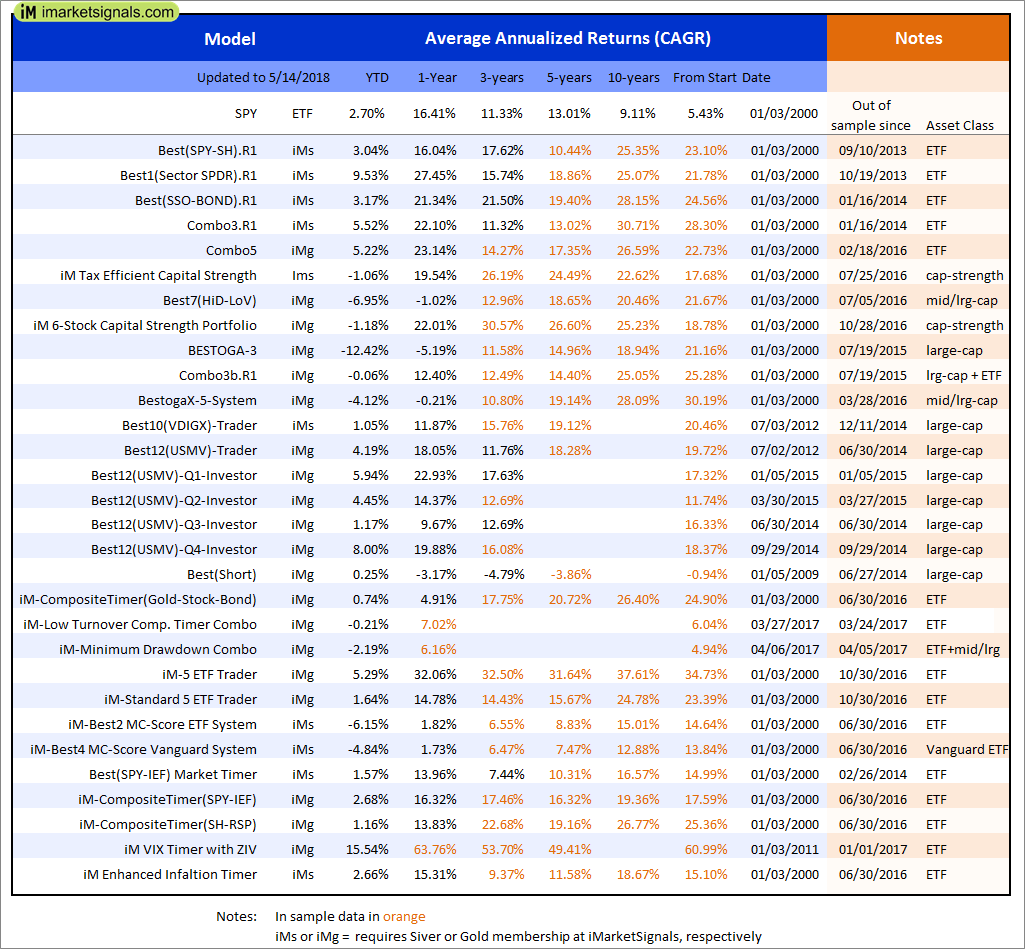
Out of sample performance summary of our models for the past 1, 2, 4 and 13 week periods. The active active return indicates how the models over- or underperformed the benchmark ETF SPY. Also the YTD, and the 1-, 3-, 5- and 10-year annualized returns are shown in the second table |
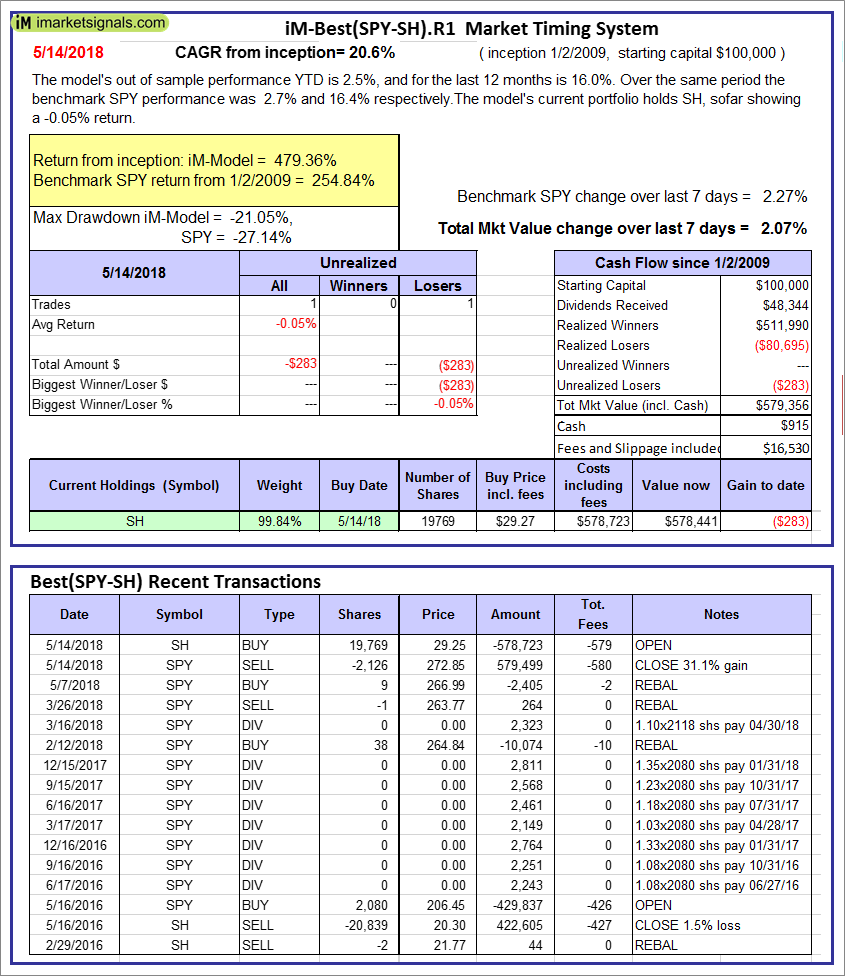 |
iM-Best(SPY-SH).R1: The model’s out of sample performance YTD is 2.5%, and for the last 12 months is 16.0%. Over the same period the benchmark SPY performance was 2.7% and 16.4% respectively. Over the previous week the market value of Best(SPY-SH) gained 2.07% at a time when SPY gained 2.27%. A starting capital of $100,000 at inception on 1/2/2009 would have grown to $579,356 which includes $915 cash and excludes $16,530 spent on fees and slippage. |
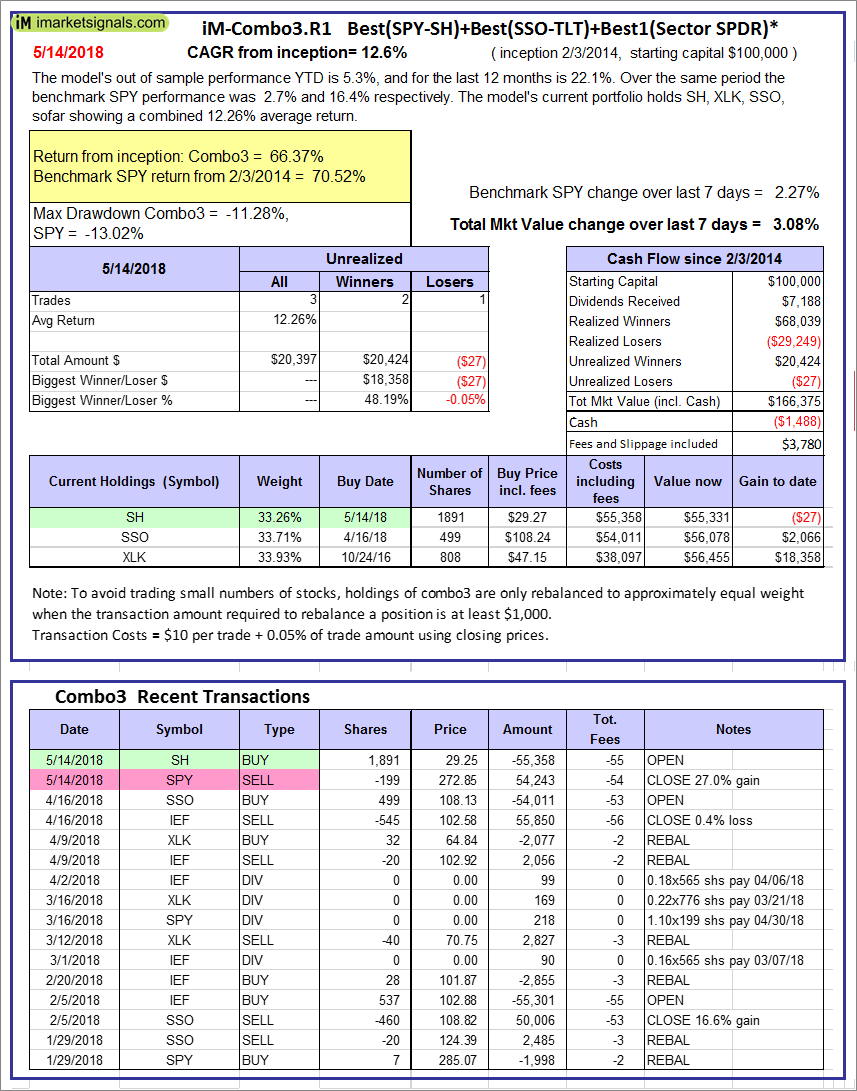 |
iM-Combo3.R1: The model’s out of sample performance YTD is 5.3%, and for the last 12 months is 22.1%. Over the same period the benchmark SPY performance was 2.7% and 16.4% respectively. Over the previous week the market value of iM-Combo3.R1 gained 3.08% at a time when SPY gained 2.27%. A starting capital of $100,000 at inception on 2/3/2014 would have grown to $166,375 which includes -$1,488 cash and excludes $3,780 spent on fees and slippage. |
 |
iM-Combo5: The model’s out of sample performance YTD is 5.0%, and for the last 12 months is 23.1%. Over the same period the benchmark SPY performance was 2.7% and 16.4% respectively. Over the previous week the market value of iM-Combo5 gained 3.14% at a time when SPY gained 2.27%. A starting capital of $100,000 at inception on 2/22/2016 would have grown to $134,331 which includes -$204 cash and excludes $872 spent on fees and slippage. |
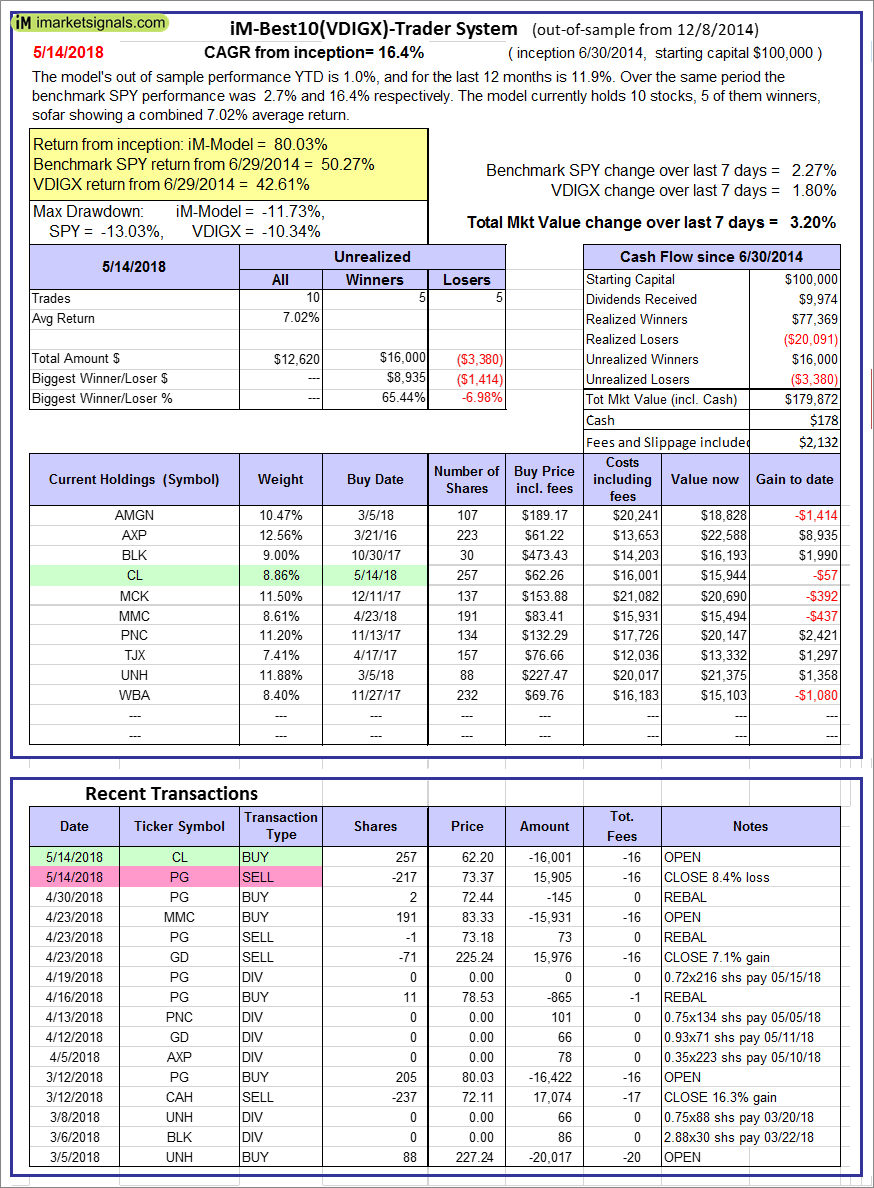  |
iM-Best10(VDIGX)-Trader: The model’s out of sample performance YTD is 1.0%, and for the last 12 months is 11.9%. Over the same period the benchmark SPY performance was 2.7% and 16.4% respectively. Since inception, on 7/1/2014, the model gained 80.03% while the benchmark SPY gained 50.27% and VDIGX gained 42.61% over the same period. Over the previous week the market value of iM-Best10(VDIGX) gained 3.20% at a time when SPY gained 2.27%. A starting capital of $100,000 at inception on 7/1/2014 would have grown to $179,872 which includes $178 cash and excludes $2,132 spent on fees and slippage. |
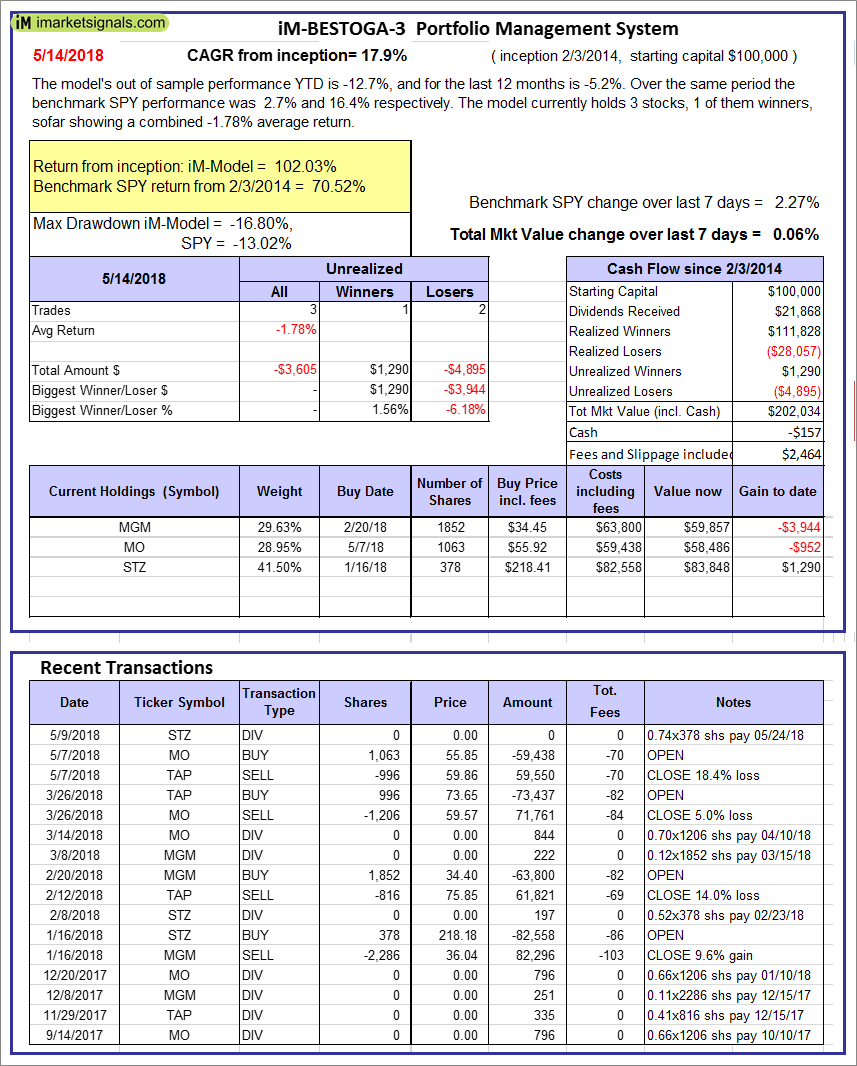 |
iM-BESTOGA-3: The model’s out of sample performance YTD is -12.7%, and for the last 12 months is -5.2%. Over the same period the benchmark SPY performance was 2.7% and 16.4% respectively. Over the previous week the market value of iM-BESTOGA-3 gained 0.06% at a time when SPY gained 2.27%. A starting capital of $100,000 at inception on 2/3/2014 would have grown to $202,034 which includes -$157 cash and excludes $2,464 spent on fees and slippage. |
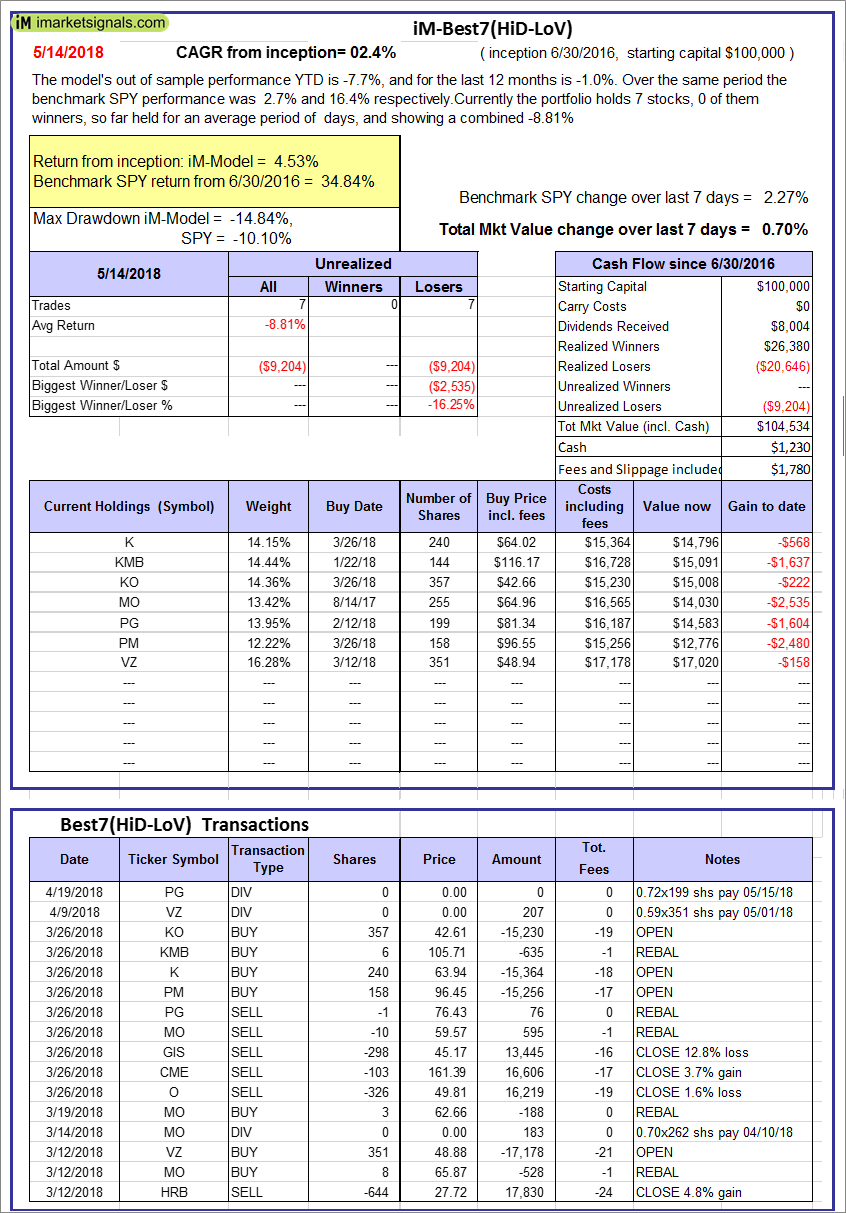 |
iM-Best7(HiD-LoV): The model’s out of sample performance YTD is -7.7%, and for the last 12 months is -1.0%. Over the same period the benchmark SPY performance was 2.7% and 16.4% respectively. Over the previous week the market value of iM-BESTOGA-3 gained 0.70% at a time when SPY gained 2.27%. A starting capital of $100,000 at inception on 6/30/2016 would have grown to $104,534 which includes $1,230 cash and excludes $1,780 spent on fees and slippage. |
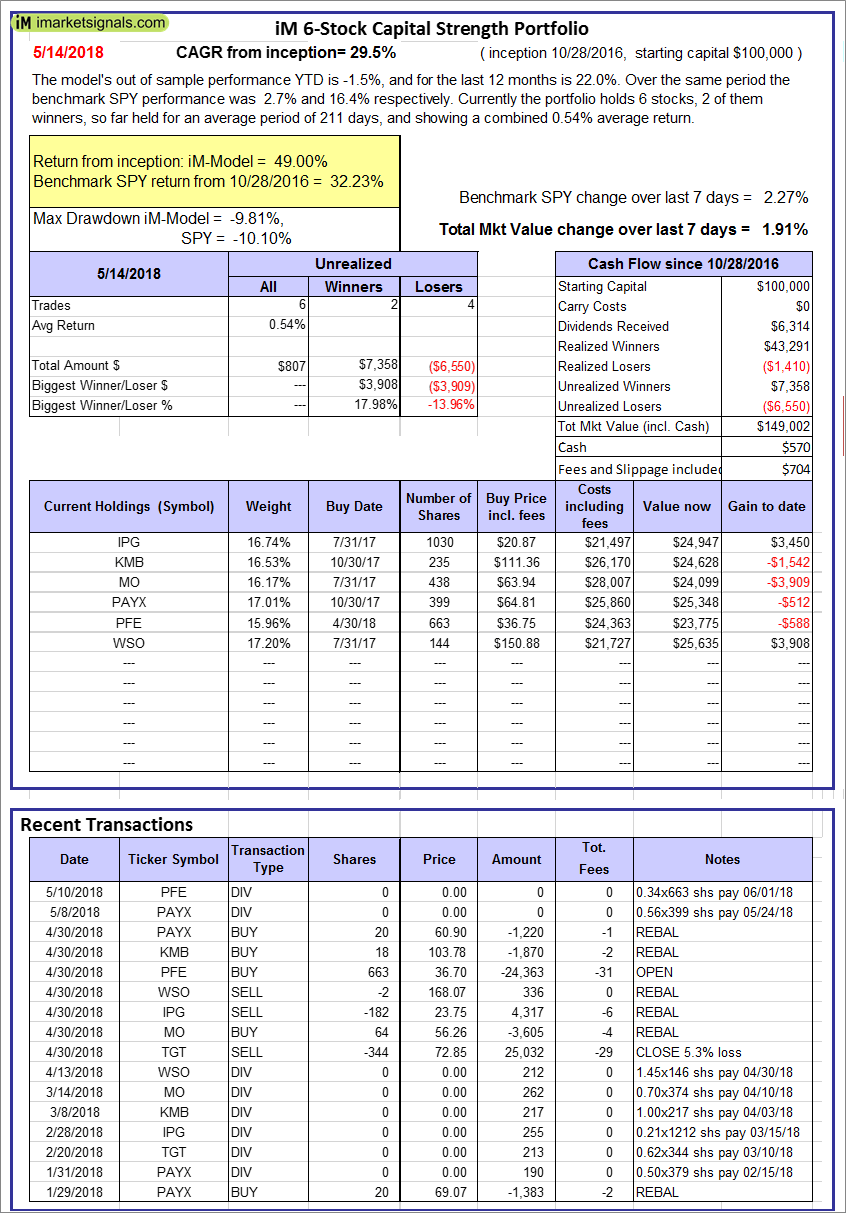 |
iM 6-Stock Capital Strength Portfolio: The model’s out of sample performance YTD is -1.5%, and for the last 12 months is 22.0%. Over the same period the benchmark SPY performance was 2.7% and 16.4% respectively. Over the previous week the market value of the iM 6-Stock Capital Strength Portfolio gained 1.91% at a time when SPY gained 2.27%. A starting capital of $100,000 at inception on 10/28/2016 would have grown to $149,002 which includes $570 cash and excludes $704 spent on fees and slippage. |
 |
iM-BestogaX5-System: The model’s out of sample performance YTD is -4.8%, and for the last 12 months is -0.2%. Over the same period the benchmark SPY performance was 2.7% and 16.4% respectively. Over the previous week the market value of iM-BestogaX5-System gained -1.11% at a time when SPY gained 2.27%. A starting capital of $100,000 at inception on 3/28/2016 would have grown to $106,615 which includes $408 cash and excludes $1,150 spent on fees and slippage. |
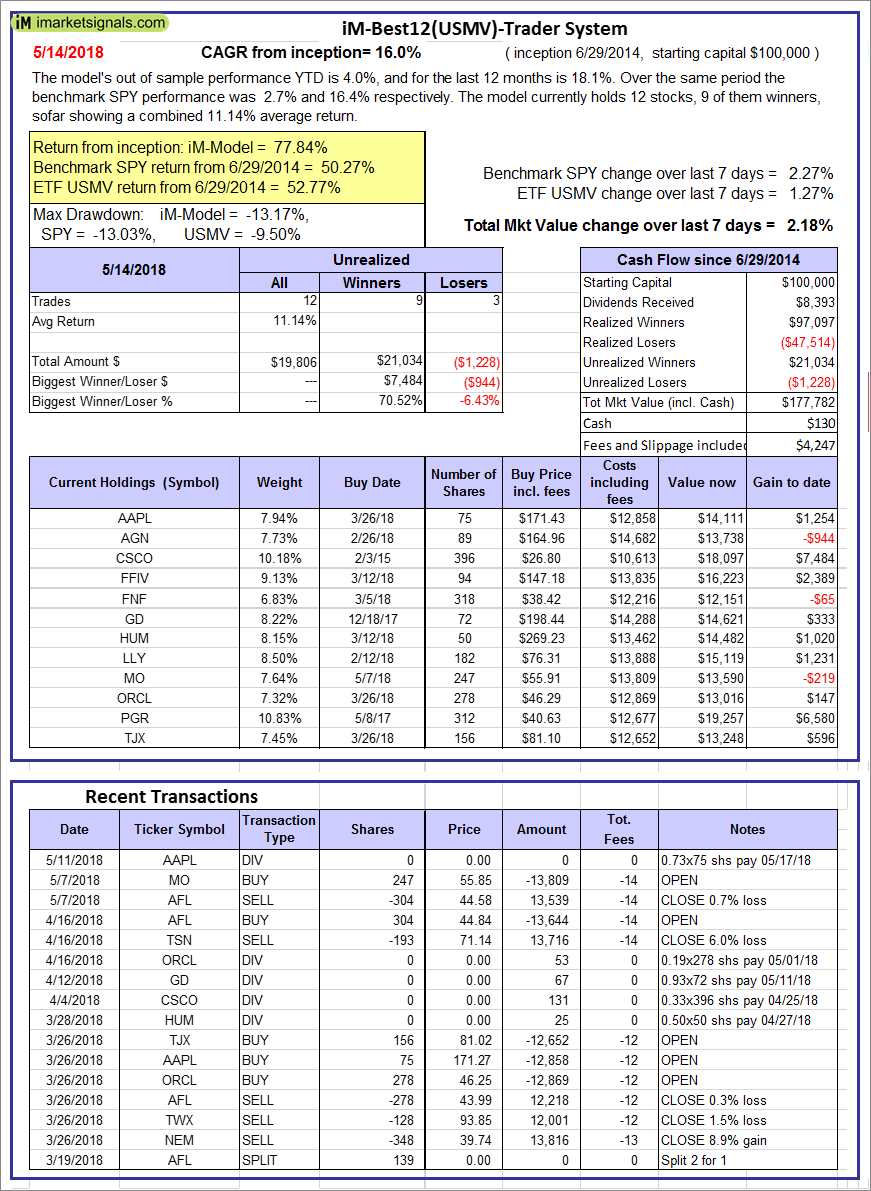  |
iM-Best12(USMV)-Trader: The model’s out of sample performance YTD is 4.0%, and for the last 12 months is 18.1%. Over the same period the benchmark SPY performance was 2.7% and 16.4% respectively. Since inception, on 6/30/2014, the model gained 77.84% while the benchmark SPY gained 50.27% and the ETF USMV gained 52.77% over the same period. Over the previous week the market value of iM-Best12(USMV)-Trader gained 2.18% at a time when SPY gained 2.27%. A starting capital of $100,000 at inception on 6/30/2014 would have grown to $177,782 which includes $130 cash and excludes $4,247 spent on fees and slippage. |
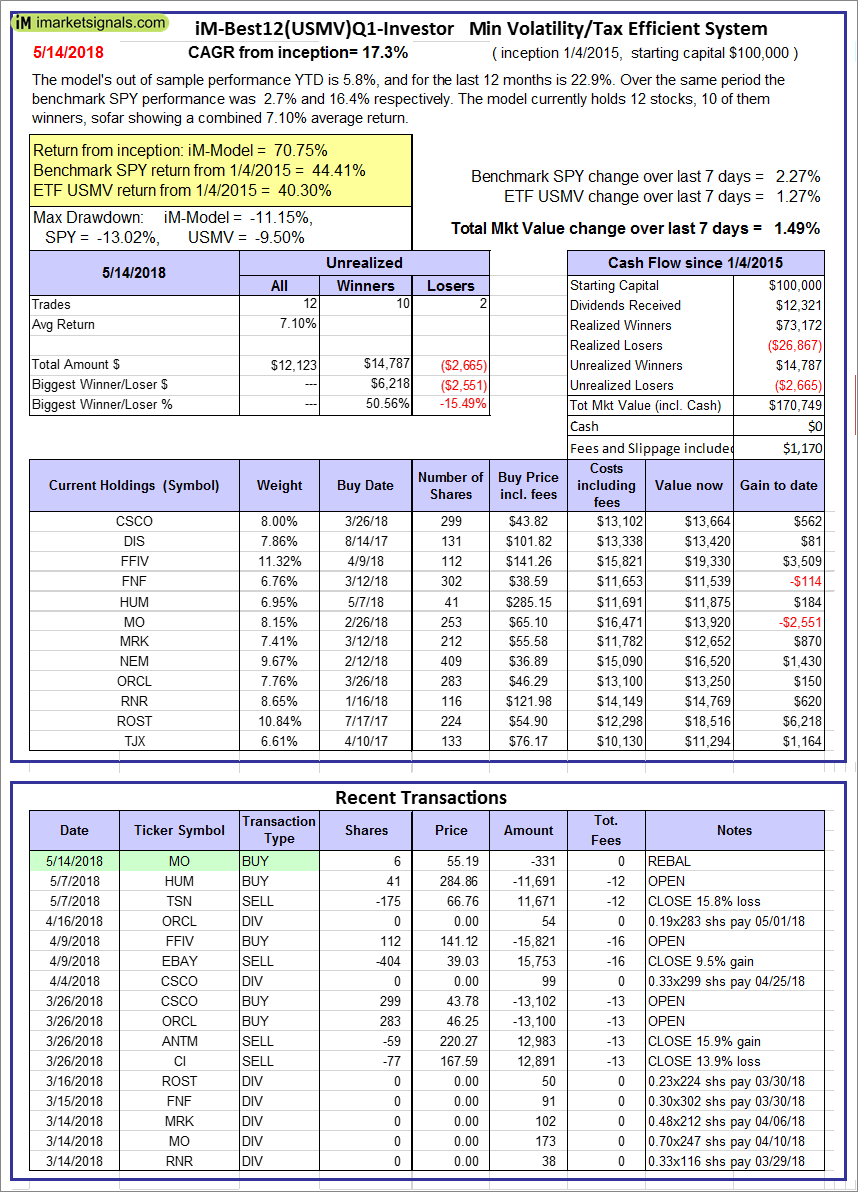 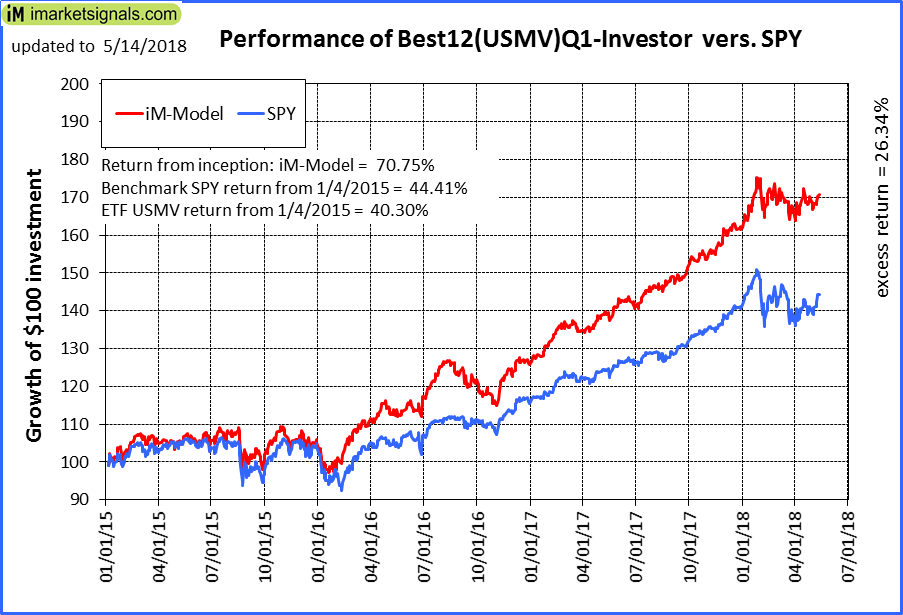 |
iM-Best12(USMV)Q1-Investor: The model’s out of sample performance YTD is 5.8%, and for the last 12 months is 22.9%. Over the same period the benchmark SPY performance was 2.7% and 16.4% respectively. Since inception, on 1/5/2015, the model gained 70.75% while the benchmark SPY gained 44.41% and the ETF USMV gained 40.30% over the same period. Over the previous week the market value of iM-Best12(USMV)Q1 gained 1.49% at a time when SPY gained 2.27%. A starting capital of $100,000 at inception on 1/5/2015 would have grown to $170,749 which includes $0 cash and excludes $1,170 spent on fees and slippage. |
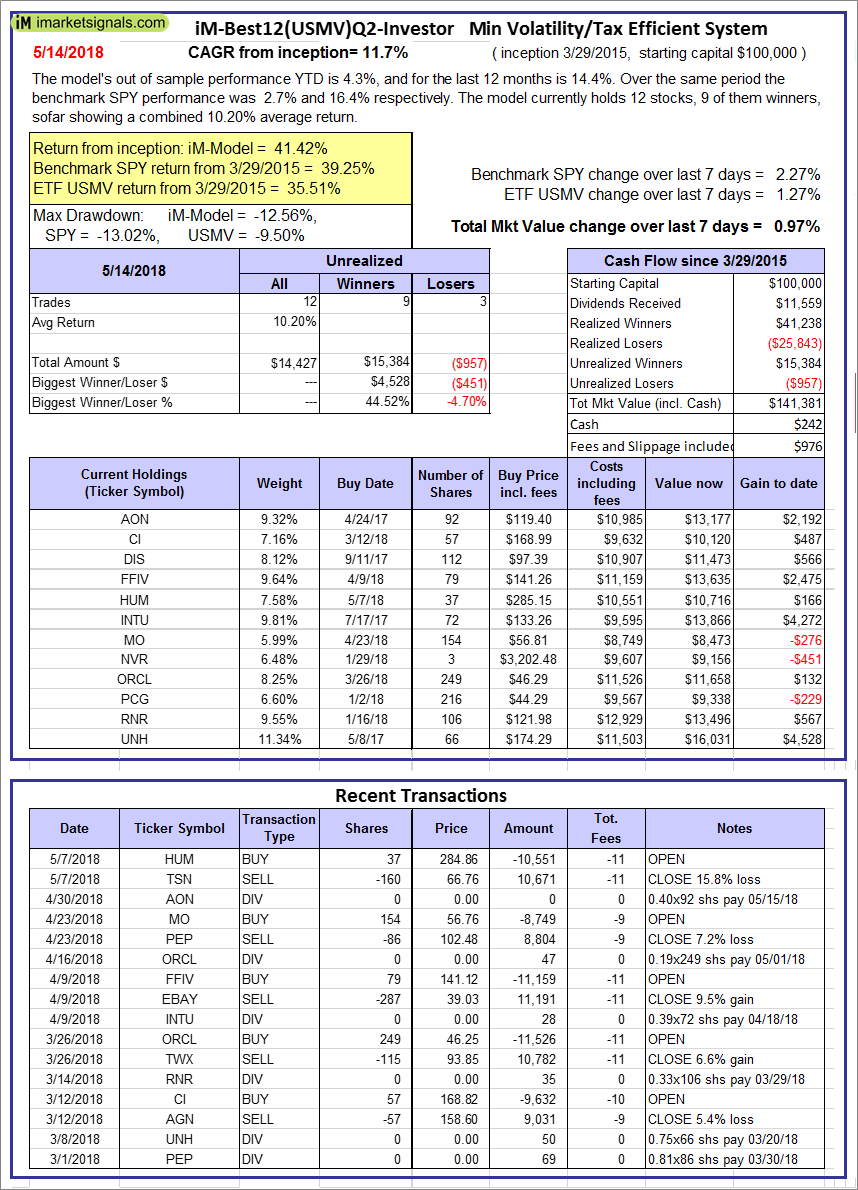 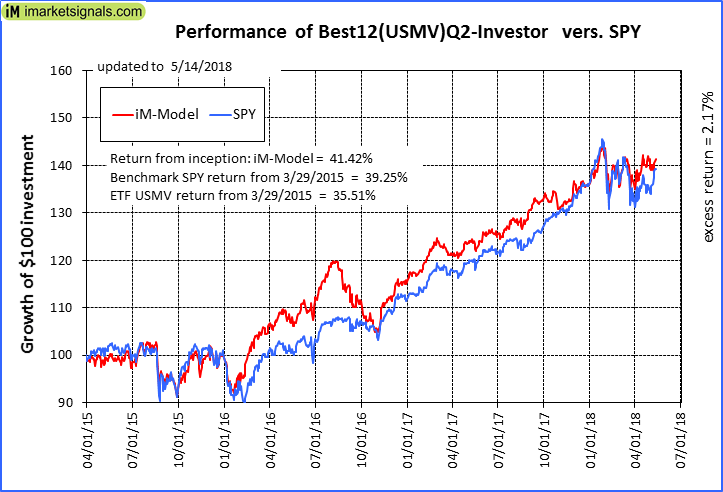 |
iM-Best12(USMV)Q2-Investor: The model’s out of sample performance YTD is 4.3%, and for the last 12 months is 14.4%. Over the same period the benchmark SPY performance was 2.7% and 16.4% respectively. Since inception, on 3/30/2015, the model gained 41.42% while the benchmark SPY gained 39.25% and the ETF USMV gained 35.51% over the same period. Over the previous week the market value of iM-Best12(USMV)Q2 gained 0.97% at a time when SPY gained 2.27%. A starting capital of $100,000 at inception on 3/30/2015 would have grown to $141,381 which includes $242 cash and excludes $976 spent on fees and slippage. |
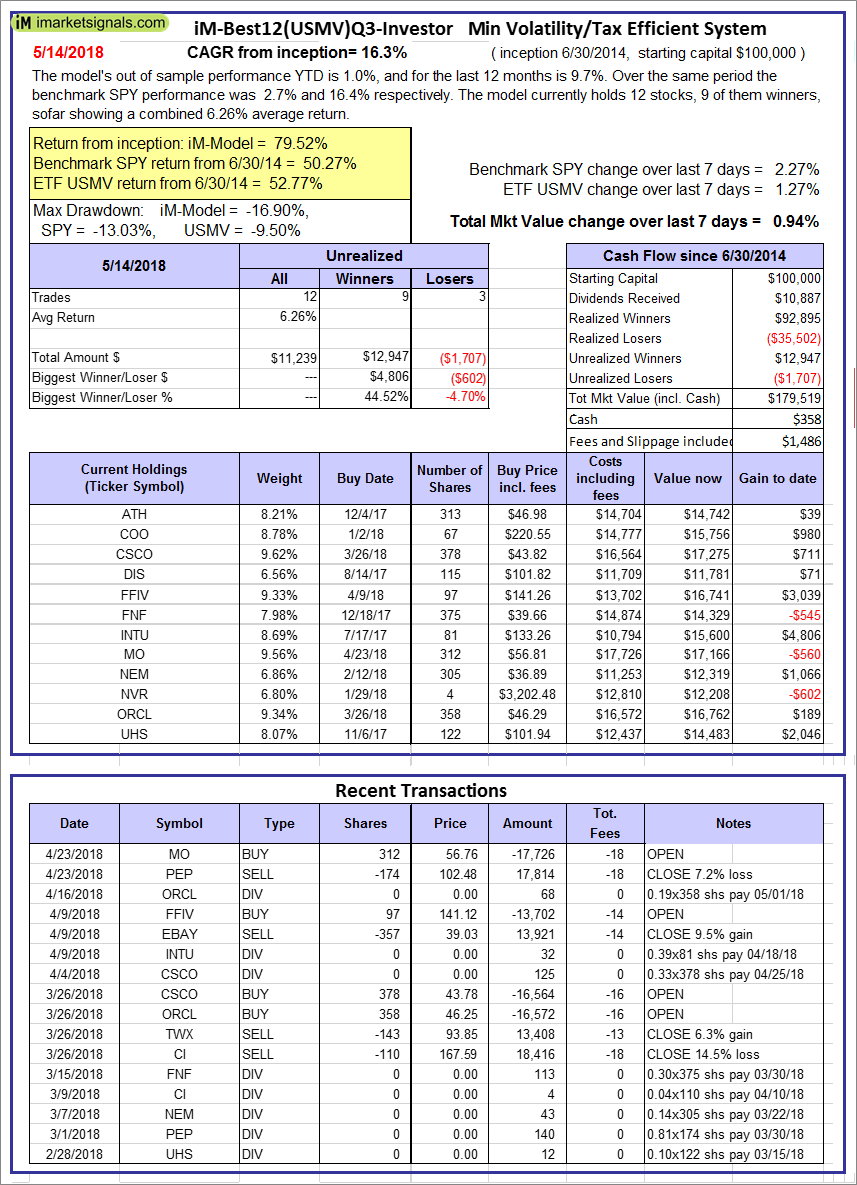 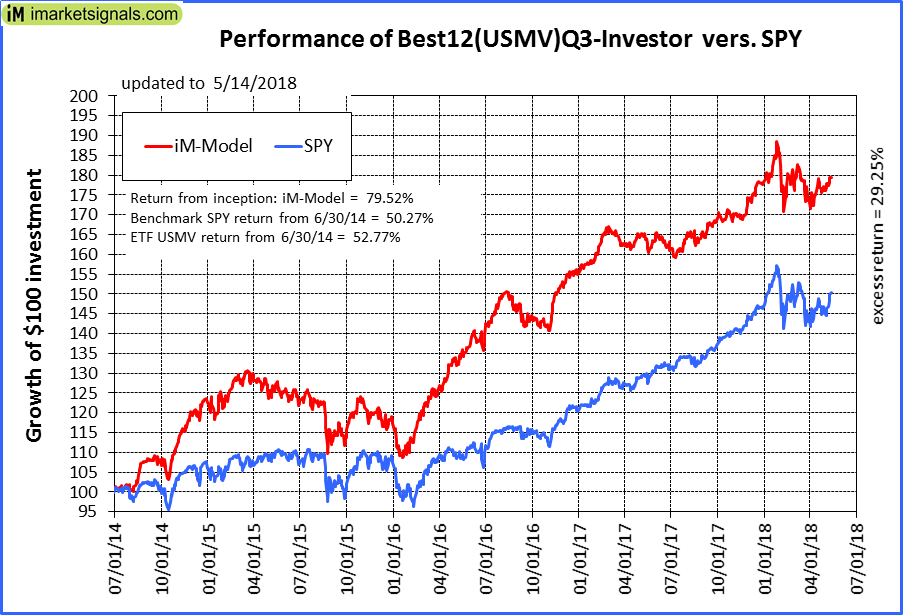 |
iM-Best12(USMV)Q3-Investor: The model’s out of sample performance YTD is 1.0%, and for the last 12 months is 9.7%. Over the same period the benchmark SPY performance was 2.7% and 16.4% respectively. Since inception, on 7/1/2014, the model gained 79.52% while the benchmark SPY gained 50.27% and the ETF USMV gained 52.77% over the same period. Over the previous week the market value of iM-Best12(USMV)Q3 gained 0.94% at a time when SPY gained 2.27%. A starting capital of $100,000 at inception on 7/1/2014 would have grown to $179,519 which includes $358 cash and excludes $1,486 spent on fees and slippage. |
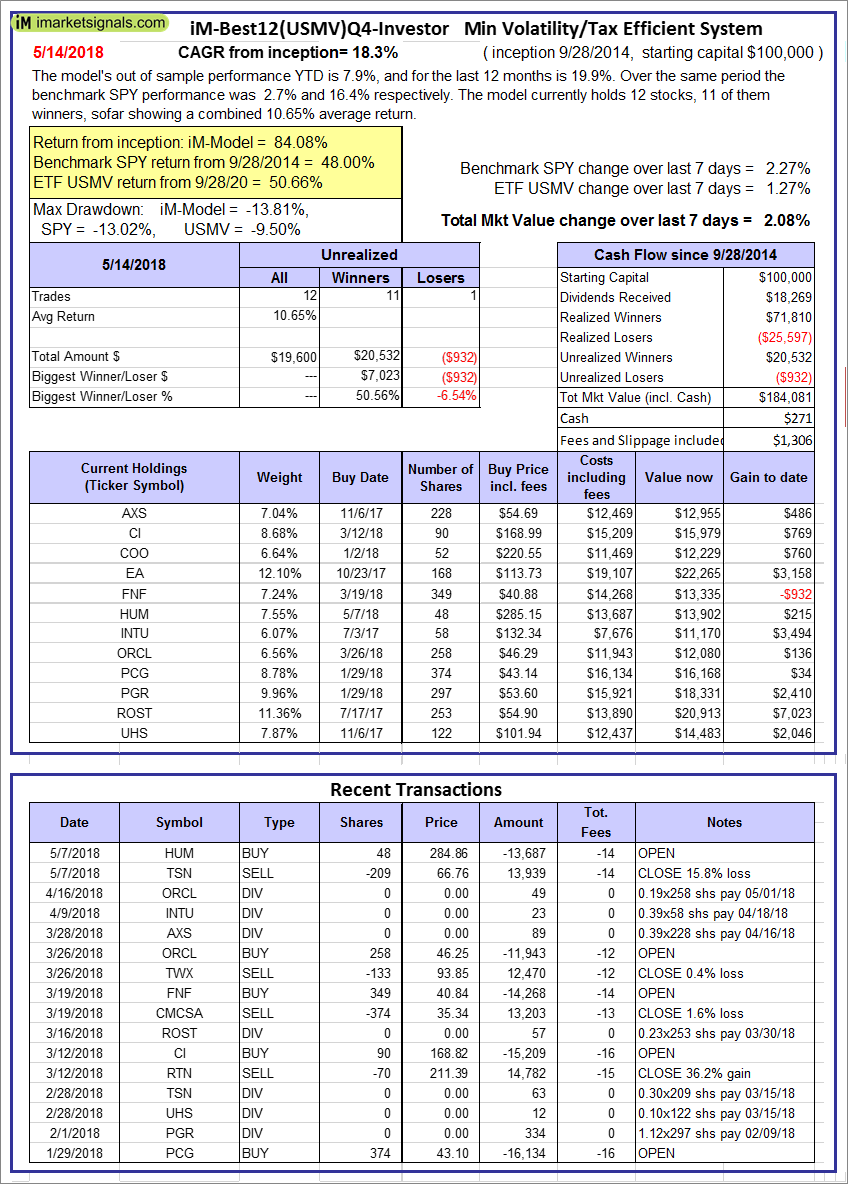 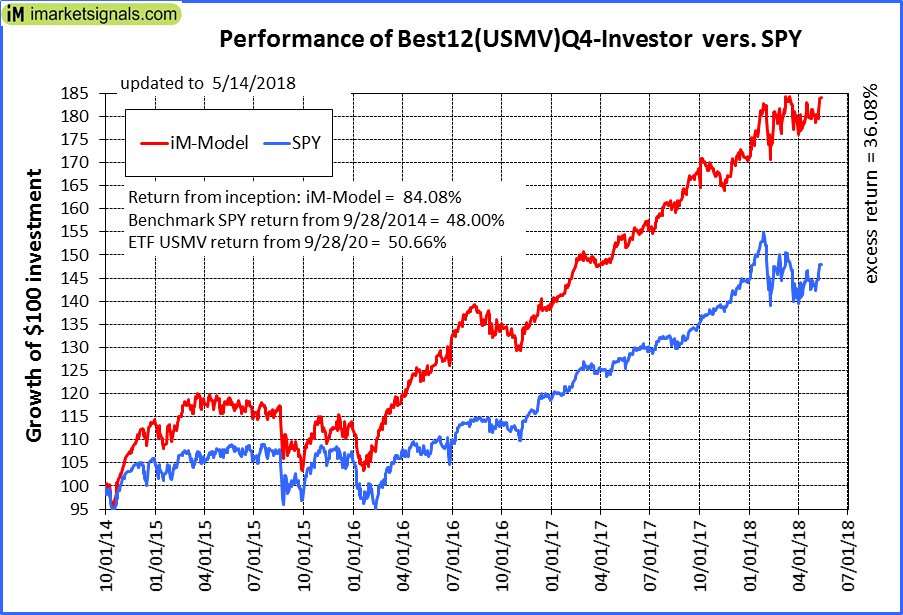 |
iM-Best12(USMV)Q4-Investor: Since inception, on 9/29/2014, the model gained 84.08% while the benchmark SPY gained 48.00% and the ETF USMV gained 50.66% over the same period. Over the previous week the market value of iM-Best12(USMV)Q4 gained 2.08% at a time when SPY gained 2.27%. A starting capital of $100,000 at inception on 9/29/2014 would have grown to $184,081 which includes $271 cash and excludes $1,306 spent on fees and slippage. |
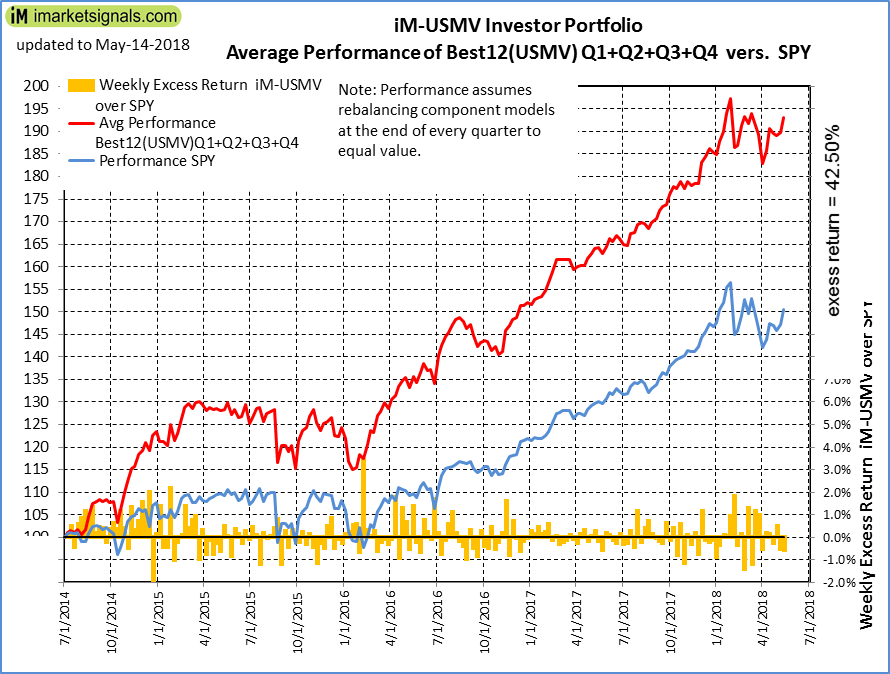 |
Average Performance of iM-Best12(USMV)Q1+Q2+Q3+Q4-Investor resulted in an excess return of 42.50% over SPY. (see iM-USMV Investor Portfolio) |
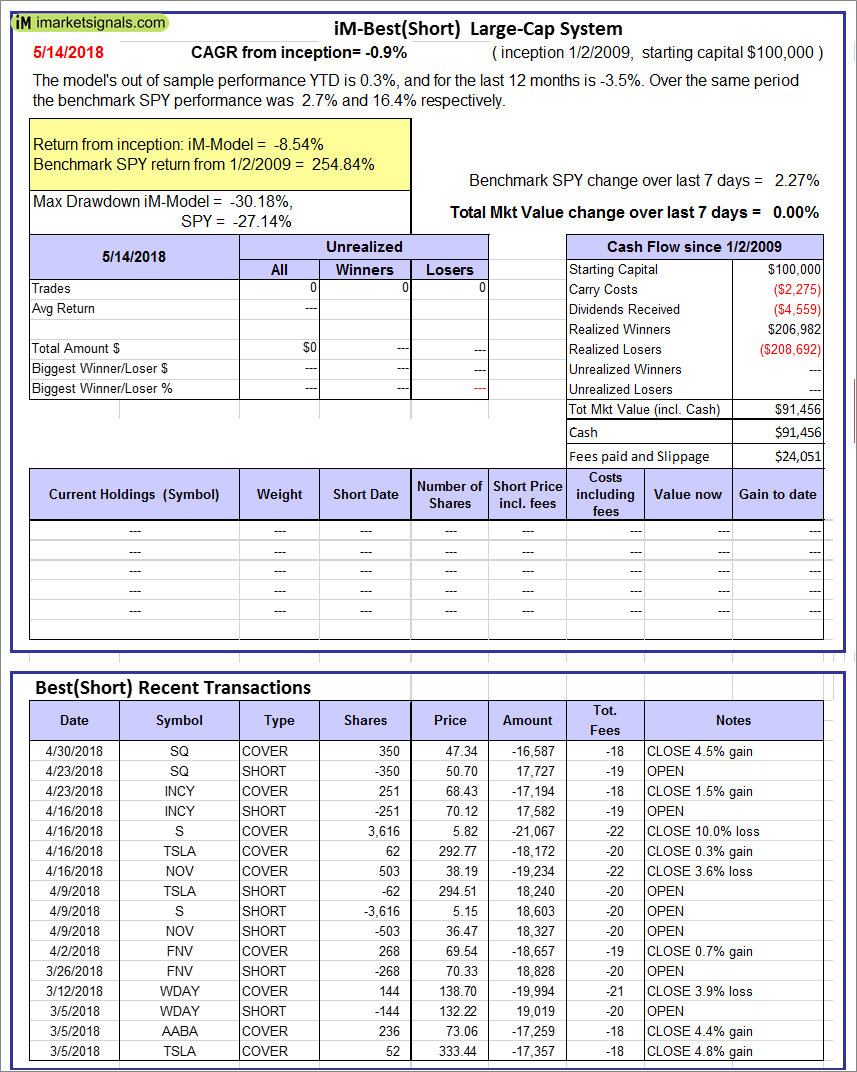 |
iM-Best(Short): The model’s out of sample performance YTD is 0.3%, and for the last 12 months is -3.5%. Over the same period the benchmark SPY performance was 2.7% and 16.4% respectively. Over the previous week the market value of iM-Best(Short) gained 0.00% at a time when SPY gained 2.27%. Over the period 1/2/2009 to 5/14/2018 the starting capital of $100,000 would have grown to $91,456 which includes $91,456 cash and excludes $24,051 spent on fees and slippage. |
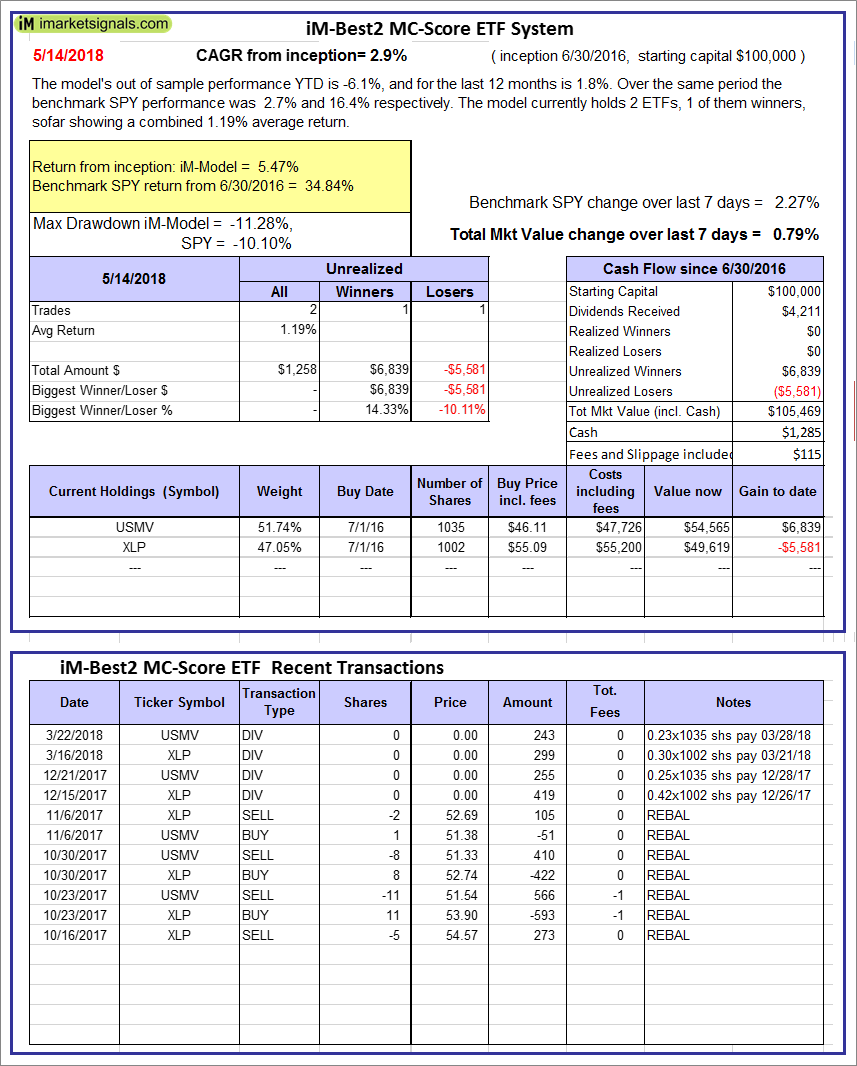 |
iM-Best2 MC-Score ETF System: The model’s out of sample performance YTD is -6.1%, and for the last 12 months is 1.8%. Over the same period the benchmark SPY performance was 2.7% and 16.4% respectively. Over the previous week the market value of the iM-Best2 MC-Score ETF System gained 0.79% at a time when SPY gained 2.27%. A starting capital of $100,000 at inception on 6/30/2016 would have grown to $105,469 which includes $1,285 cash and excludes $115 spent on fees and slippage. |
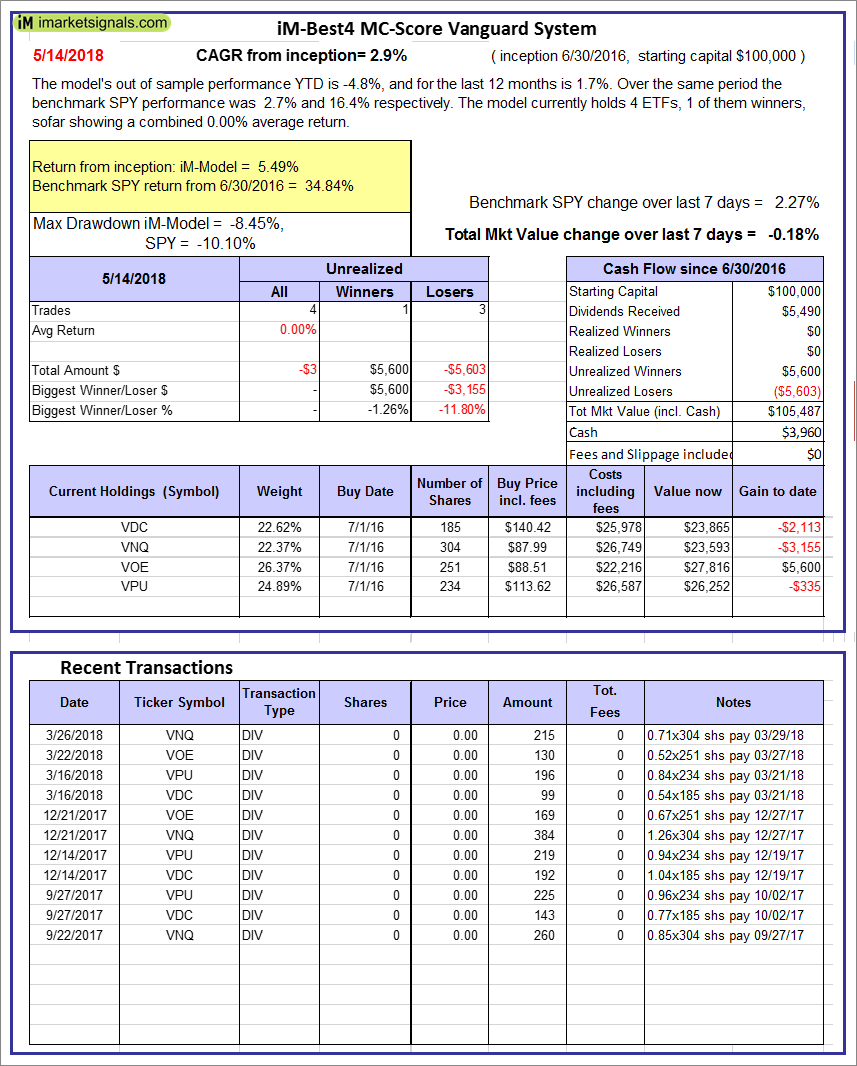 |
iM-Best4 MC-Score Vanguard System: The model’s out of sample performance YTD is -4.8%, and for the last 12 months is 1.7%. Over the same period the benchmark SPY performance was 2.7% and 16.4% respectively. Over the previous week the market value of the iM-Best4 MC-Score Vanguard System gained -0.18% at a time when SPY gained 2.27%. A starting capital of $100,000 at inception on 6/30/2016 would have grown to $105,487 which includes $3,960 cash and excludes $00 spent on fees and slippage. |
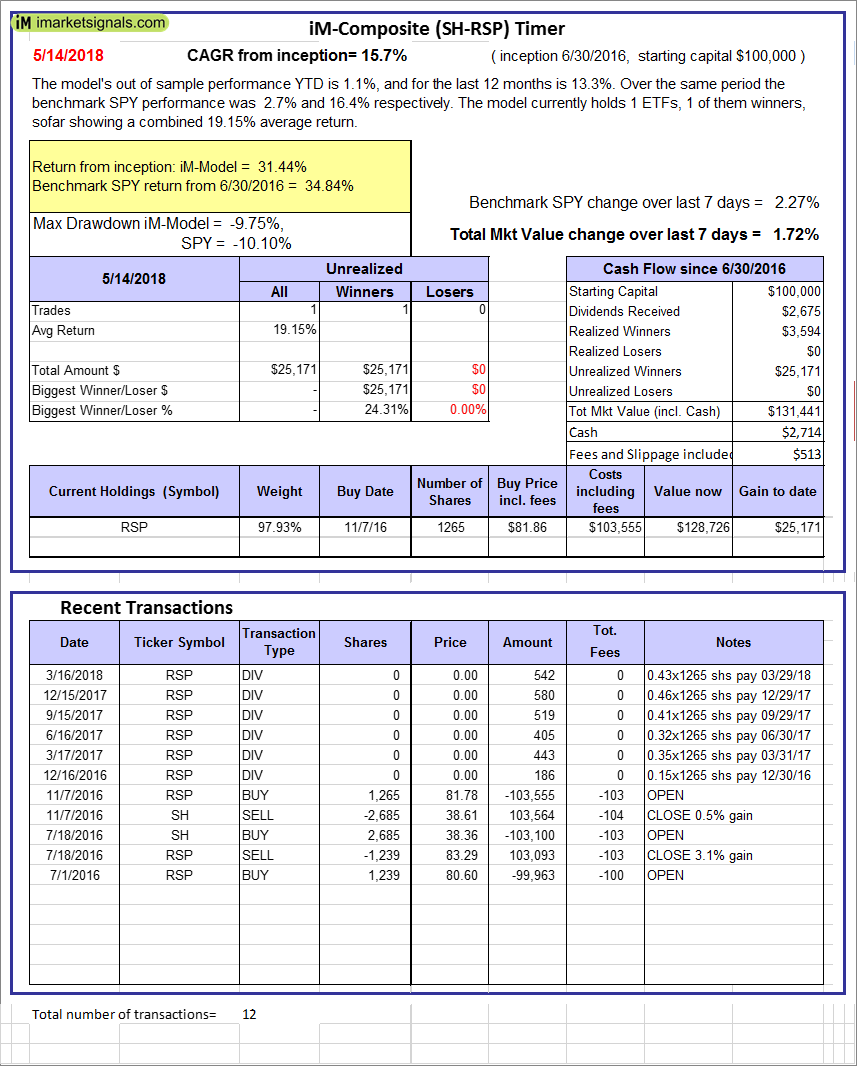 |
iM-Composite (SH-RSP) Timer: The model’s out of sample performance YTD is 1.1%, and for the last 12 months is 13.3%. Over the same period the benchmark SPY performance was 2.7% and 16.4% respectively. Over the previous week the market value of the iM-Composite (SH-RSP) Timer gained 1.72% at a time when SPY gained 2.27%. A starting capital of $100,000 at inception on 6/30/2016 would have grown to $131,441 which includes $2,714 cash and excludes $513 spent on fees and slippage. |
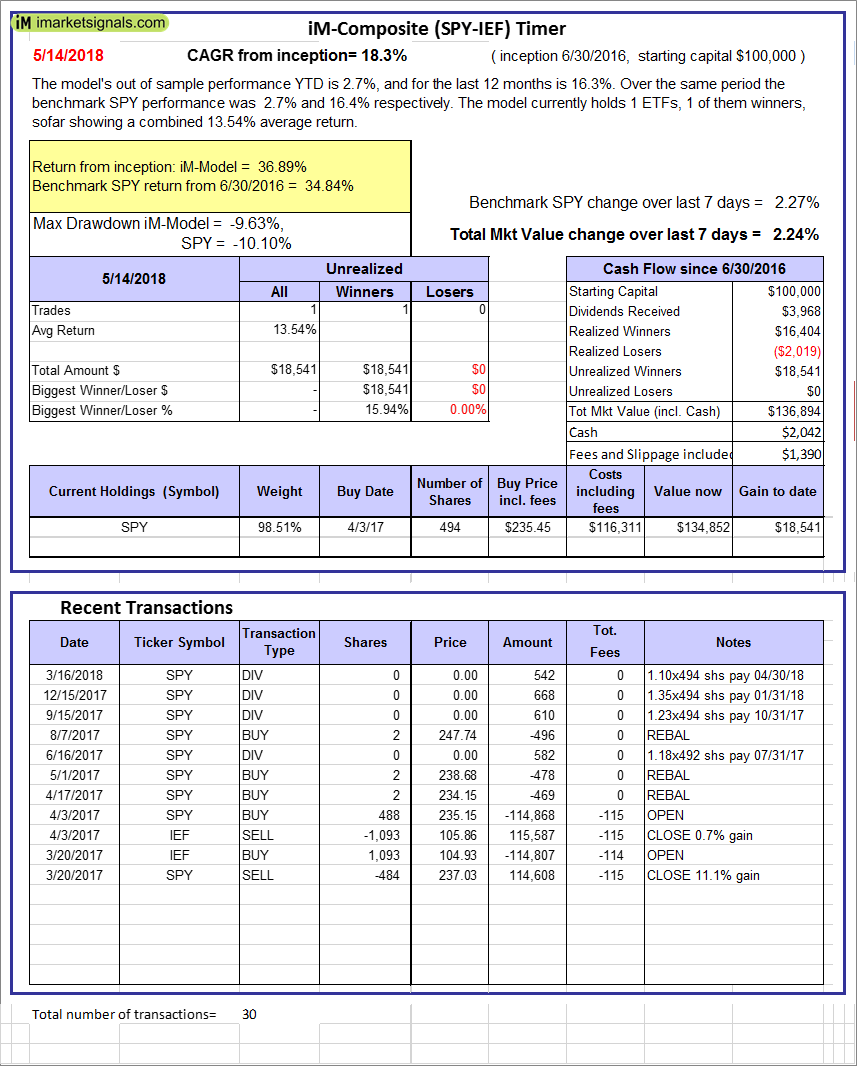 |
iM-Composite (SPY-IEF) Timer: The model’s out of sample performance YTD is 2.7%, and for the last 12 months is 16.3%. Over the same period the benchmark SPY performance was 2.7% and 16.4% respectively. Over the previous week the market value of the iM-Composite (SPY-IEF) Timer gained 2.24% at a time when SPY gained 2.27%. A starting capital of $100,000 at inception on 6/30/2016 would have grown to $136,894 which includes $2,042 cash and excludes $1,390 spent on fees and slippage. |
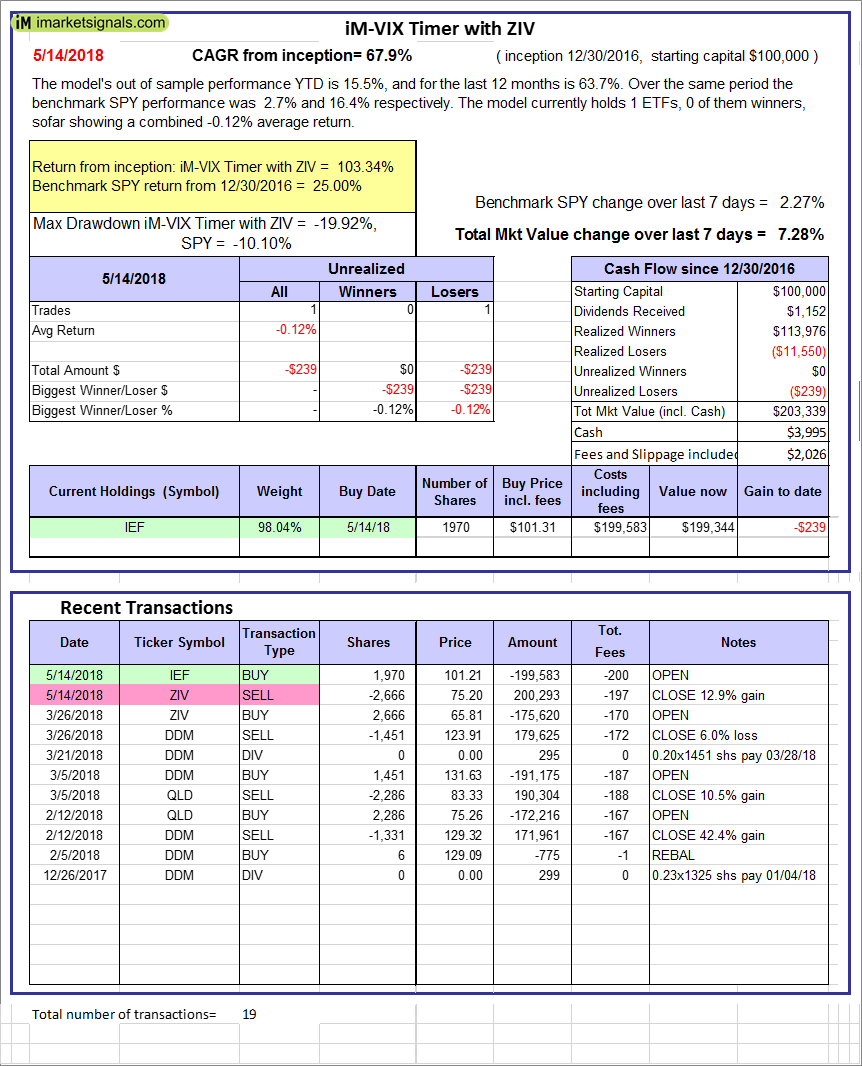 |
iM-VIX Timer with ZIV: The model’s out of sample performance YTD is 15.5%, and for the last 12 months is 63.7%. Over the same period the benchmark SPY performance was 2.7% and 16.4% respectively. Over the previous week the market value of the iM-VIX Timer with ZIV gained 7.28% at a time when SPY gained 2.27%. A starting capital of $100,000 at inception on 6/30/2016 would have grown to $203,339 which includes $3,995 cash and excludes $2,026 spent on fees and slippage. |
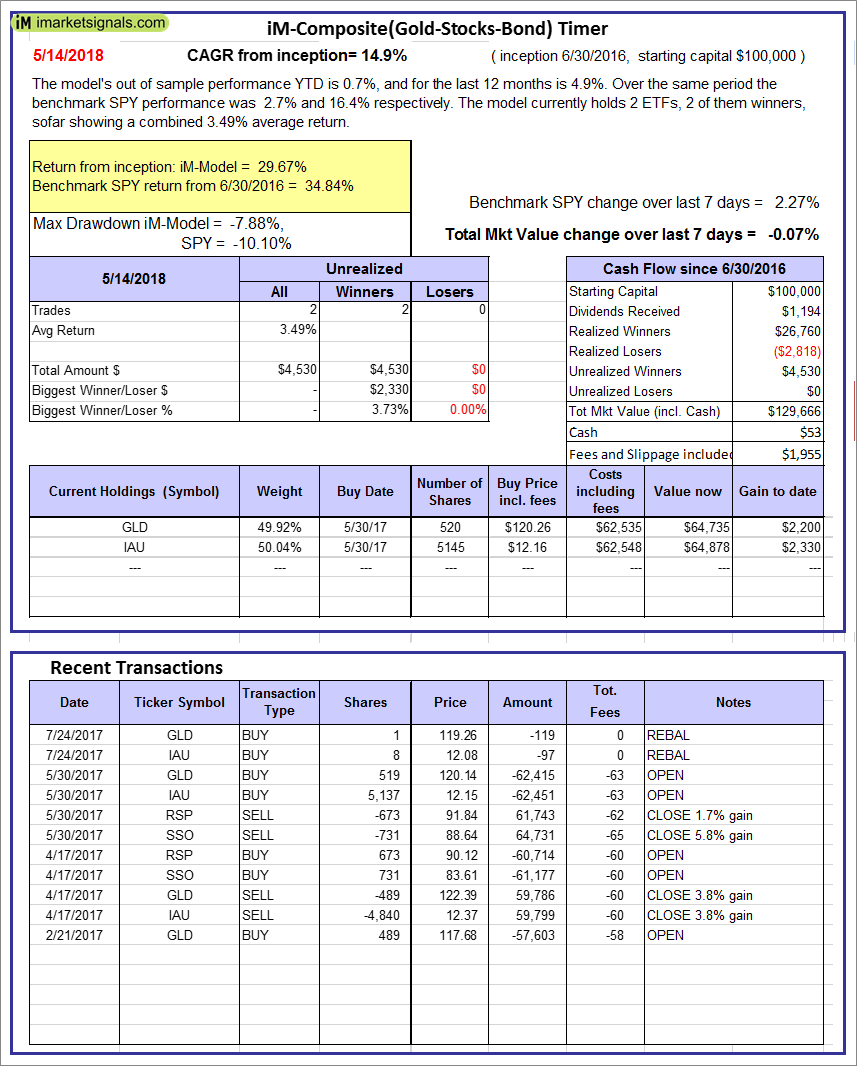 |
iM-Composite(Gold-Stocks-Bond) Timer: The model’s out of sample performance YTD is 0.7%, and for the last 12 months is 4.9%. Over the same period the benchmark SPY performance was 2.7% and 16.4% respectively. Over the previous week the market value of the iM-Composite(Gold-Stocks-Bond) Timer gained -0.07% at a time when SPY gained 2.27%. A starting capital of $100,000 at inception on 6/30/2016 would have grown to $129,666 which includes $53 cash and excludes $1,955 spent on fees and slippage. |
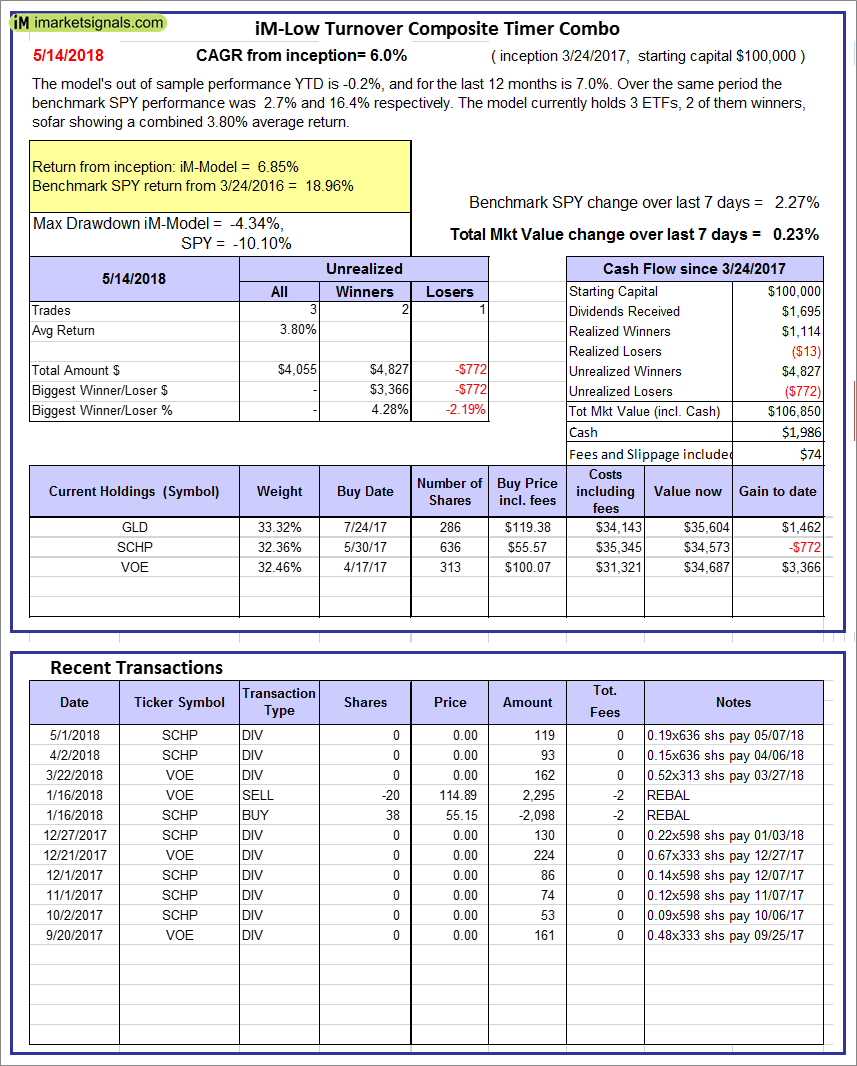 |
iM-Low Turnover Composite Timer Combo: The model’s out of sample performance YTD is -0.2%, and for the last 12 months is 7.0%. Over the same period the benchmark SPY performance was 2.7% and 16.4% respectively. Over the previous week the market value of the iM-Low Turnover Composite Timer Combo gained 0.23% at a time when SPY gained 2.27%. A starting capital of $100,000 at inception on 3/24/27 would have grown to $106,850 which includes $1,986 cash and excludes $74 spent on fees and slippage. |
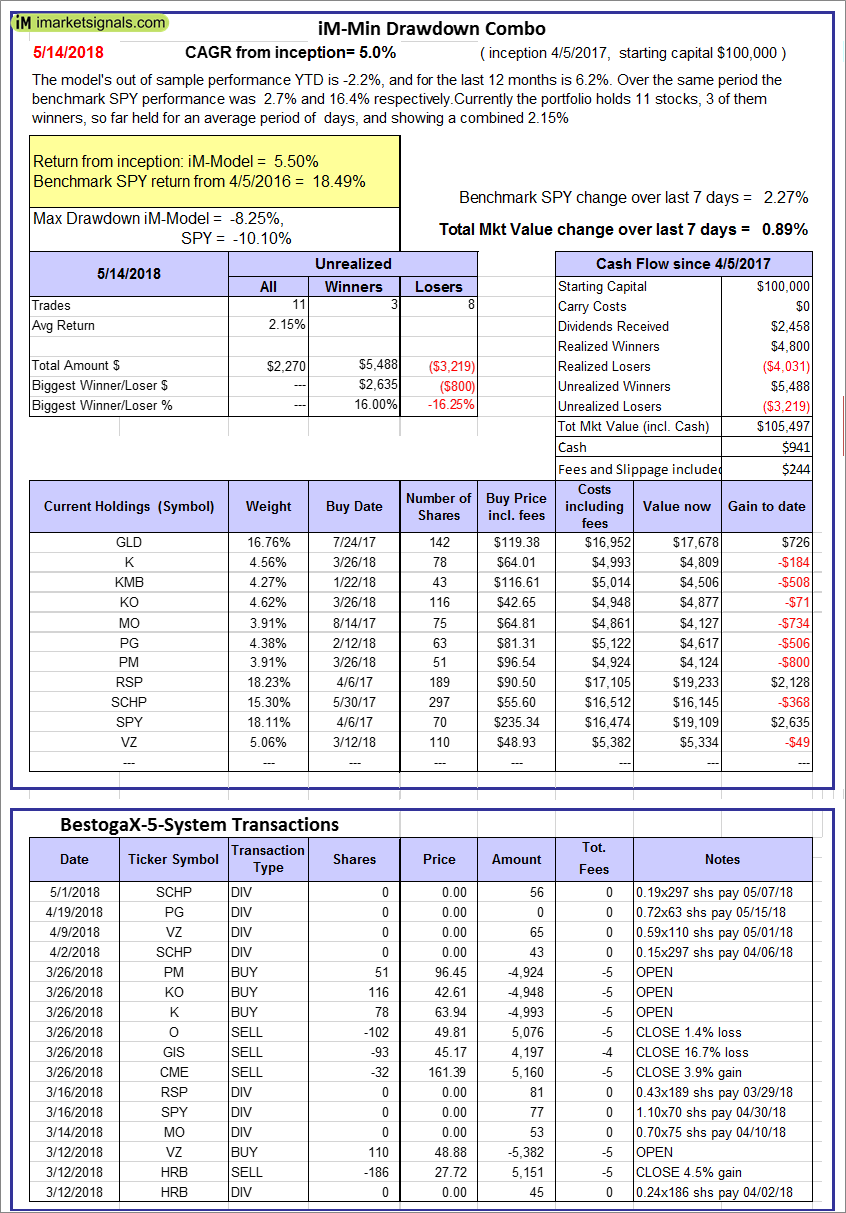 |
iM-Min Drawdown Combo: The model’s out of sample performance YTD is -2.2%, and for the last 12 months is 6.2%. Over the same period the benchmark SPY performance was 2.7% and 16.4% respectively. Over the previous week the market value of the iM-Min Drawdown Combo gained 0.89% at a time when SPY gained 2.27%. A starting capital of $100,000 at inception on 4/5/2017 would have grown to $105,497 which includes $941 cash and excludes $244 spent on fees and slippage. |
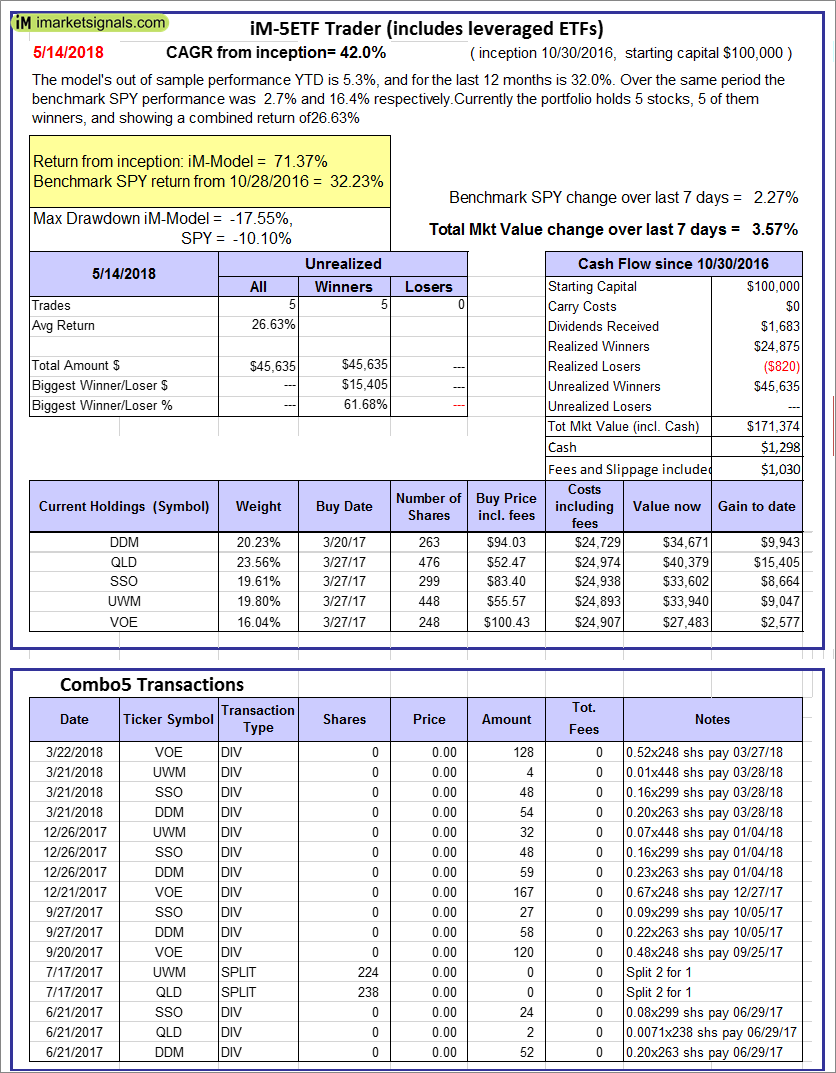 |
iM-5ETF Trader (includes leveraged ETFs): The model’s out of sample performance YTD is 5.3%, and for the last 12 months is 32.0%. Over the same period the benchmark SPY performance was 2.7% and 16.4% respectively. Over the previous week the market value of the iM-5ETF Trader (includes leveraged ETFs) gained 3.57% at a time when SPY gained 2.27%. A starting capital of $100,000 at inception on 10/30/2016 would have grown to $171,374 which includes $1,298 cash and excludes $1,030 spent on fees and slippage. |
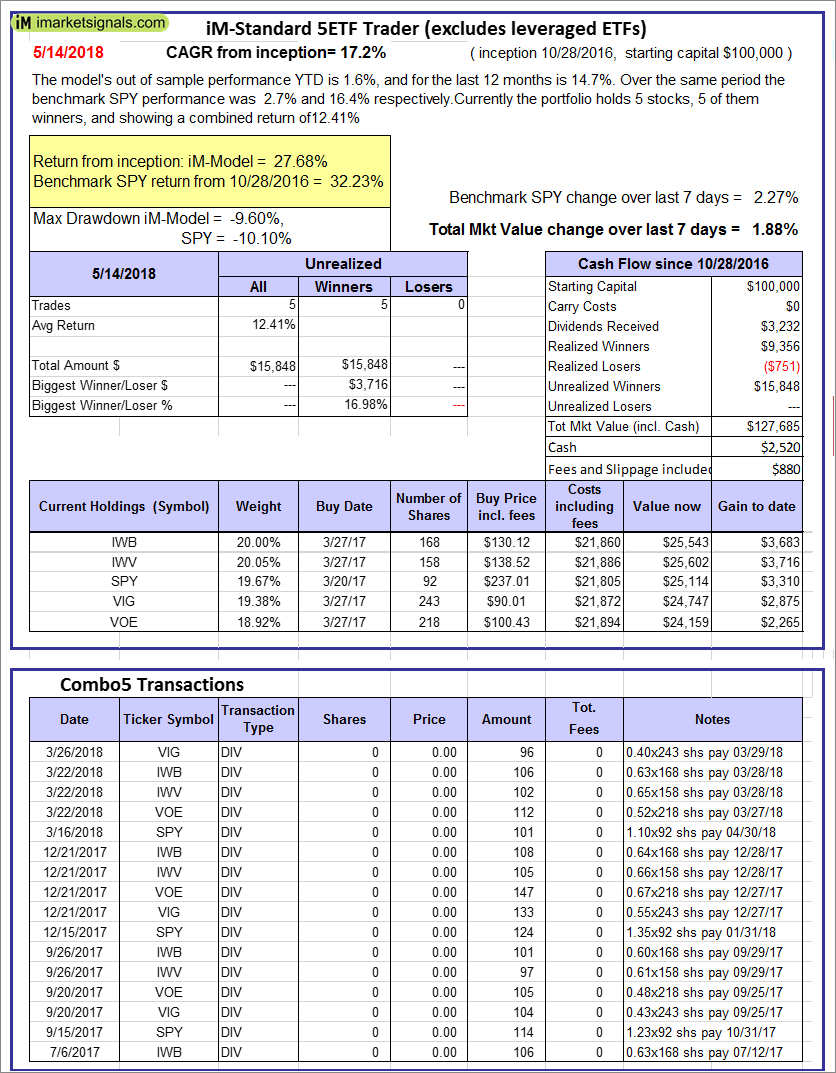 |
iM-Standard 5ETF Trader (excludes leveraged ETFs): The model’s out of sample performance YTD is 1.6%, and for the last 12 months is 14.7%. Over the same period the benchmark SPY performance was 2.7% and 16.4% respectively. Over the previous week the market value of the iM-Standard 5ETF Trader (excludes leveraged ETFs) gained 1.88% at a time when SPY gained 2.27%. A starting capital of $100,000 at inception on 10/30/2016 would have grown to $127,685 which includes $2,520 cash and excludes $880 spent on fees and slippage. |
iM-Best Reports – 5/14/2018
Posted in pmp SPY-SH
Leave a Reply
You must be logged in to post a comment.