
  |
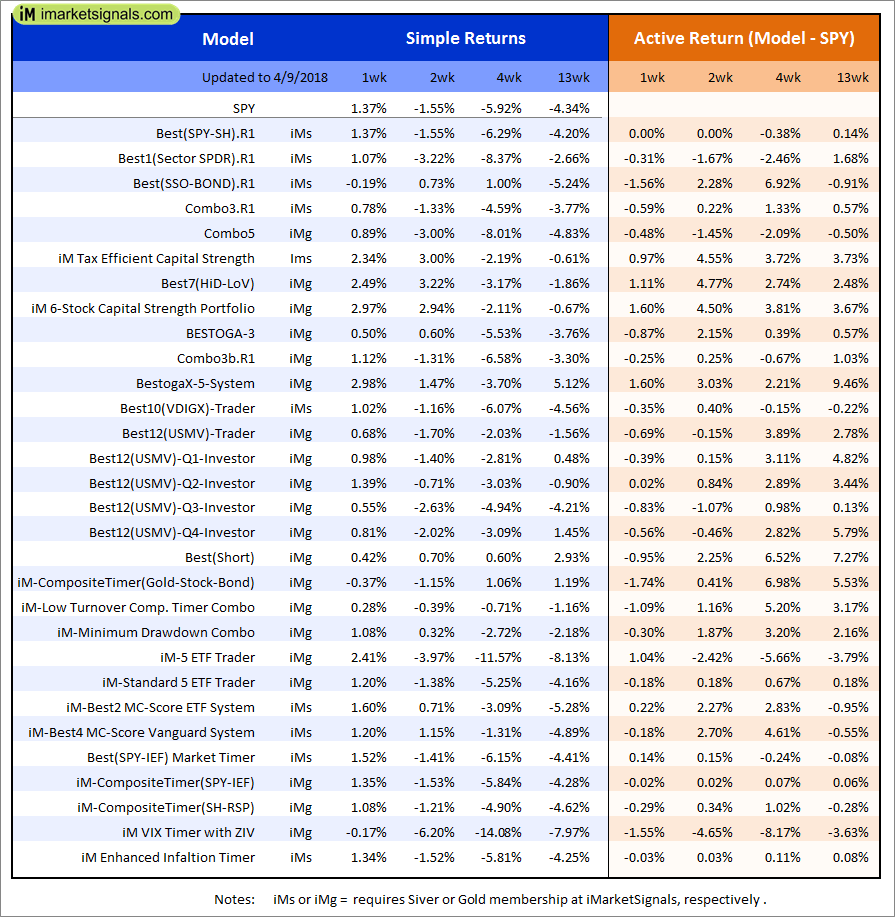
Out of sample performance summary of our models for the past 1, 2, 4 and 13 week periods. The active active return indicates how the models over- or underperformed the benchmark ETF SPY. Also the YTD, and the 1-, 3-, 5- and 10-year annualized returns are shown in the second table |
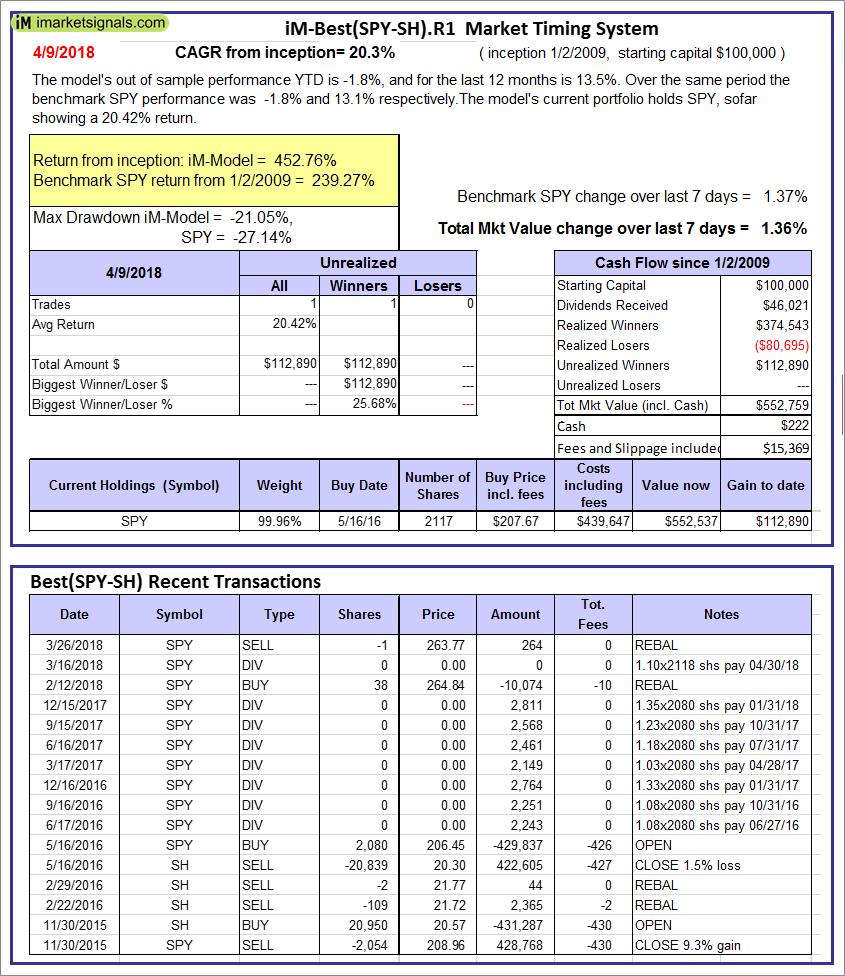 |
iM-Best(SPY-SH).R1: The model’s out of sample performance YTD is -1.8%, and for the last 12 months is 13.5%. Over the same period the benchmark SPY performance was -1.8% and 13.1% respectively. Over the previous week the market value of Best(SPY-SH) gained 1.36% at a time when SPY gained 1.37%. A starting capital of $100,000 at inception on 1/2/2009 would have grown to $552,759 which includes $222 cash and excludes $15,369 spent on fees and slippage. |
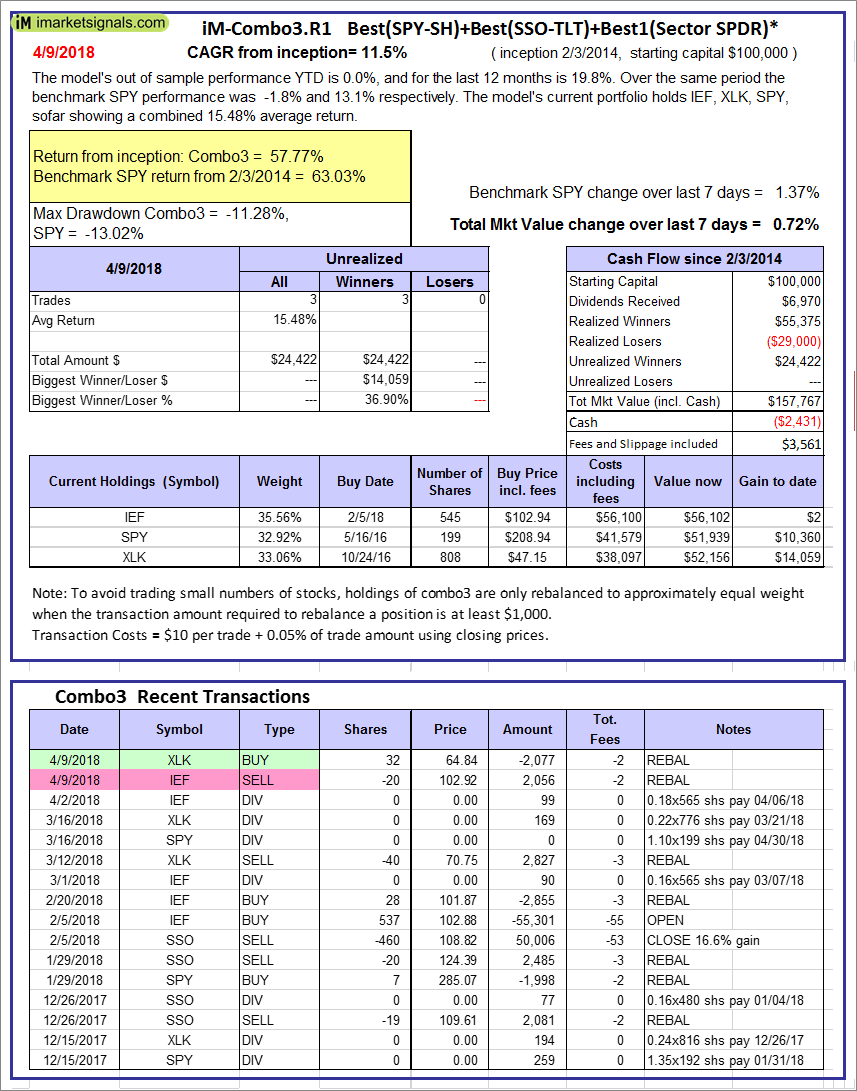 |
iM-Combo3.R1: The model’s out of sample performance YTD is 0.0%, and for the last 12 months is 19.8%. Over the same period the benchmark SPY performance was -1.8% and 13.1% respectively. Over the previous week the market value of iM-Combo3.R1 gained 0.72% at a time when SPY gained 1.37%. A starting capital of $100,000 at inception on 2/3/2014 would have grown to $157,767 which includes -$2,431 cash and excludes $3,561 spent on fees and slippage. |
 |
iM-Combo5: The model’s out of sample performance YTD is -0.6%, and for the last 12 months is 21.9%. Over the same period the benchmark SPY performance was -1.8% and 13.1% respectively. Over the previous week the market value of iM-Combo5 gained 0.69% at a time when SPY gained 1.37%. A starting capital of $100,000 at inception on 2/22/2016 would have grown to $127,003 which includes -$2,895 cash and excludes $714 spent on fees and slippage. |
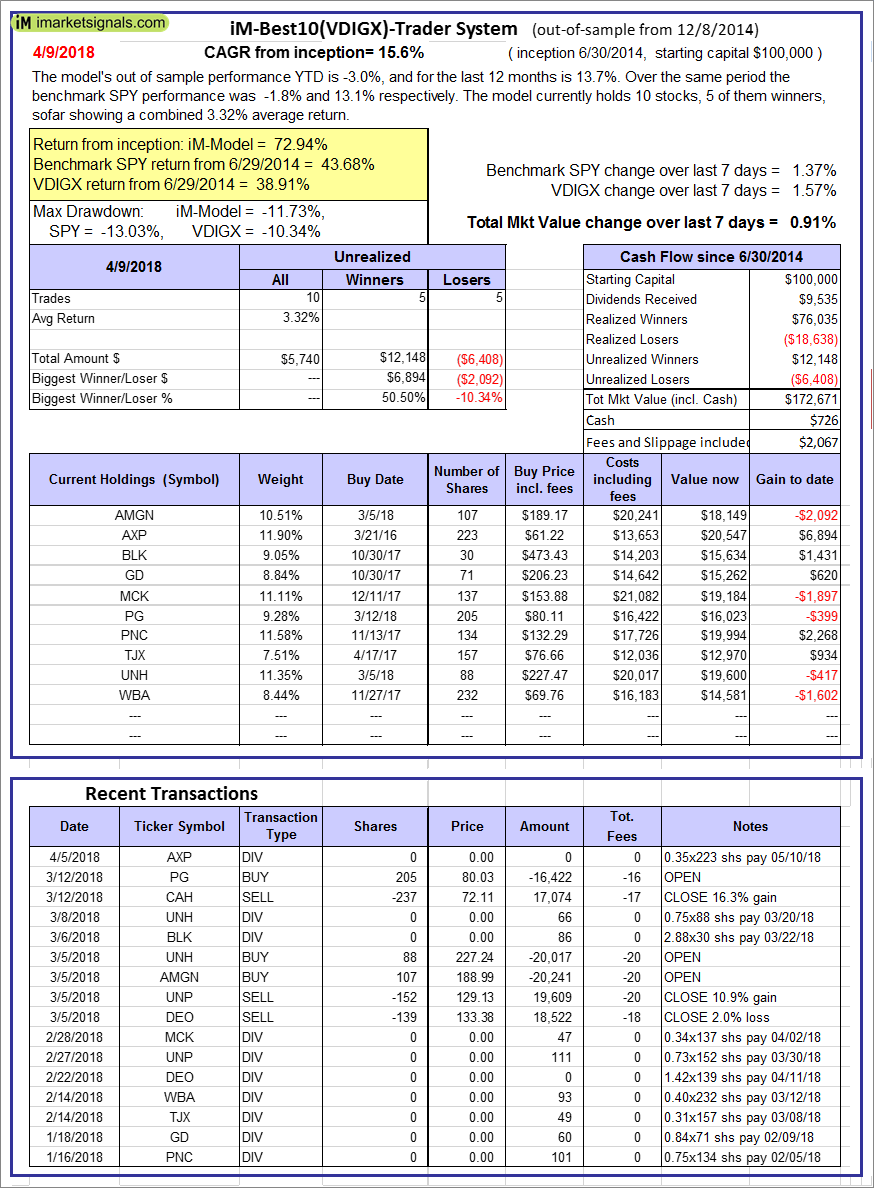  |
iM-Best10(VDIGX)-Trader: The model’s out of sample performance YTD is -3.0%, and for the last 12 months is 13.7%. Over the same period the benchmark SPY performance was -1.8% and 13.1% respectively. Since inception, on 7/1/2014, the model gained 72.94% while the benchmark SPY gained 43.68% and VDIGX gained 38.91% over the same period. Over the previous week the market value of iM-Best10(VDIGX) gained 0.91% at a time when SPY gained 1.37%. A starting capital of $100,000 at inception on 7/1/2014 would have grown to $172,671 which includes $726 cash and excludes $2,067 spent on fees and slippage. |
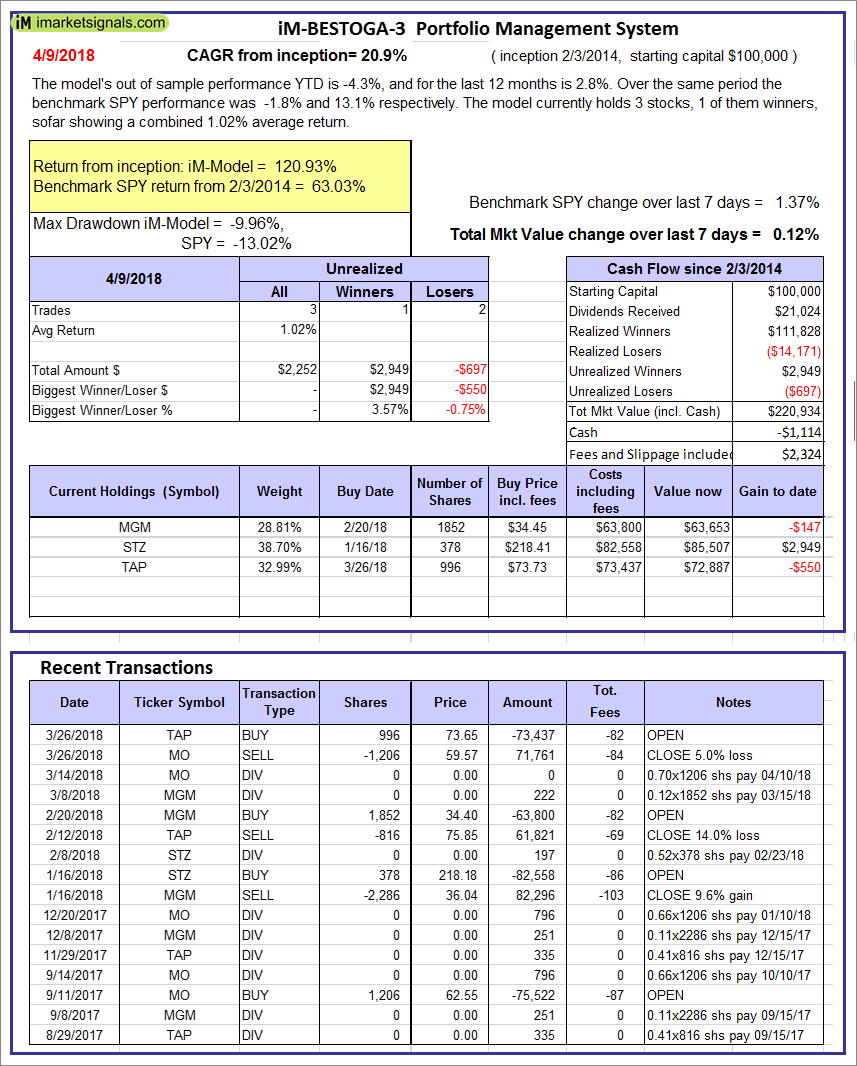 |
iM-BESTOGA-3: The model’s out of sample performance YTD is -4.3%, and for the last 12 months is 2.8%. Over the same period the benchmark SPY performance was -1.8% and 13.1% respectively. Over the previous week the market value of iM-BESTOGA-3 gained 0.12% at a time when SPY gained 1.37%. A starting capital of $100,000 at inception on 2/3/2014 would have grown to $220,934 which includes -$1,114 cash and excludes $2,324 spent on fees and slippage. |
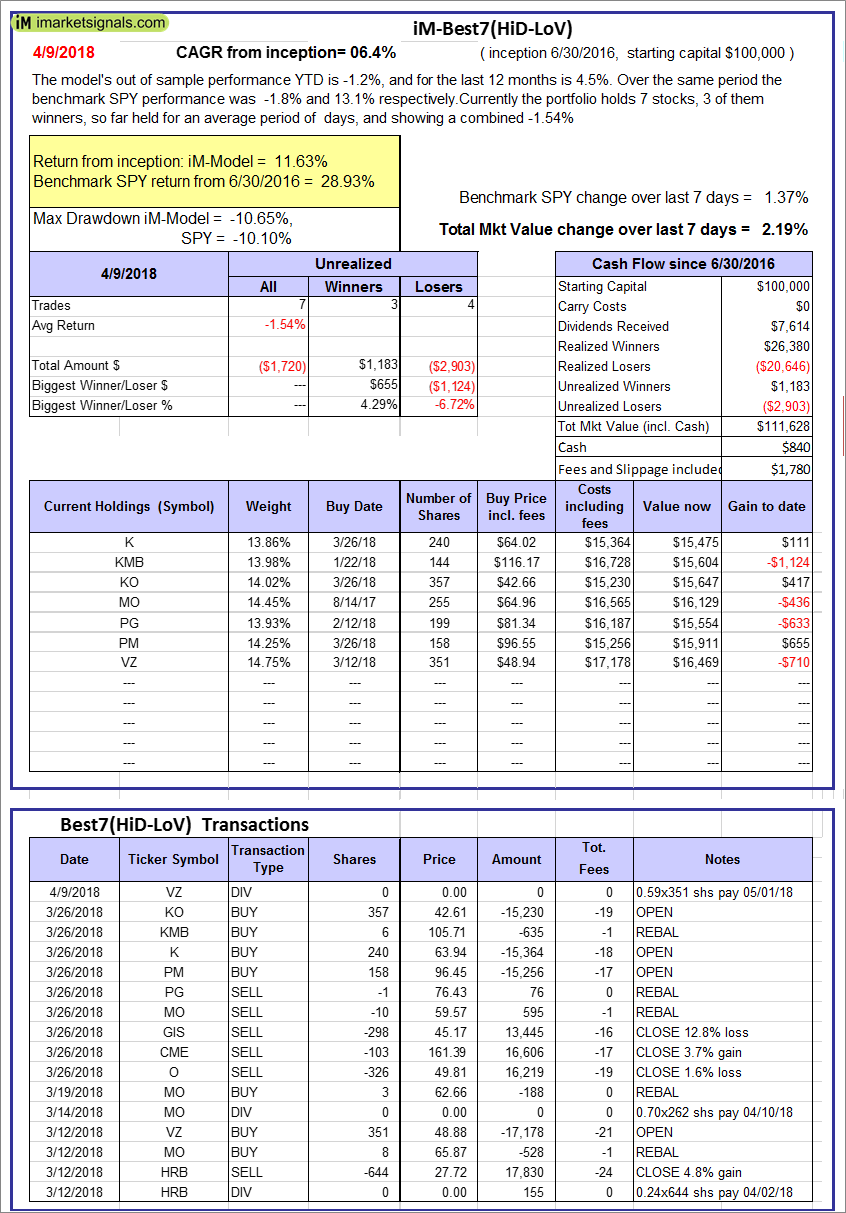 |
iM-Best7(HiD-LoV): The model’s out of sample performance YTD is -1.2%, and for the last 12 months is 4.5%. Over the same period the benchmark SPY performance was -1.8% and 13.1% respectively. Over the previous week the market value of iM-BESTOGA-3 gained 2.19% at a time when SPY gained 1.37%. A starting capital of $100,000 at inception on 6/30/2016 would have grown to $111,628 which includes $840 cash and excludes $1,780 spent on fees and slippage. |
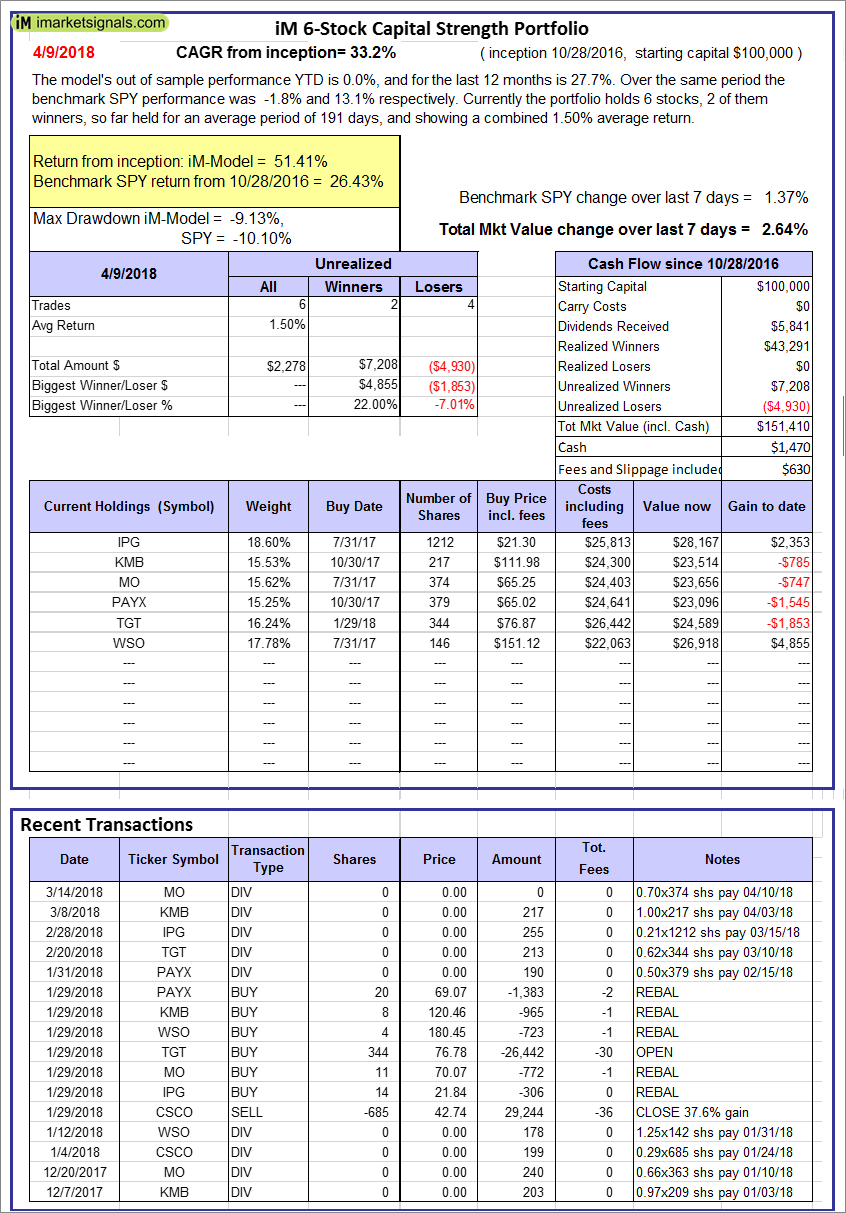 |
iM 6-Stock Capital Strength Portfolio: The model’s out of sample performance YTD is 0.0%, and for the last 12 months is 27.7%. Over the same period the benchmark SPY performance was -1.8% and 13.1% respectively. Over the previous week the market value of the iM 6-Stock Capital Strength Portfolio gained 2.64% at a time when SPY gained 1.37%. A starting capital of $100,000 at inception on 10/28/2016 would have grown to $151,410 which includes $1,470 cash and excludes $630 spent on fees and slippage. |
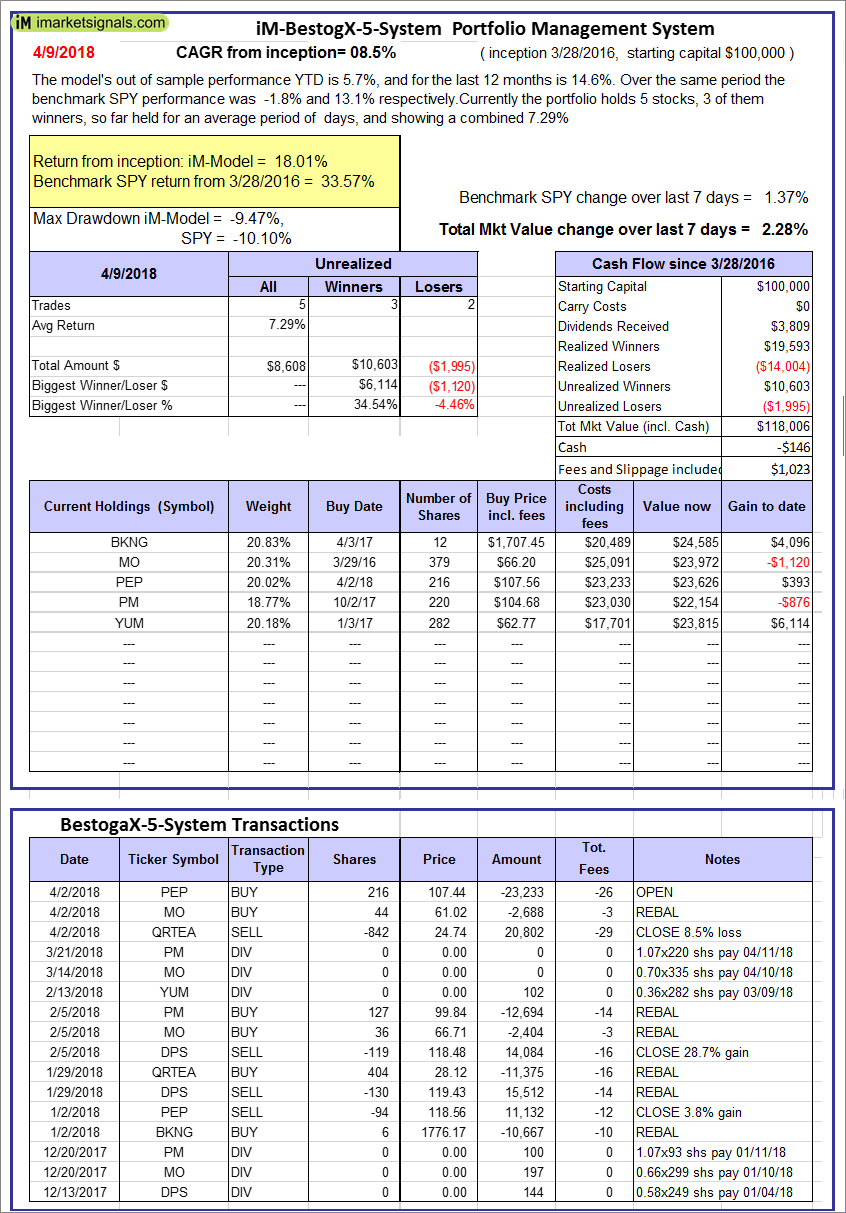 |
iM-BestogaX5-System: The model’s out of sample performance YTD is 5.7%, and for the last 12 months is 14.6%. Over the same period the benchmark SPY performance was -1.8% and 13.1% respectively. Over the previous week the market value of iM-BestogaX5-System gained 2.28% at a time when SPY gained 1.37%. A starting capital of $100,000 at inception on 3/28/2016 would have grown to $118,006 which includes -$146 cash and excludes $1,023 spent on fees and slippage. |
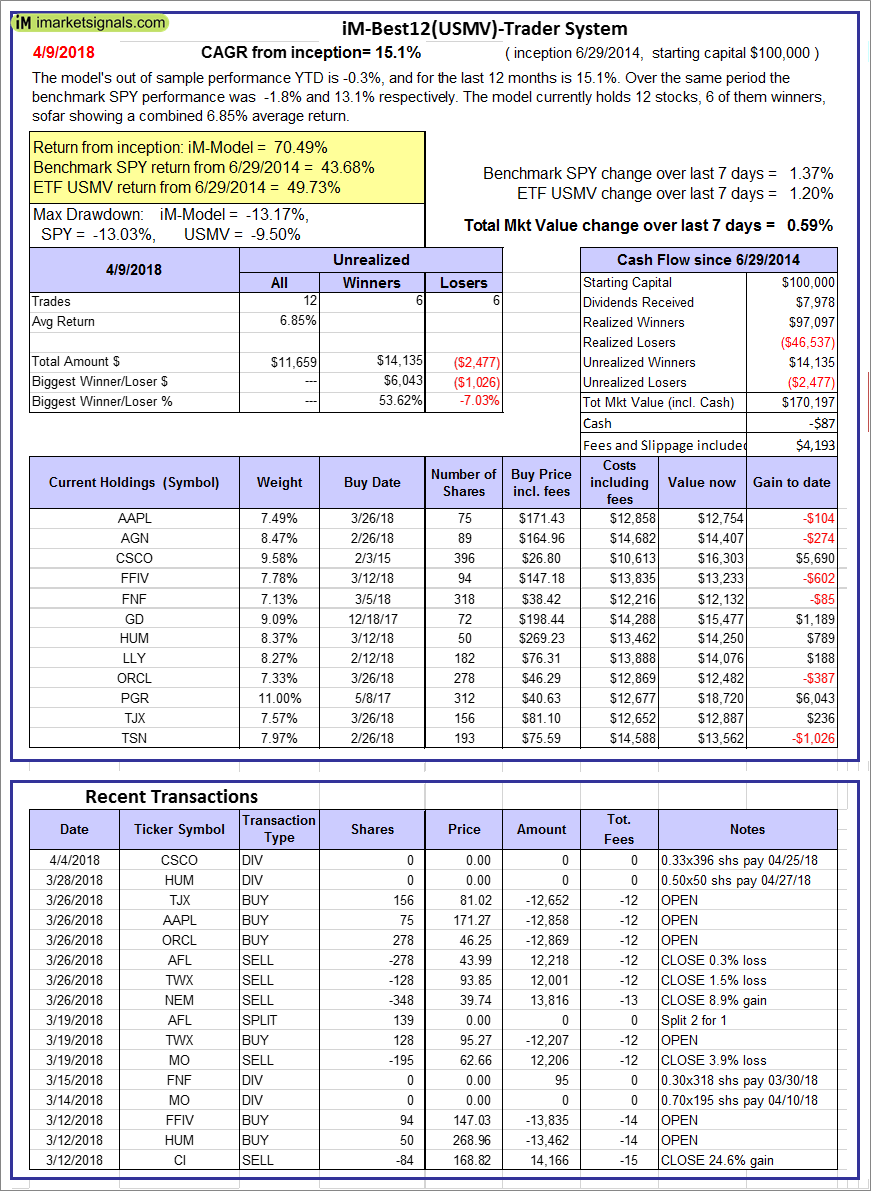 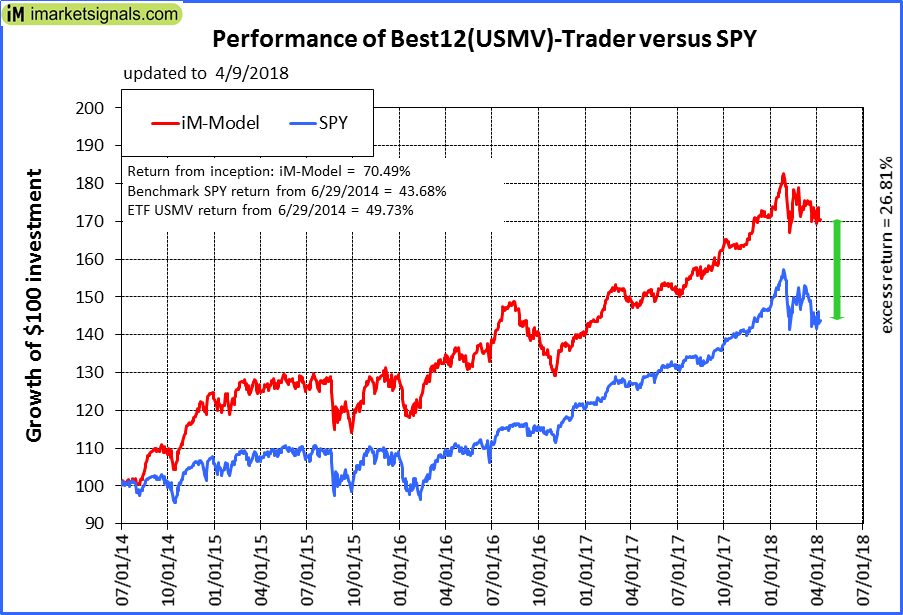 |
iM-Best12(USMV)-Trader: The model’s out of sample performance YTD is -0.3%, and for the last 12 months is 15.1%. Over the same period the benchmark SPY performance was -1.8% and 13.1% respectively. Since inception, on 6/30/2014, the model gained 70.49% while the benchmark SPY gained 43.68% and the ETF USMV gained 49.73% over the same period. Over the previous week the market value of iM-Best12(USMV)-Trader gained 0.59% at a time when SPY gained 1.37%. A starting capital of $100,000 at inception on 6/30/2014 would have grown to $170,197 which includes -$87 cash and excludes $4,193 spent on fees and slippage. |
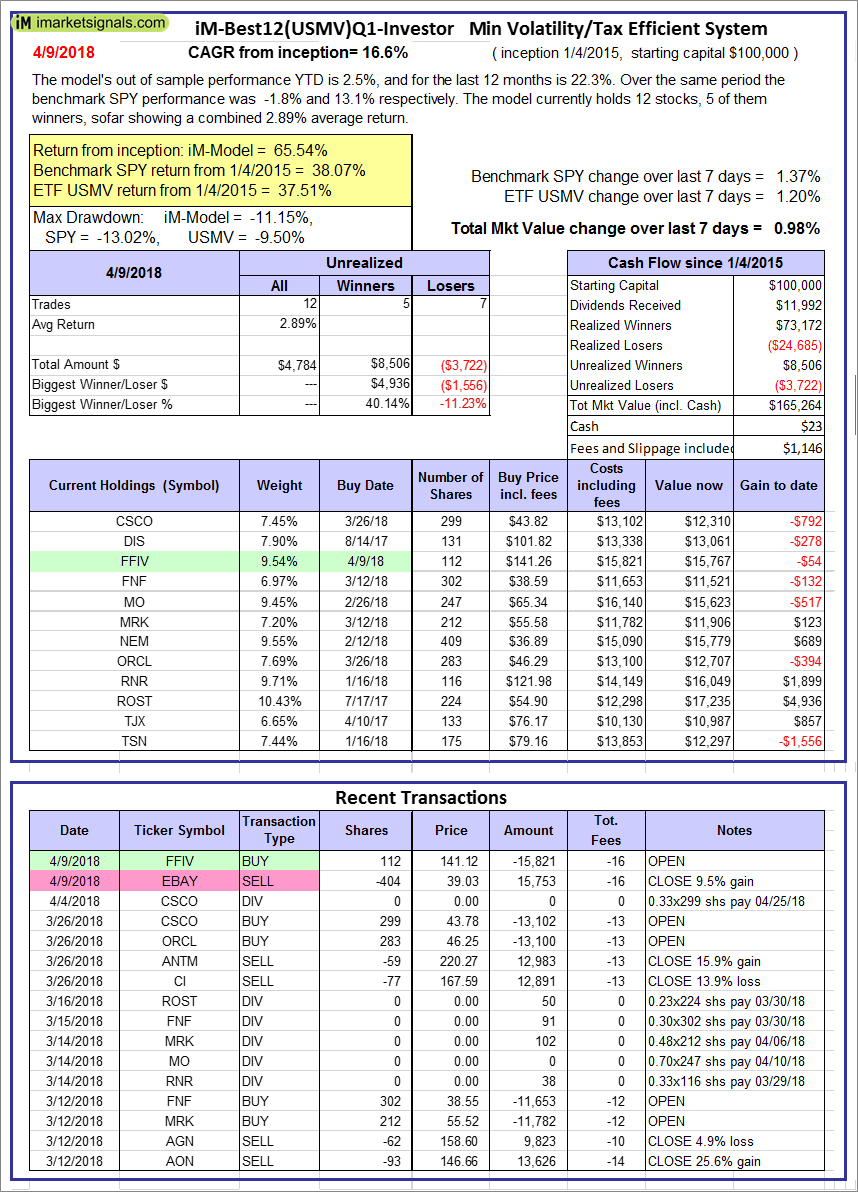 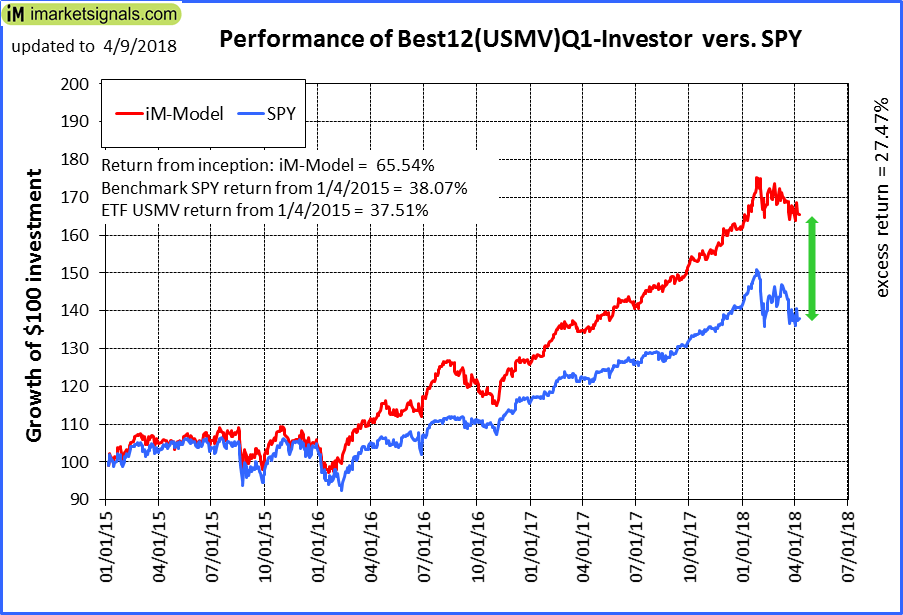 |
iM-Best12(USMV)Q1-Investor: The model’s out of sample performance YTD is 2.5%, and for the last 12 months is 22.3%. Over the same period the benchmark SPY performance was -1.8% and 13.1% respectively. Since inception, on 1/5/2015, the model gained 65.54% while the benchmark SPY gained 38.07% and the ETF USMV gained 37.51% over the same period. Over the previous week the market value of iM-Best12(USMV)Q1 gained 0.98% at a time when SPY gained 1.37%. A starting capital of $100,000 at inception on 1/5/2015 would have grown to $165,264 which includes $23 cash and excludes $1,146 spent on fees and slippage. |
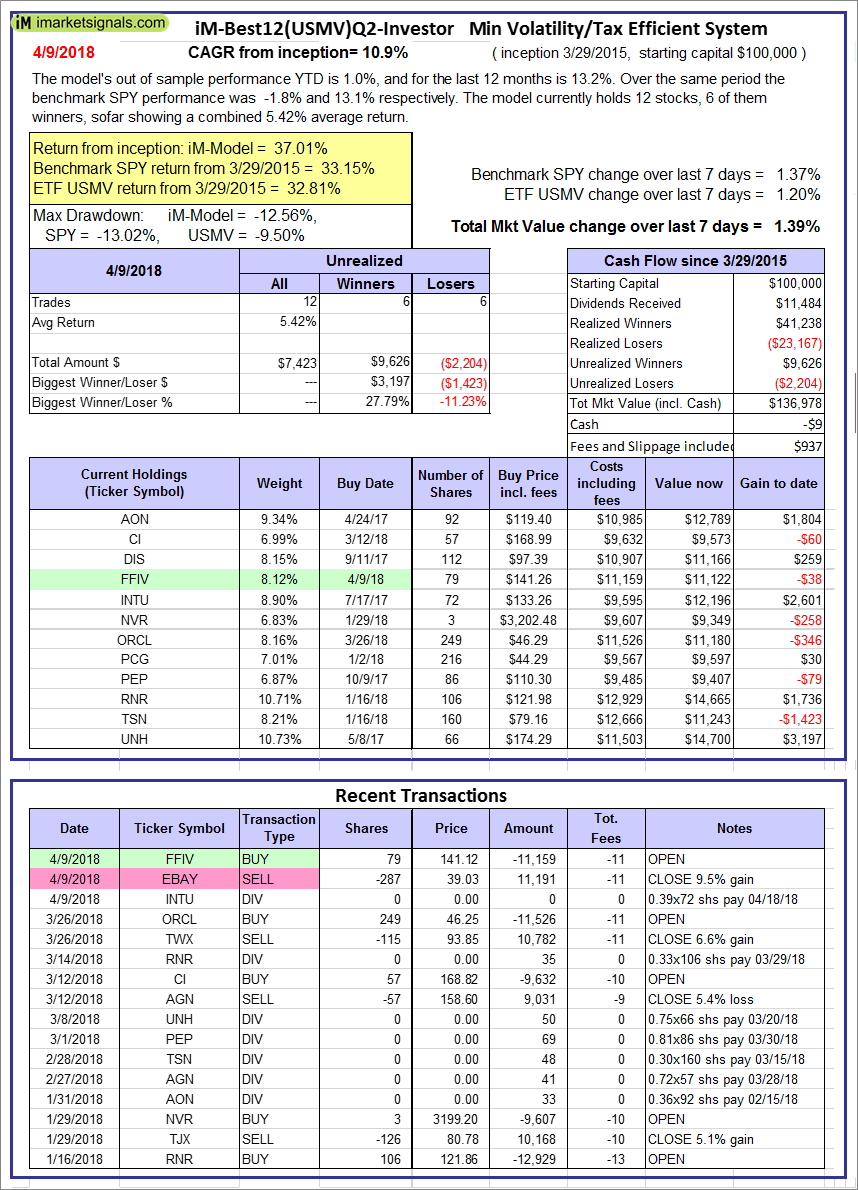 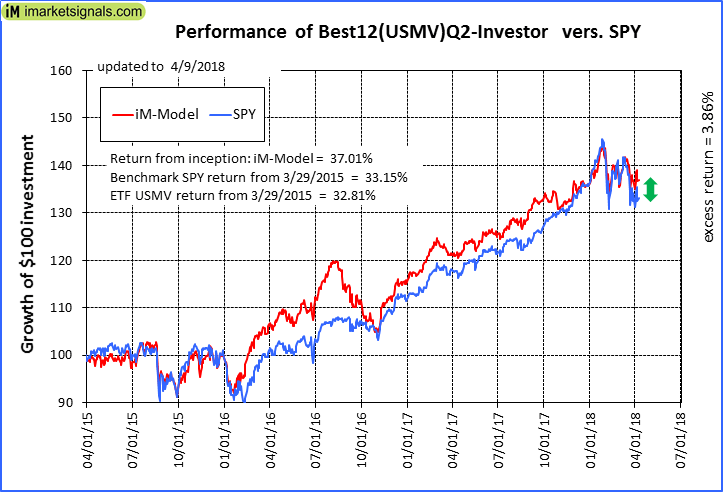 |
iM-Best12(USMV)Q2-Investor: The model’s out of sample performance YTD is 1.0%, and for the last 12 months is 13.2%. Over the same period the benchmark SPY performance was -1.8% and 13.1% respectively. Since inception, on 3/30/2015, the model gained 37.01% while the benchmark SPY gained 33.15% and the ETF USMV gained 32.81% over the same period. Over the previous week the market value of iM-Best12(USMV)Q2 gained 1.39% at a time when SPY gained 1.37%. A starting capital of $100,000 at inception on 3/30/2015 would have grown to $136,978 which includes -$9 cash and excludes $937 spent on fees and slippage. |
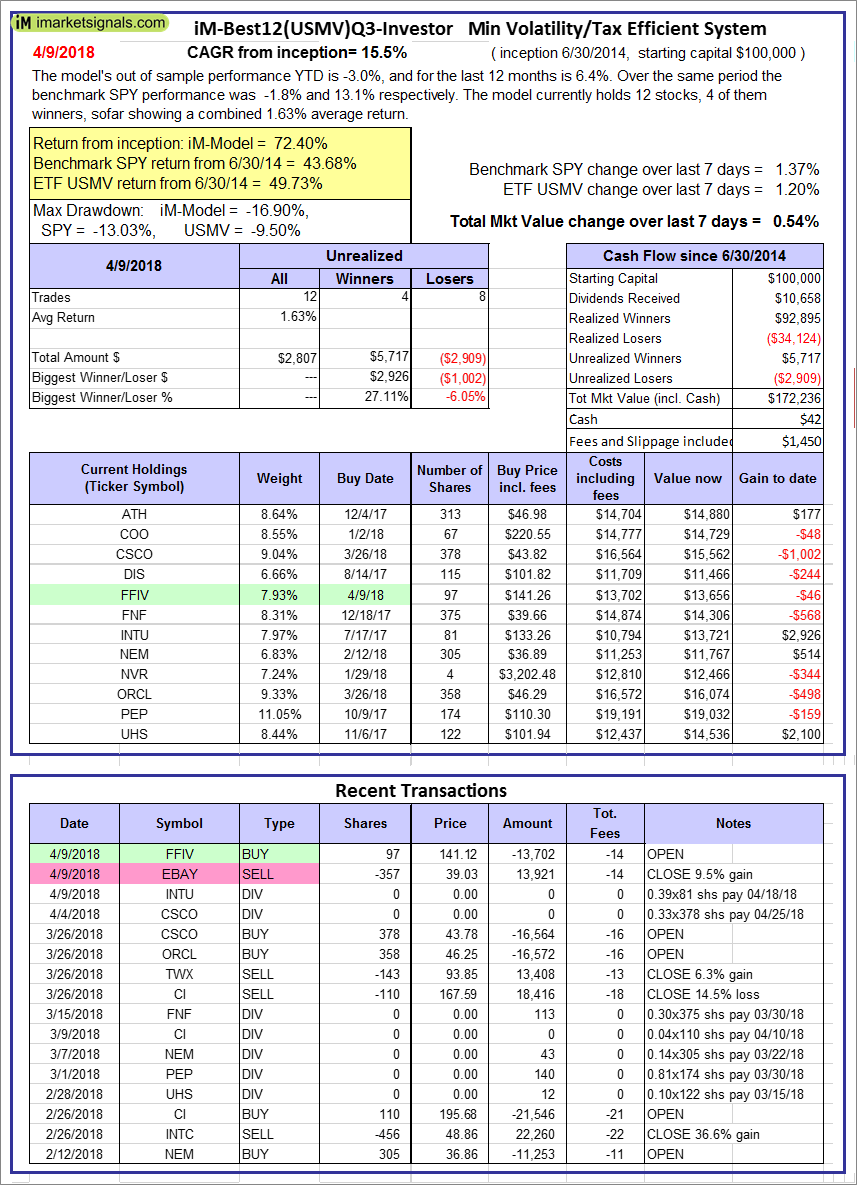 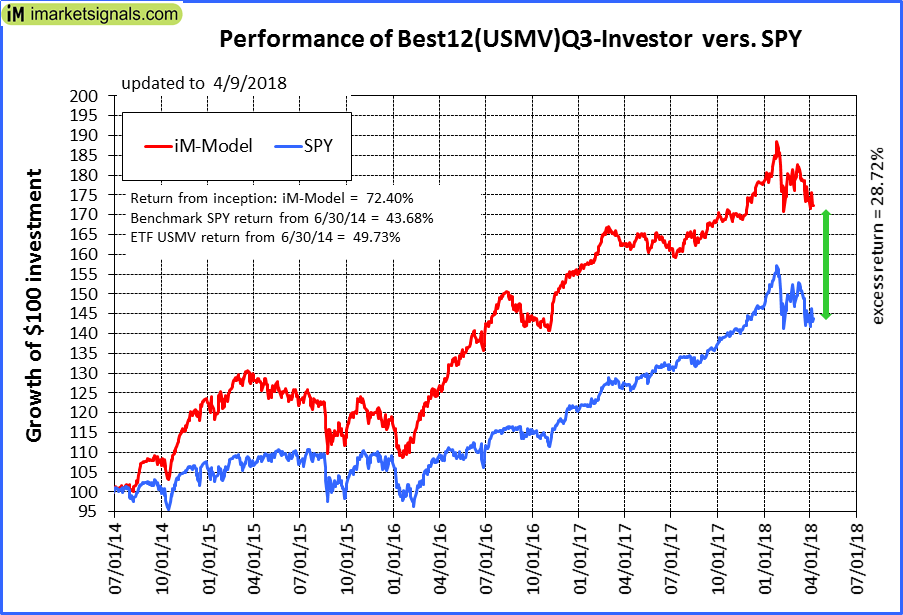 |
iM-Best12(USMV)Q3-Investor: The model’s out of sample performance YTD is -3.0%, and for the last 12 months is 6.4%. Over the same period the benchmark SPY performance was -1.8% and 13.1% respectively. Since inception, on 7/1/2014, the model gained 72.40% while the benchmark SPY gained 43.68% and the ETF USMV gained 49.73% over the same period. Over the previous week the market value of iM-Best12(USMV)Q3 gained 0.54% at a time when SPY gained 1.37%. A starting capital of $100,000 at inception on 7/1/2014 would have grown to $172,236 which includes $42 cash and excludes $1,450 spent on fees and slippage. |
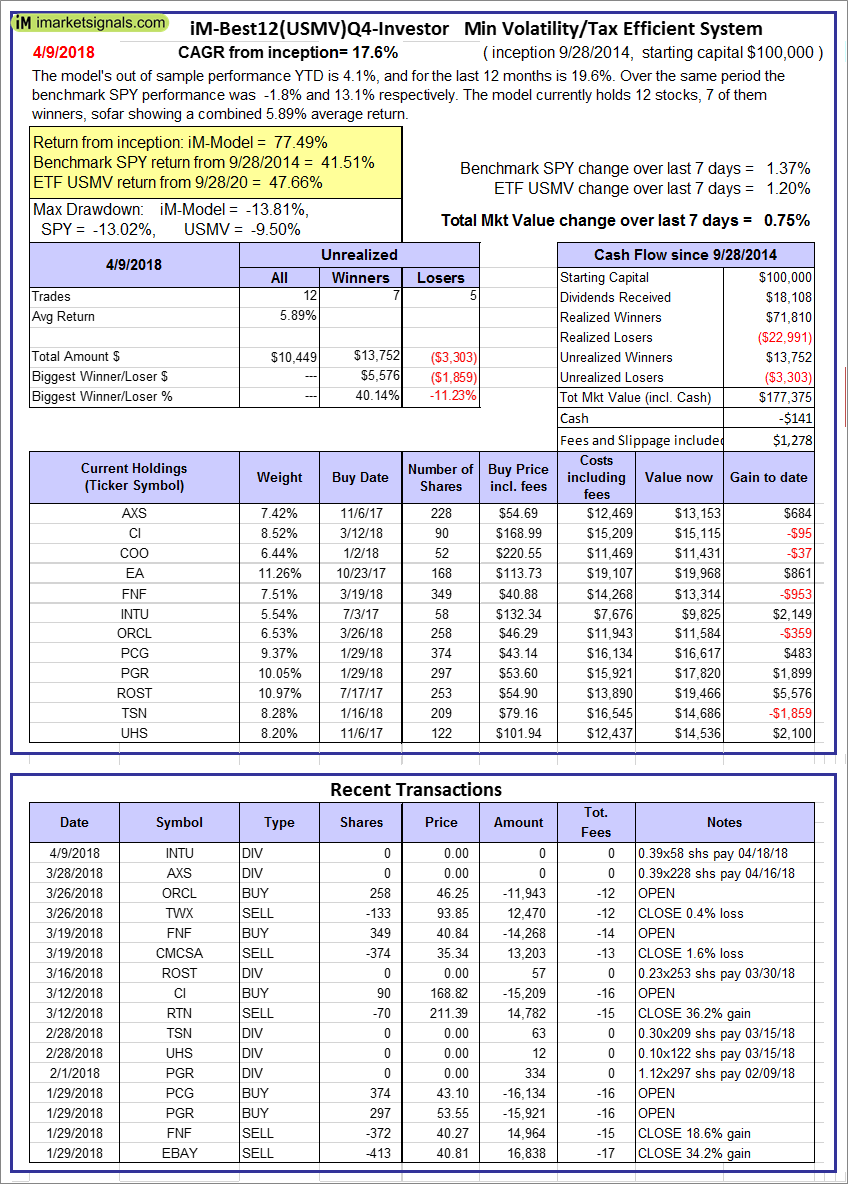 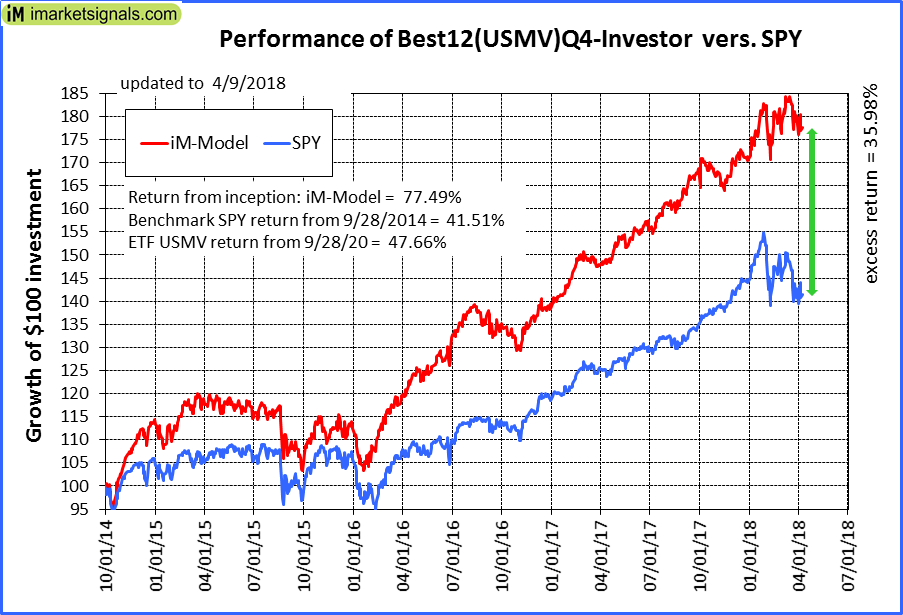 |
iM-Best12(USMV)Q4-Investor: Since inception, on 9/29/2014, the model gained 77.49% while the benchmark SPY gained 41.51% and the ETF USMV gained 47.66% over the same period. Over the previous week the market value of iM-Best12(USMV)Q4 gained 0.75% at a time when SPY gained 1.37%. A starting capital of $100,000 at inception on 9/29/2014 would have grown to $177,375 which includes -$141 cash and excludes $1,278 spent on fees and slippage. |
 |
Average Performance of iM-Best12(USMV)Q1+Q2+Q3+Q4-Investor resulted in an excess return of 41.90% over SPY. (see iM-USMV Investor Portfolio) |
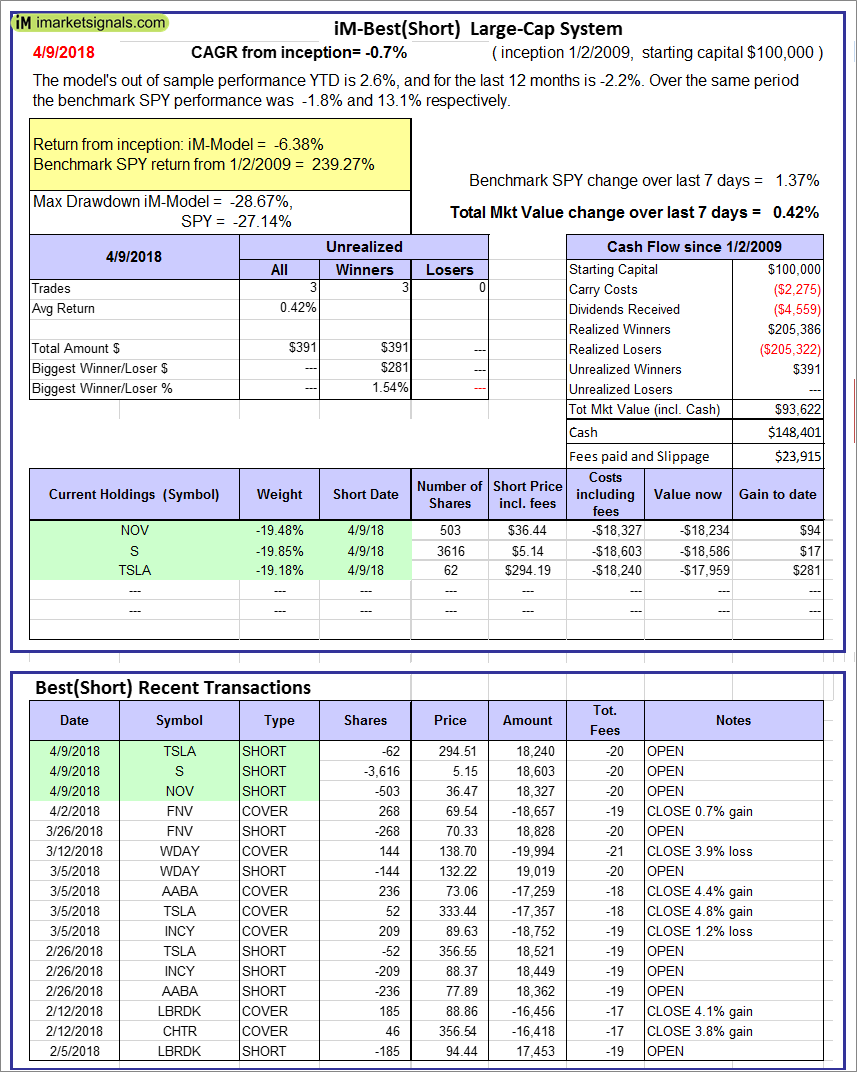 |
iM-Best(Short): The model’s out of sample performance YTD is 2.6%, and for the last 12 months is -2.2%. Over the same period the benchmark SPY performance was -1.8% and 13.1% respectively. Over the previous week the market value of iM-Best(Short) gained 0.42% at a time when SPY gained 1.37%. Over the period 1/2/2009 to 4/9/2018 the starting capital of $100,000 would have grown to $93,622 which includes $148,401 cash and excludes $23,915 spent on fees and slippage. |
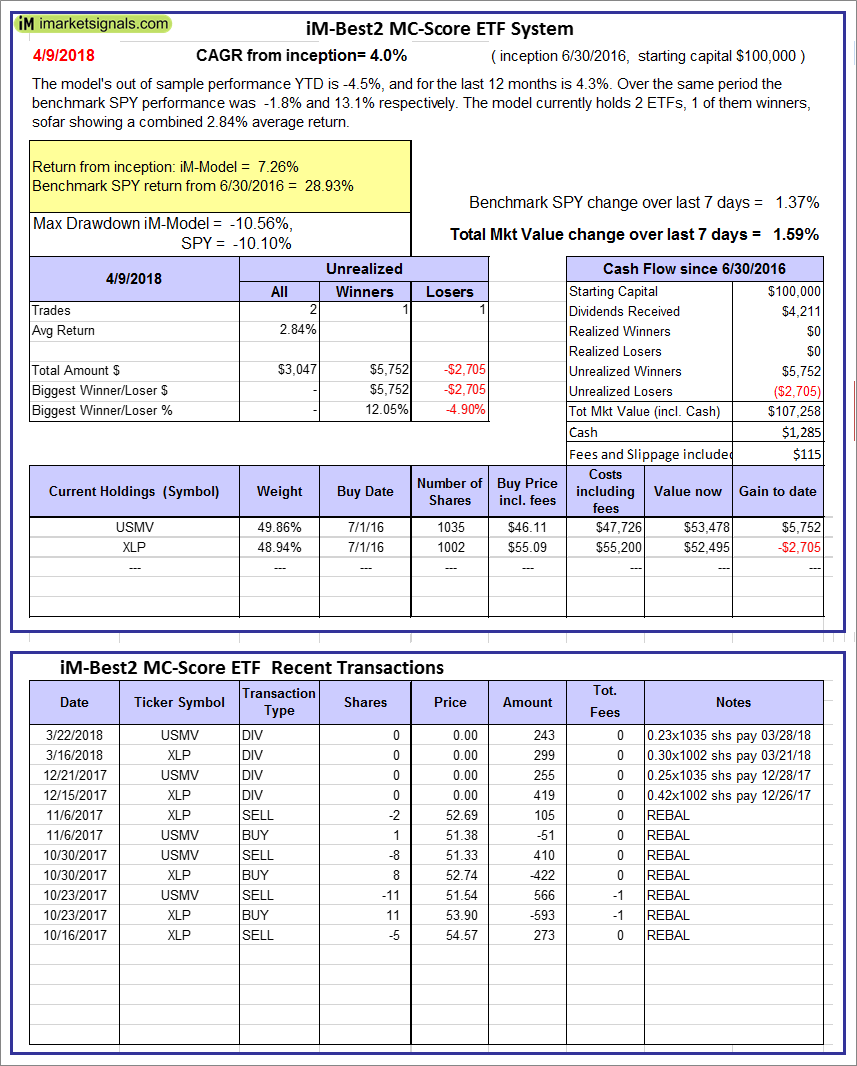 |
iM-Best2 MC-Score ETF System: The model’s out of sample performance YTD is -4.5%, and for the last 12 months is 4.3%. Over the same period the benchmark SPY performance was -1.8% and 13.1% respectively. Over the previous week the market value of the iM-Best2 MC-Score ETF System gained 1.59% at a time when SPY gained 1.37%. A starting capital of $100,000 at inception on 6/30/2016 would have grown to $107,258 which includes $1,285 cash and excludes $115 spent on fees and slippage. |
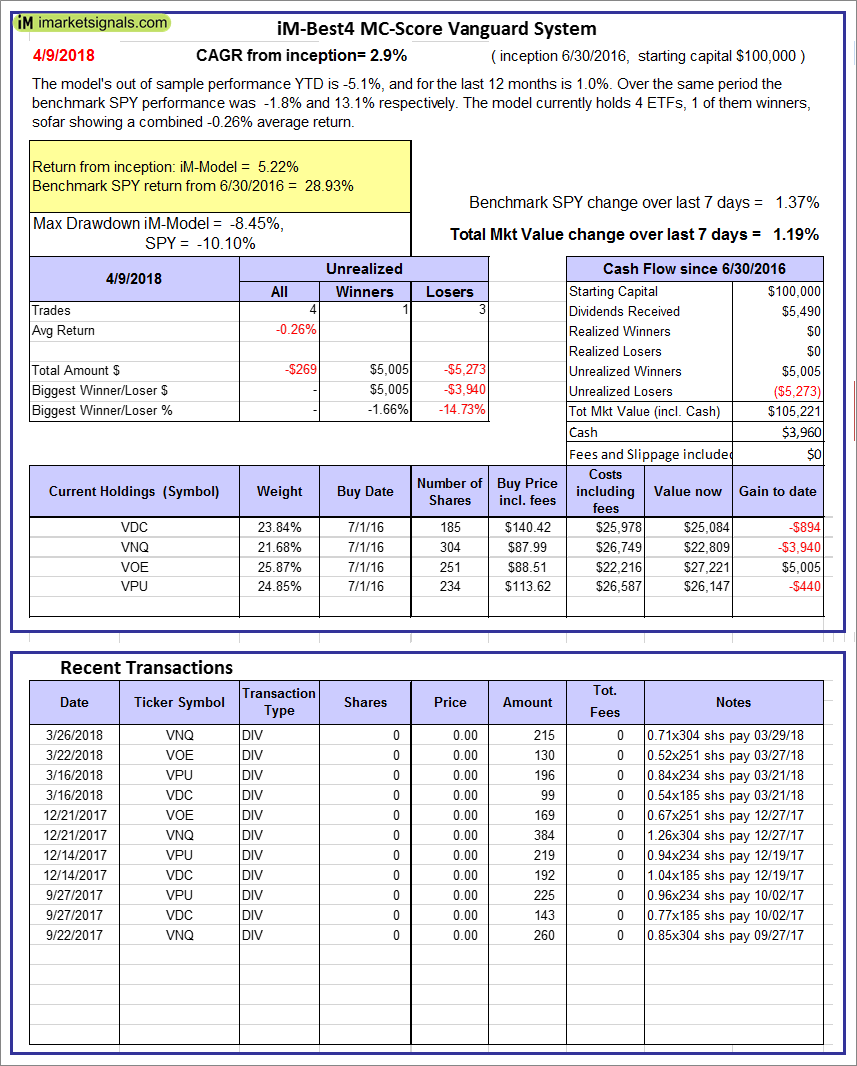 |
iM-Best4 MC-Score Vanguard System: The model’s out of sample performance YTD is -5.1%, and for the last 12 months is 1.0%. Over the same period the benchmark SPY performance was -1.8% and 13.1% respectively. Over the previous week the market value of the iM-Best4 MC-Score Vanguard System gained 1.19% at a time when SPY gained 1.37%. A starting capital of $100,000 at inception on 6/30/2016 would have grown to $105,221 which includes $3,960 cash and excludes $00 spent on fees and slippage. |
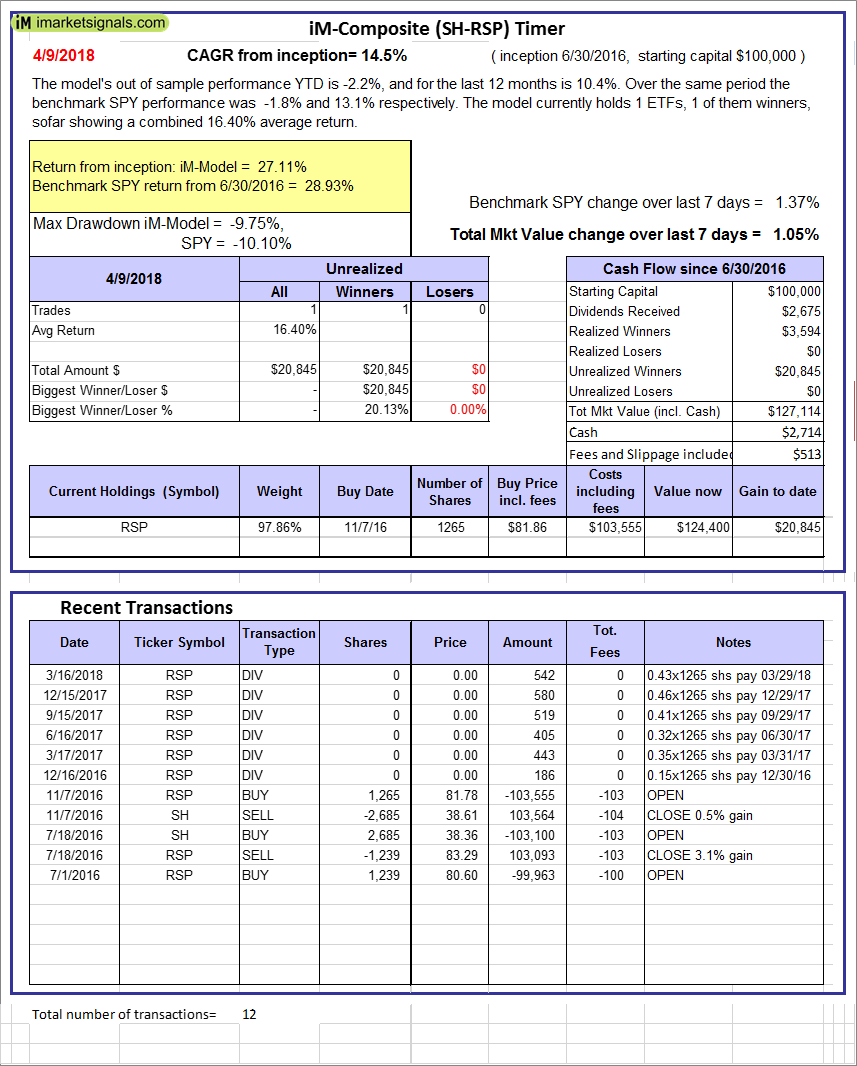 |
iM-Composite (SH-RSP) Timer: The model’s out of sample performance YTD is -2.2%, and for the last 12 months is 10.4%. Over the same period the benchmark SPY performance was -1.8% and 13.1% respectively. Over the previous week the market value of the iM-Composite (SH-RSP) Timer gained 1.05% at a time when SPY gained 1.37%. A starting capital of $100,000 at inception on 6/30/2016 would have grown to $127,114 which includes $2,714 cash and excludes $513 spent on fees and slippage. |
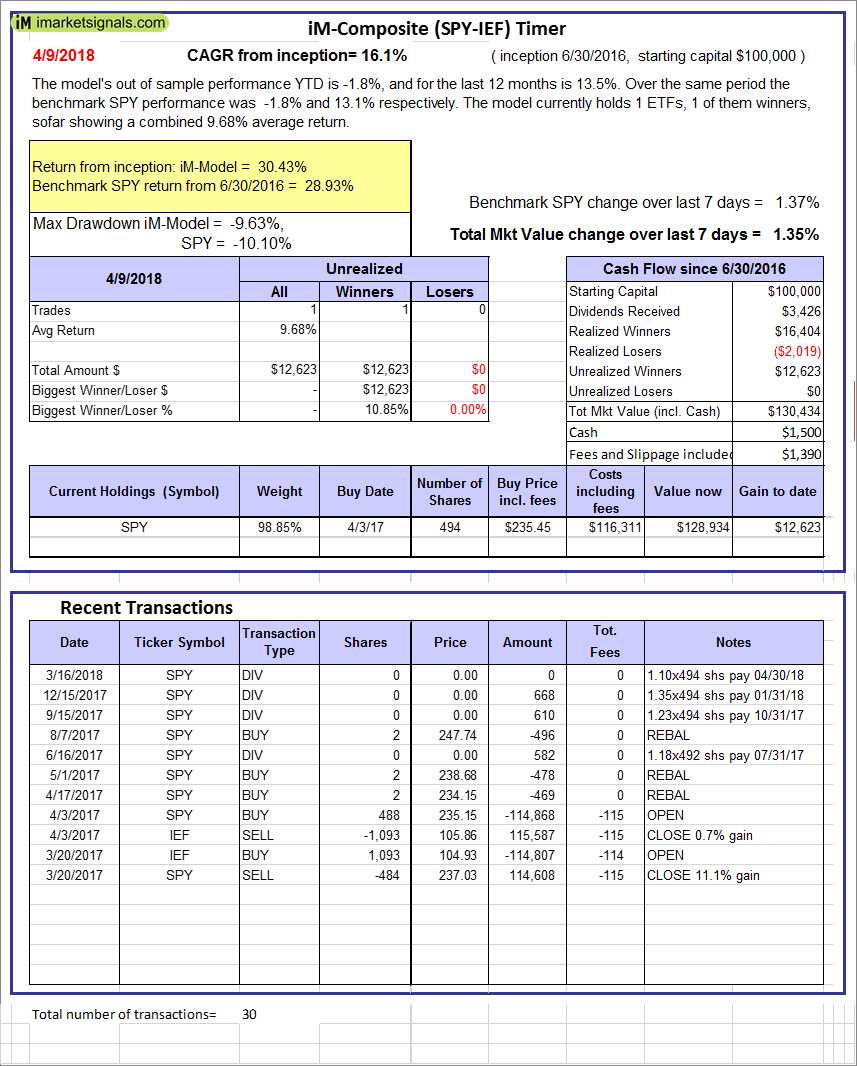 |
iM-Composite (SPY-IEF) Timer: The model’s out of sample performance YTD is -1.8%, and for the last 12 months is 13.5%. Over the same period the benchmark SPY performance was -1.8% and 13.1% respectively. Over the previous week the market value of the iM-Composite (SPY-IEF) Timer gained 1.35% at a time when SPY gained 1.37%. A starting capital of $100,000 at inception on 6/30/2016 would have grown to $130,434 which includes $1,500 cash and excludes $1,390 spent on fees and slippage. |
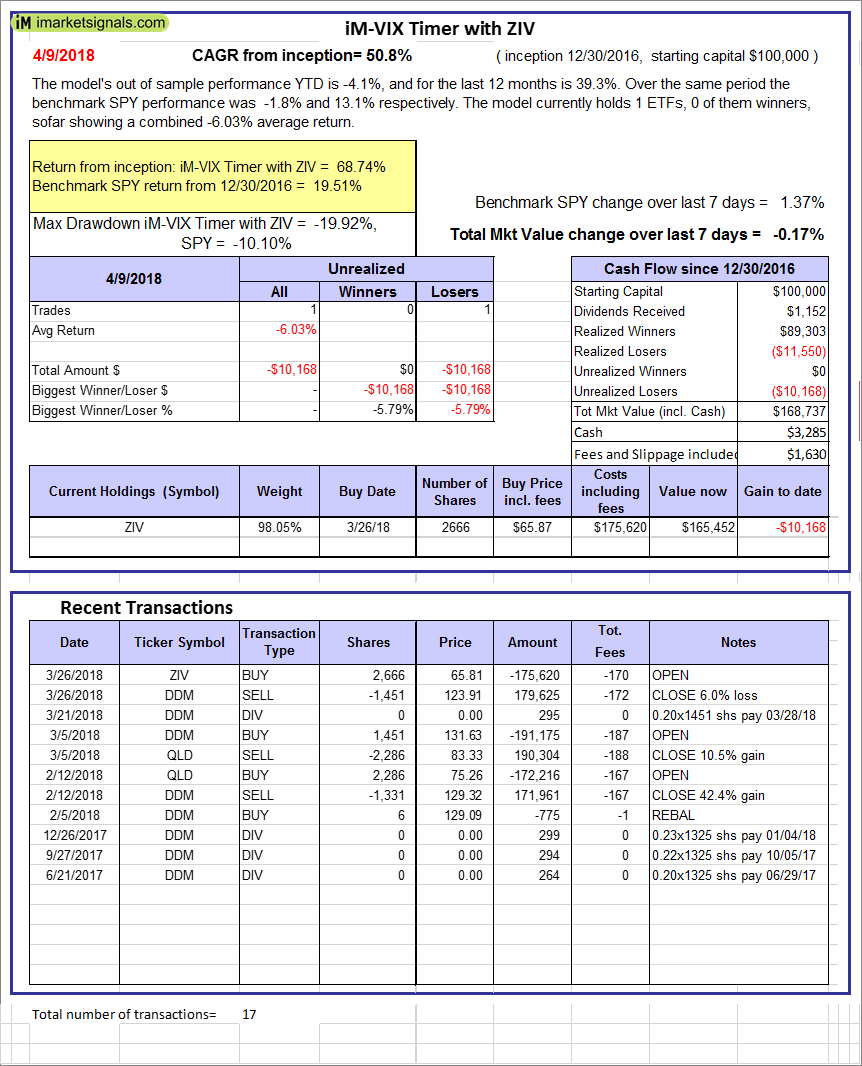 |
iM-VIX Timer with ZIV: The model’s out of sample performance YTD is -4.1%, and for the last 12 months is 39.3%. Over the same period the benchmark SPY performance was -1.8% and 13.1% respectively. Over the previous week the market value of the iM-VIX Timer with ZIV gained -0.17% at a time when SPY gained 1.37%. A starting capital of $100,000 at inception on 6/30/2016 would have grown to $168,737 which includes $3,285 cash and excludes $1,630 spent on fees and slippage. |
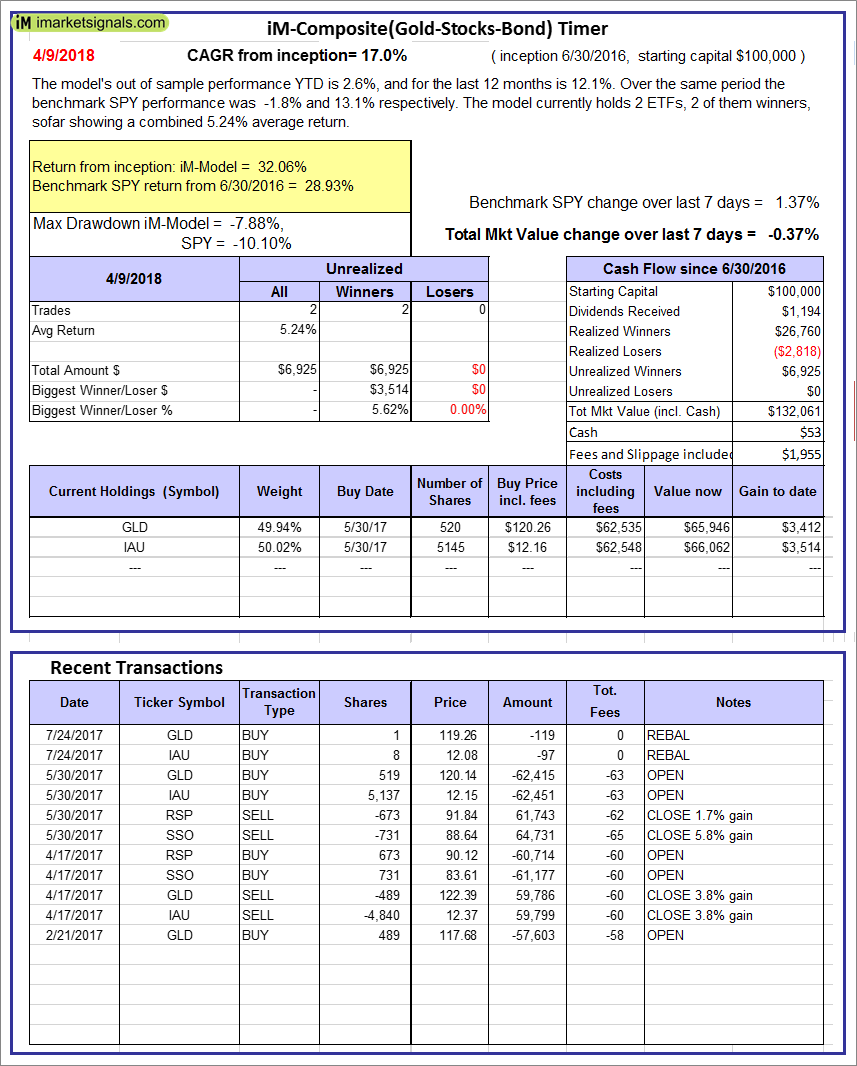 |
iM-Composite(Gold-Stocks-Bond) Timer: The model’s out of sample performance YTD is 2.6%, and for the last 12 months is 12.1%. Over the same period the benchmark SPY performance was -1.8% and 13.1% respectively. Over the previous week the market value of the iM-Composite(Gold-Stocks-Bond) Timer gained -0.37% at a time when SPY gained 1.37%. A starting capital of $100,000 at inception on 6/30/2016 would have grown to $132,061 which includes $53 cash and excludes $1,955 spent on fees and slippage. |
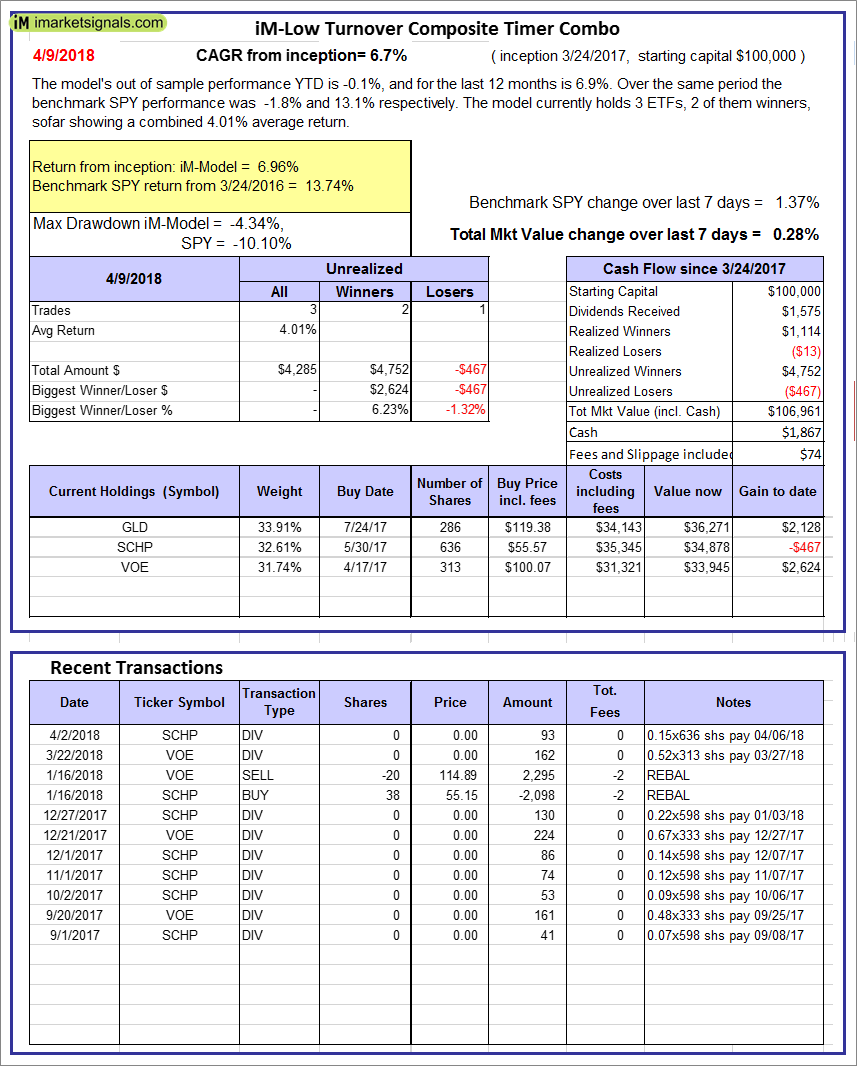 |
iM-Low Turnover Composite Timer Combo: The model’s out of sample performance YTD is -0.1%, and for the last 12 months is 6.9%. Over the same period the benchmark SPY performance was -1.8% and 13.1% respectively. Over the previous week the market value of the iM-Low Turnover Composite Timer Combo gained 0.28% at a time when SPY gained 1.37%. A starting capital of $100,000 at inception on 3/24/27 would have grown to $106,961 which includes $1,867 cash and excludes $74 spent on fees and slippage. |
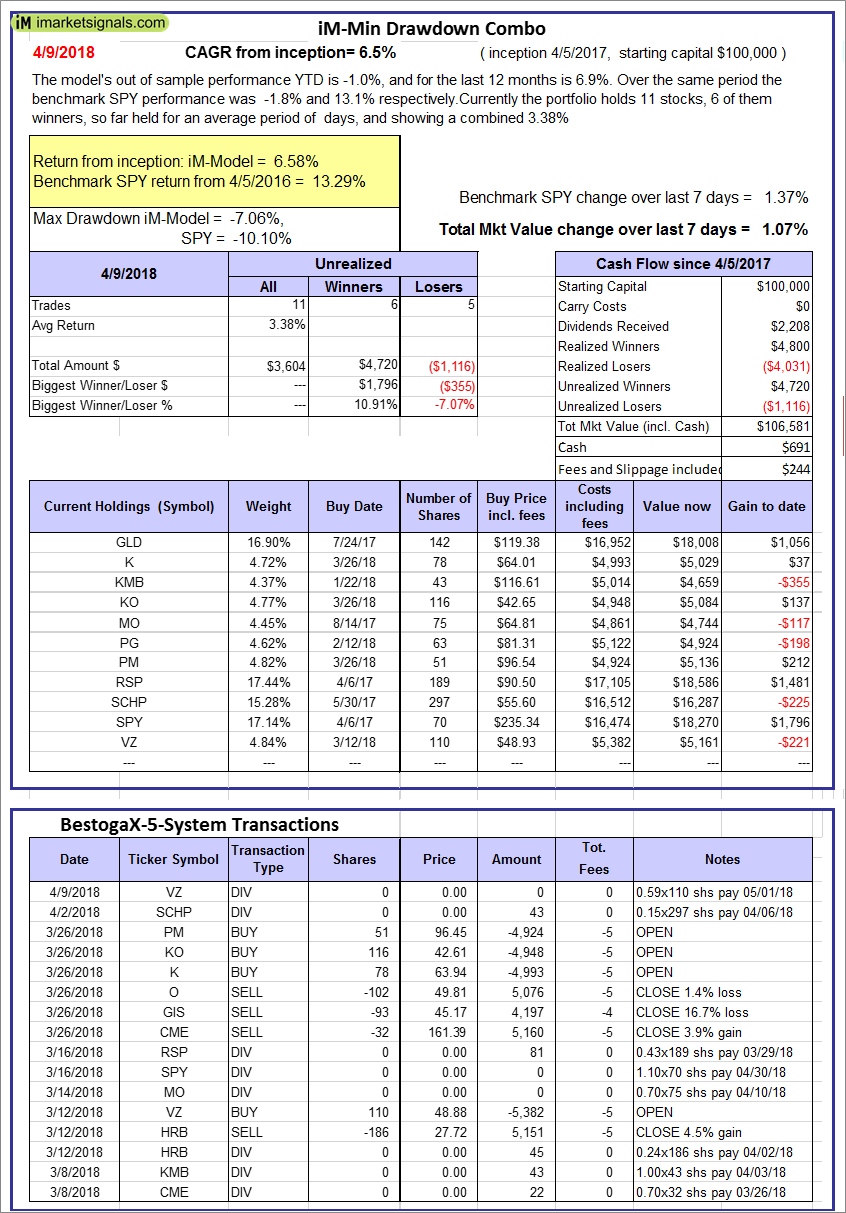 |
iM-Min Drawdown Combo: The model’s out of sample performance YTD is -1.0%, and for the last 12 months is 6.9%. Over the same period the benchmark SPY performance was -1.8% and 13.1% respectively. Over the previous week the market value of the iM-Min Drawdown Combo gained 1.07% at a time when SPY gained 1.37%. A starting capital of $100,000 at inception on 4/5/2017 would have grown to $106,581 which includes $691 cash and excludes $244 spent on fees and slippage. |
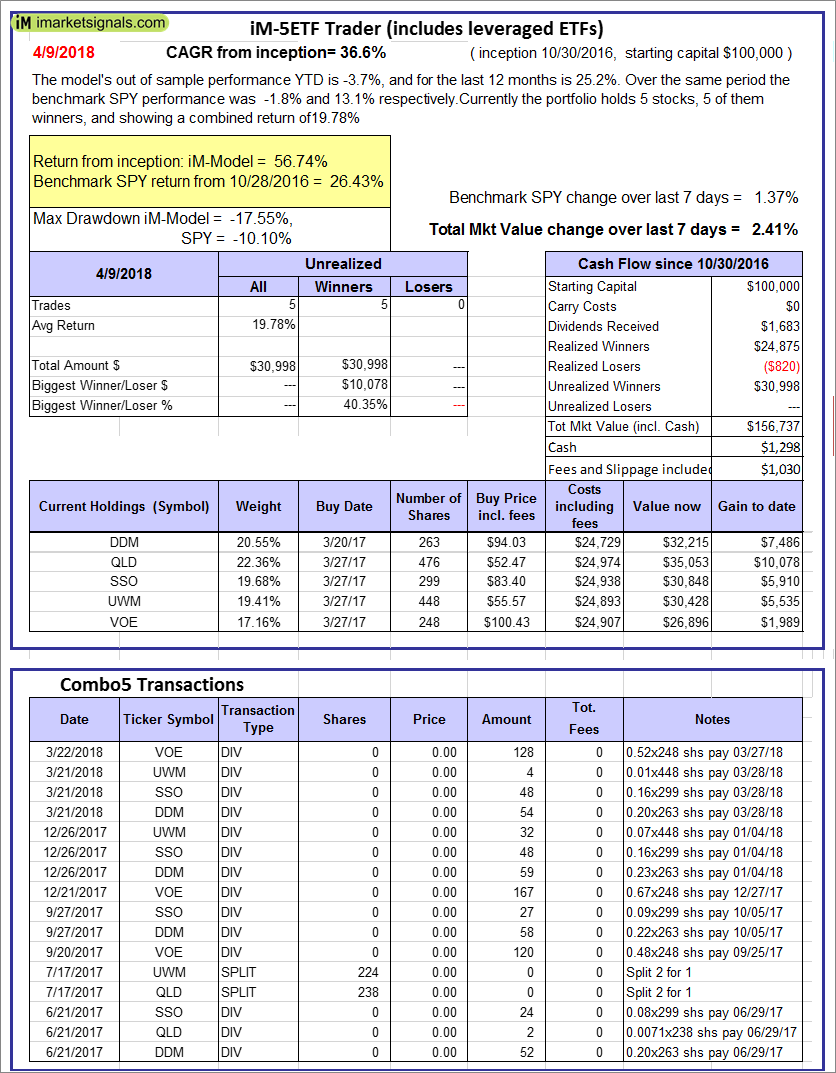 |
iM-5ETF Trader (includes leveraged ETFs): The model’s out of sample performance YTD is -3.7%, and for the last 12 months is 25.2%. Over the same period the benchmark SPY performance was -1.8% and 13.1% respectively. Over the previous week the market value of the iM-5ETF Trader (includes leveraged ETFs) gained 2.41% at a time when SPY gained 1.37%. A starting capital of $100,000 at inception on 10/30/2016 would have grown to $156,737 which includes $1,298 cash and excludes $1,030 spent on fees and slippage. |
 |
iM-Standard 5ETF Trader (excludes leveraged ETFs): The model’s out of sample performance YTD is -1.9%, and for the last 12 months is 12.2%. Over the same period the benchmark SPY performance was -1.8% and 13.1% respectively. Over the previous week the market value of the iM-Standard 5ETF Trader (excludes leveraged ETFs) gained 1.20% at a time when SPY gained 1.37%. A starting capital of $100,000 at inception on 10/30/2016 would have grown to $123,155 which includes $2,419 cash and excludes $880 spent on fees and slippage. |
iM-Best Reports – 4/9/2018
Posted in pmp SPY-SH
Leave a Reply
You must be logged in to post a comment.