  |
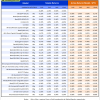
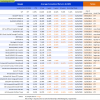
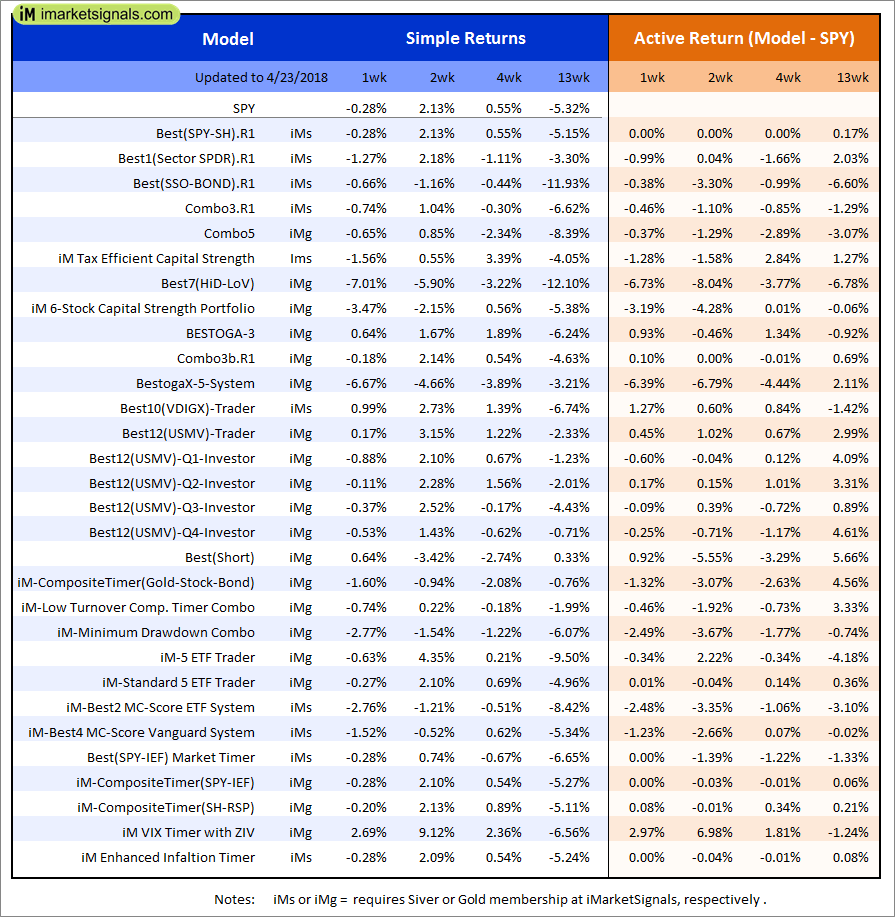
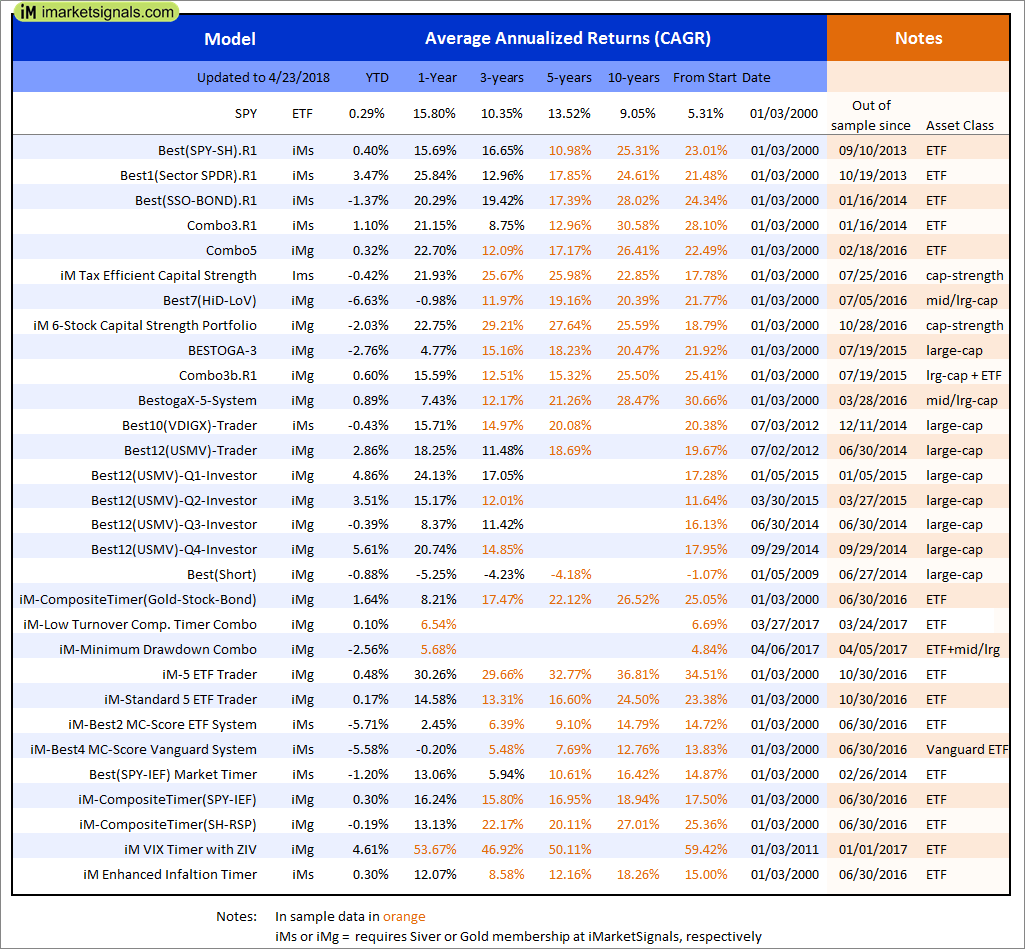
Out of sample performance summary of our models for the past 1, 2, 4 and 13 week periods. The active active return indicates how the models over- or underperformed the benchmark ETF SPY. Also the YTD, and the 1-, 3-, 5- and 10-year annualized returns are shown in the second table |
|
|
iM-Best(SPY-SH).R1: The model’s out of sample performance YTD is 0.3%, and for the last 12 months is 16.2%. Over the same period the benchmark SPY performance was 0.3% and 15.8% respectively. Over the previous week the market value of Best(SPY-SH) gained -0.28% at a time when SPY gained -0.28%. A starting capital of $100,000 at inception on 1/2/2009 would have grown to $564,551 which includes $222 cash and excludes $15,369 spent on fees and slippage. |
|
|
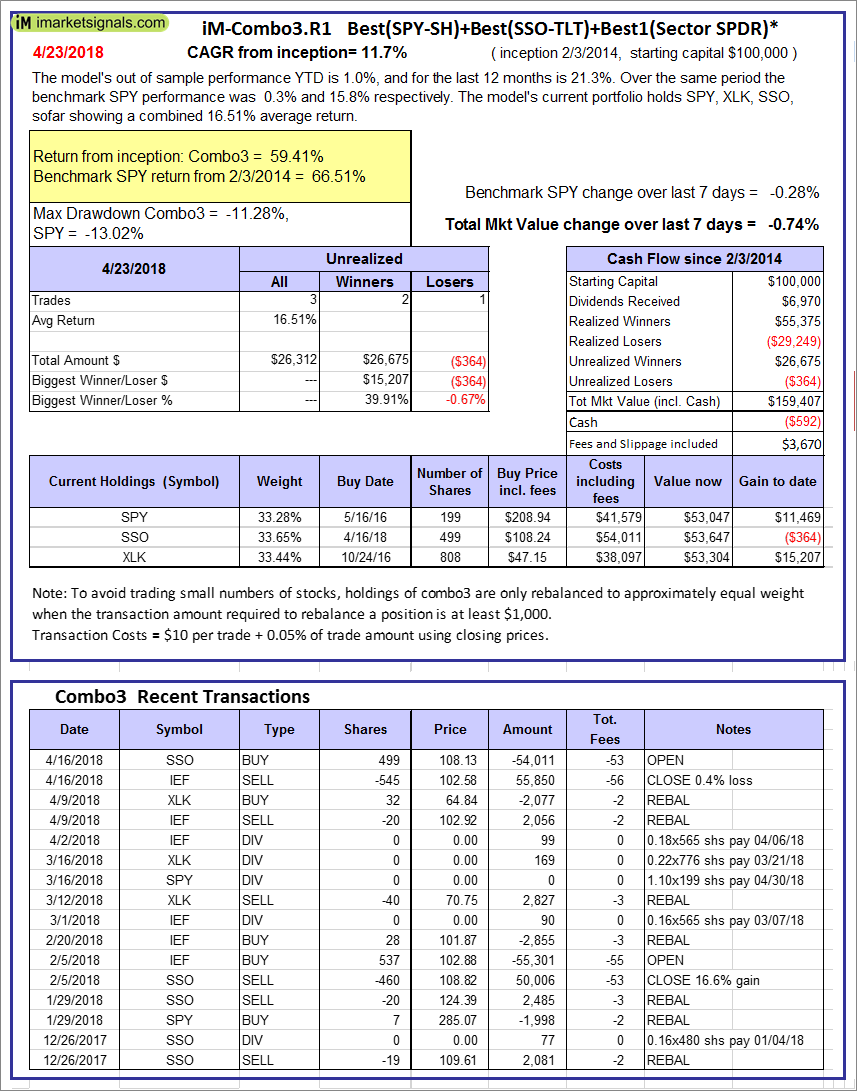
iM-Combo3.R1: The model’s out of sample performance YTD is 1.0%, and for the last 12 months is 21.3%. Over the same period the benchmark SPY performance was 0.3% and 15.8% respectively. Over the previous week the market value of iM-Combo3.R1 gained -0.74% at a time when SPY gained -0.28%. A starting capital of $100,000 at inception on 2/3/2014 would have grown to $159,407 which includes -$592 cash and excludes $3,670 spent on fees and slippage. |
|
|
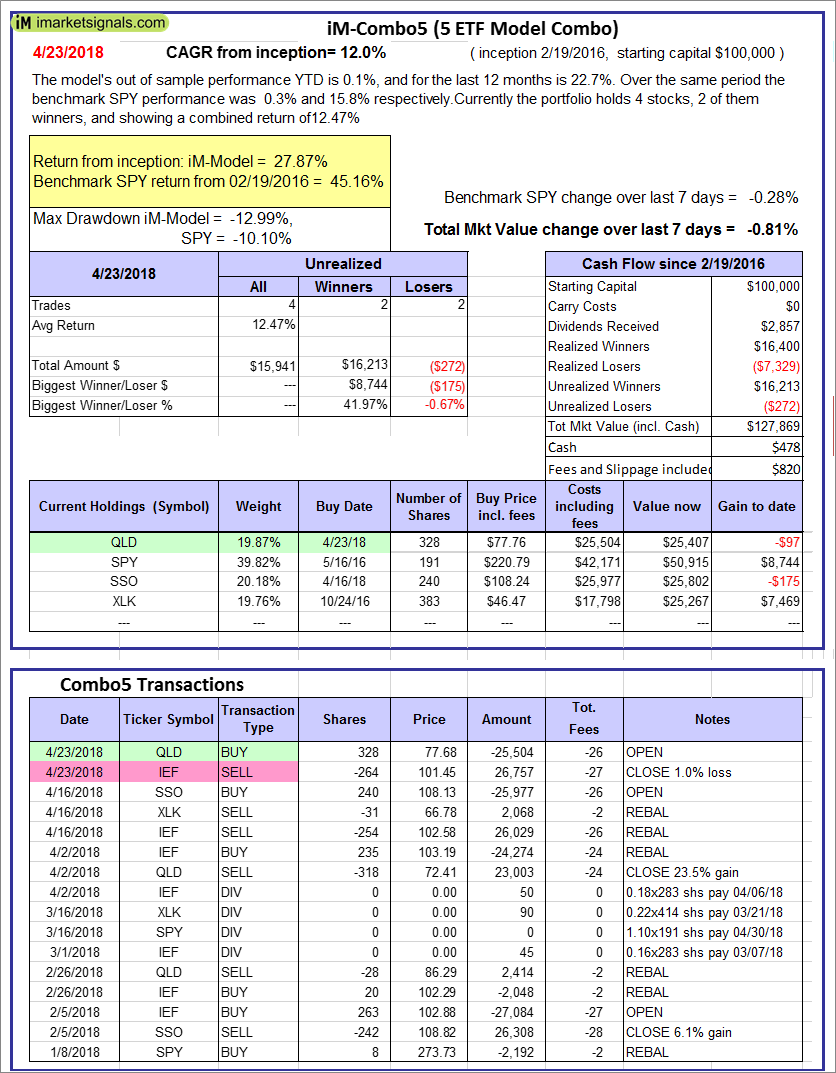
iM-Combo5: The model’s out of sample performance YTD is 0.1%, and for the last 12 months is 22.7%. Over the same period the benchmark SPY performance was 0.3% and 15.8% respectively. Over the previous week the market value of iM-Combo5 gained -0.81% at a time when SPY gained -0.28%. A starting capital of $100,000 at inception on 2/22/2016 would have grown to $127,869 which includes $478 cash and excludes $820 spent on fees and slippage. |
|
|
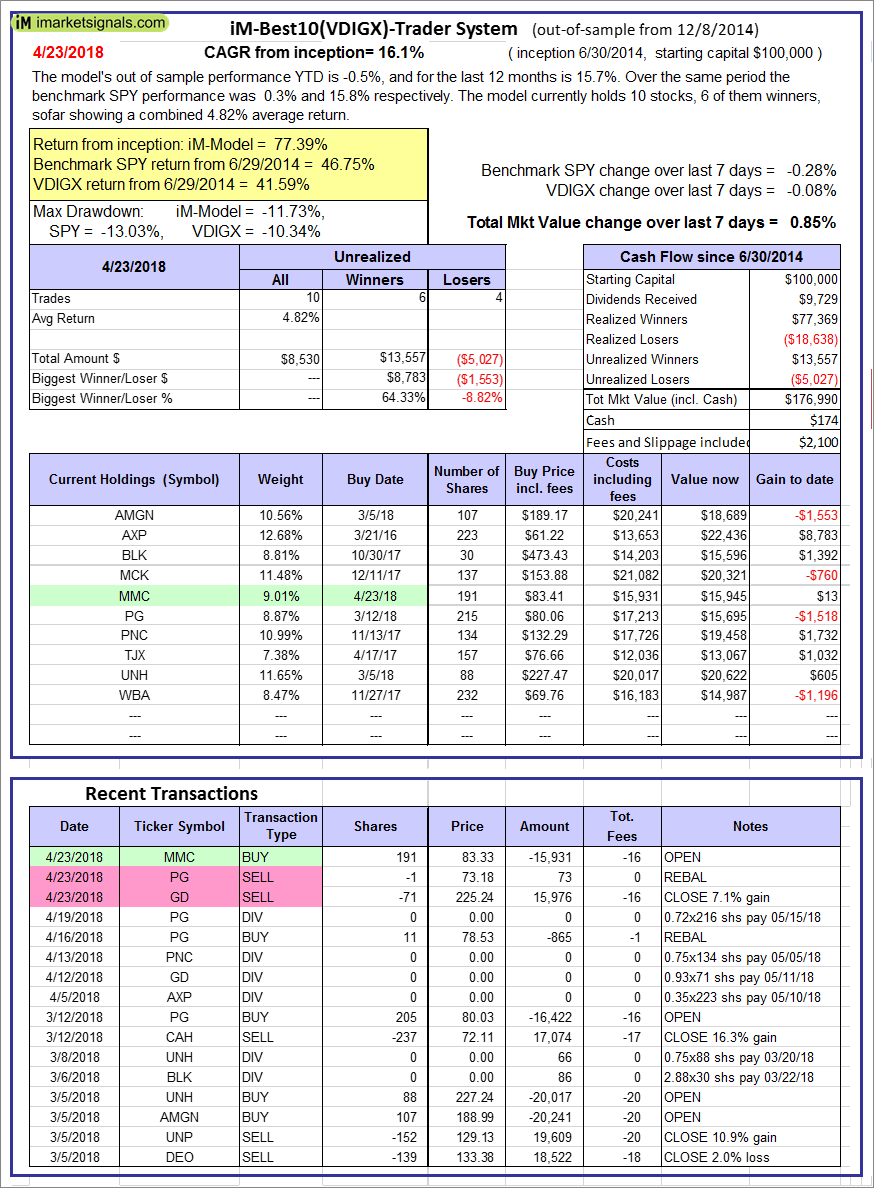
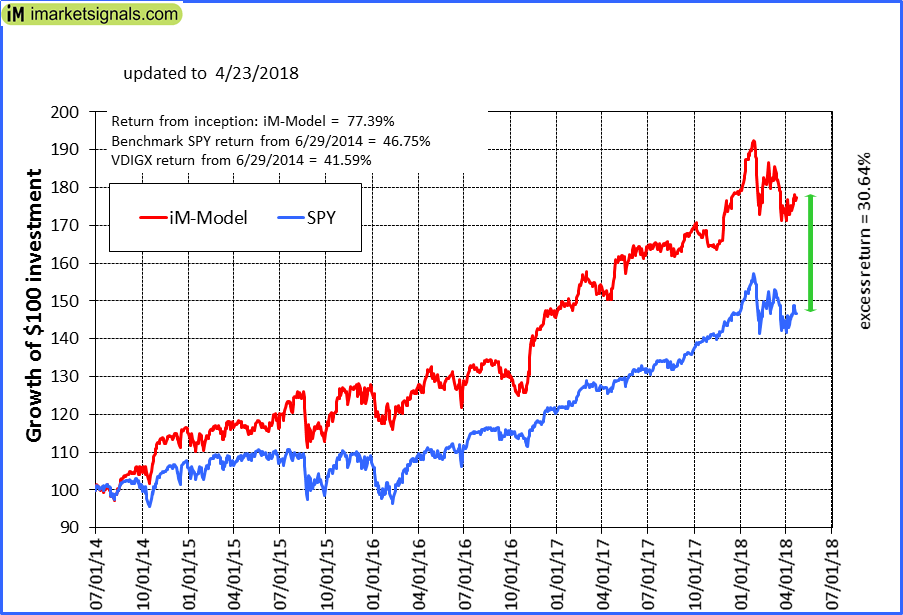
iM-Best10(VDIGX)-Trader: The model’s out of sample performance YTD is -0.5%, and for the last 12 months is 15.7%. Over the same period the benchmark SPY performance was 0.3% and 15.8% respectively. Since inception, on 7/1/2014, the model gained 77.39% while the benchmark SPY gained 46.75% and VDIGX gained 41.59% over the same period. Over the previous week the market value of iM-Best10(VDIGX) gained 0.85% at a time when SPY gained -0.28%. A starting capital of $100,000 at inception on 7/1/2014 would have grown to $176,990 which includes $174 cash and excludes $2,100 spent on fees and slippage. |
|
|
iM-BESTOGA-3: The model’s out of sample performance YTD is -3.1%, and for the last 12 months is 4.8%. Over the same period the benchmark SPY performance was 0.3% and 15.8% respectively. Over the previous week the market value of iM-BESTOGA-3 gained 0.64% at a time when SPY gained -0.28%. A starting capital of $100,000 at inception on 2/3/2014 would have grown to $224,632 which includes -$270 cash and excludes $2,324 spent on fees and slippage. |
|
|
iM-Best7(HiD-LoV): The model’s out of sample performance YTD is -7.3%, and for the last 12 months is -1.0%. Over the same period the benchmark SPY performance was 0.3% and 15.8% respectively. Over the previous week the market value of iM-BESTOGA-3 gained -7.18% at a time when SPY gained -0.28%. A starting capital of $100,000 at inception on 6/30/2016 would have grown to $104,687 which includes $1,023 cash and excludes $1,780 spent on fees and slippage. |
|
|
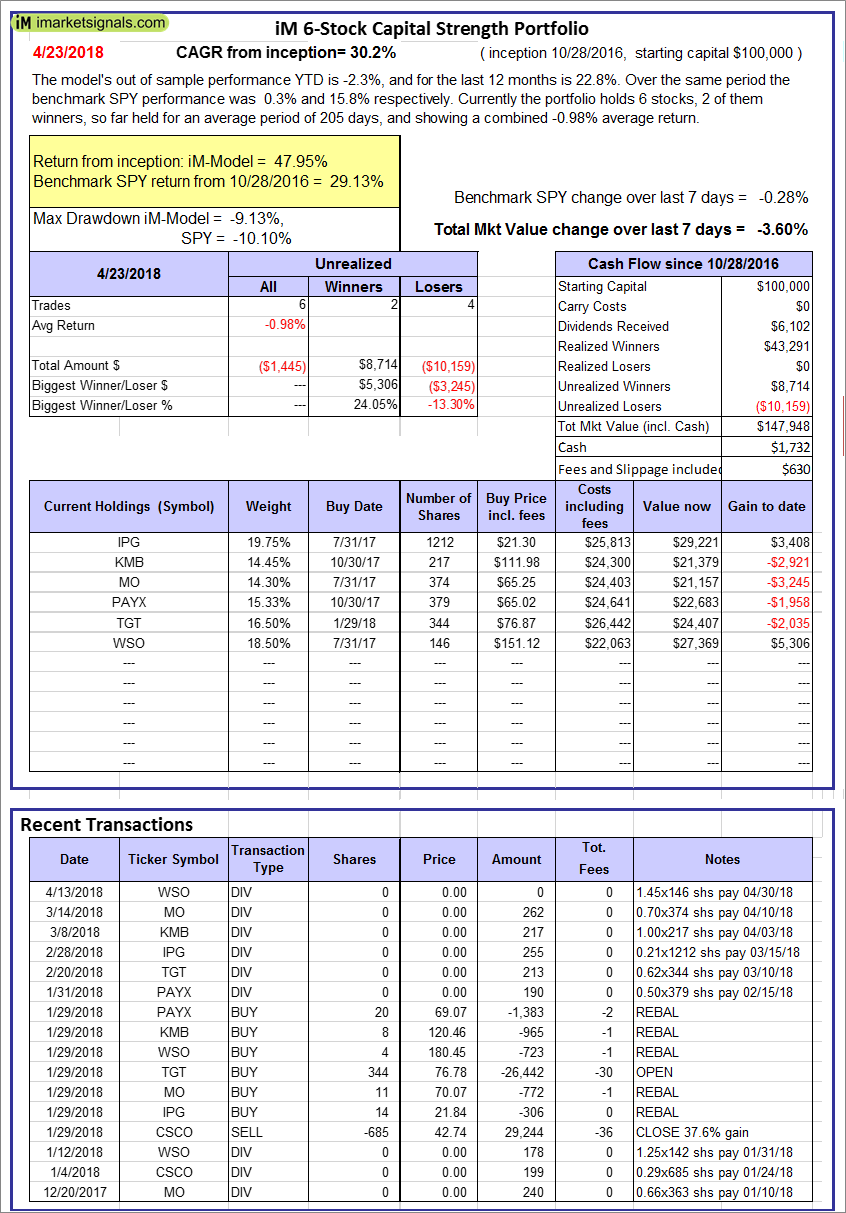
iM 6-Stock Capital Strength Portfolio: The model’s out of sample performance YTD is -2.3%, and for the last 12 months is 22.8%. Over the same period the benchmark SPY performance was 0.3% and 15.8% respectively. Over the previous week the market value of the iM 6-Stock Capital Strength Portfolio gained -3.60% at a time when SPY gained -0.28%. A starting capital of $100,000 at inception on 10/28/2016 would have grown to $147,948 which includes $1,732 cash and excludes $630 spent on fees and slippage. |
|
|
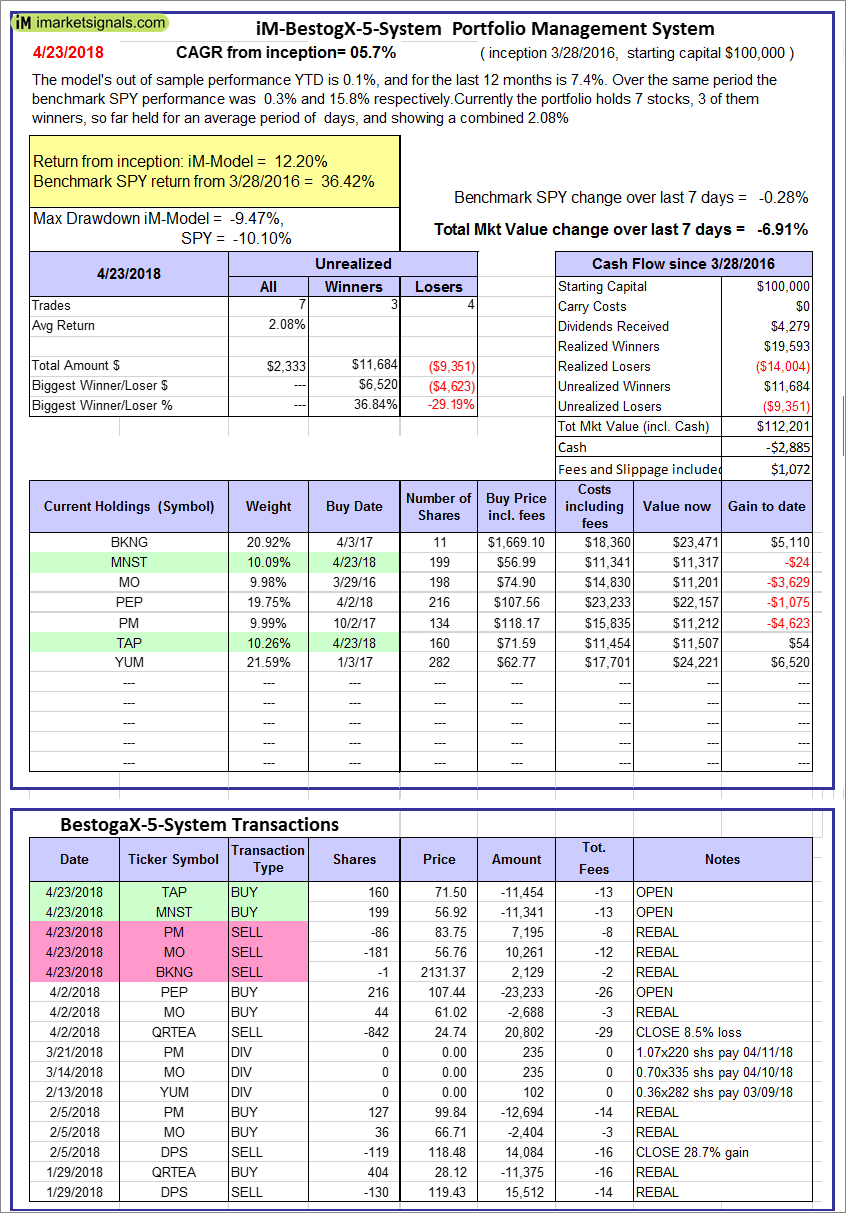
iM-BestogaX5-System: The model’s out of sample performance YTD is 0.1%, and for the last 12 months is 7.4%. Over the same period the benchmark SPY performance was 0.3% and 15.8% respectively. Over the previous week the market value of iM-BestogaX5-System gained -6.91% at a time when SPY gained -0.28%. A starting capital of $100,000 at inception on 3/28/2016 would have grown to $112,201 which includes -$2,885 cash and excludes $1,072 spent on fees and slippage. |
|
|
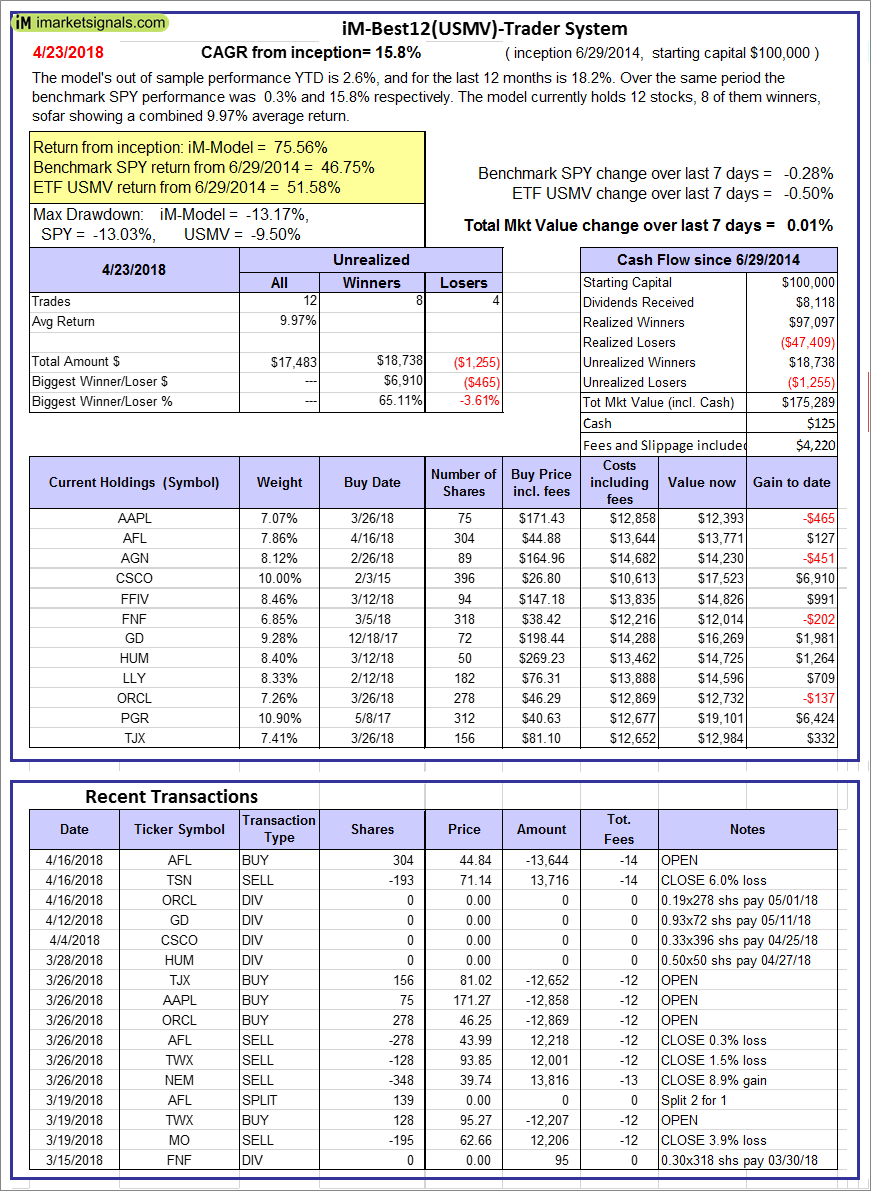
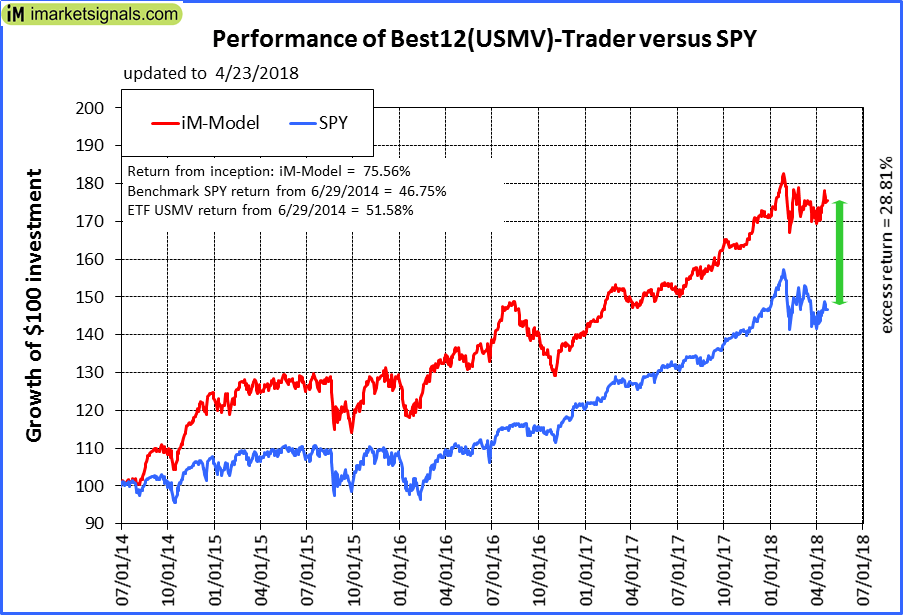
iM-Best12(USMV)-Trader: The model’s out of sample performance YTD is 2.6%, and for the last 12 months is 18.2%. Over the same period the benchmark SPY performance was 0.3% and 15.8% respectively. Since inception, on 6/30/2014, the model gained 75.56% while the benchmark SPY gained 46.75% and the ETF USMV gained 51.58% over the same period. Over the previous week the market value of iM-Best12(USMV)-Trader gained 0.01% at a time when SPY gained -0.28%. A starting capital of $100,000 at inception on 6/30/2014 would have grown to $175,289 which includes $125 cash and excludes $4,220 spent on fees and slippage. |
|
|
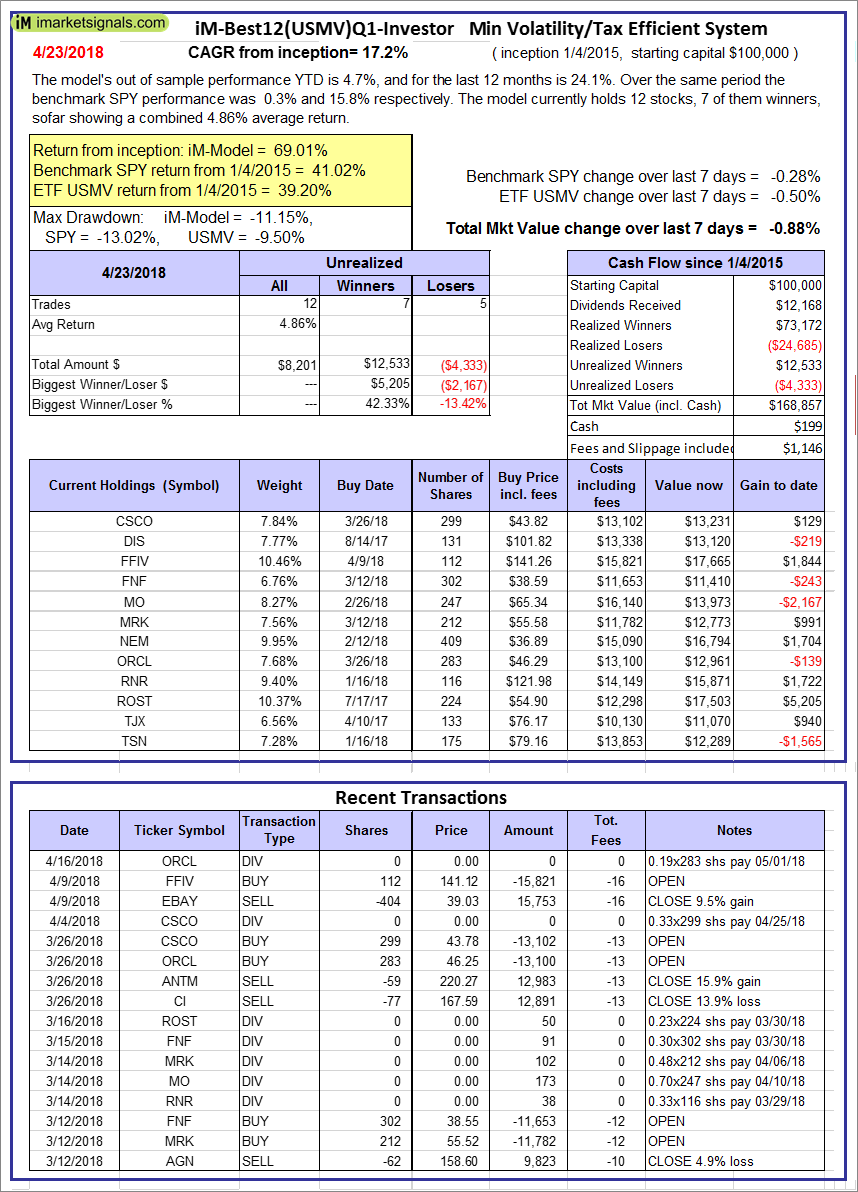
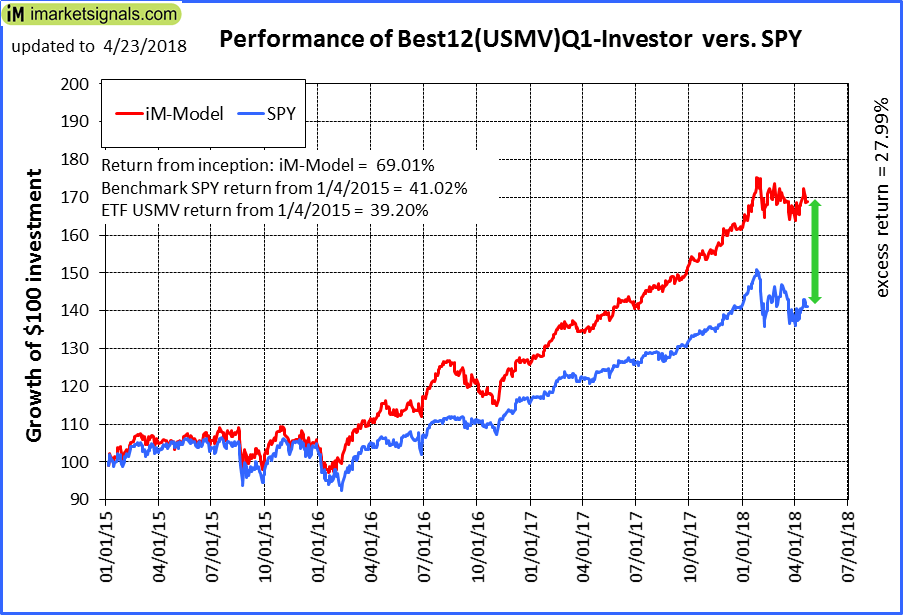
iM-Best12(USMV)Q1-Investor: The model’s out of sample performance YTD is 4.7%, and for the last 12 months is 24.1%. Over the same period the benchmark SPY performance was 0.3% and 15.8% respectively. Since inception, on 1/5/2015, the model gained 69.01% while the benchmark SPY gained 41.02% and the ETF USMV gained 39.20% over the same period. Over the previous week the market value of iM-Best12(USMV)Q1 gained -0.88% at a time when SPY gained -0.28%. A starting capital of $100,000 at inception on 1/5/2015 would have grown to $168,857 which includes $199 cash and excludes $1,146 spent on fees and slippage. |
|
|
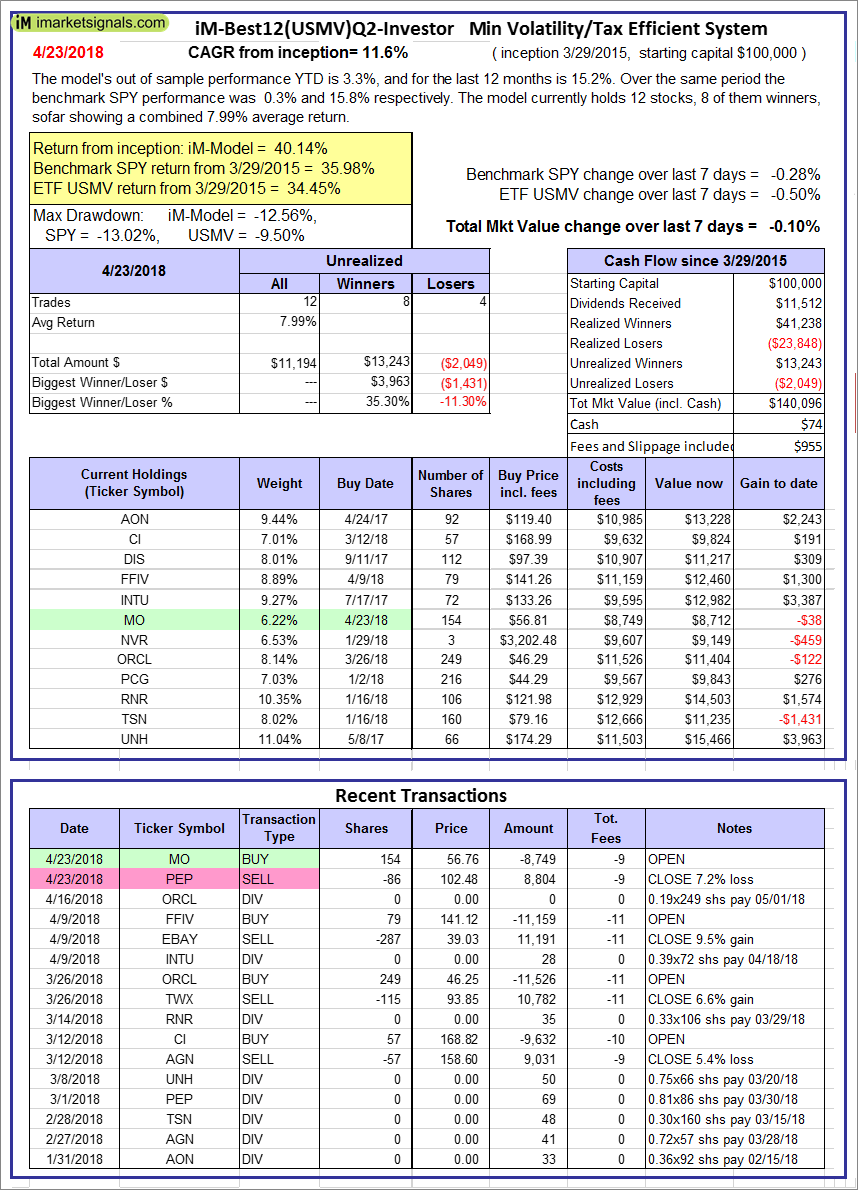
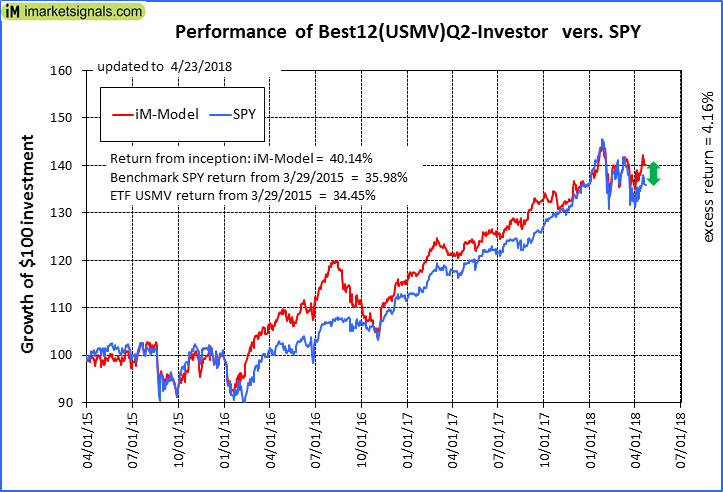
iM-Best12(USMV)Q2-Investor: The model’s out of sample performance YTD is 3.3%, and for the last 12 months is 15.2%. Over the same period the benchmark SPY performance was 0.3% and 15.8% respectively. Since inception, on 3/30/2015, the model gained 40.14% while the benchmark SPY gained 35.98% and the ETF USMV gained 34.45% over the same period. Over the previous week the market value of iM-Best12(USMV)Q2 gained -0.10% at a time when SPY gained -0.28%. A starting capital of $100,000 at inception on 3/30/2015 would have grown to $140,096 which includes $74 cash and excludes $955 spent on fees and slippage. |
|
|
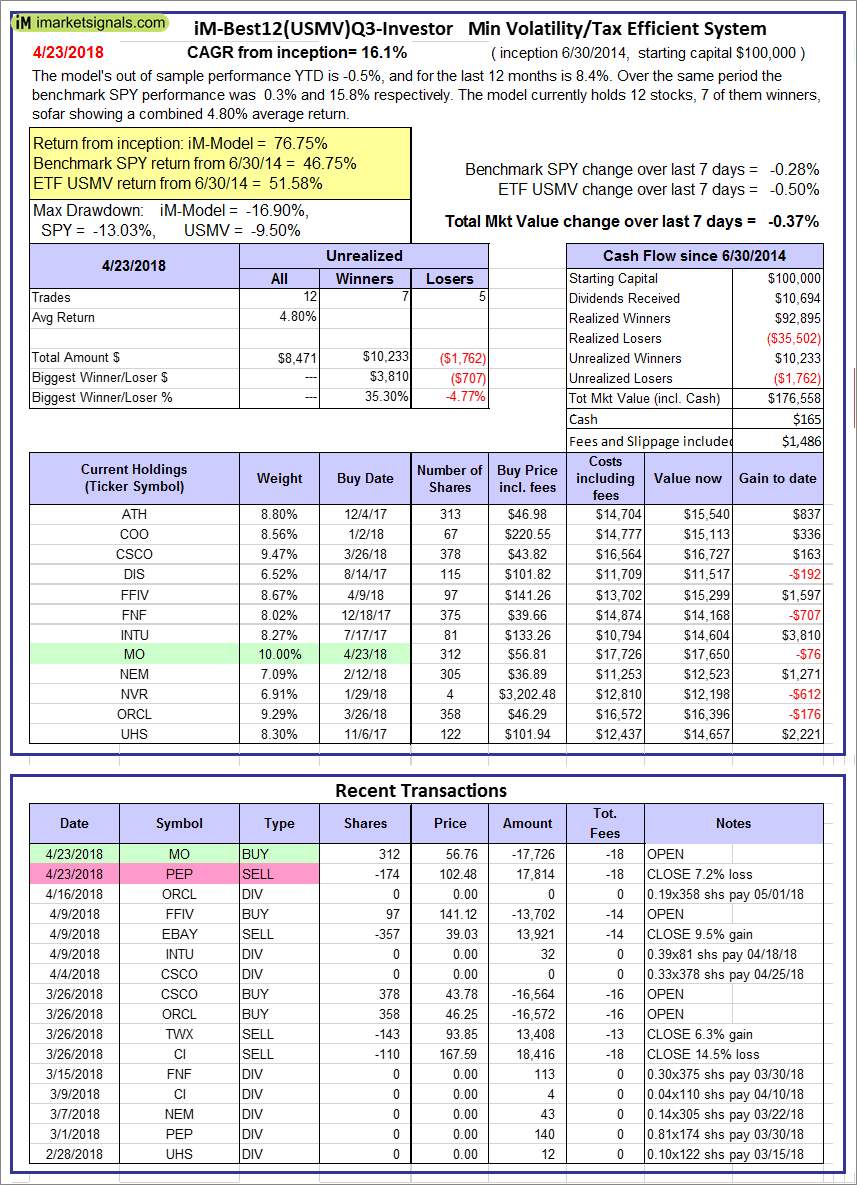
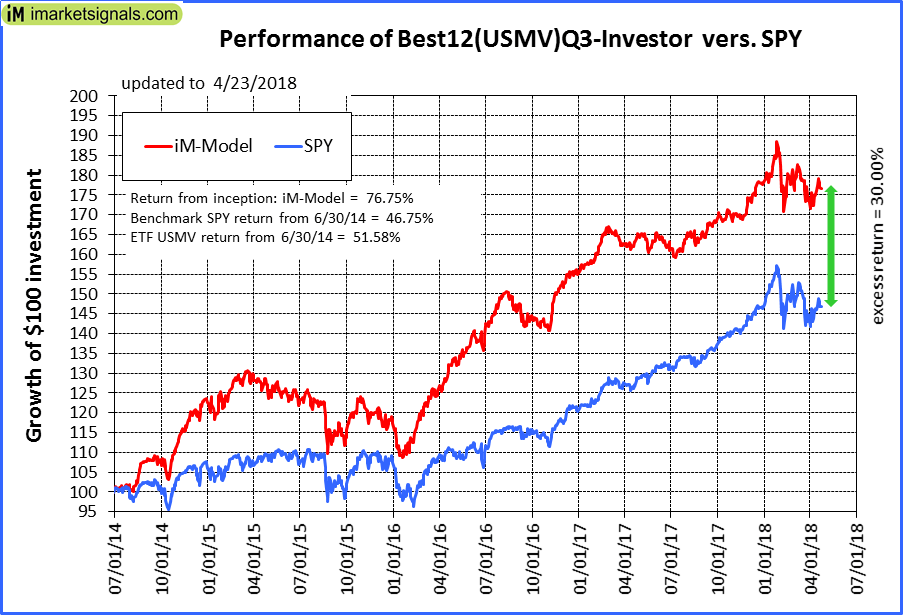
iM-Best12(USMV)Q3-Investor: The model’s out of sample performance YTD is -0.5%, and for the last 12 months is 8.4%. Over the same period the benchmark SPY performance was 0.3% and 15.8% respectively. Since inception, on 7/1/2014, the model gained 76.75% while the benchmark SPY gained 46.75% and the ETF USMV gained 51.58% over the same period. Over the previous week the market value of iM-Best12(USMV)Q3 gained -0.37% at a time when SPY gained -0.28%. A starting capital of $100,000 at inception on 7/1/2014 would have grown to $176,558 which includes $165 cash and excludes $1,486 spent on fees and slippage. |
|
|
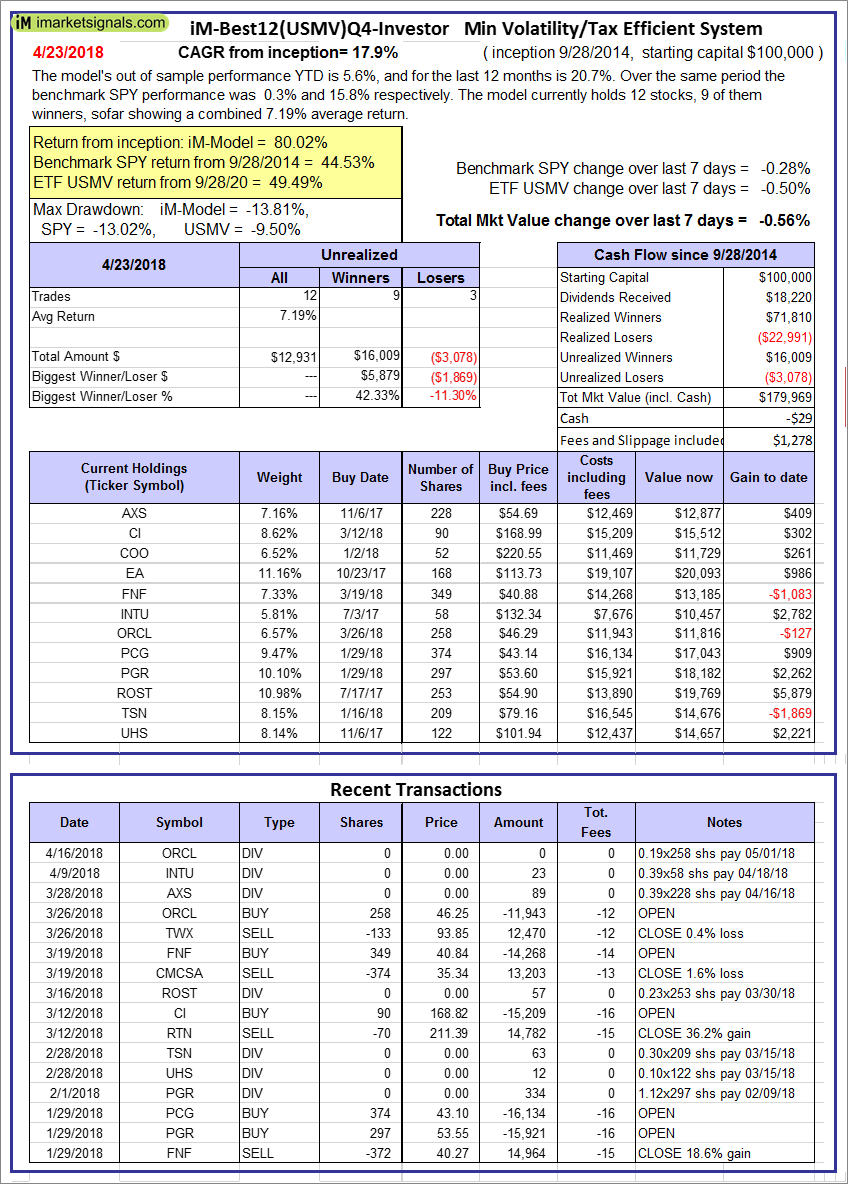
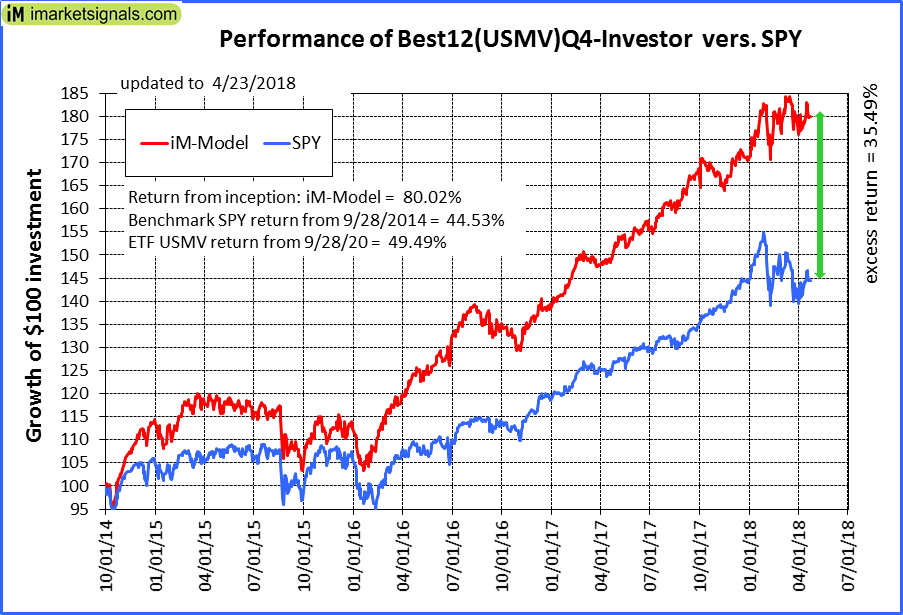
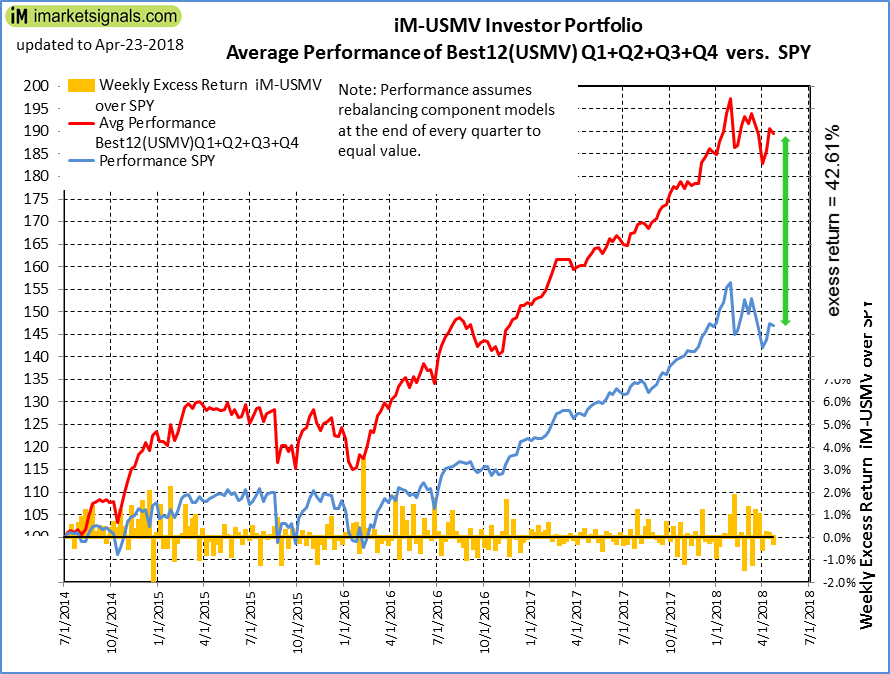
iM-Best12(USMV)Q4-Investor: Since inception, on 9/29/2014, the model gained 80.02% while the benchmark SPY gained 44.53% and the ETF USMV gained 49.49% over the same period. Over the previous week the market value of iM-Best12(USMV)Q4 gained -0.56% at a time when SPY gained -0.28%. A starting capital of $100,000 at inception on 9/29/2014 would have grown to $179,969 which includes -$29 cash and excludes $1,278 spent on fees and slippage. |
|
|
Average Performance of iM-Best12(USMV)Q1+Q2+Q3+Q4-Investor resulted in an excess return of 42.61% over SPY. (see iM-USMV Investor Portfolio) |
|
|
iM-Best(Short): The model’s out of sample performance YTD is -0.9%, and for the last 12 months is -5.5%. Over the same period the benchmark SPY performance was 0.3% and 15.8% respectively. Over the previous week the market value of iM-Best(Short) gained 0.64% at a time when SPY gained -0.28%. Over the period 1/2/2009 to 4/23/2018 the starting capital of $100,000 would have grown to $90,420 which includes $108,043 cash and excludes $24,034 spent on fees and slippage. |
|
|
iM-Best2 MC-Score ETF System: The model’s out of sample performance YTD is -5.7%, and for the last 12 months is 2.5%. Over the same period the benchmark SPY performance was 0.3% and 15.8% respectively. Over the previous week the market value of the iM-Best2 MC-Score ETF System gained -2.76% at a time when SPY gained -0.28%. A starting capital of $100,000 at inception on 6/30/2016 would have grown to $105,956 which includes $1,285 cash and excludes $115 spent on fees and slippage. |
|
|
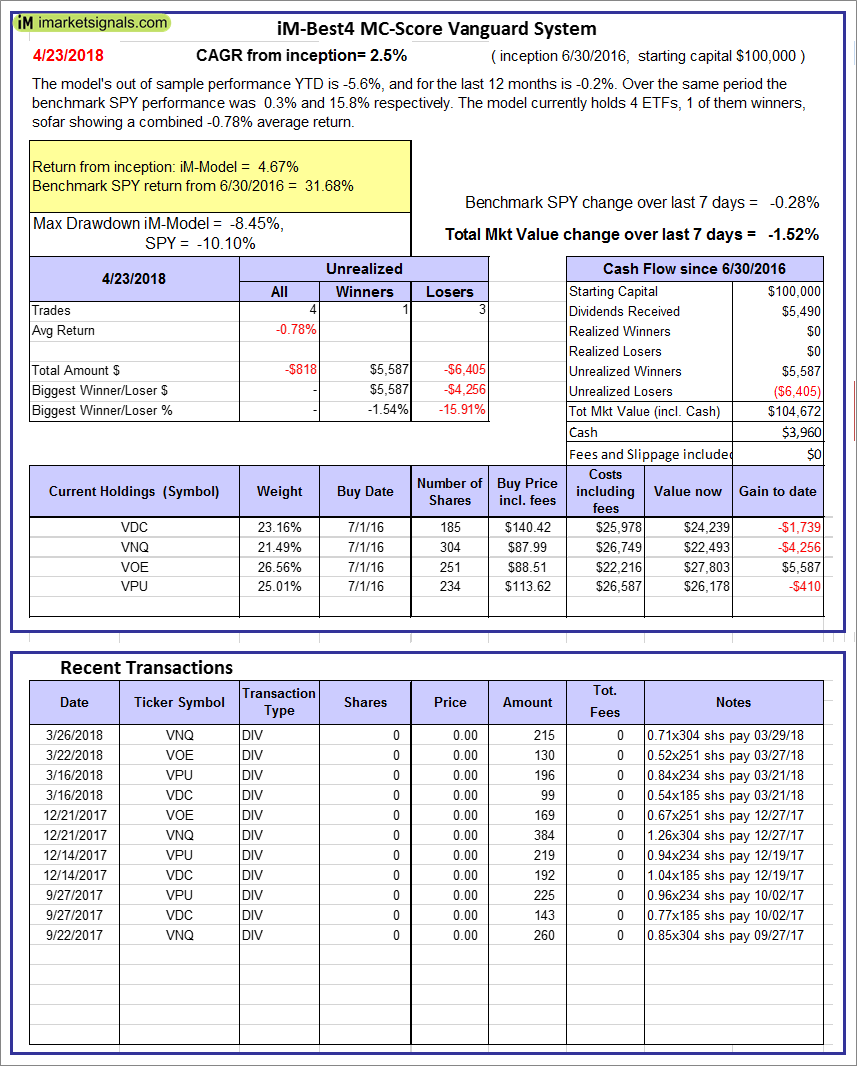
iM-Best4 MC-Score Vanguard System: The model’s out of sample performance YTD is -5.6%, and for the last 12 months is -0.2%. Over the same period the benchmark SPY performance was 0.3% and 15.8% respectively. Over the previous week the market value of the iM-Best4 MC-Score Vanguard System gained -1.52% at a time when SPY gained -0.28%. A starting capital of $100,000 at inception on 6/30/2016 would have grown to $104,672 which includes $3,960 cash and excludes $00 spent on fees and slippage. |
|
|
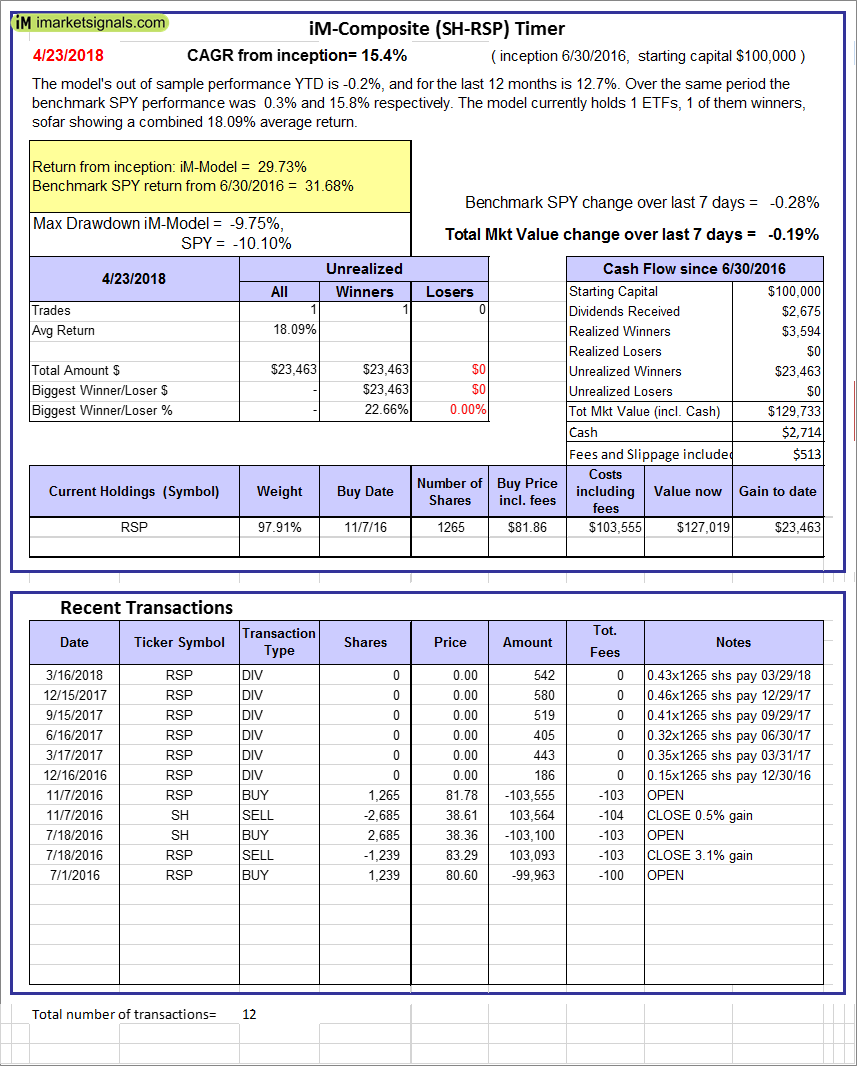
iM-Composite (SH-RSP) Timer: The model’s out of sample performance YTD is -0.2%, and for the last 12 months is 12.7%. Over the same period the benchmark SPY performance was 0.3% and 15.8% respectively. Over the previous week the market value of the iM-Composite (SH-RSP) Timer gained -0.19% at a time when SPY gained -0.28%. A starting capital of $100,000 at inception on 6/30/2016 would have grown to $129,733 which includes $2,714 cash and excludes $513 spent on fees and slippage. |
|
|
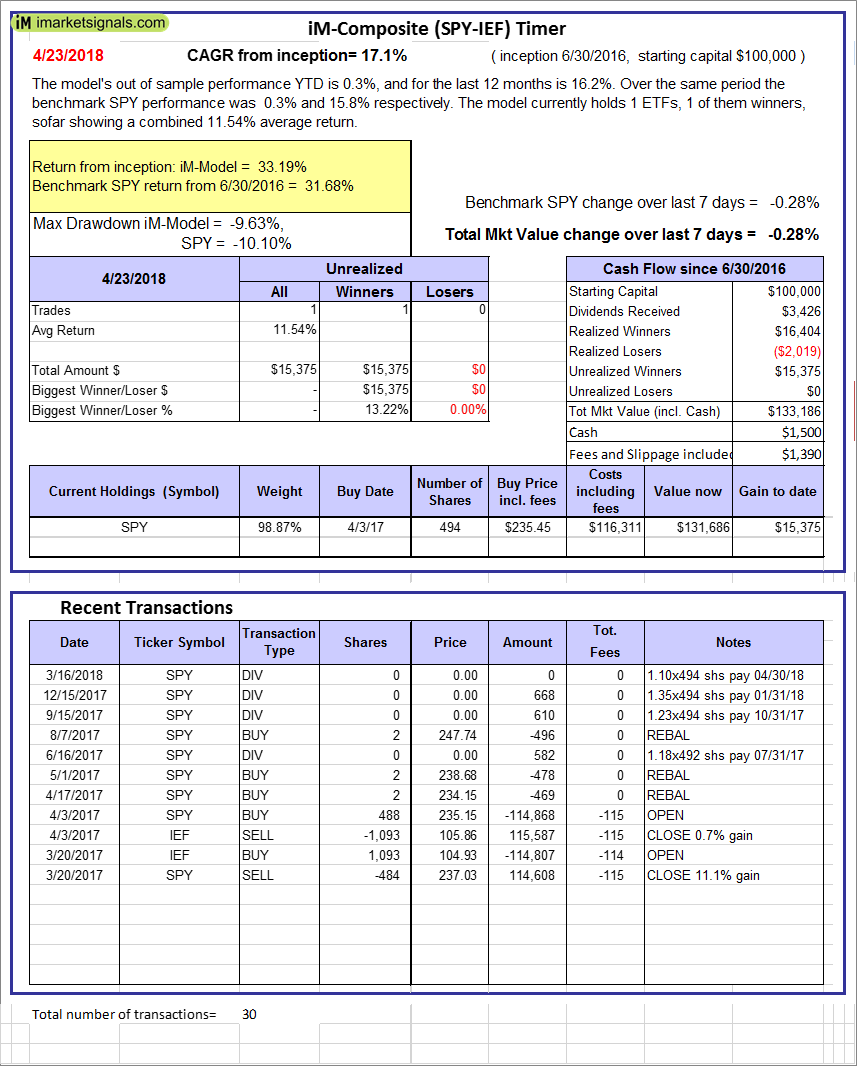
iM-Composite (SPY-IEF) Timer: The model’s out of sample performance YTD is 0.3%, and for the last 12 months is 16.2%. Over the same period the benchmark SPY performance was 0.3% and 15.8% respectively. Over the previous week the market value of the iM-Composite (SPY-IEF) Timer gained -0.28% at a time when SPY gained -0.28%. A starting capital of $100,000 at inception on 6/30/2016 would have grown to $133,186 which includes $1,500 cash and excludes $1,390 spent on fees and slippage. |
|
|
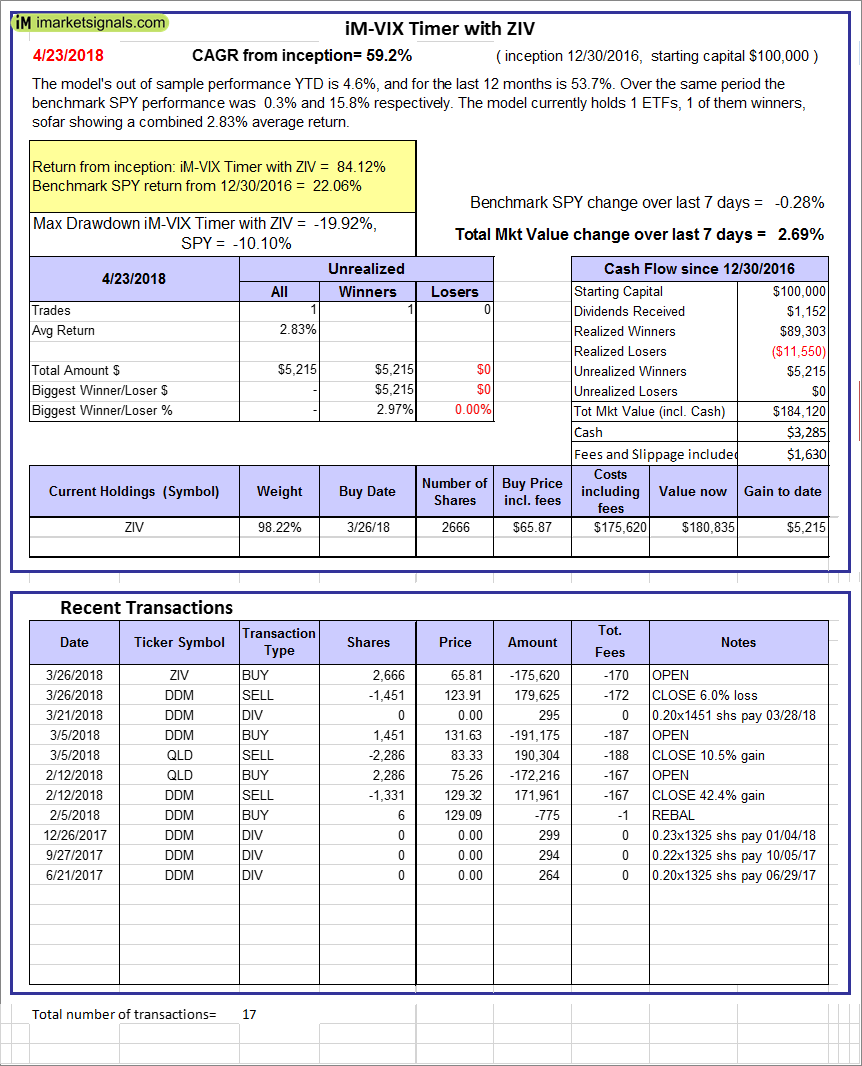
iM-VIX Timer with ZIV: The model’s out of sample performance YTD is 4.6%, and for the last 12 months is 53.7%. Over the same period the benchmark SPY performance was 0.3% and 15.8% respectively. Over the previous week the market value of the iM-VIX Timer with ZIV gained 2.69% at a time when SPY gained -0.28%. A starting capital of $100,000 at inception on 6/30/2016 would have grown to $184,120 which includes $3,285 cash and excludes $1,630 spent on fees and slippage. |
|
|
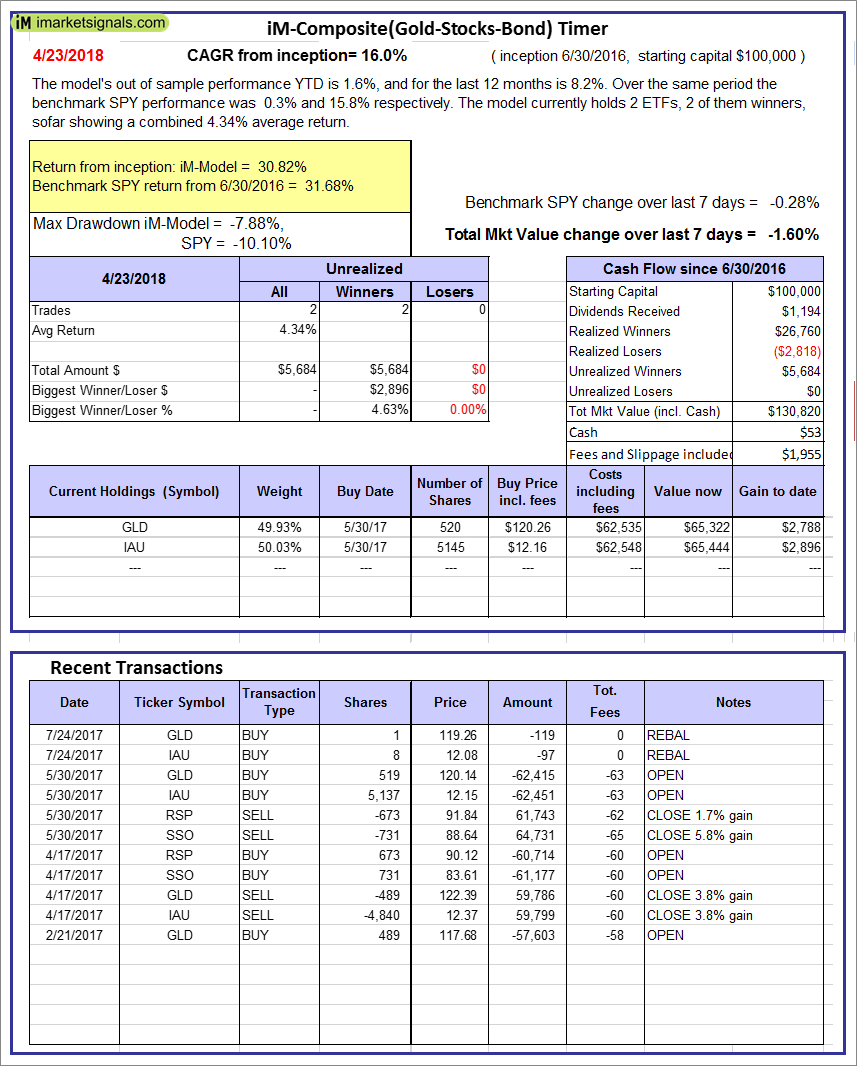
iM-Composite(Gold-Stocks-Bond) Timer: The model’s out of sample performance YTD is 1.6%, and for the last 12 months is 8.2%. Over the same period the benchmark SPY performance was 0.3% and 15.8% respectively. Over the previous week the market value of the iM-Composite(Gold-Stocks-Bond) Timer gained -1.60% at a time when SPY gained -0.28%. A starting capital of $100,000 at inception on 6/30/2016 would have grown to $130,820 which includes $53 cash and excludes $1,955 spent on fees and slippage. |
|
|
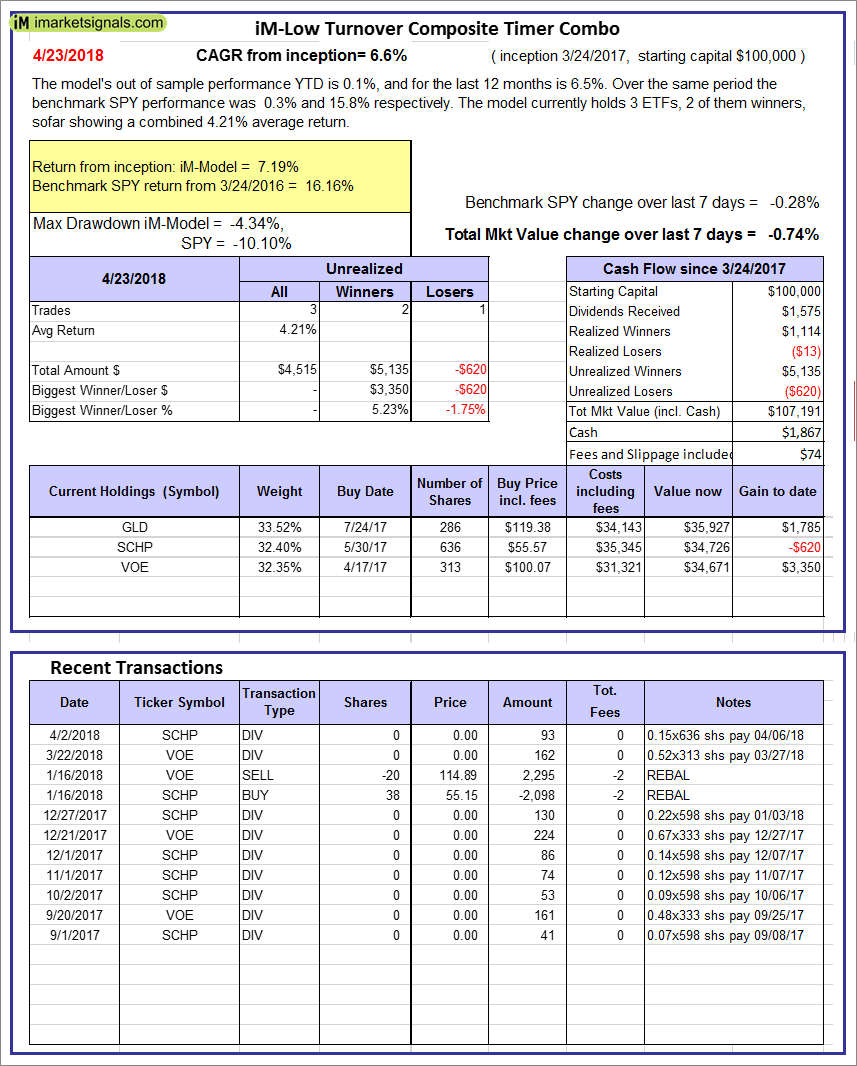
iM-Low Turnover Composite Timer Combo: The model’s out of sample performance YTD is 0.1%, and for the last 12 months is 6.5%. Over the same period the benchmark SPY performance was 0.3% and 15.8% respectively. Over the previous week the market value of the iM-Low Turnover Composite Timer Combo gained -0.74% at a time when SPY gained -0.28%. A starting capital of $100,000 at inception on 3/24/27 would have grown to $107,191 which includes $1,867 cash and excludes $74 spent on fees and slippage. |
|
|
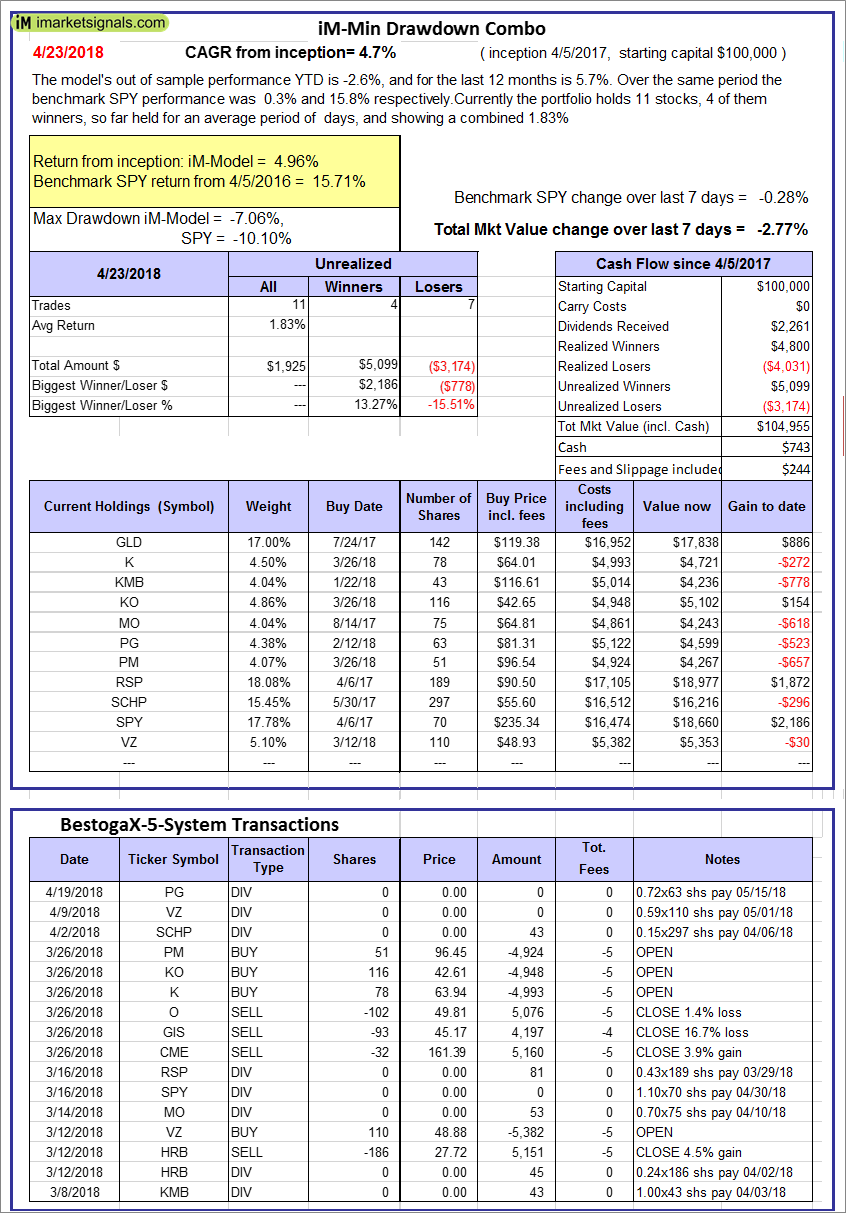
iM-Min Drawdown Combo: The model’s out of sample performance YTD is -2.6%, and for the last 12 months is 5.7%. Over the same period the benchmark SPY performance was 0.3% and 15.8% respectively. Over the previous week the market value of the iM-Min Drawdown Combo gained -2.77% at a time when SPY gained -0.28%. A starting capital of $100,000 at inception on 4/5/2017 would have grown to $104,955 which includes $743 cash and excludes $244 spent on fees and slippage. |
|
|
iM-5ETF Trader (includes leveraged ETFs): The model’s out of sample performance YTD is 0.5%, and for the last 12 months is 30.2%. Over the same period the benchmark SPY performance was 0.3% and 15.8% respectively. Over the previous week the market value of the iM-5ETF Trader (includes leveraged ETFs) gained -0.62% at a time when SPY gained -0.28%. A starting capital of $100,000 at inception on 10/30/2016 would have grown to $163,543 which includes $1,298 cash and excludes $1,030 spent on fees and slippage. |
|
|
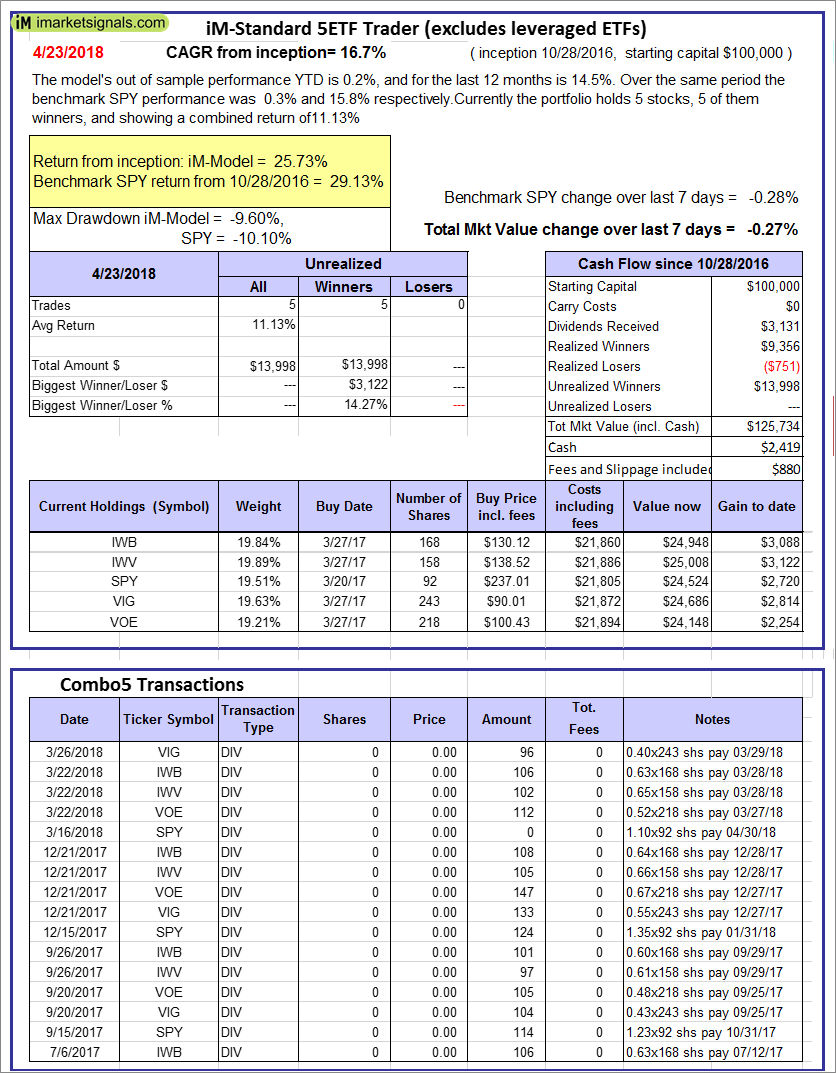
iM-Standard 5ETF Trader (excludes leveraged ETFs): The model’s out of sample performance YTD is 0.2%, and for the last 12 months is 14.5%. Over the same period the benchmark SPY performance was 0.3% and 15.8% respectively. Over the previous week the market value of the iM-Standard 5ETF Trader (excludes leveraged ETFs) gained -0.27% at a time when SPY gained -0.28%. A starting capital of $100,000 at inception on 10/30/2016 would have grown to $125,734 which includes $2,419 cash and excludes $880 spent on fees and slippage. |


Leave a Reply
You must be logged in to post a comment.