
  |
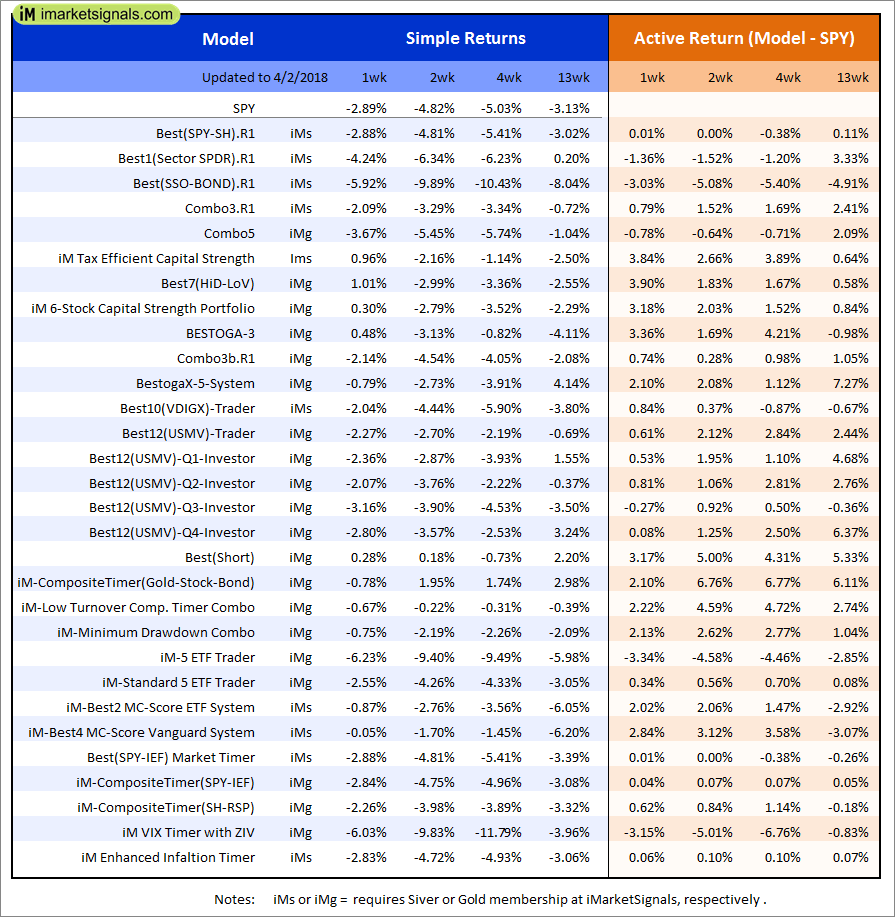
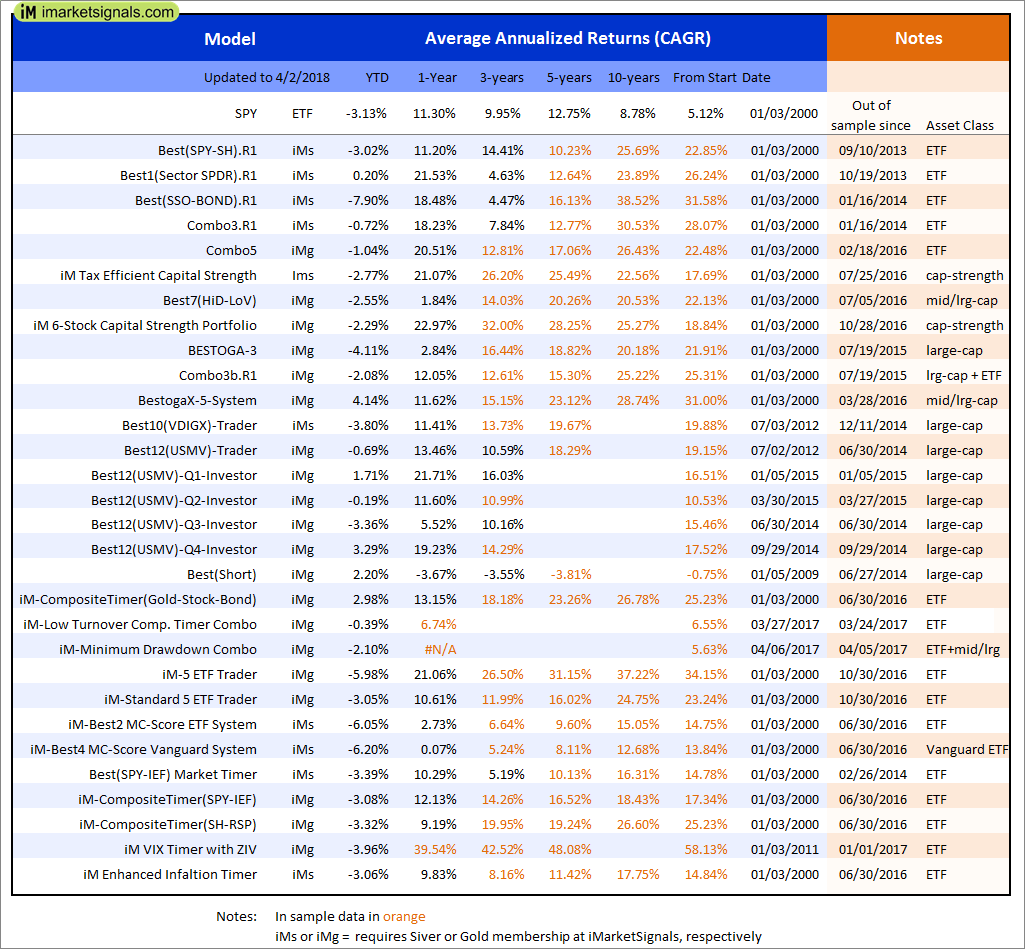
Out of sample performance summary of our models for the past 1, 2, 4 and 13 week periods. The active active return indicates how the models over- or underperformed the benchmark ETF SPY. Also the YTD, and the 1-, 3-, 5- and 10-year annualized returns are shown in the second table |
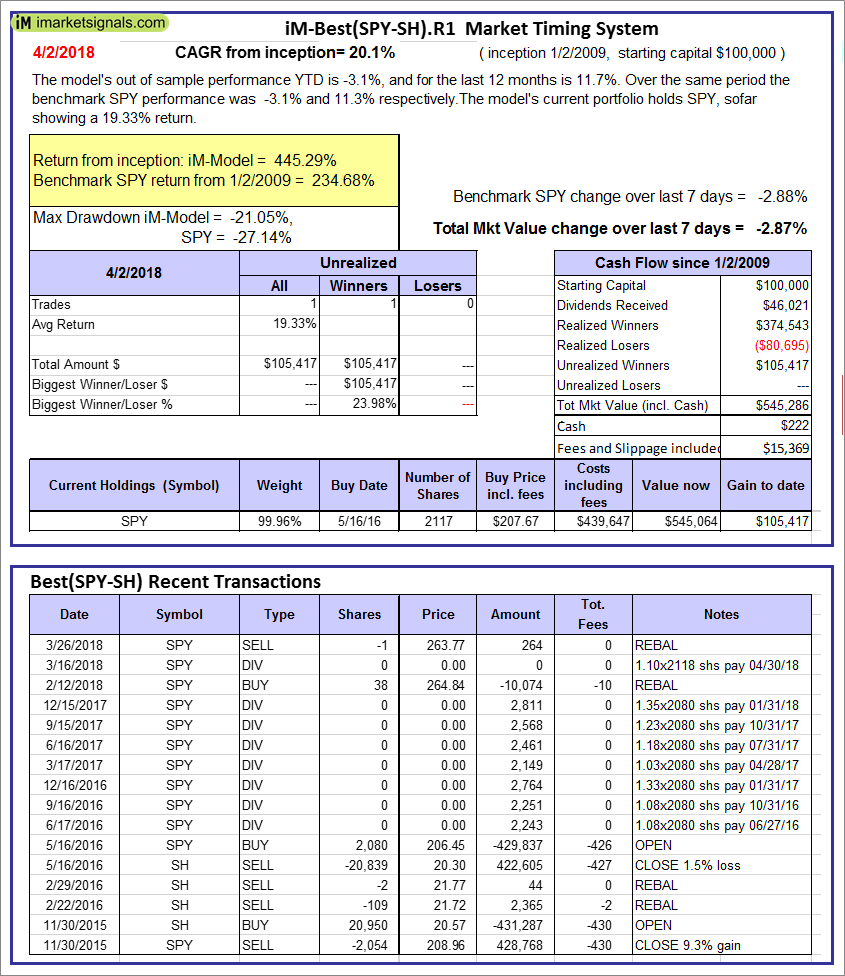 |
iM-Best(SPY-SH).R1: The model’s out of sample performance YTD is -3.1%, and for the last 12 months is 11.7%. Over the same period the benchmark SPY performance was -3.1% and 11.3% respectively. Over the previous week the market value of Best(SPY-SH) gained -2.87% at a time when SPY gained -2.88%. A starting capital of $100,000 at inception on 1/2/2009 would have grown to $545,286 which includes $222 cash and excludes $15,369 spent on fees and slippage. |
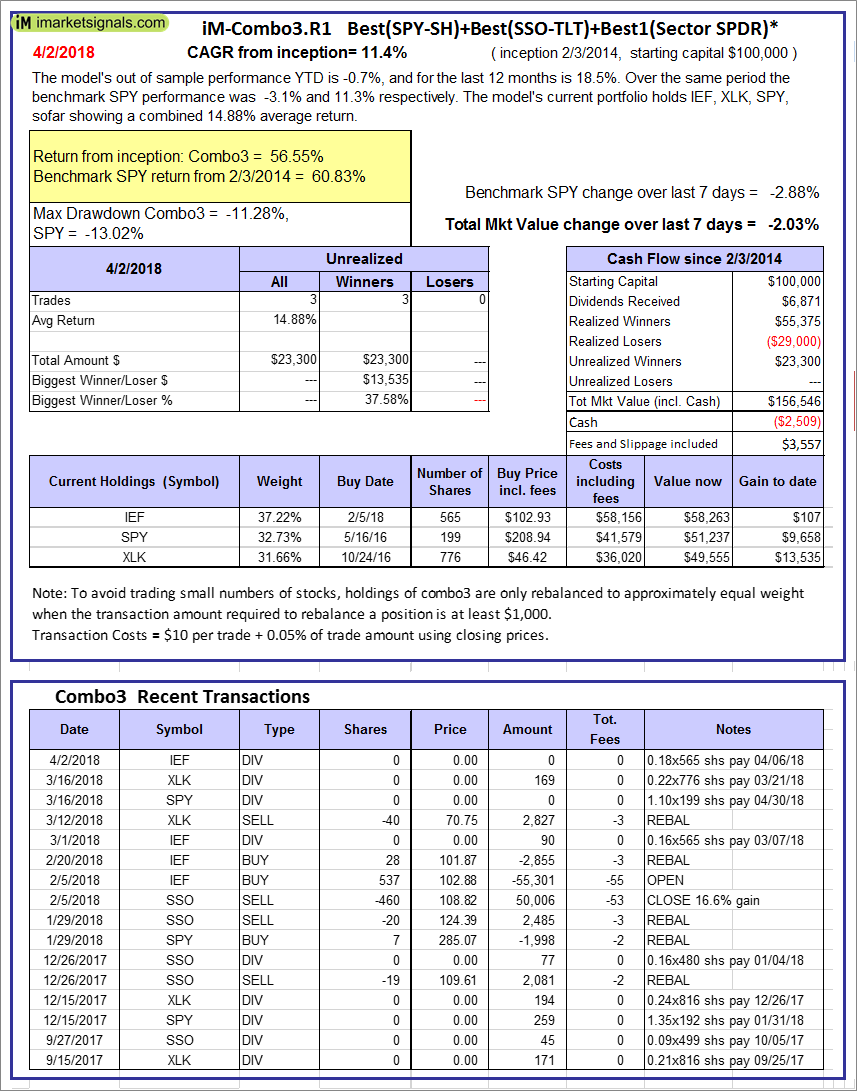 |
iM-Combo3.R1: The model’s out of sample performance YTD is -0.7%, and for the last 12 months is 18.5%. Over the same period the benchmark SPY performance was -3.1% and 11.3% respectively. Over the previous week the market value of iM-Combo3.R1 gained -2.03% at a time when SPY gained -2.88%. A starting capital of $100,000 at inception on 2/3/2014 would have grown to $156,546 which includes -$2,509 cash and excludes $3,557 spent on fees and slippage. |
 |
iM-Combo5: The model’s out of sample performance YTD is -1.3%, and for the last 12 months is 20.5%. Over the same period the benchmark SPY performance was -3.1% and 11.3% respectively. Over the previous week the market value of iM-Combo5 gained -3.82% at a time when SPY gained -2.88%. A starting capital of $100,000 at inception on 2/22/2016 would have grown to $126,087 which includes -$2,944 cash and excludes $714 spent on fees and slippage. |
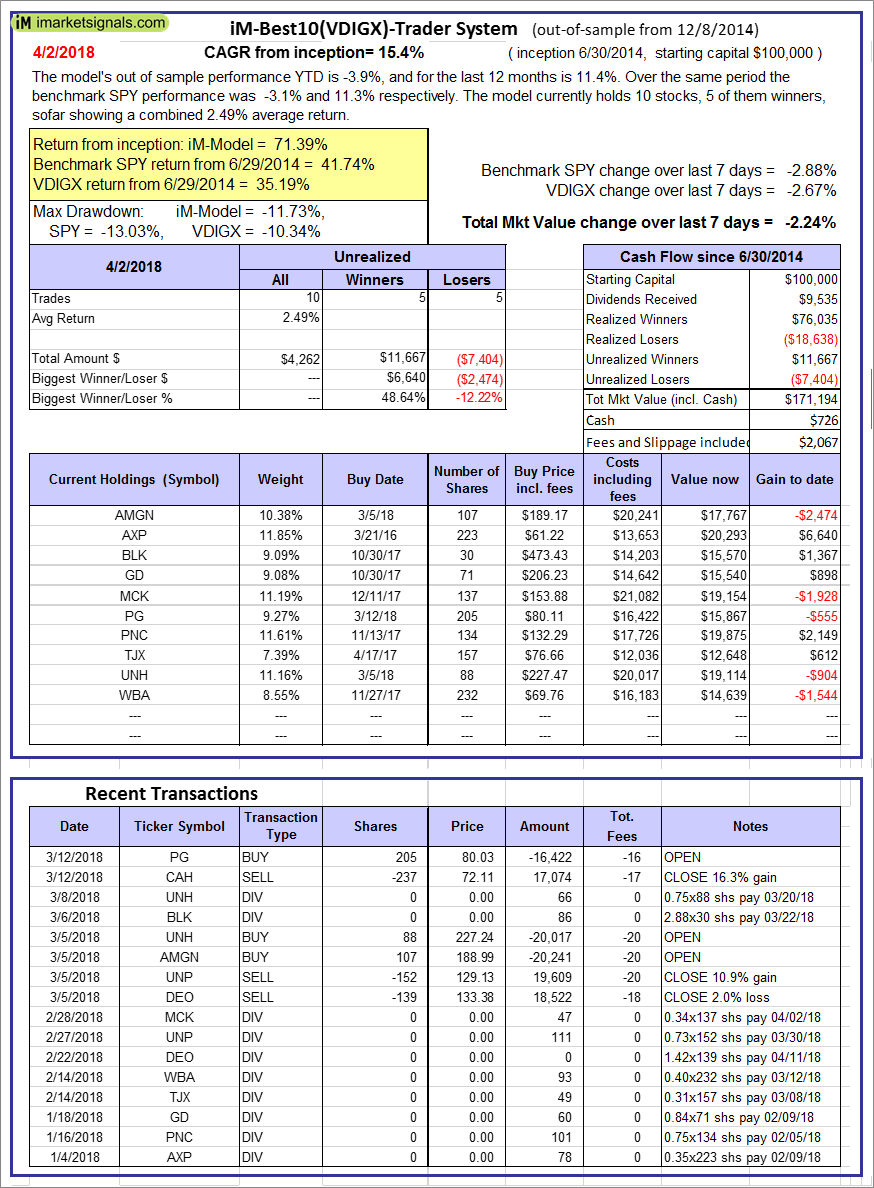 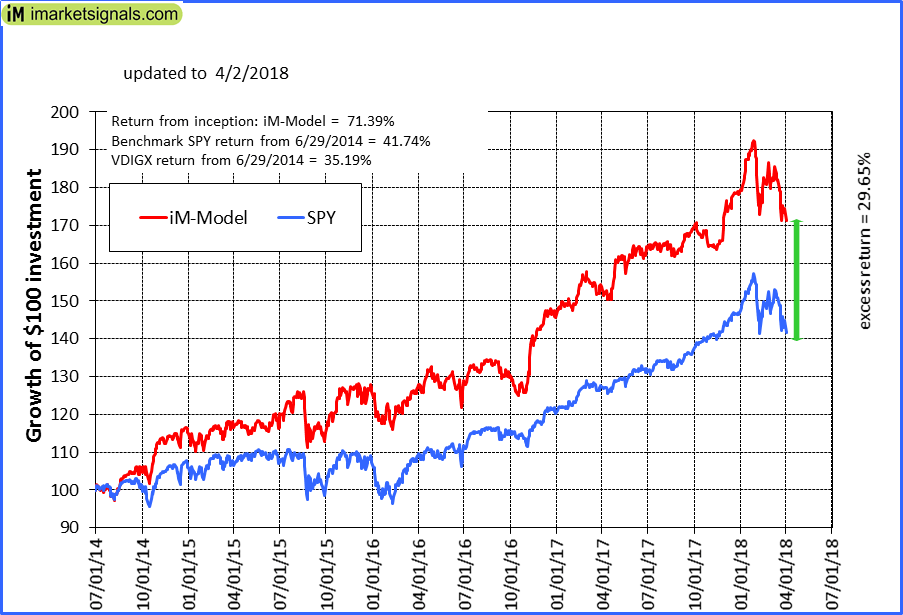 |
iM-Best10(VDIGX)-Trader: The model’s out of sample performance YTD is -3.9%, and for the last 12 months is 11.4%. Over the same period the benchmark SPY performance was -3.1% and 11.3% respectively. Since inception, on 7/1/2014, the model gained 71.39% while the benchmark SPY gained 41.74% and VDIGX gained 35.19% over the same period. Over the previous week the market value of iM-Best10(VDIGX) gained -2.24% at a time when SPY gained -2.88%. A starting capital of $100,000 at inception on 7/1/2014 would have grown to $171,194 which includes $726 cash and excludes $2,067 spent on fees and slippage. |
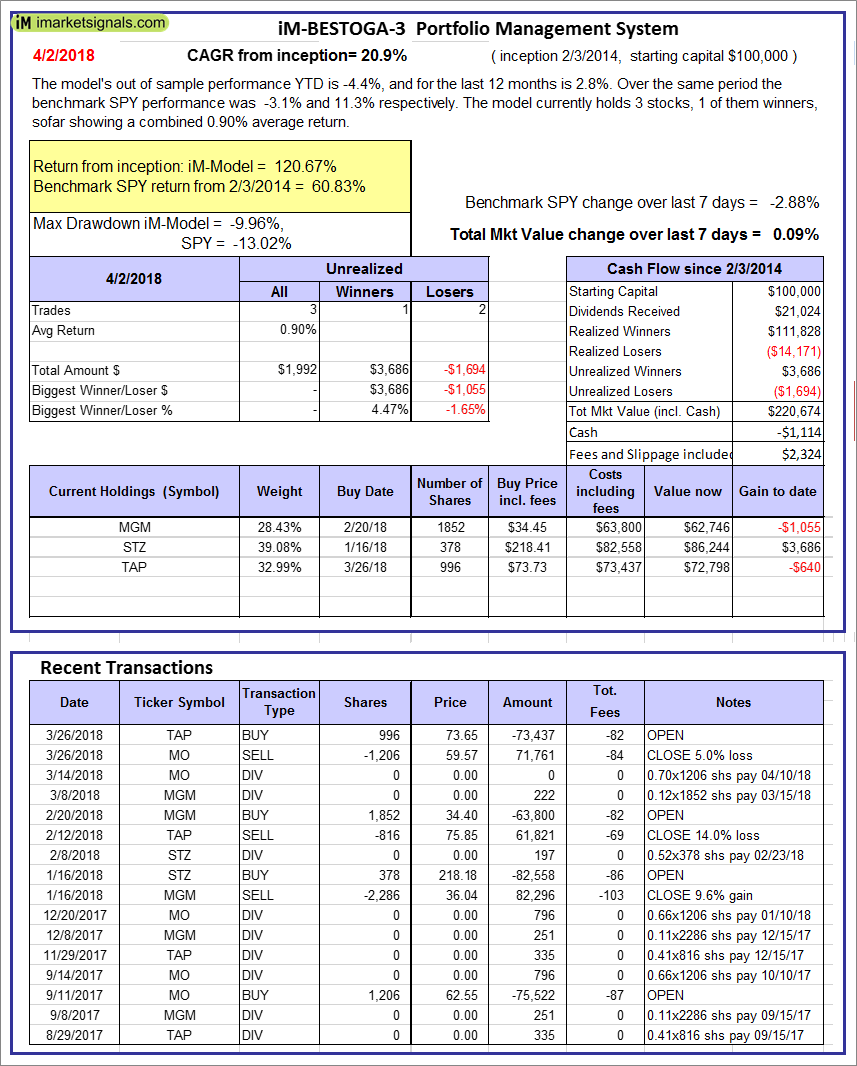 |
iM-BESTOGA-3: The model’s out of sample performance YTD is -4.4%, and for the last 12 months is 2.8%. Over the same period the benchmark SPY performance was -3.1% and 11.3% respectively. Over the previous week the market value of iM-BESTOGA-3 gained 0.09% at a time when SPY gained -2.88%. A starting capital of $100,000 at inception on 2/3/2014 would have grown to $220,674 which includes -$1,114 cash and excludes $2,324 spent on fees and slippage. |
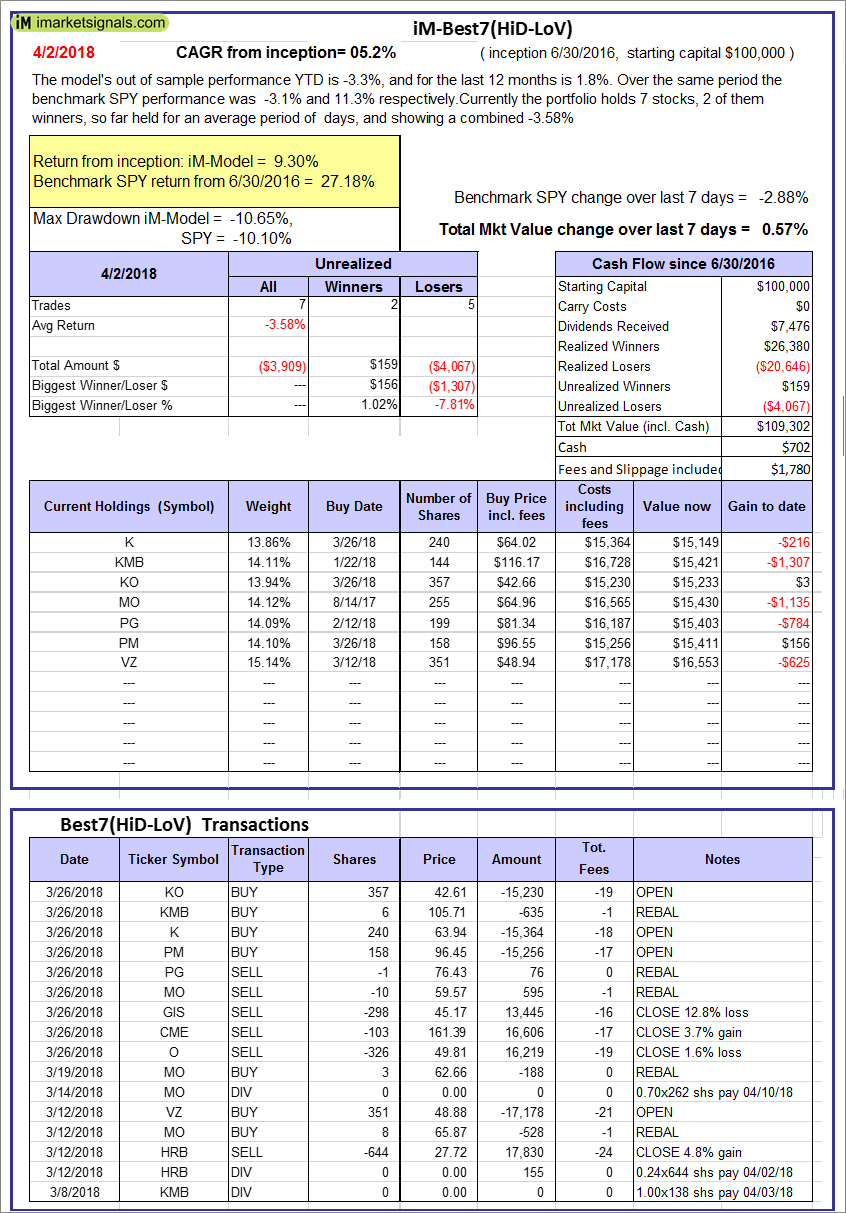 |
iM-Best7(HiD-LoV): The model’s out of sample performance YTD is -3.3%, and for the last 12 months is 1.8%. Over the same period the benchmark SPY performance was -3.1% and 11.3% respectively. Over the previous week the market value of iM-BESTOGA-3 gained 0.57% at a time when SPY gained -2.88%. A starting capital of $100,000 at inception on 6/30/2016 would have grown to $109,302 which includes $702 cash and excludes $1,780 spent on fees and slippage. |
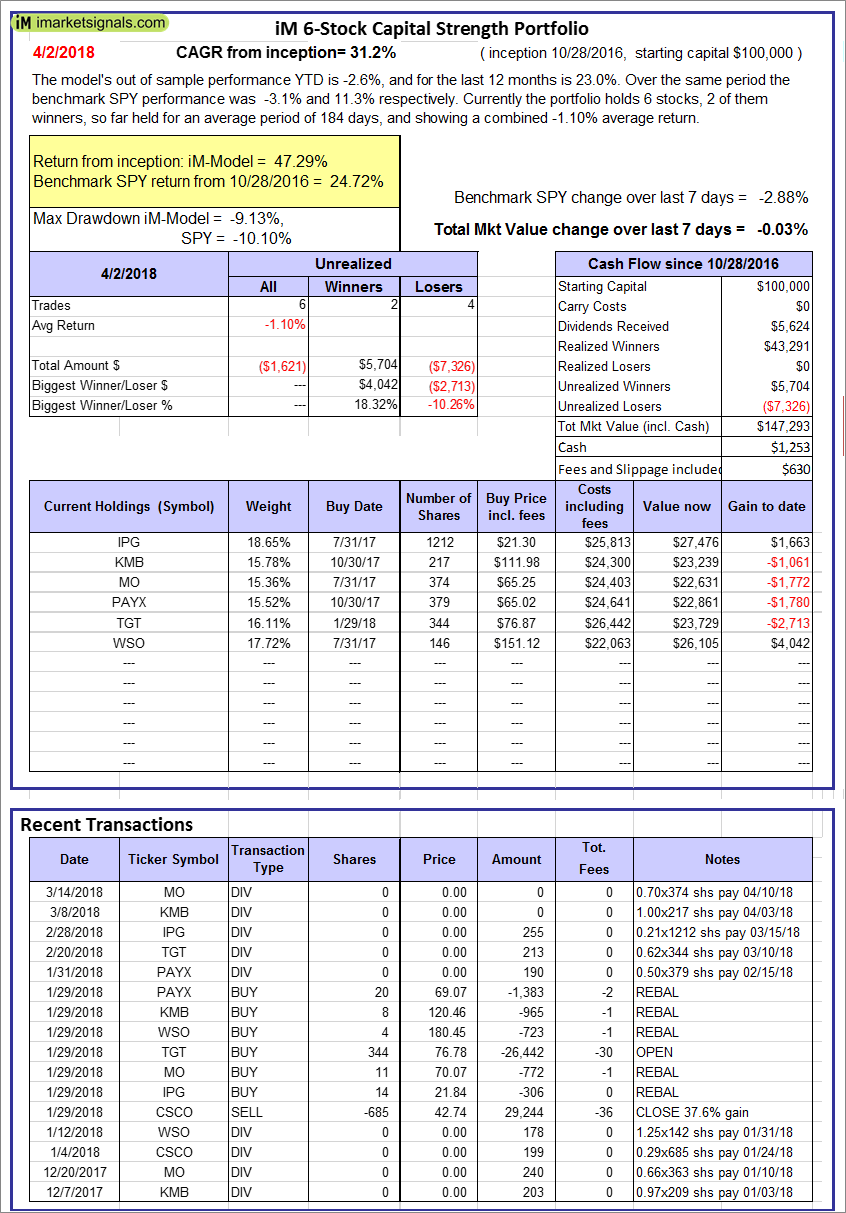 |
iM 6-Stock Capital Strength Portfolio: The model’s out of sample performance YTD is -2.6%, and for the last 12 months is 23.0%. Over the same period the benchmark SPY performance was -3.1% and 11.3% respectively. Over the previous week the market value of the iM 6-Stock Capital Strength Portfolio gained -0.03% at a time when SPY gained -2.88%. A starting capital of $100,000 at inception on 10/28/2016 would have grown to $147,293 which includes $1,253 cash and excludes $630 spent on fees and slippage. |
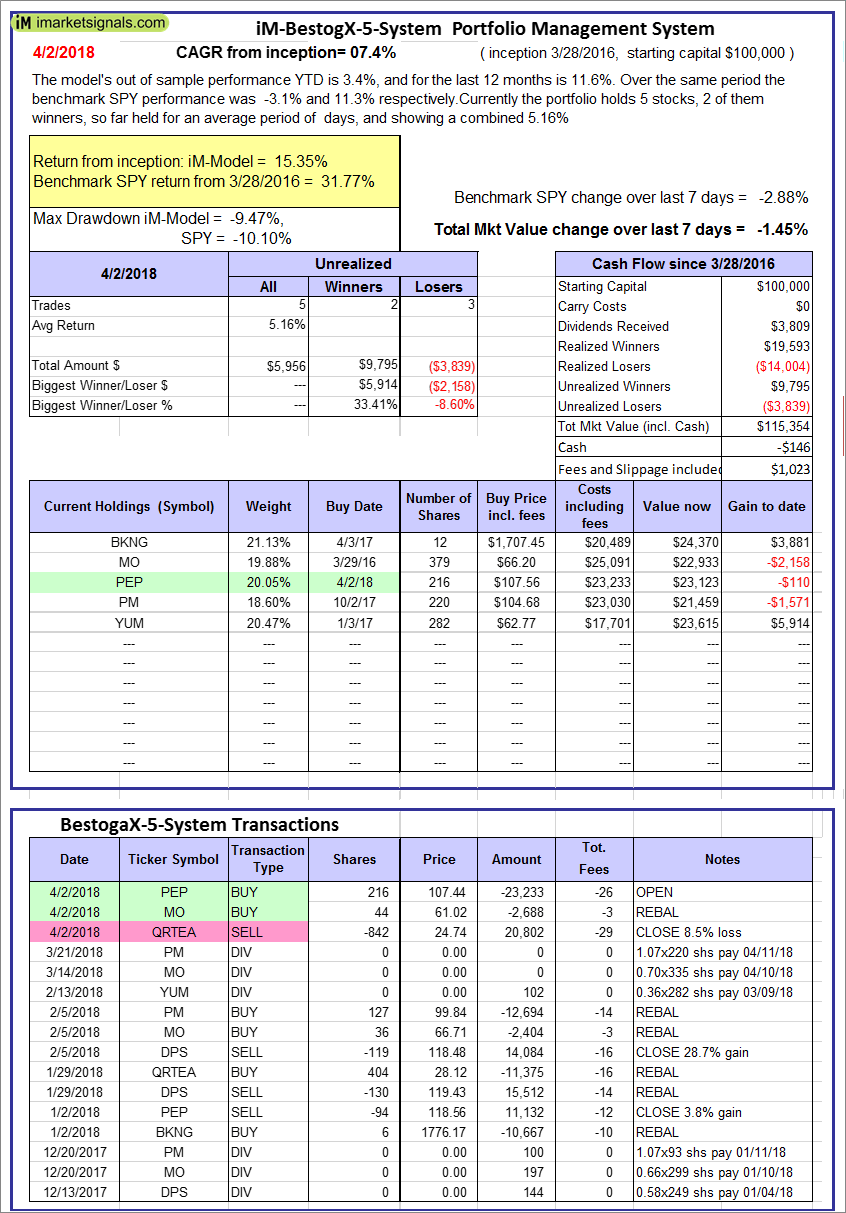 |
iM-BestogaX5-System: The model’s out of sample performance YTD is 3.4%, and for the last 12 months is 11.6%. Over the same period the benchmark SPY performance was -3.1% and 11.3% respectively. Over the previous week the market value of iM-BestogaX5-System gained -1.45% at a time when SPY gained -2.88%. A starting capital of $100,000 at inception on 3/28/2016 would have grown to $115,354 which includes -$146 cash and excludes $1,023 spent on fees and slippage. |
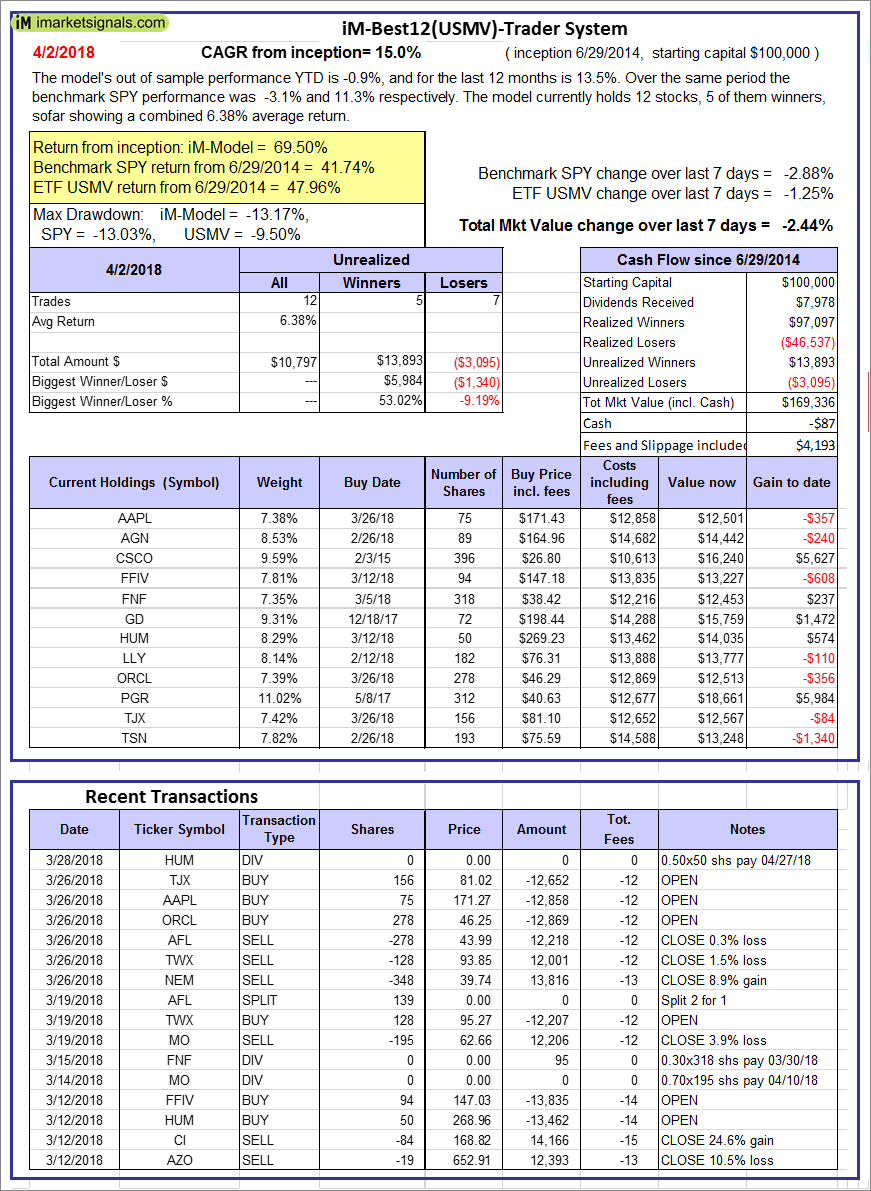 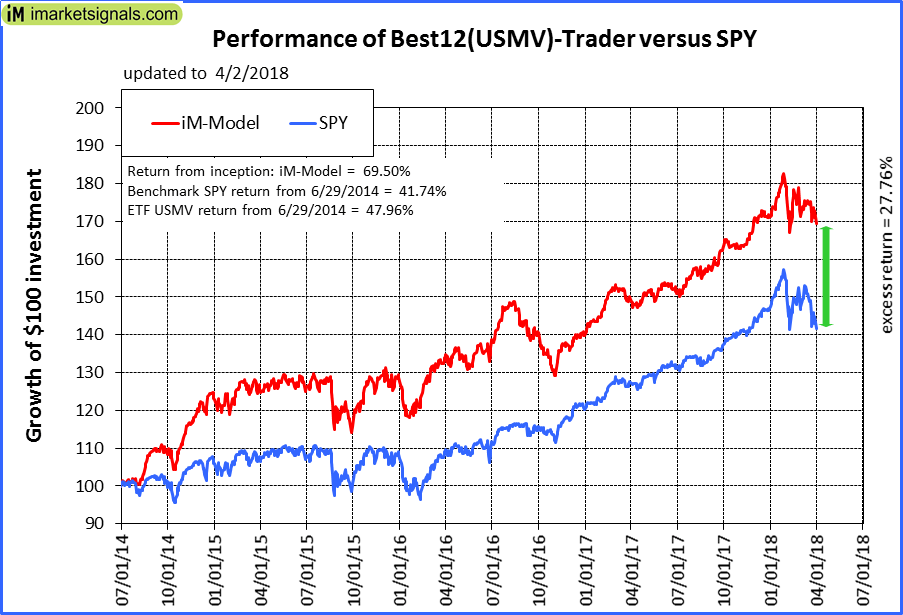 |
iM-Best12(USMV)-Trader: The model’s out of sample performance YTD is -0.9%, and for the last 12 months is 13.5%. Over the same period the benchmark SPY performance was -3.1% and 11.3% respectively. Since inception, on 6/30/2014, the model gained 69.50% while the benchmark SPY gained 41.74% and the ETF USMV gained 47.96% over the same period. Over the previous week the market value of iM-Best12(USMV)-Trader gained -2.44% at a time when SPY gained -2.88%. A starting capital of $100,000 at inception on 6/30/2014 would have grown to $169,336 which includes -$87 cash and excludes $4,193 spent on fees and slippage. |
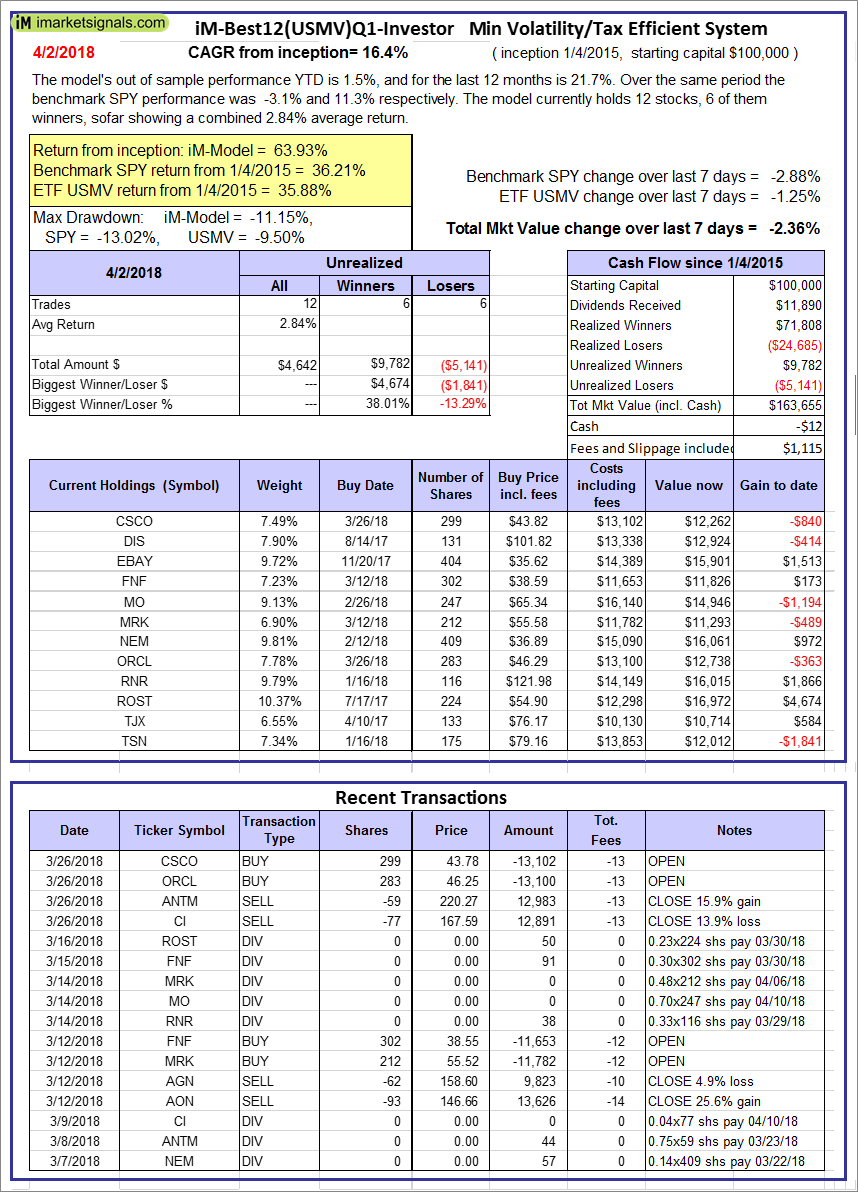 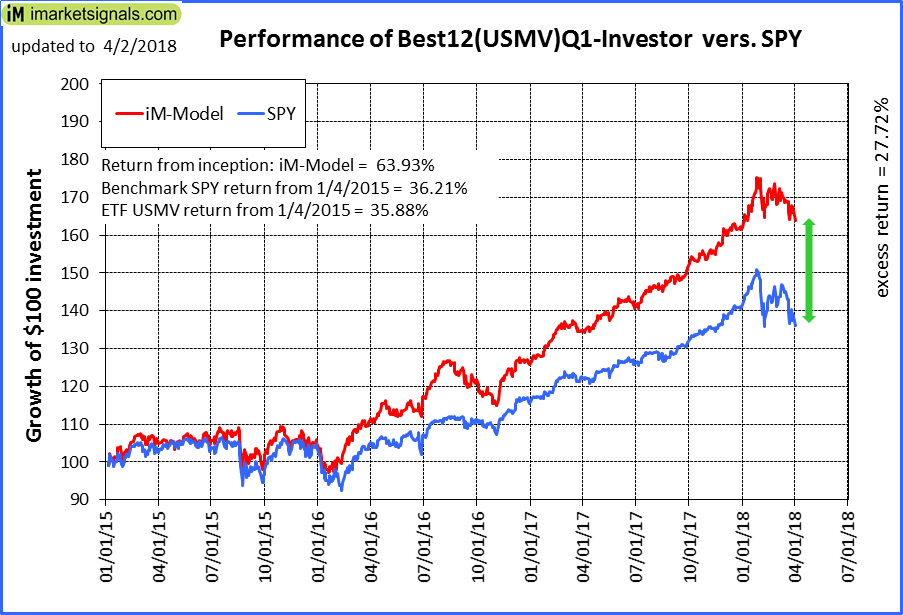 |
iM-Best12(USMV)Q1-Investor: The model’s out of sample performance YTD is 1.5%, and for the last 12 months is 21.7%. Over the same period the benchmark SPY performance was -3.1% and 11.3% respectively. Since inception, on 1/5/2015, the model gained 63.93% while the benchmark SPY gained 36.21% and the ETF USMV gained 35.88% over the same period. Over the previous week the market value of iM-Best12(USMV)Q1 gained -2.36% at a time when SPY gained -2.88%. A starting capital of $100,000 at inception on 1/5/2015 would have grown to $163,655 which includes -$12 cash and excludes $1,115 spent on fees and slippage. |
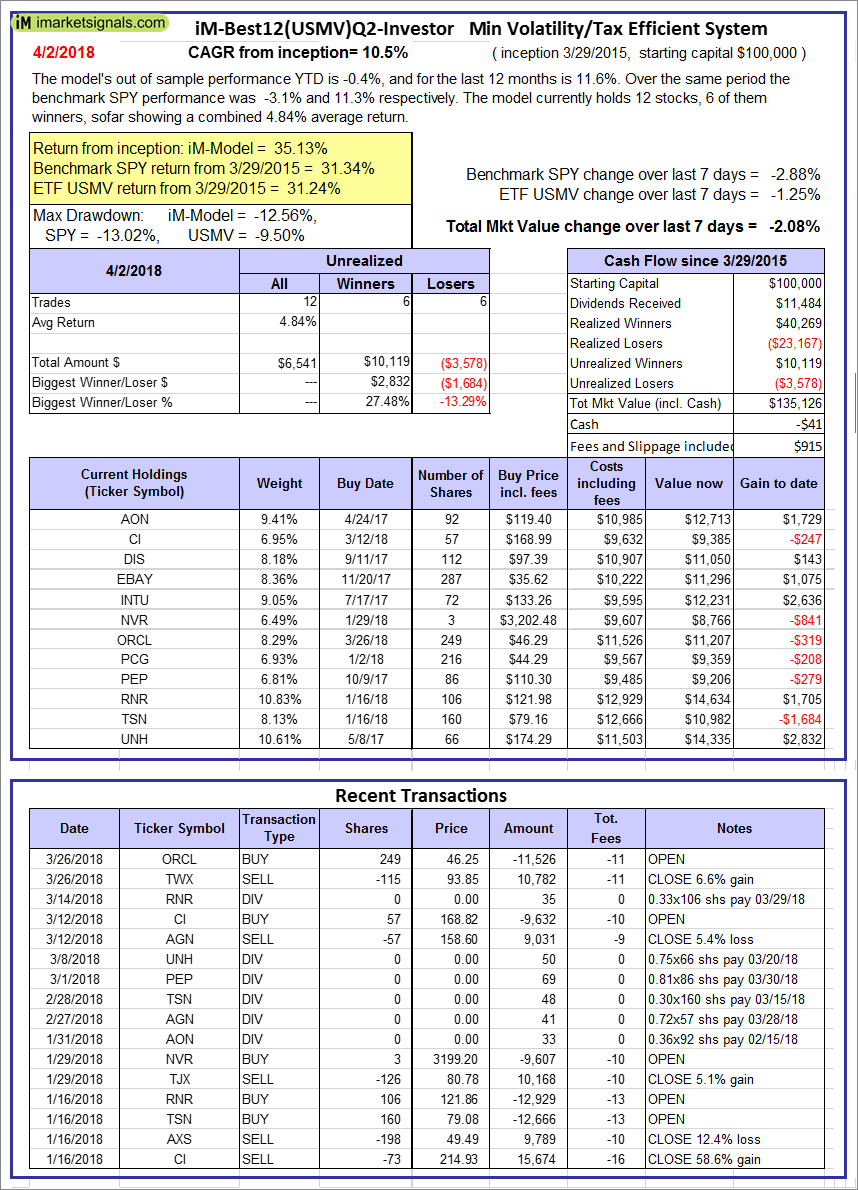 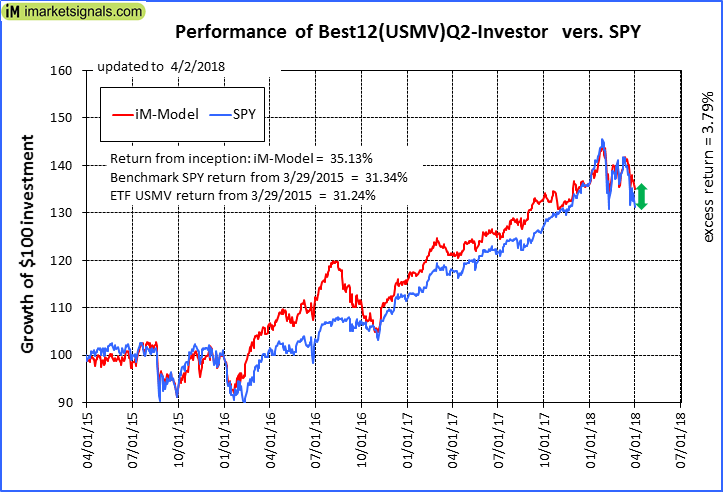 |
iM-Best12(USMV)Q2-Investor: The model’s out of sample performance YTD is -0.4%, and for the last 12 months is 11.6%. Over the same period the benchmark SPY performance was -3.1% and 11.3% respectively. Since inception, on 3/30/2015, the model gained 35.13% while the benchmark SPY gained 31.34% and the ETF USMV gained 31.24% over the same period. Over the previous week the market value of iM-Best12(USMV)Q2 gained -2.08% at a time when SPY gained -2.88%. A starting capital of $100,000 at inception on 3/30/2015 would have grown to $135,126 which includes -$41 cash and excludes $915 spent on fees and slippage. |
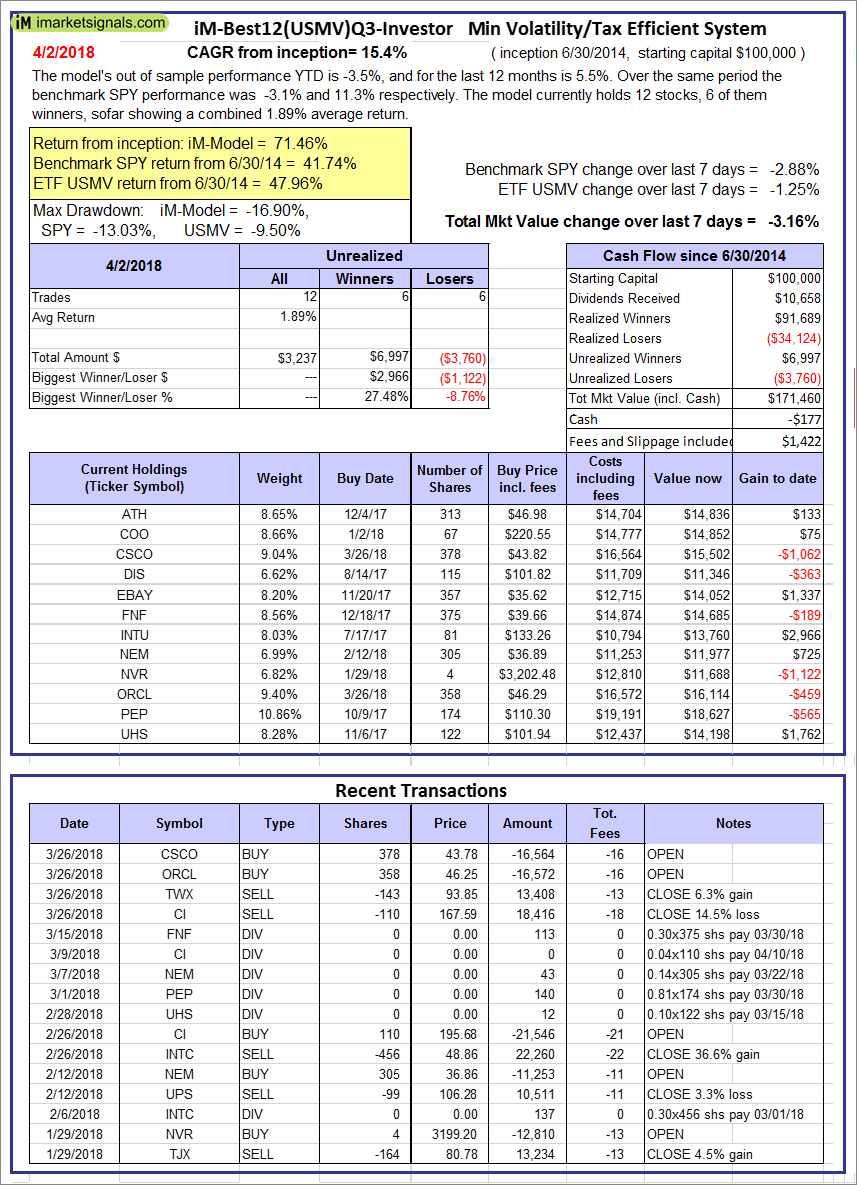 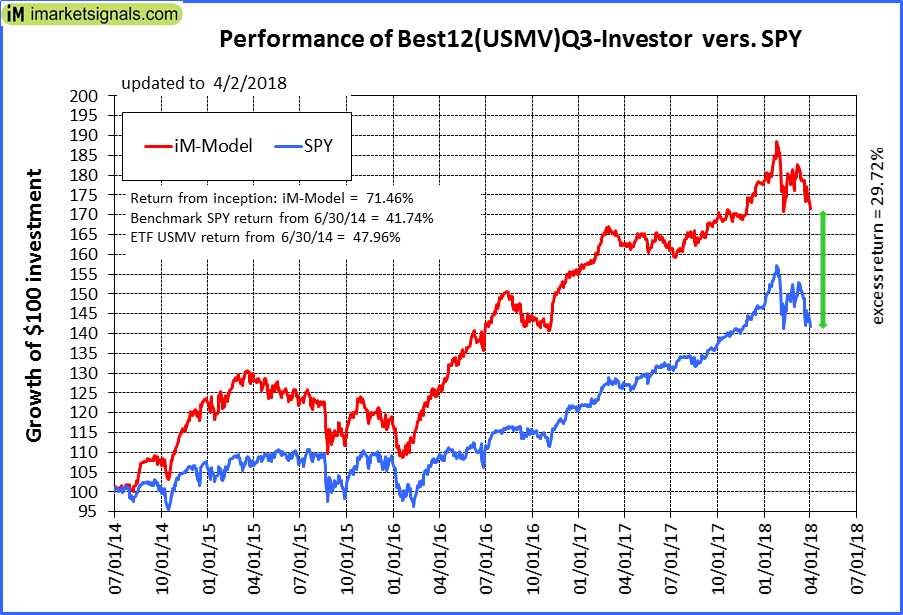 |
iM-Best12(USMV)Q3-Investor: The model’s out of sample performance YTD is -3.5%, and for the last 12 months is 5.5%. Over the same period the benchmark SPY performance was -3.1% and 11.3% respectively. Since inception, on 7/1/2014, the model gained 71.46% while the benchmark SPY gained 41.74% and the ETF USMV gained 47.96% over the same period. Over the previous week the market value of iM-Best12(USMV)Q3 gained -3.16% at a time when SPY gained -2.88%. A starting capital of $100,000 at inception on 7/1/2014 would have grown to $171,460 which includes -$177 cash and excludes $1,422 spent on fees and slippage. |
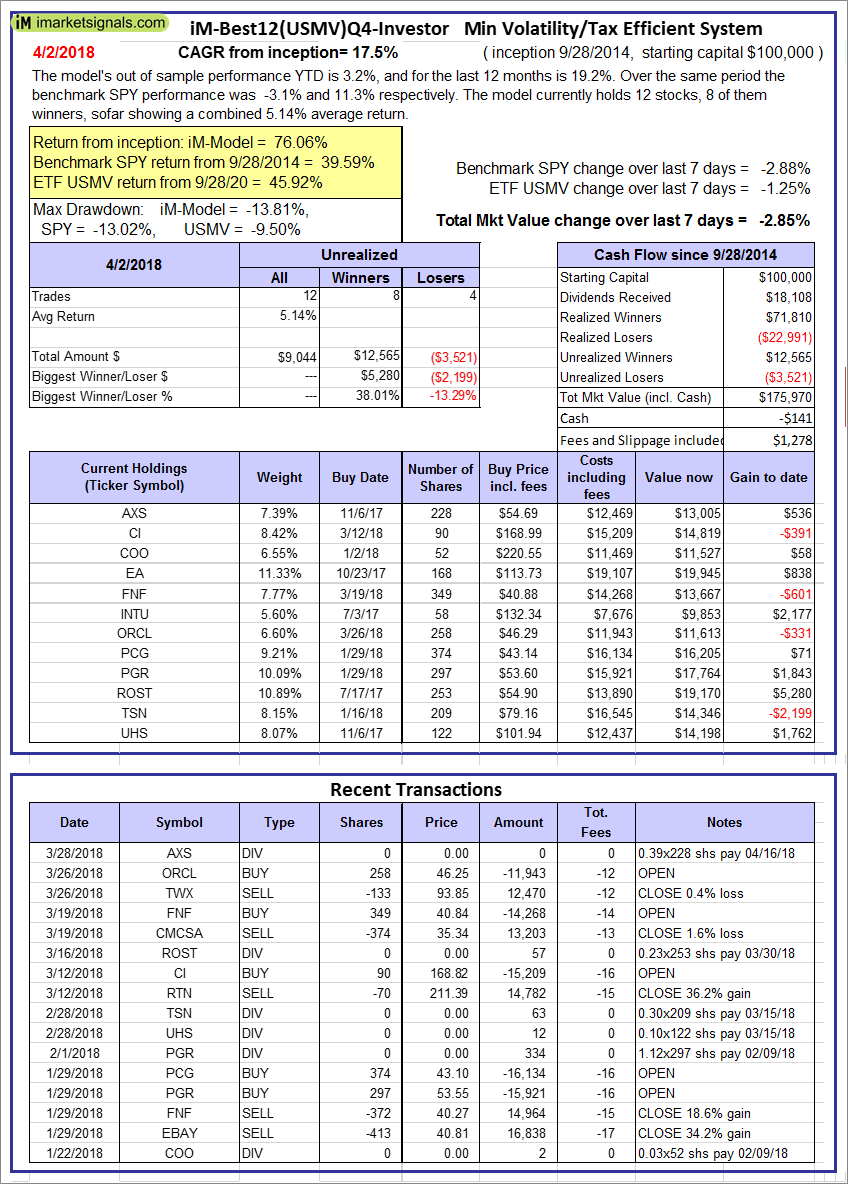 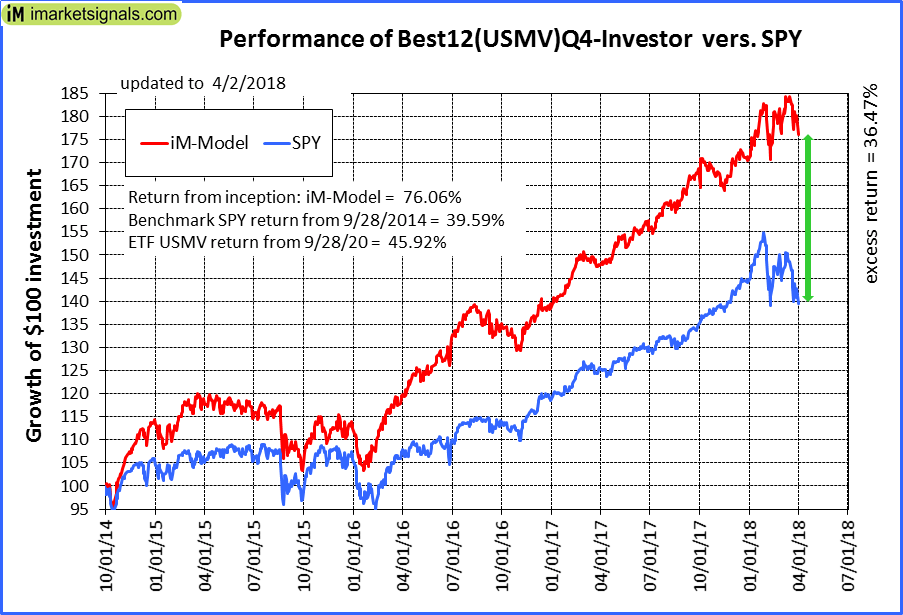 |
iM-Best12(USMV)Q4-Investor: Since inception, on 9/29/2014, the model gained 76.06% while the benchmark SPY gained 39.59% and the ETF USMV gained 45.92% over the same period. Over the previous week the market value of iM-Best12(USMV)Q4 gained -2.85% at a time when SPY gained -2.88%. A starting capital of $100,000 at inception on 9/29/2014 would have grown to $175,970 which includes -$141 cash and excludes $1,278 spent on fees and slippage. |
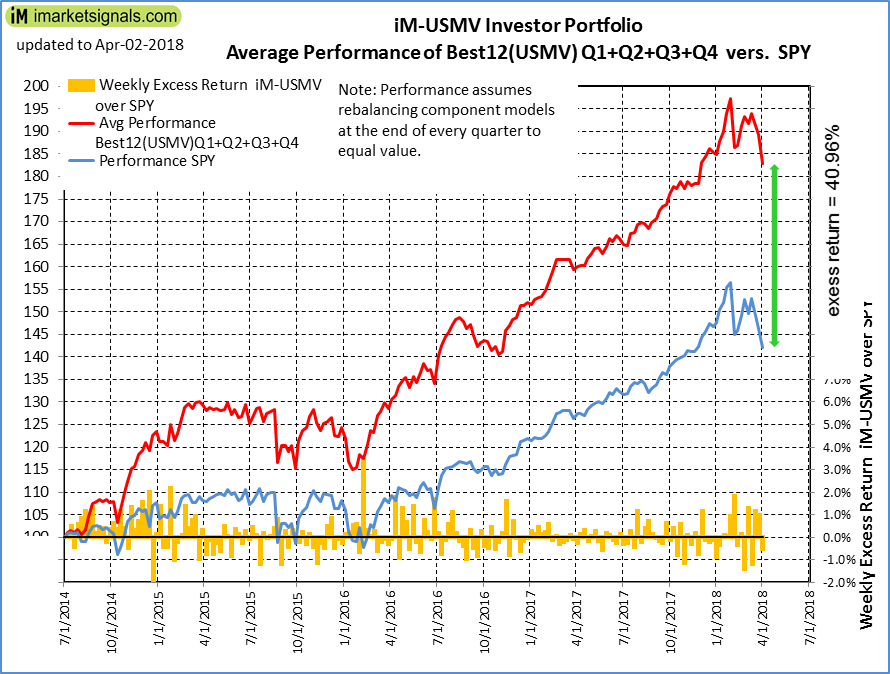 |
Average Performance of iM-Best12(USMV)Q1+Q2+Q3+Q4-Investor resulted in an excess return of 40.96% over SPY. (see iM-USMV Investor Portfolio) |
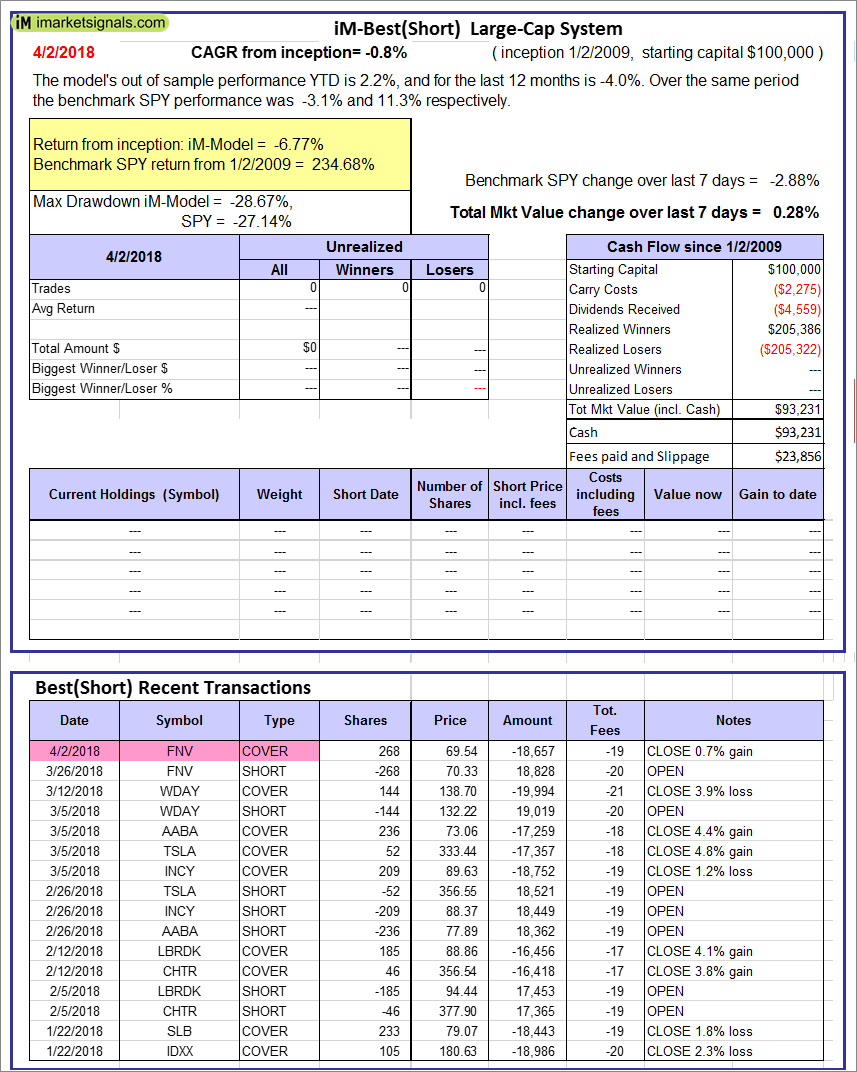 |
iM-Best(Short): The model’s out of sample performance YTD is 2.2%, and for the last 12 months is -4.0%. Over the same period the benchmark SPY performance was -3.1% and 11.3% respectively. Over the previous week the market value of iM-Best(Short) gained 0.28% at a time when SPY gained -2.88%. Over the period 1/2/2009 to 4/2/2018 the starting capital of $100,000 would have grown to $93,231 which includes $93,231 cash and excludes $23,856 spent on fees and slippage. |
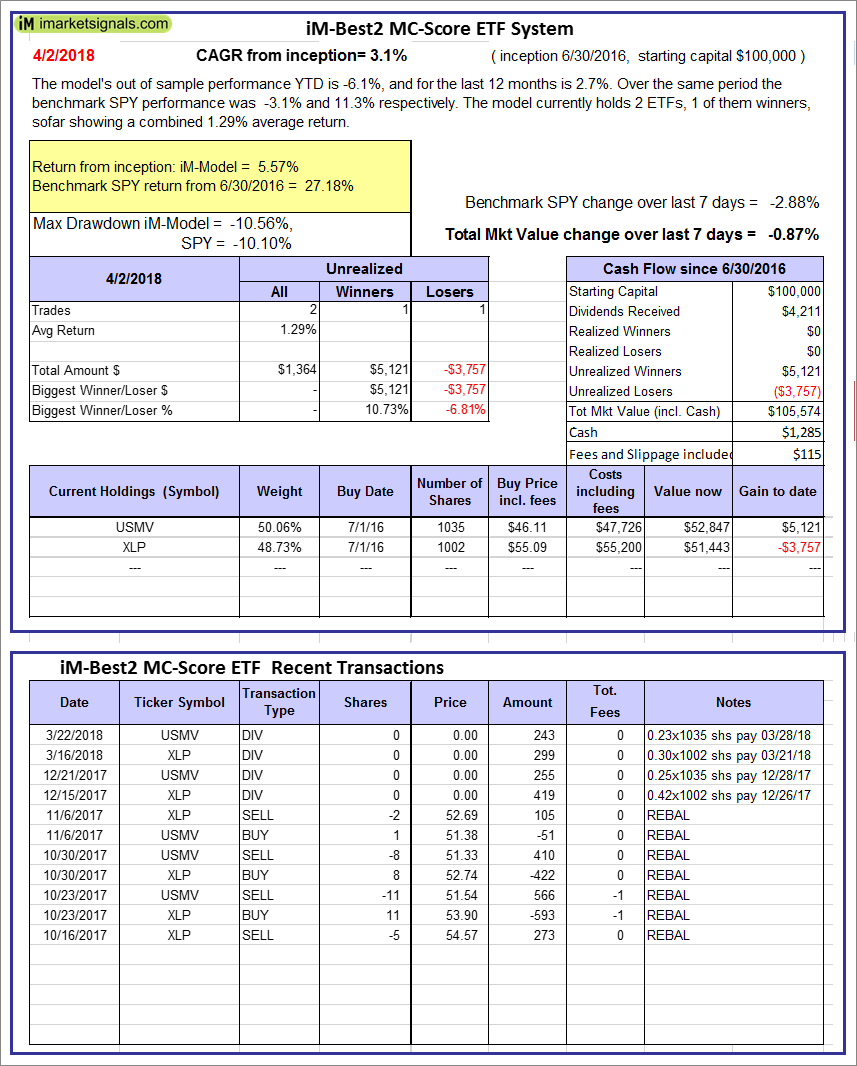 |
iM-Best2 MC-Score ETF System: The model’s out of sample performance YTD is -6.1%, and for the last 12 months is 2.7%. Over the same period the benchmark SPY performance was -3.1% and 11.3% respectively. Over the previous week the market value of the iM-Best2 MC-Score ETF System gained -0.87% at a time when SPY gained -2.88%. A starting capital of $100,000 at inception on 6/30/2016 would have grown to $105,574 which includes $1,285 cash and excludes $115 spent on fees and slippage. |
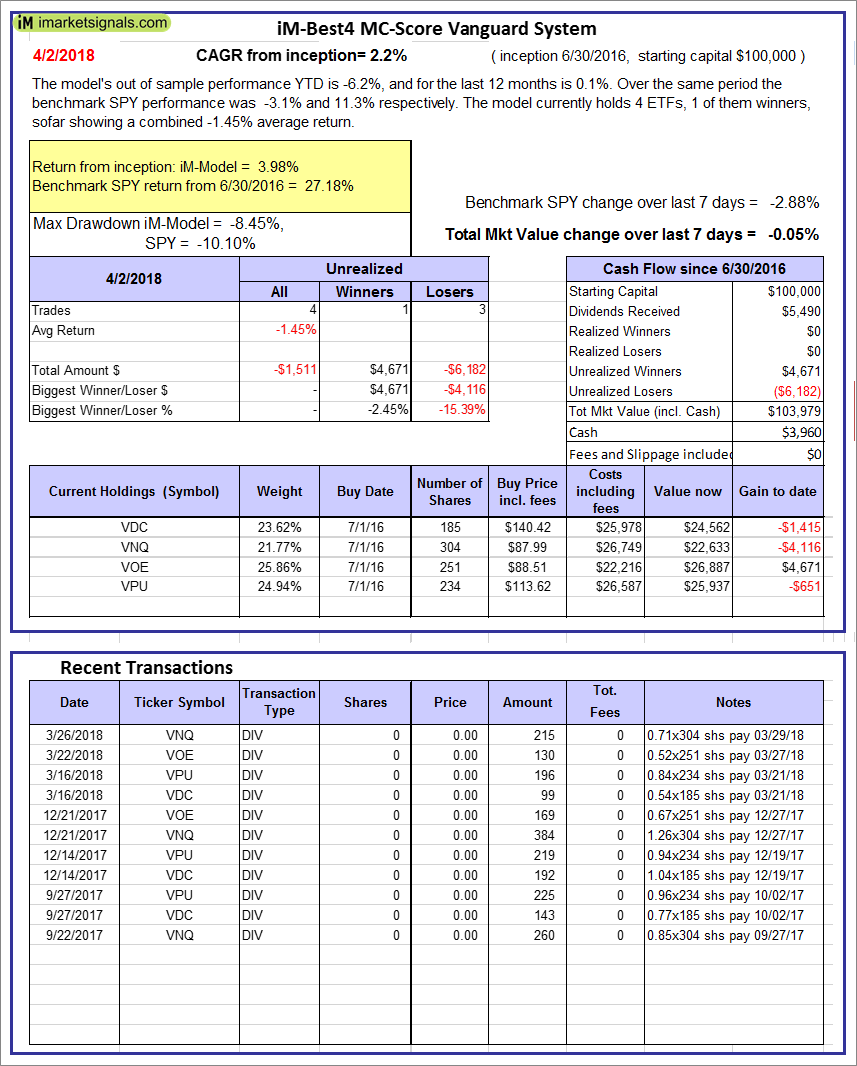 |
iM-Best4 MC-Score Vanguard System: The model’s out of sample performance YTD is -6.2%, and for the last 12 months is 0.1%. Over the same period the benchmark SPY performance was -3.1% and 11.3% respectively. Over the previous week the market value of the iM-Best4 MC-Score Vanguard System gained -0.05% at a time when SPY gained -2.88%. A starting capital of $100,000 at inception on 6/30/2016 would have grown to $103,979 which includes $3,960 cash and excludes $00 spent on fees and slippage. |
 |
iM-Composite (SH-RSP) Timer: The model’s out of sample performance YTD is -3.2%, and for the last 12 months is 8.9%. Over the same period the benchmark SPY performance was -3.1% and 11.3% respectively. Over the previous week the market value of the iM-Composite (SH-RSP) Timer gained -2.19% at a time when SPY gained -2.88%. A starting capital of $100,000 at inception on 6/30/2016 would have grown to $125,799 which includes $2,714 cash and excludes $513 spent on fees and slippage. |
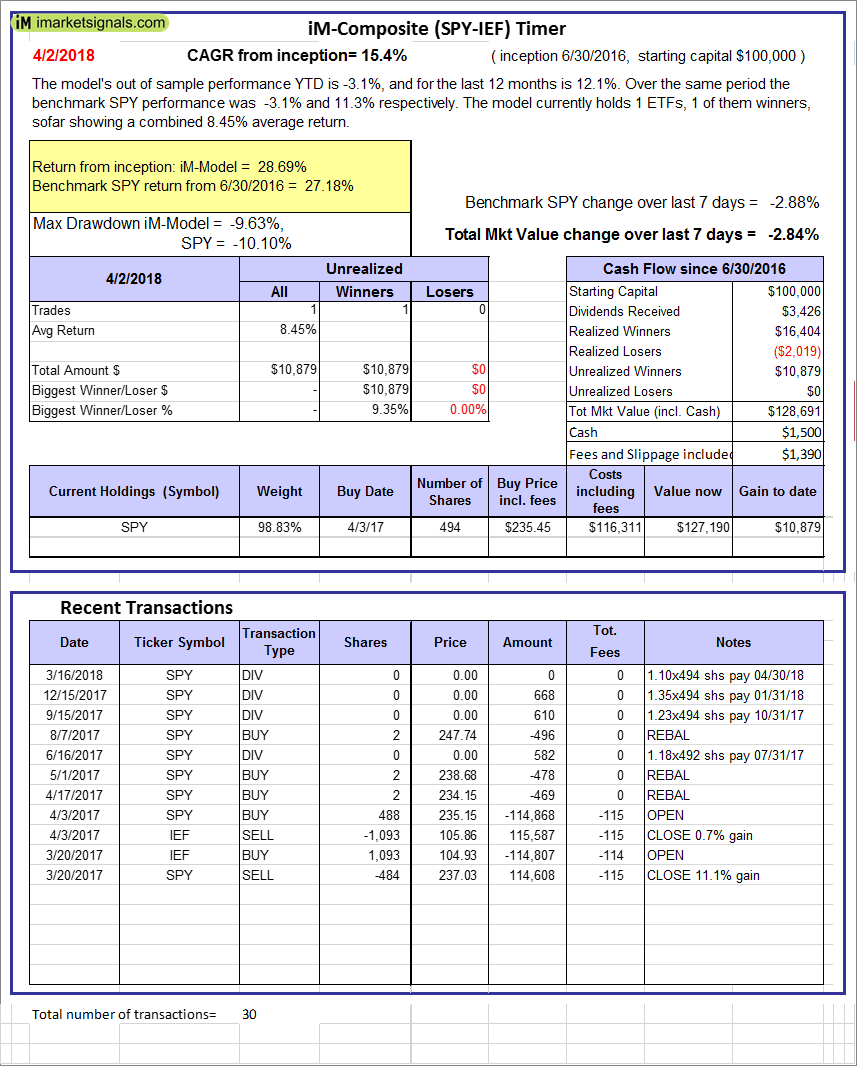 |
iM-Composite (SPY-IEF) Timer: The model’s out of sample performance YTD is -3.1%, and for the last 12 months is 12.1%. Over the same period the benchmark SPY performance was -3.1% and 11.3% respectively. Over the previous week the market value of the iM-Composite (SPY-IEF) Timer gained -2.84% at a time when SPY gained -2.88%. A starting capital of $100,000 at inception on 6/30/2016 would have grown to $128,691 which includes $1,500 cash and excludes $1,390 spent on fees and slippage. |
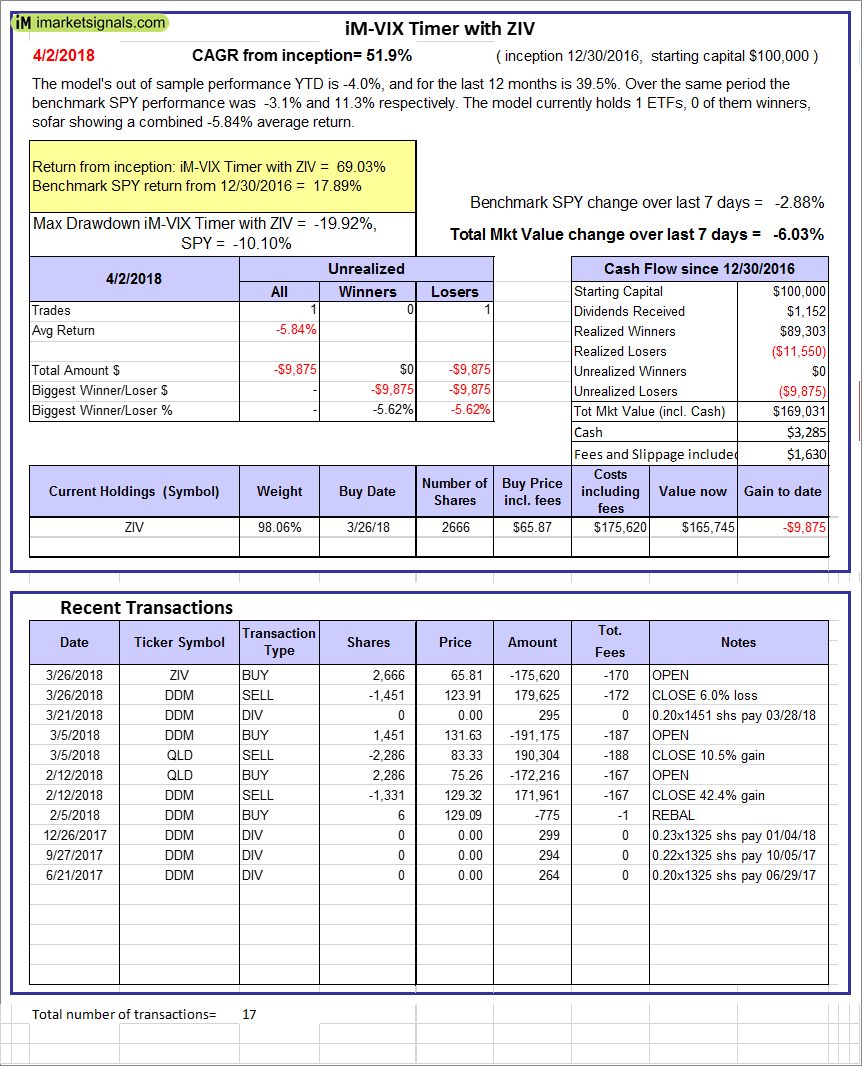 |
iM-VIX Timer with ZIV: The model’s out of sample performance YTD is -4.0%, and for the last 12 months is 39.5%. Over the same period the benchmark SPY performance was -3.1% and 11.3% respectively. Over the previous week the market value of the iM-VIX Timer with ZIV gained -6.03% at a time when SPY gained -2.88%. A starting capital of $100,000 at inception on 6/30/2016 would have grown to $169,031 which includes $3,285 cash and excludes $1,630 spent on fees and slippage. |
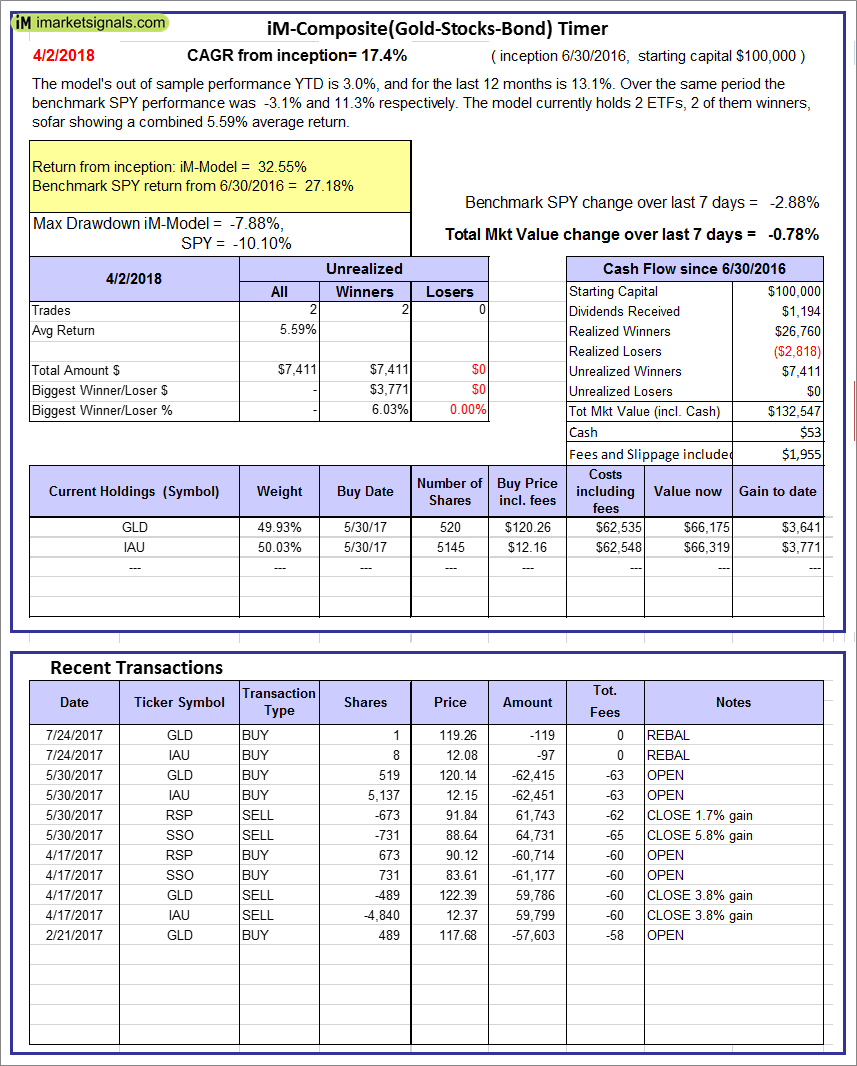 |
iM-Composite(Gold-Stocks-Bond) Timer: The model’s out of sample performance YTD is 3.0%, and for the last 12 months is 13.1%. Over the same period the benchmark SPY performance was -3.1% and 11.3% respectively. Over the previous week the market value of the iM-Composite(Gold-Stocks-Bond) Timer gained -0.78% at a time when SPY gained -2.88%. A starting capital of $100,000 at inception on 6/30/2016 would have grown to $132,547 which includes $53 cash and excludes $1,955 spent on fees and slippage. |
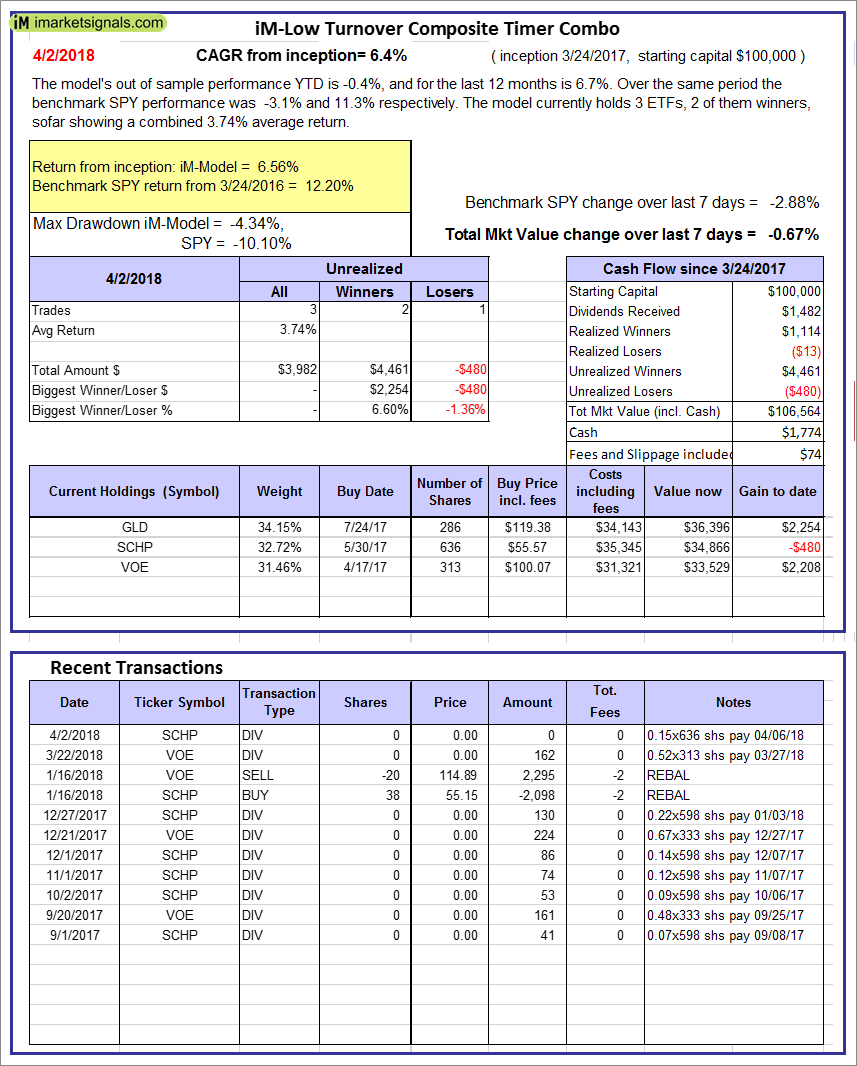 |
iM-Low Turnover Composite Timer Combo: The model’s out of sample performance YTD is -0.4%, and for the last 12 months is 6.7%. Over the same period the benchmark SPY performance was -3.1% and 11.3% respectively. Over the previous week the market value of the iM-Low Turnover Composite Timer Combo gained -0.67% at a time when SPY gained -2.88%. A starting capital of $100,000 at inception on 3/24/27 would have grown to $106,564 which includes $1,774 cash and excludes $74 spent on fees and slippage. |
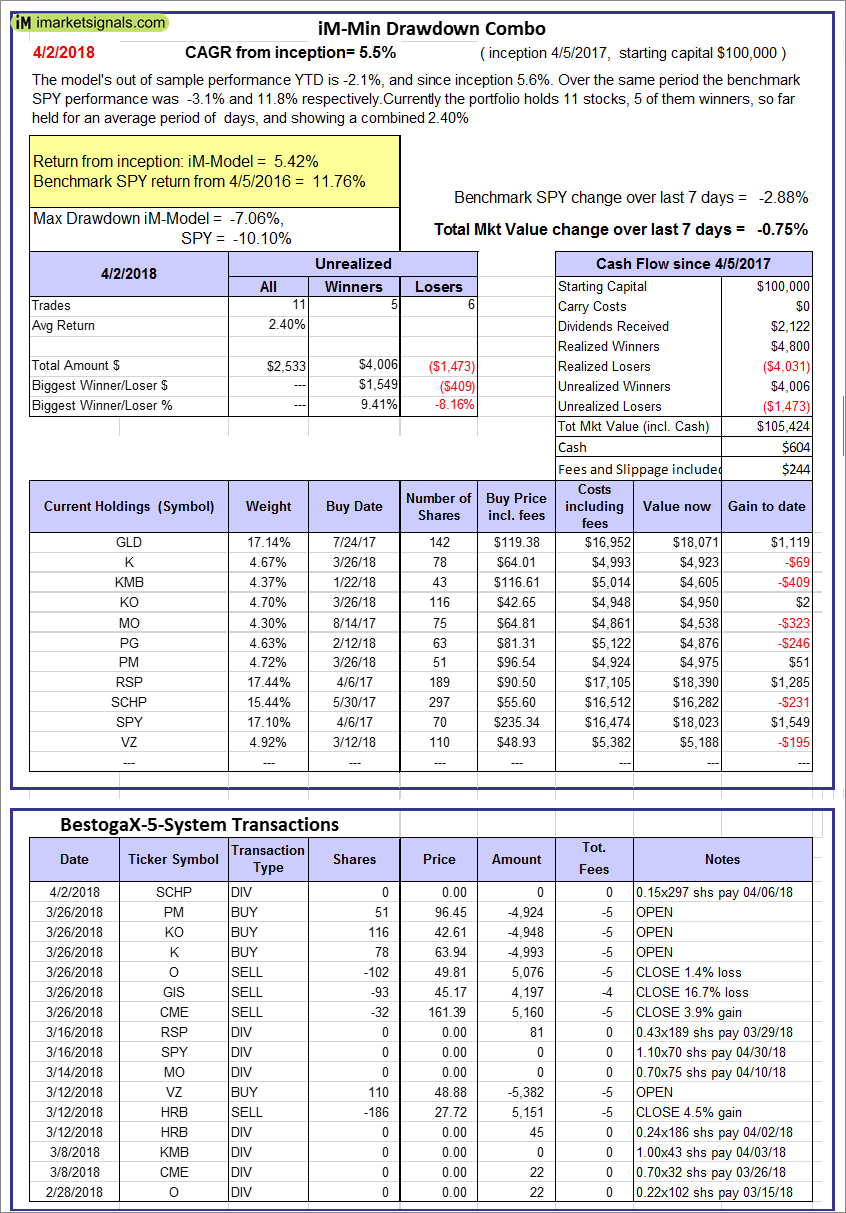 |
iM-Min Drawdown Combo: The model’s out of sample performance YTD is -2.1%, and since inception 5.6%. Over the same period the benchmark SPY performance was -3.1% and 11.8% respectively. Over the previous week the market value of the iM-Min Drawdown Combo gained -0.75% at a time when SPY gained -2.88%. A starting capital of $100,000 at inception on 4/5/2017 would have grown to $105,424 which includes $604 cash and excludes $244 spent on fees and slippage. |
 |
iM-5ETF Trader (includes leveraged ETFs): The model’s out of sample performance YTD is -6.0%, and for the last 12 months is 21.0%. Over the same period the benchmark SPY performance was -3.1% and 11.3% respectively. Over the previous week the market value of the iM-5ETF Trader (includes leveraged ETFs) gained -6.22% at a time when SPY gained -2.88%. A starting capital of $100,000 at inception on 10/30/2016 would have grown to $153,053 which includes $1,298 cash and excludes $1,030 spent on fees and slippage. |
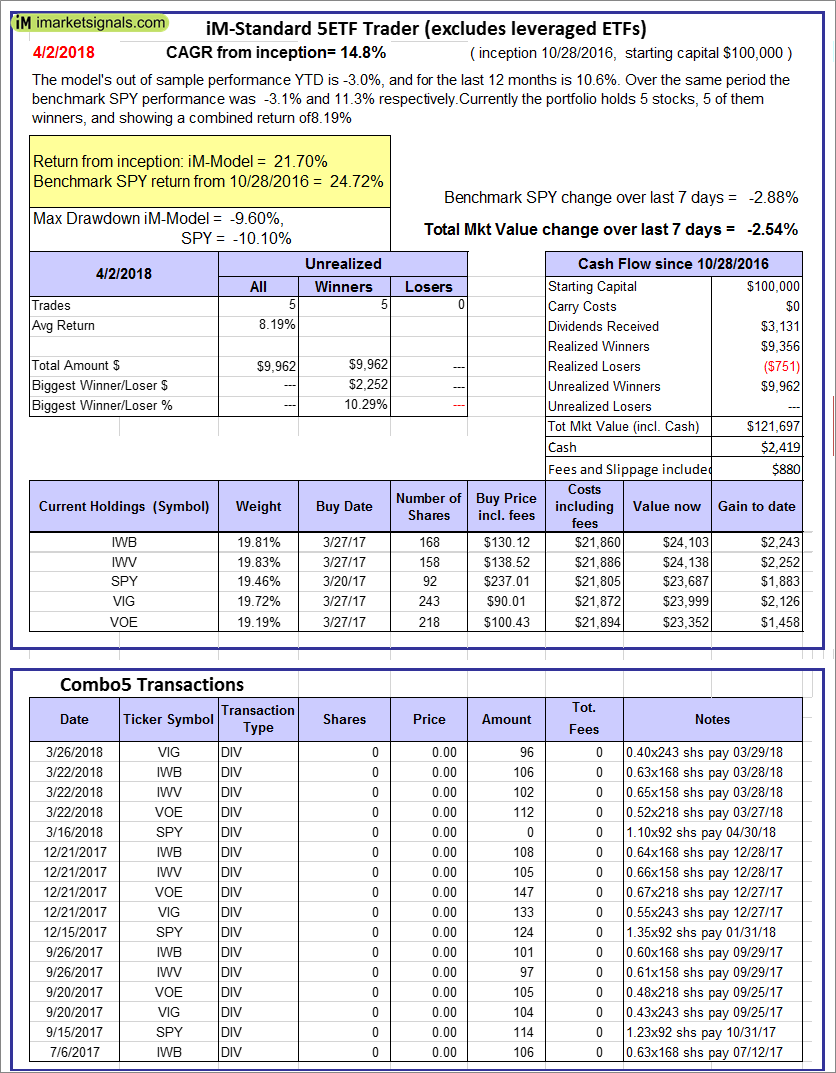 |
iM-Standard 5ETF Trader (excludes leveraged ETFs): The model’s out of sample performance YTD is -3.0%, and for the last 12 months is 10.6%. Over the same period the benchmark SPY performance was -3.1% and 11.3% respectively. Over the previous week the market value of the iM-Standard 5ETF Trader (excludes leveraged ETFs) gained -2.54% at a time when SPY gained -2.88%. A starting capital of $100,000 at inception on 10/30/2016 would have grown to $121,697 which includes $2,419 cash and excludes $880 spent on fees and slippage. |
iM-Best Reports – 4/2/2018
Posted in pmp SPY-SH
Leave a Reply
You must be logged in to post a comment.