
  |
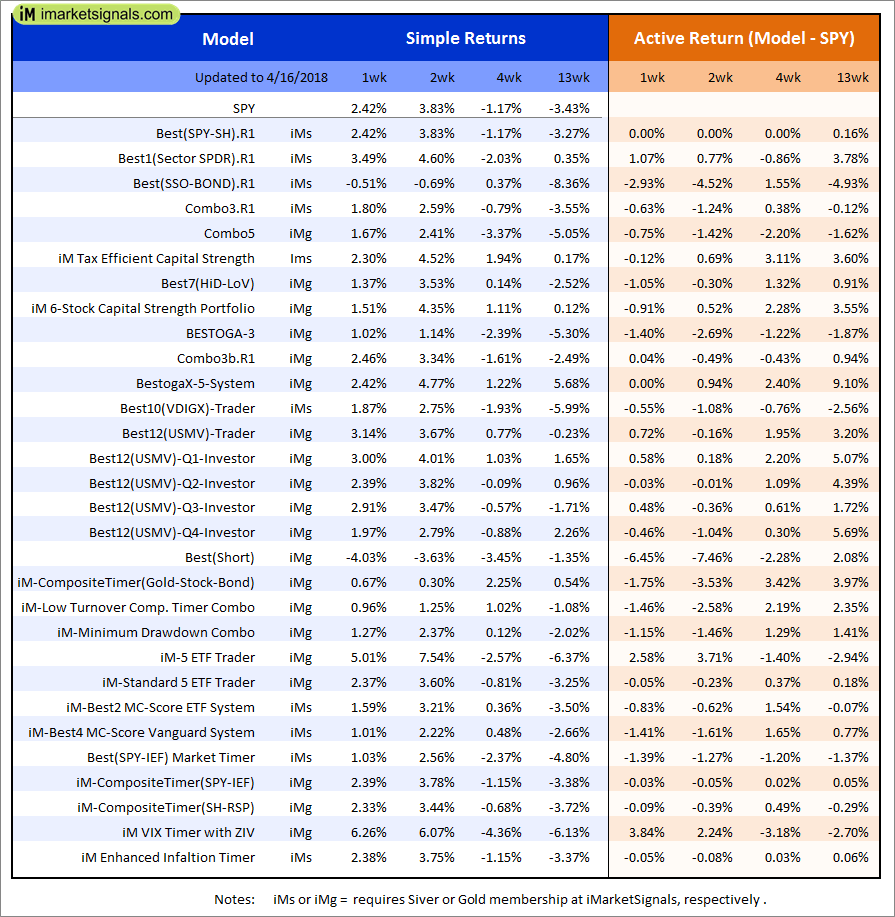
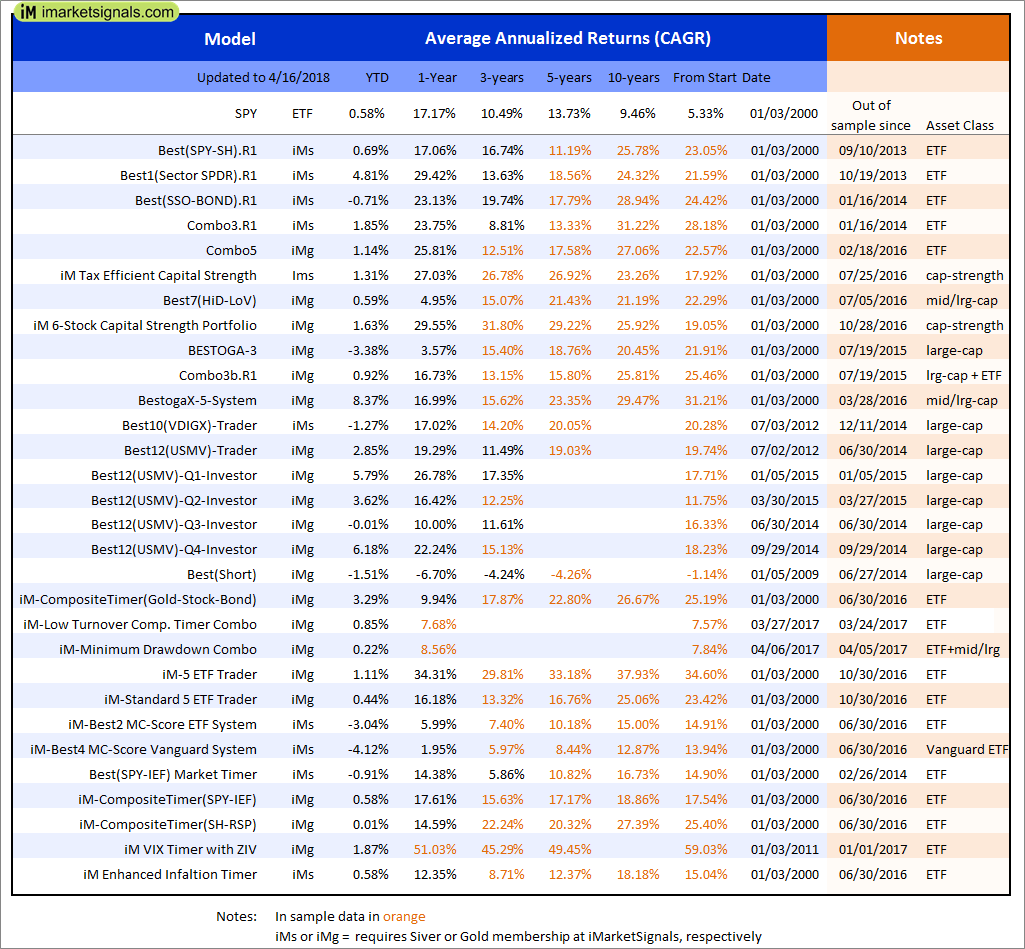
Out of sample performance summary of our models for the past 1, 2, 4 and 13 week periods. The active active return indicates how the models over- or underperformed the benchmark ETF SPY. Also the YTD, and the 1-, 3-, 5- and 10-year annualized returns are shown in the second table |
 |
iM-Best(SPY-SH).R1: The model’s out of sample performance YTD is 0.6%, and for the last 12 months is 17.5%. Over the same period the benchmark SPY performance was 0.6% and 17.2% respectively. Over the previous week the market value of Best(SPY-SH) gained 2.41% at a time when SPY gained 2.43%. A starting capital of $100,000 at inception on 1/2/2009 would have grown to $566,160 which includes $222 cash and excludes $15,369 spent on fees and slippage. |
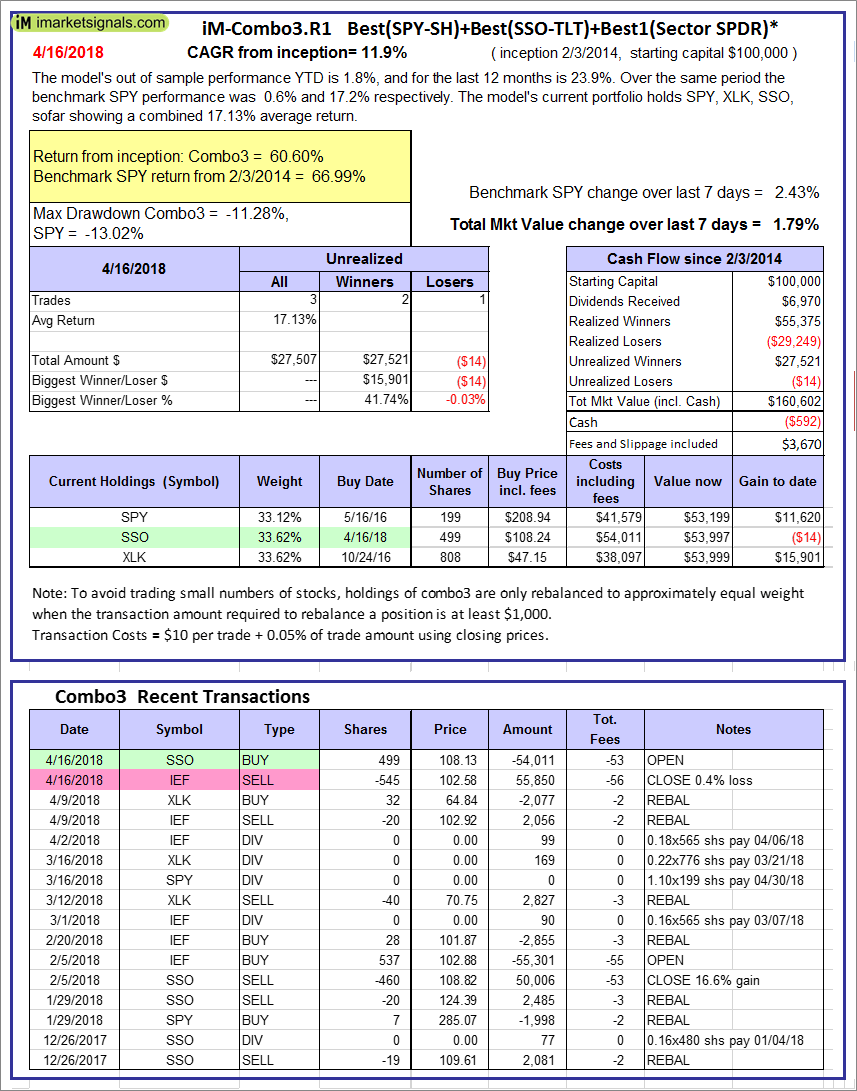 |
iM-Combo3.R1: The model’s out of sample performance YTD is 1.8%, and for the last 12 months is 23.9%. Over the same period the benchmark SPY performance was 0.6% and 17.2% respectively. Over the previous week the market value of iM-Combo3.R1 gained 1.79% at a time when SPY gained 2.43%. A starting capital of $100,000 at inception on 2/3/2014 would have grown to $160,602 which includes -$592 cash and excludes $3,670 spent on fees and slippage. |
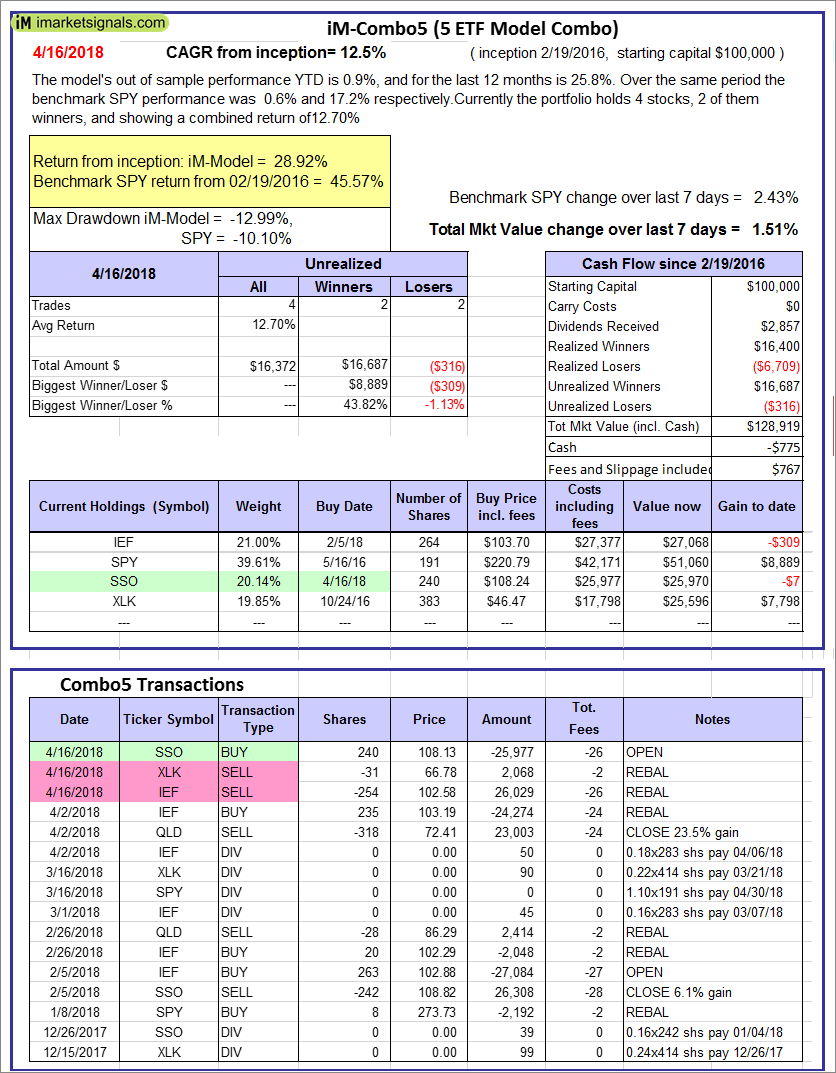 |
iM-Combo5: The model’s out of sample performance YTD is 0.9%, and for the last 12 months is 25.8%. Over the same period the benchmark SPY performance was 0.6% and 17.2% respectively. Over the previous week the market value of iM-Combo5 gained 1.51% at a time when SPY gained 2.43%. A starting capital of $100,000 at inception on 2/22/2016 would have grown to $128,919 which includes -$775 cash and excludes $767 spent on fees and slippage. |
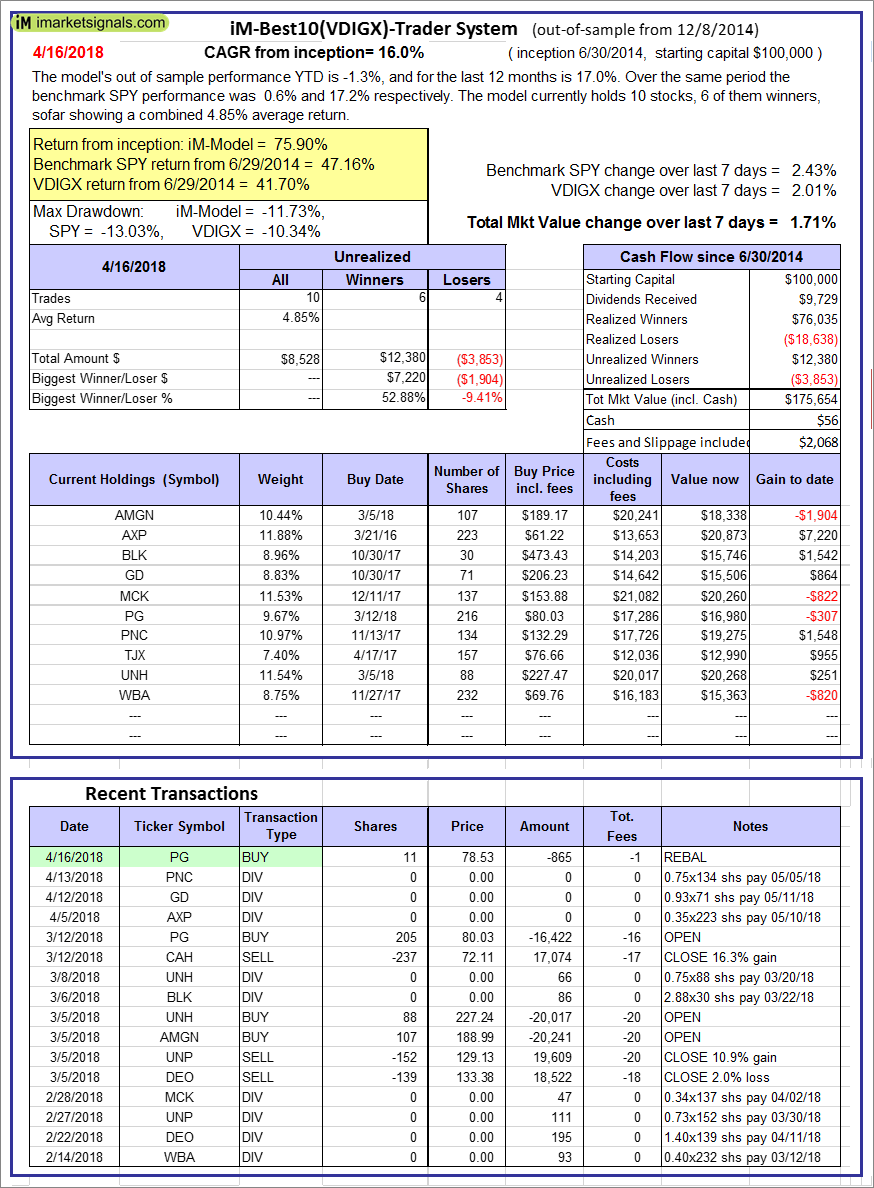 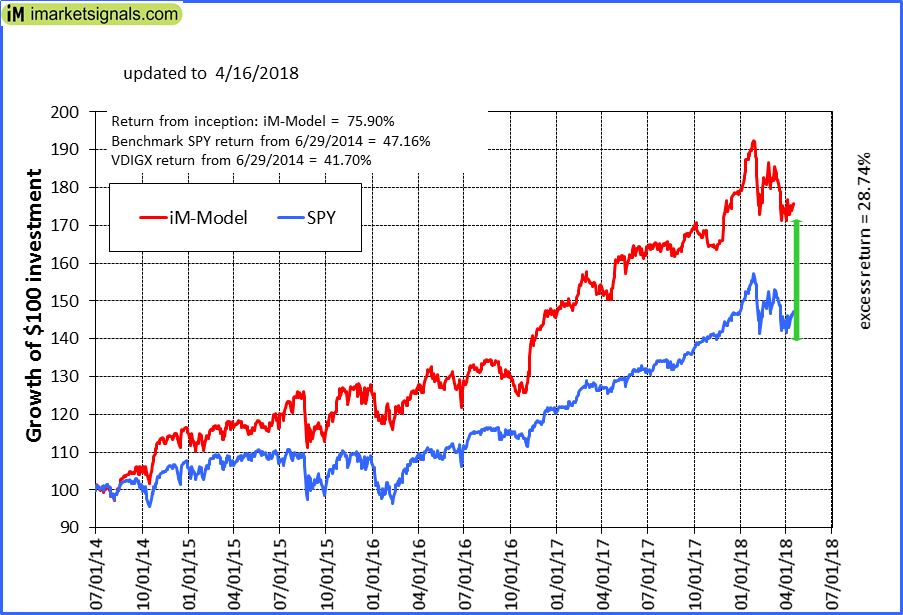 |
iM-Best10(VDIGX)-Trader: The model’s out of sample performance YTD is -1.3%, and for the last 12 months is 17.0%. Over the same period the benchmark SPY performance was 0.6% and 17.2% respectively. Since inception, on 7/1/2014, the model gained 75.90% while the benchmark SPY gained 47.16% and VDIGX gained 41.70% over the same period. Over the previous week the market value of iM-Best10(VDIGX) gained 1.71% at a time when SPY gained 2.43%. A starting capital of $100,000 at inception on 7/1/2014 would have grown to $175,654 which includes $56 cash and excludes $2,068 spent on fees and slippage. |
 |
iM-BESTOGA-3: The model’s out of sample performance YTD is -3.7%, and for the last 12 months is 3.6%. Over the same period the benchmark SPY performance was 0.6% and 17.2% respectively. Over the previous week the market value of iM-BESTOGA-3 gained 0.64% at a time when SPY gained 2.43%. A starting capital of $100,000 at inception on 2/3/2014 would have grown to $223,194 which includes -$270 cash and excludes $2,324 spent on fees and slippage. |
 |
iM-Best7(HiD-LoV): The model’s out of sample performance YTD is -0.2%, and for the last 12 months is 5.0%. Over the same period the benchmark SPY performance was 0.6% and 17.2% respectively. Over the previous week the market value of iM-BESTOGA-3 gained 1.02% at a time when SPY gained 2.43%. A starting capital of $100,000 at inception on 6/30/2016 would have grown to $112,952 which includes $1,023 cash and excludes $1,780 spent on fees and slippage. |
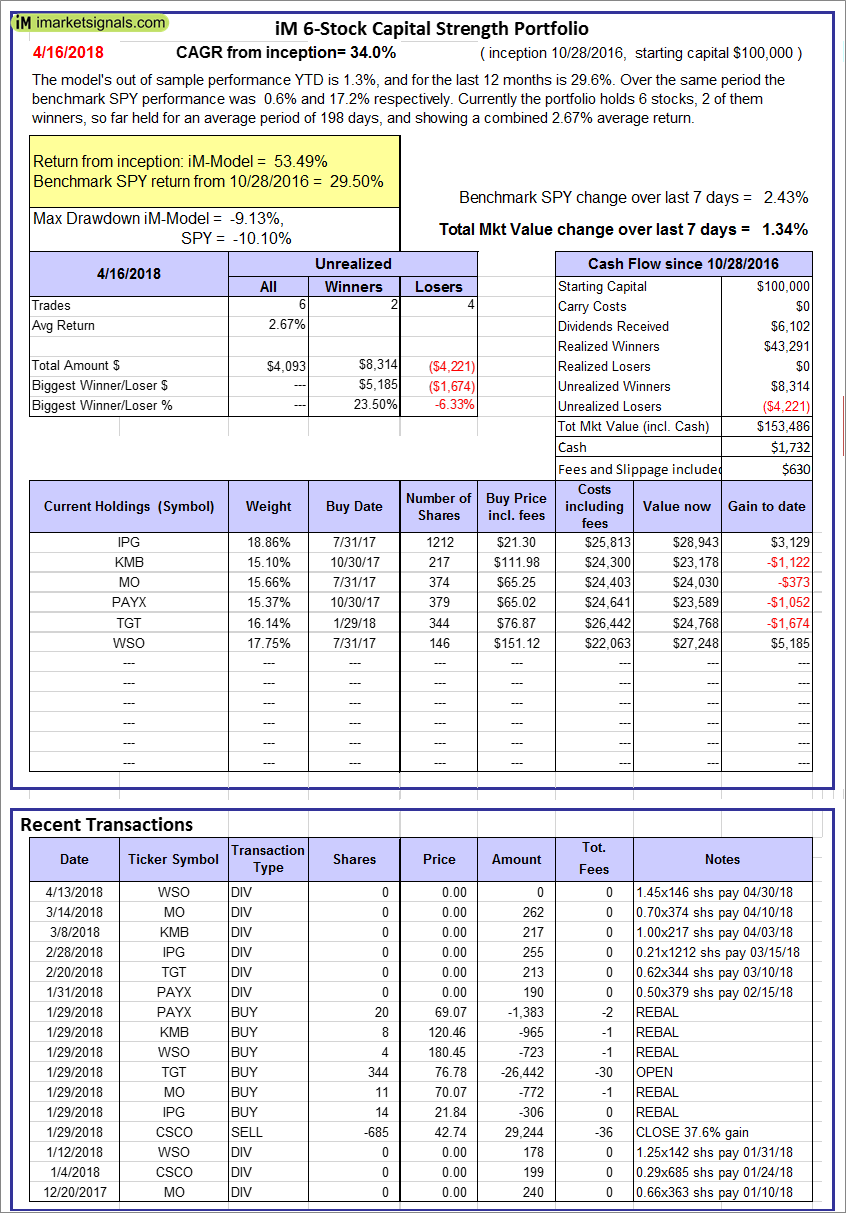 |
iM 6-Stock Capital Strength Portfolio: The model’s out of sample performance YTD is 1.3%, and for the last 12 months is 29.6%. Over the same period the benchmark SPY performance was 0.6% and 17.2% respectively. Over the previous week the market value of the iM 6-Stock Capital Strength Portfolio gained 1.34% at a time when SPY gained 2.43%. A starting capital of $100,000 at inception on 10/28/2016 would have grown to $153,486 which includes $1,732 cash and excludes $630 spent on fees and slippage. |
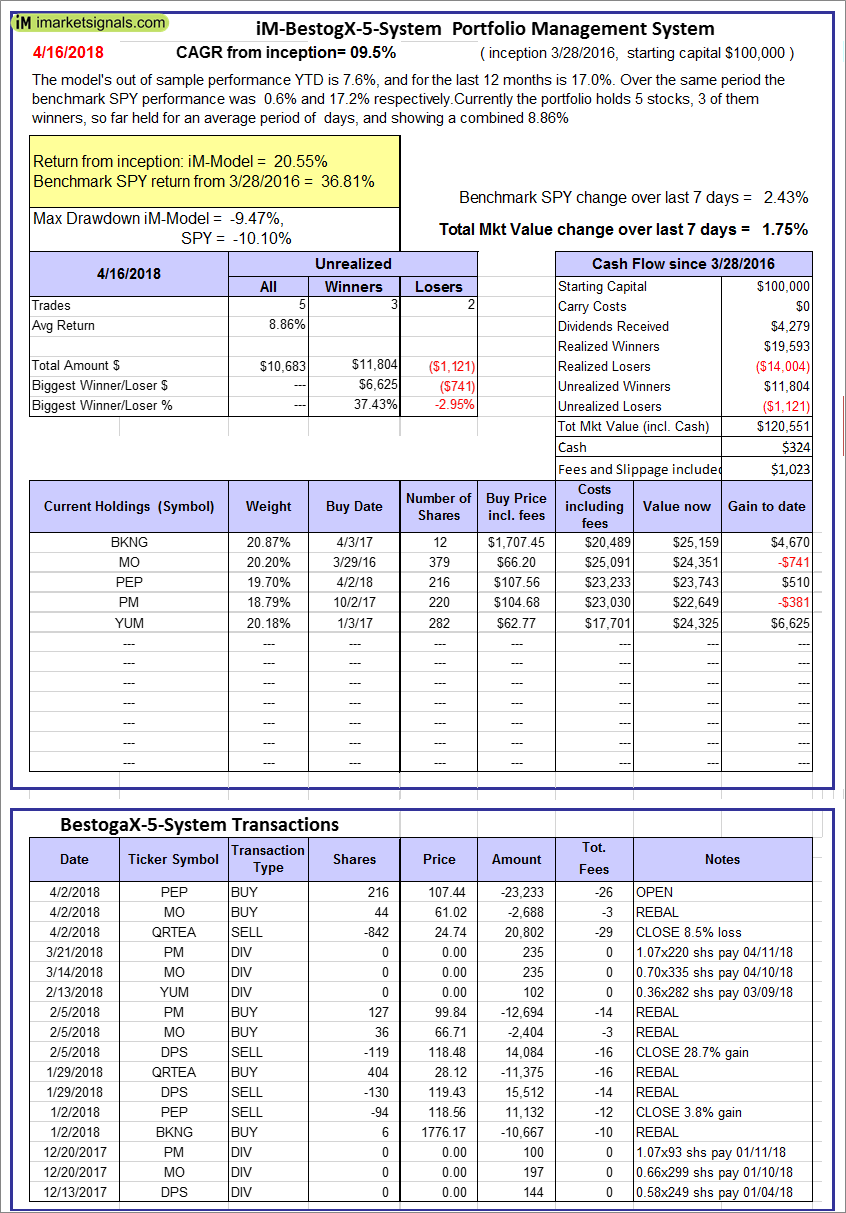 |
iM-BestogaX5-System: The model’s out of sample performance YTD is 7.6%, and for the last 12 months is 17.0%. Over the same period the benchmark SPY performance was 0.6% and 17.2% respectively. Over the previous week the market value of iM-BestogaX5-System gained 1.75% at a time when SPY gained 2.43%. A starting capital of $100,000 at inception on 3/28/2016 would have grown to $120,551 which includes $324 cash and excludes $1,023 spent on fees and slippage. |
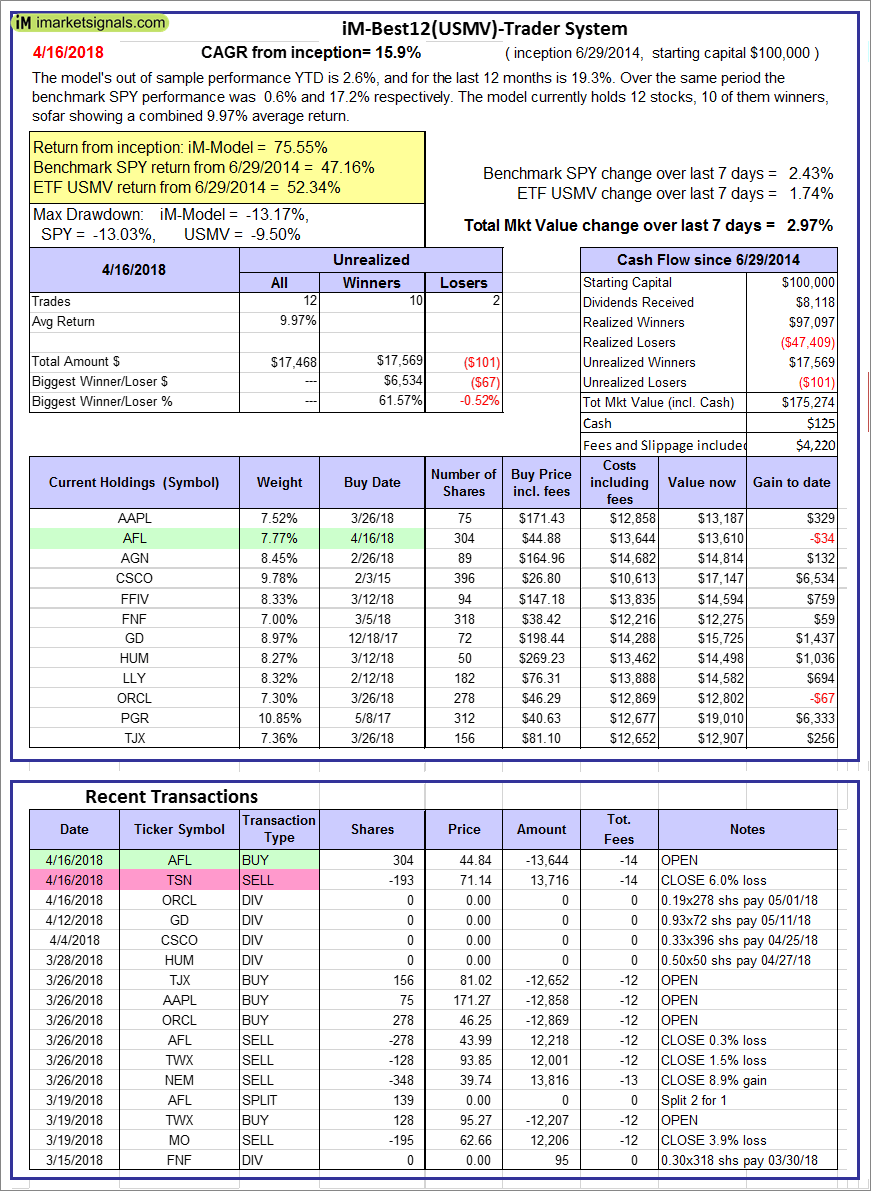 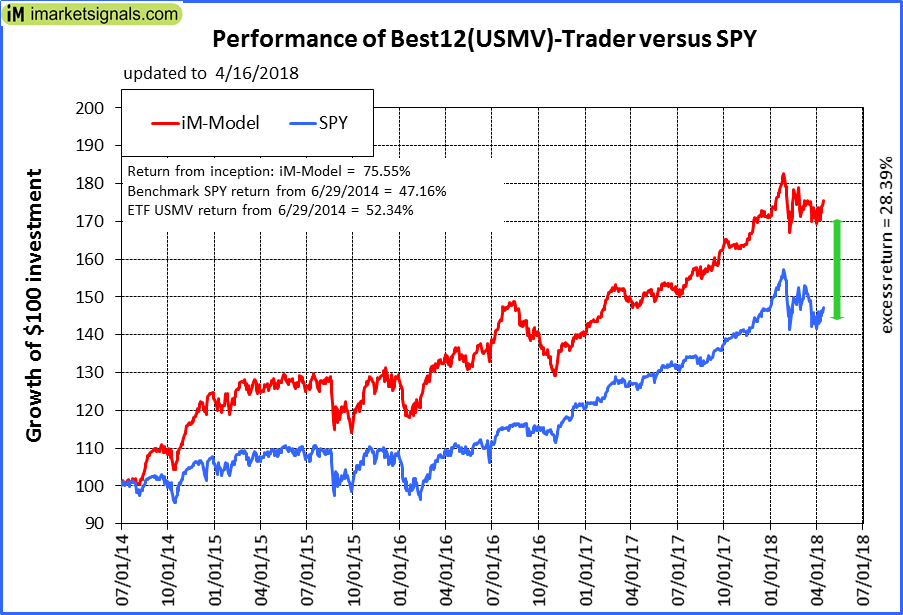 |
iM-Best12(USMV)-Trader: The model’s out of sample performance YTD is 2.6%, and for the last 12 months is 19.3%. Over the same period the benchmark SPY performance was 0.6% and 17.2% respectively. Since inception, on 6/30/2014, the model gained 75.55% while the benchmark SPY gained 47.16% and the ETF USMV gained 52.34% over the same period. Over the previous week the market value of iM-Best12(USMV)-Trader gained 2.97% at a time when SPY gained 2.43%. A starting capital of $100,000 at inception on 6/30/2014 would have grown to $175,274 which includes $125 cash and excludes $4,220 spent on fees and slippage. |
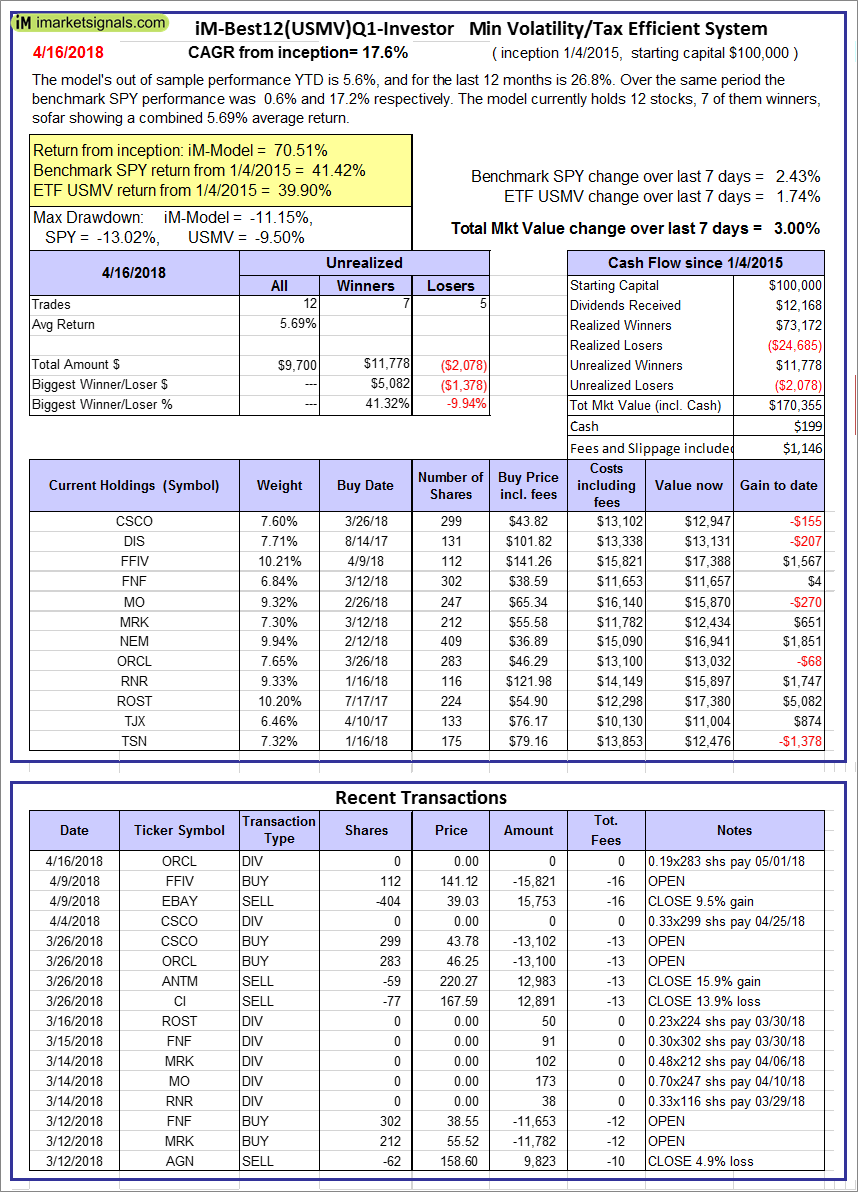 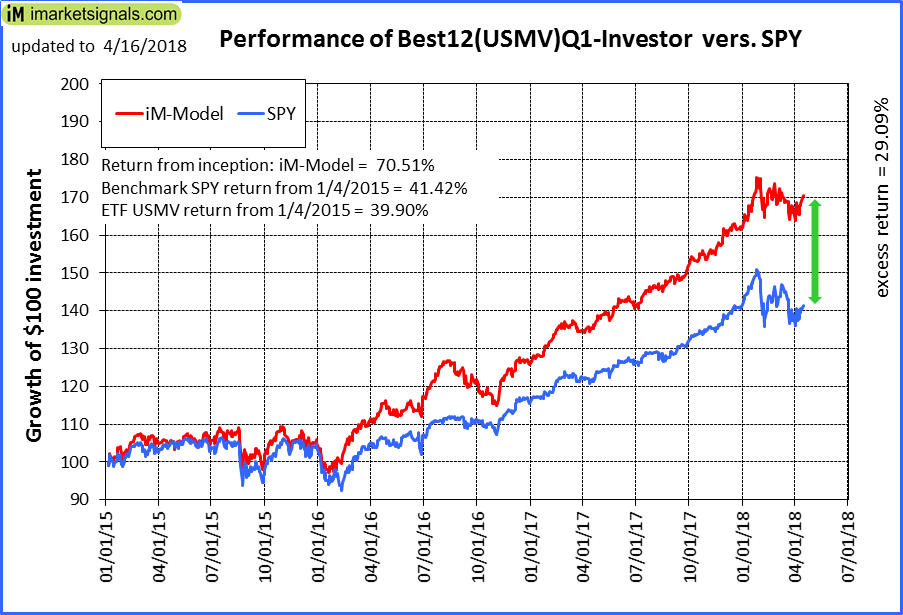 |
iM-Best12(USMV)Q1-Investor: The model’s out of sample performance YTD is 5.6%, and for the last 12 months is 26.8%. Over the same period the benchmark SPY performance was 0.6% and 17.2% respectively. Since inception, on 1/5/2015, the model gained 70.51% while the benchmark SPY gained 41.42% and the ETF USMV gained 39.90% over the same period. Over the previous week the market value of iM-Best12(USMV)Q1 gained 3.00% at a time when SPY gained 2.43%. A starting capital of $100,000 at inception on 1/5/2015 would have grown to $170,355 which includes $199 cash and excludes $1,146 spent on fees and slippage. |
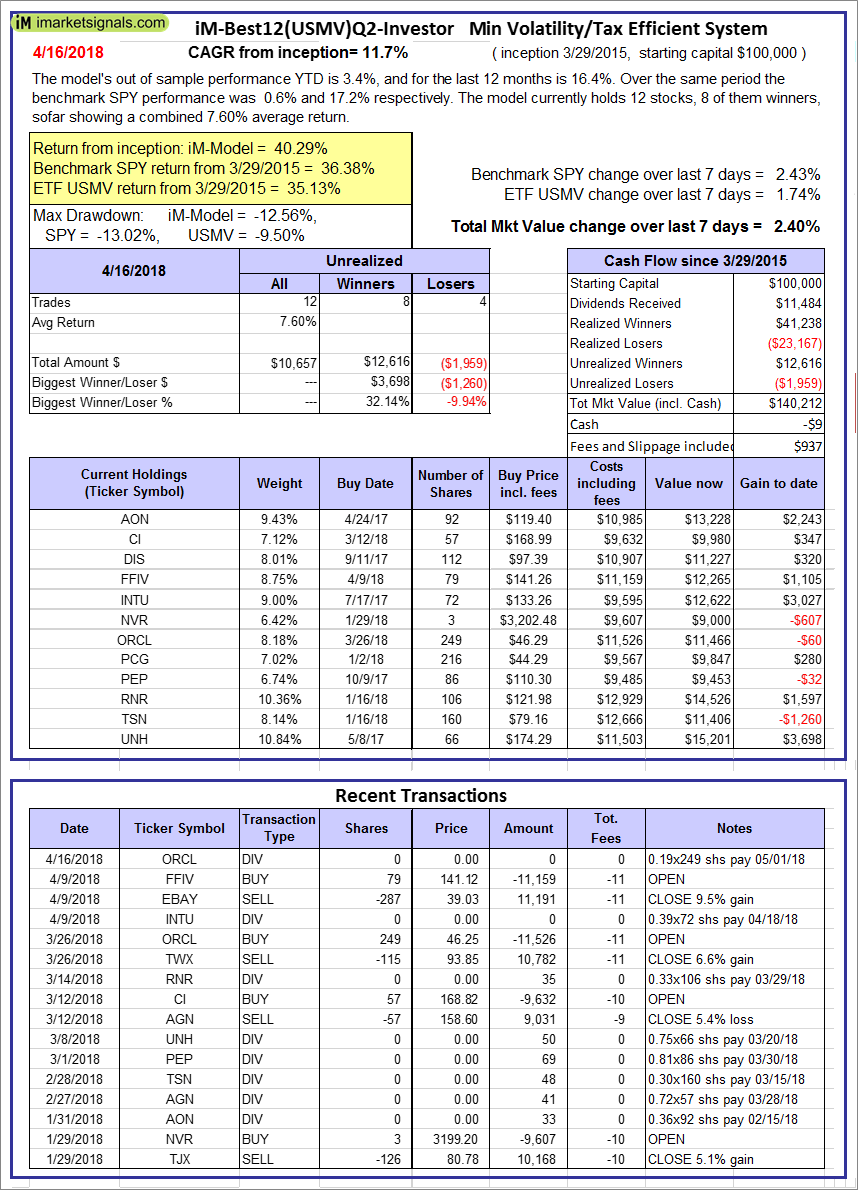  |
iM-Best12(USMV)Q2-Investor: The model’s out of sample performance YTD is 3.4%, and for the last 12 months is 16.4%. Over the same period the benchmark SPY performance was 0.6% and 17.2% respectively. Since inception, on 3/30/2015, the model gained 40.29% while the benchmark SPY gained 36.38% and the ETF USMV gained 35.13% over the same period. Over the previous week the market value of iM-Best12(USMV)Q2 gained 2.40% at a time when SPY gained 2.43%. A starting capital of $100,000 at inception on 3/30/2015 would have grown to $140,212 which includes -$9 cash and excludes $937 spent on fees and slippage. |
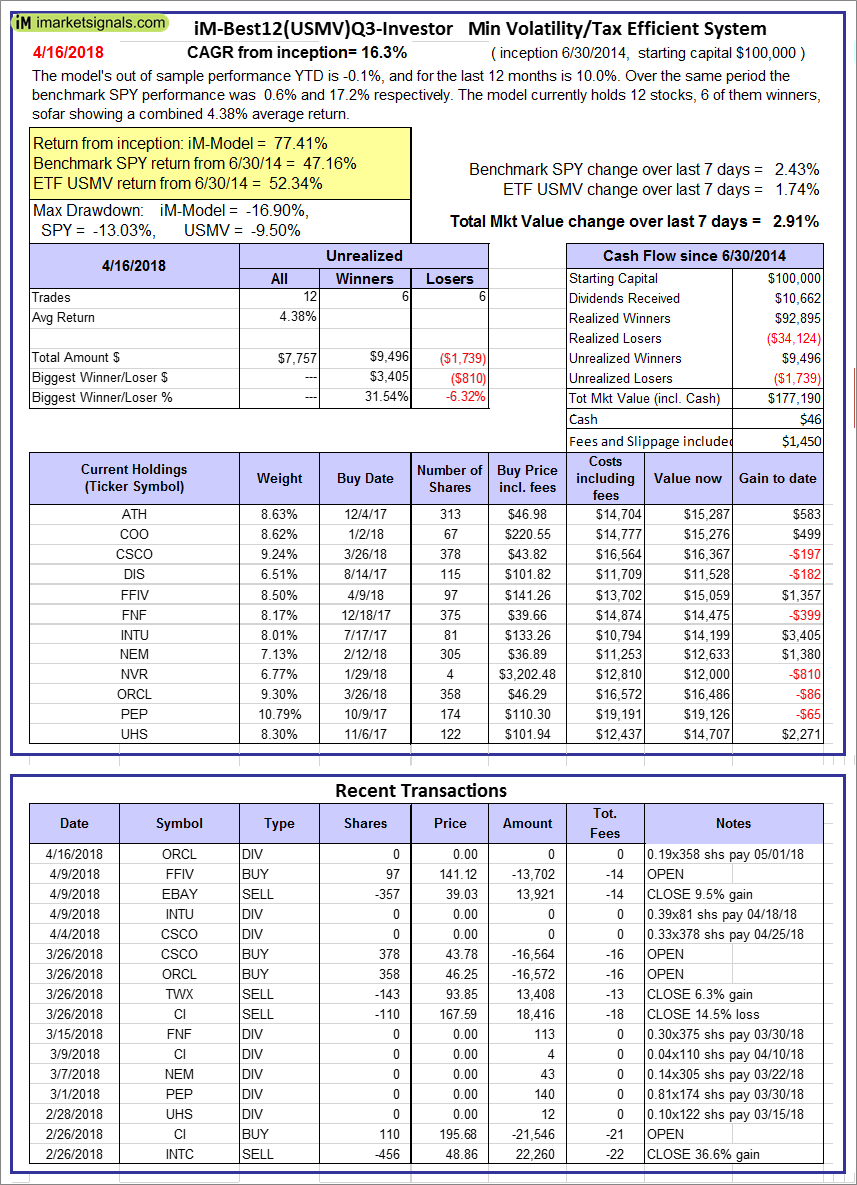 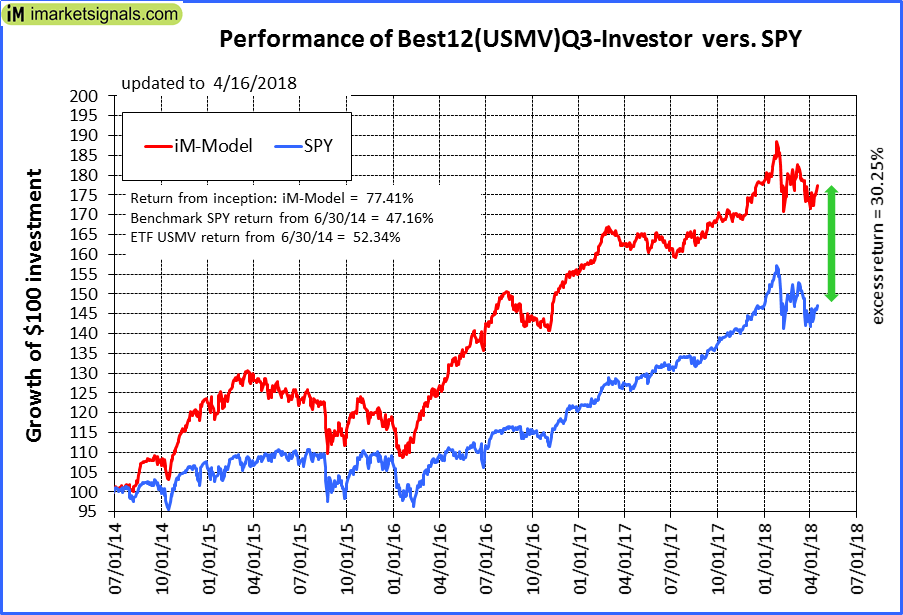 |
iM-Best12(USMV)Q3-Investor: The model’s out of sample performance YTD is -0.1%, and for the last 12 months is 10.0%. Over the same period the benchmark SPY performance was 0.6% and 17.2% respectively. Since inception, on 7/1/2014, the model gained 77.41% while the benchmark SPY gained 47.16% and the ETF USMV gained 52.34% over the same period. Over the previous week the market value of iM-Best12(USMV)Q3 gained 2.91% at a time when SPY gained 2.43%. A starting capital of $100,000 at inception on 7/1/2014 would have grown to $177,190 which includes $46 cash and excludes $1,450 spent on fees and slippage. |
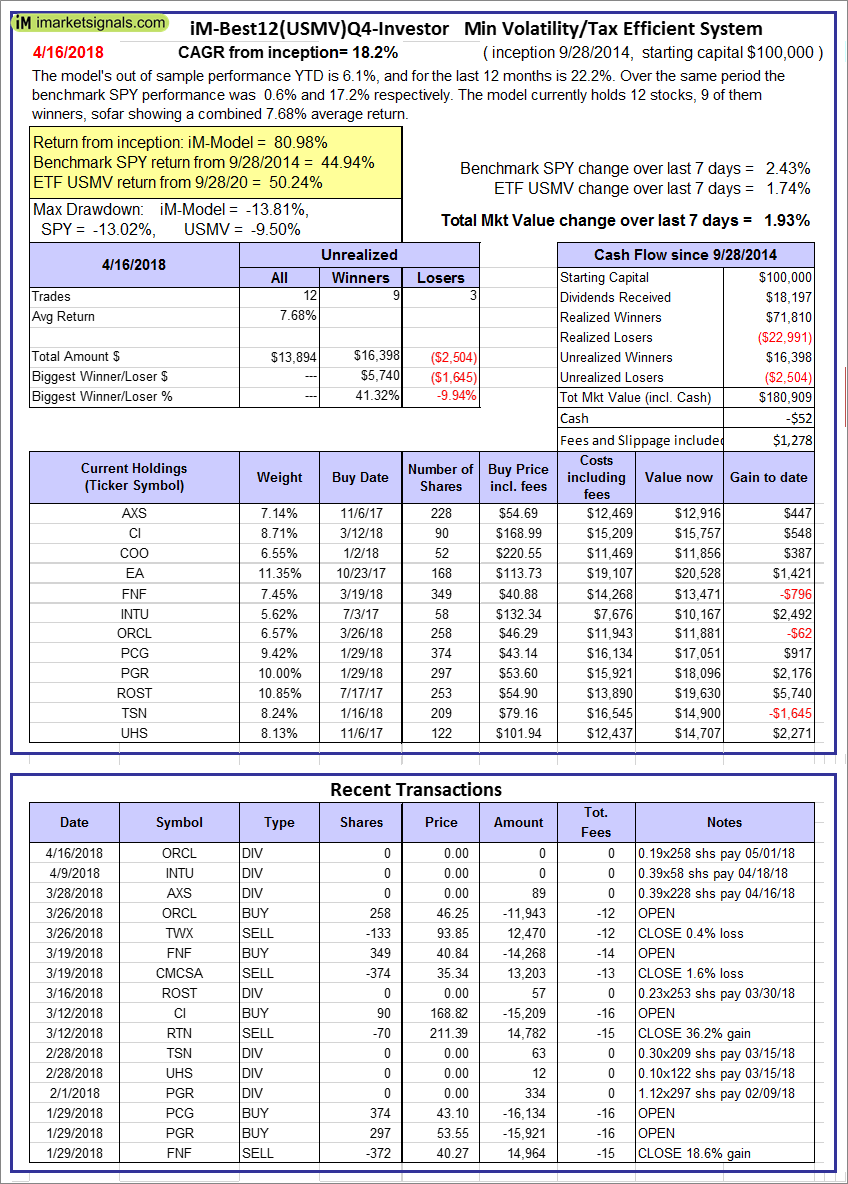 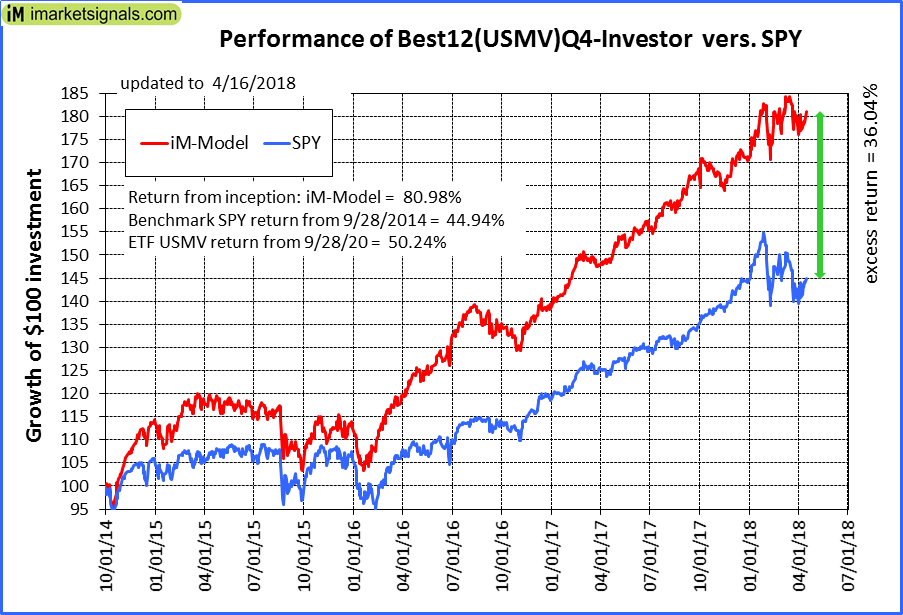 |
iM-Best12(USMV)Q4-Investor: Since inception, on 9/29/2014, the model gained 80.98% while the benchmark SPY gained 44.94% and the ETF USMV gained 50.24% over the same period. Over the previous week the market value of iM-Best12(USMV)Q4 gained 1.93% at a time when SPY gained 2.43%. A starting capital of $100,000 at inception on 9/29/2014 would have grown to $180,909 which includes -$52 cash and excludes $1,278 spent on fees and slippage. |
 |
Average Performance of iM-Best12(USMV)Q1+Q2+Q3+Q4-Investor resulted in an excess return of 43.18% over SPY. (see iM-USMV Investor Portfolio) |
 |
iM-Best(Short): The model’s out of sample performance YTD is -1.5%, and for the last 12 months is -7.0%. Over the same period the benchmark SPY performance was 0.6% and 17.2% respectively. Over the previous week the market value of iM-Best(Short) gained -4.03% at a time when SPY gained 2.43%. Over the period 1/2/2009 to 4/16/2018 the starting capital of $100,000 would have grown to $89,847 which includes $107,510 cash and excludes $23,997 spent on fees and slippage. |
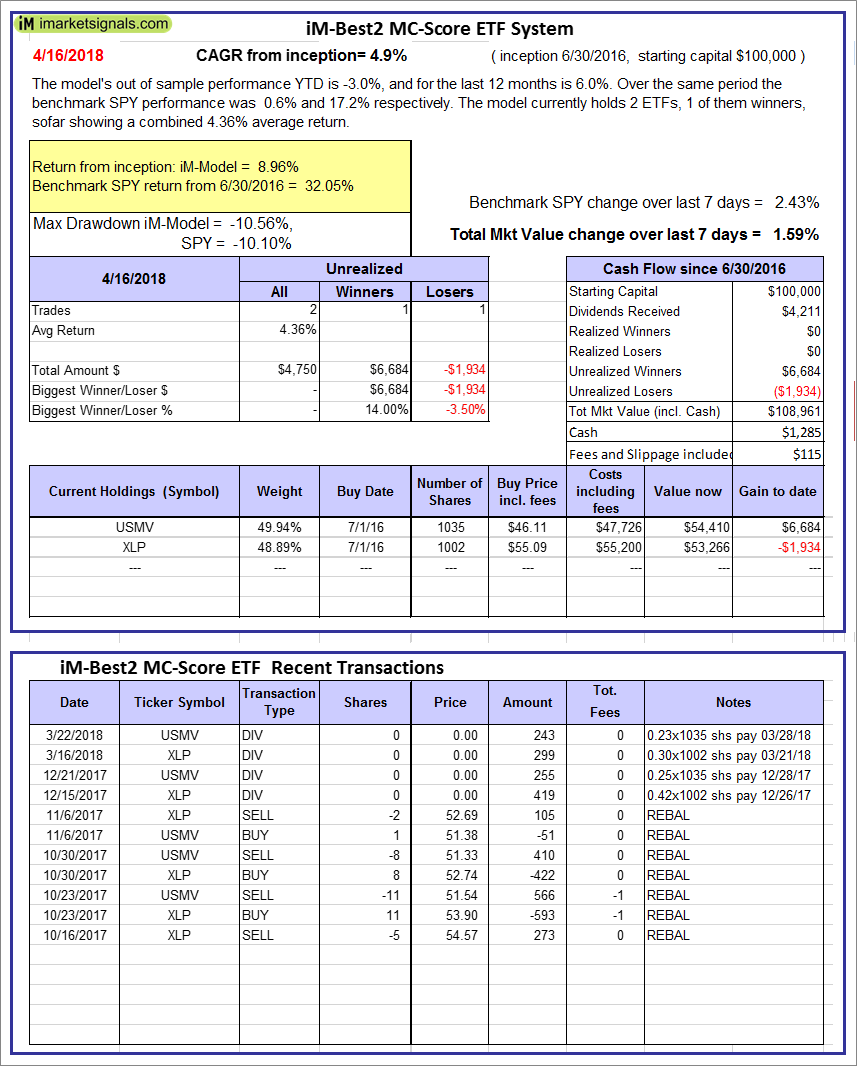 |
iM-Best2 MC-Score ETF System: The model’s out of sample performance YTD is -3.0%, and for the last 12 months is 6.0%. Over the same period the benchmark SPY performance was 0.6% and 17.2% respectively. Over the previous week the market value of the iM-Best2 MC-Score ETF System gained 1.59% at a time when SPY gained 2.43%. A starting capital of $100,000 at inception on 6/30/2016 would have grown to $108,961 which includes $1,285 cash and excludes $115 spent on fees and slippage. |
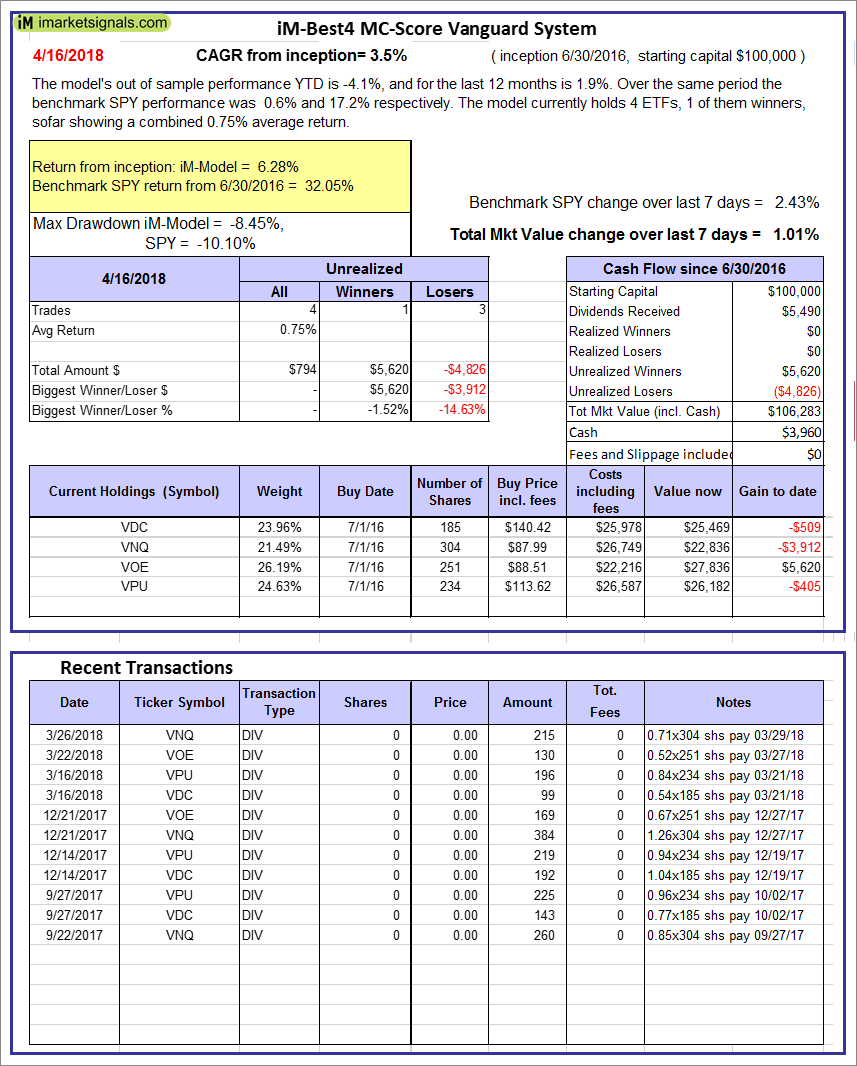 |
iM-Best4 MC-Score Vanguard System: The model’s out of sample performance YTD is -4.1%, and for the last 12 months is 1.9%. Over the same period the benchmark SPY performance was 0.6% and 17.2% respectively. Over the previous week the market value of the iM-Best4 MC-Score Vanguard System gained 1.01% at a time when SPY gained 2.43%. A starting capital of $100,000 at inception on 6/30/2016 would have grown to $106,283 which includes $3,960 cash and excludes $00 spent on fees and slippage. |
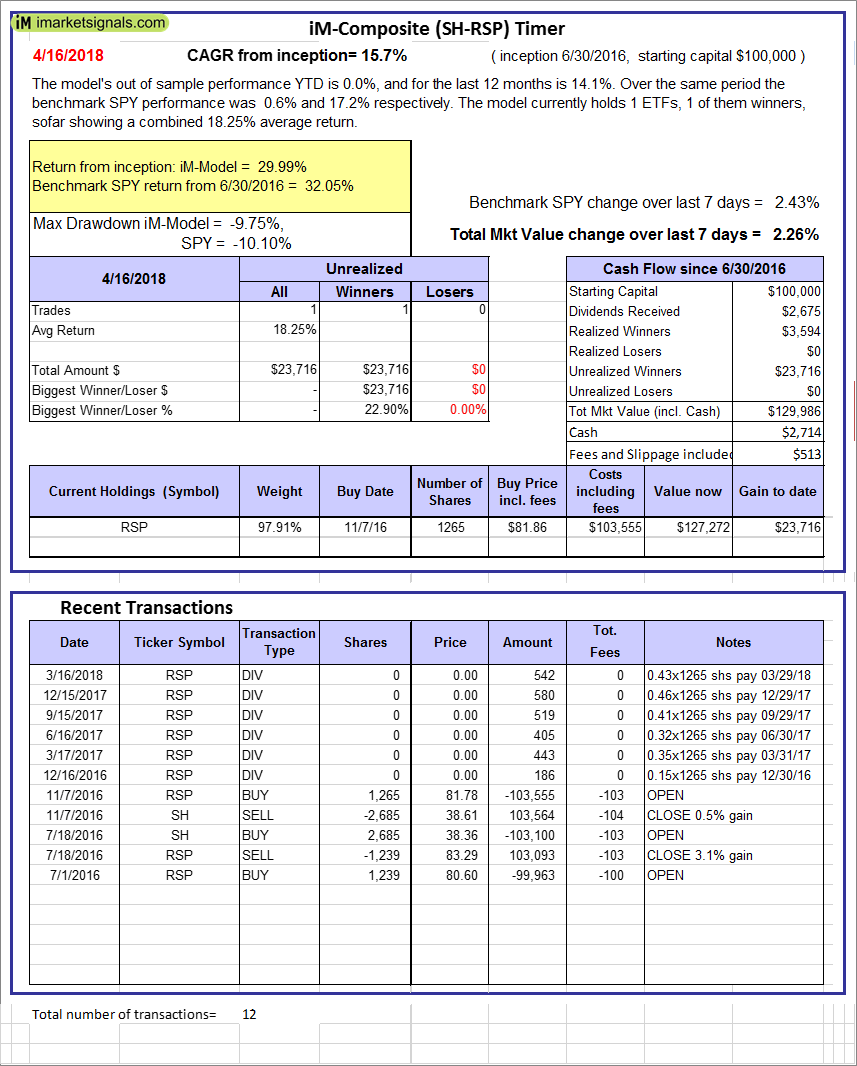 |
iM-Composite (SH-RSP) Timer: The model’s out of sample performance YTD is 0.0%, and for the last 12 months is 14.1%. Over the same period the benchmark SPY performance was 0.6% and 17.2% respectively. Over the previous week the market value of the iM-Composite (SH-RSP) Timer gained 2.26% at a time when SPY gained 2.43%. A starting capital of $100,000 at inception on 6/30/2016 would have grown to $129,986 which includes $2,714 cash and excludes $513 spent on fees and slippage. |
 |
iM-Composite (SPY-IEF) Timer: The model’s out of sample performance YTD is 0.6%, and for the last 12 months is 17.6%. Over the same period the benchmark SPY performance was 0.6% and 17.2% respectively. Over the previous week the market value of the iM-Composite (SPY-IEF) Timer gained 2.39% at a time when SPY gained 2.43%. A starting capital of $100,000 at inception on 6/30/2016 would have grown to $133,561 which includes $1,500 cash and excludes $1,390 spent on fees and slippage. |
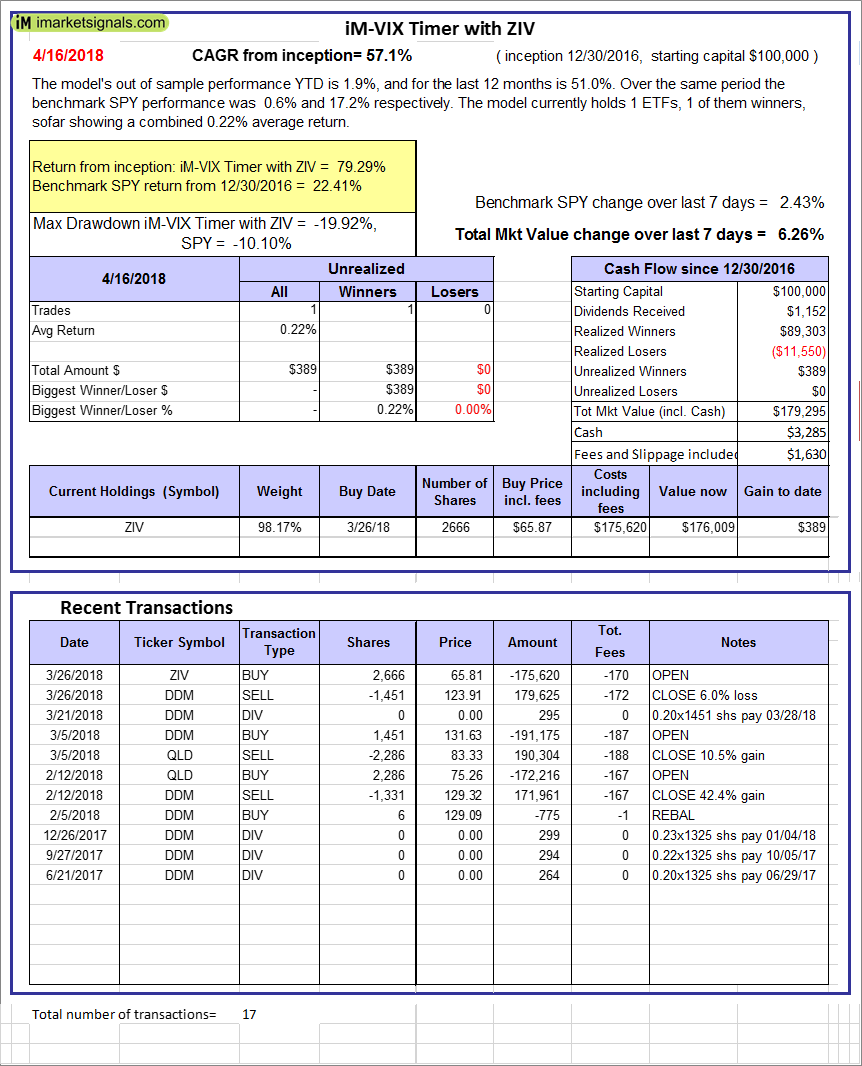 |
iM-VIX Timer with ZIV: The model’s out of sample performance YTD is 1.9%, and for the last 12 months is 51.0%. Over the same period the benchmark SPY performance was 0.6% and 17.2% respectively. Over the previous week the market value of the iM-VIX Timer with ZIV gained 6.26% at a time when SPY gained 2.43%. A starting capital of $100,000 at inception on 6/30/2016 would have grown to $179,295 which includes $3,285 cash and excludes $1,630 spent on fees and slippage. |
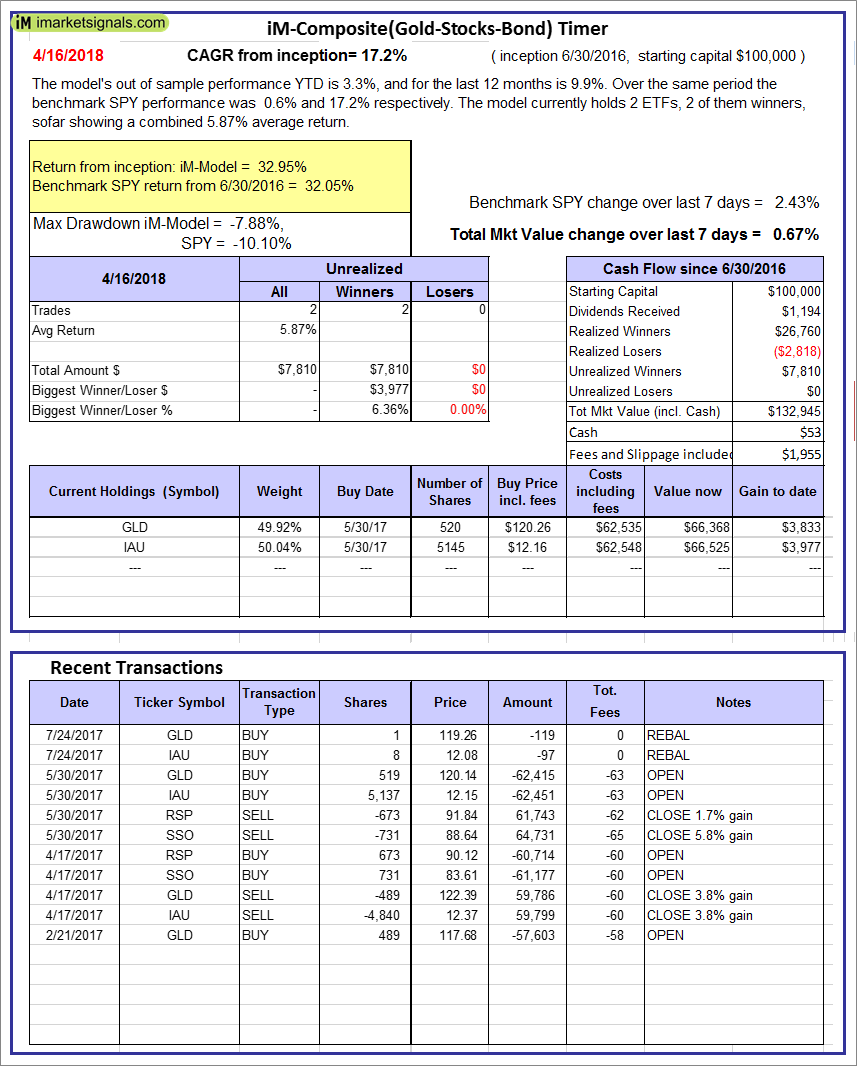 |
iM-Composite(Gold-Stocks-Bond) Timer: The model’s out of sample performance YTD is 3.3%, and for the last 12 months is 9.9%. Over the same period the benchmark SPY performance was 0.6% and 17.2% respectively. Over the previous week the market value of the iM-Composite(Gold-Stocks-Bond) Timer gained 0.67% at a time when SPY gained 2.43%. A starting capital of $100,000 at inception on 6/30/2016 would have grown to $132,945 which includes $53 cash and excludes $1,955 spent on fees and slippage. |
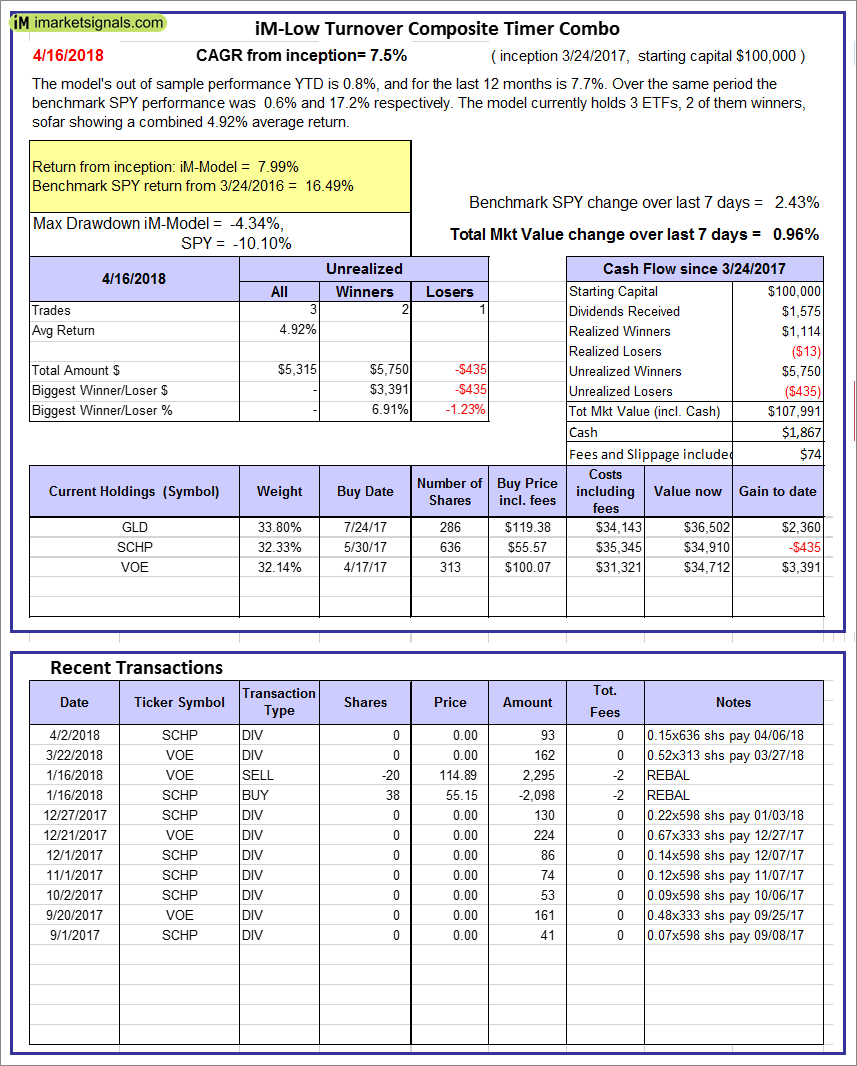 |
iM-Low Turnover Composite Timer Combo: The model’s out of sample performance YTD is 0.8%, and for the last 12 months is 7.7%. Over the same period the benchmark SPY performance was 0.6% and 17.2% respectively. Over the previous week the market value of the iM-Low Turnover Composite Timer Combo gained 0.96% at a time when SPY gained 2.43%. A starting capital of $100,000 at inception on 3/24/27 would have grown to $107,991 which includes $1,867 cash and excludes $74 spent on fees and slippage. |
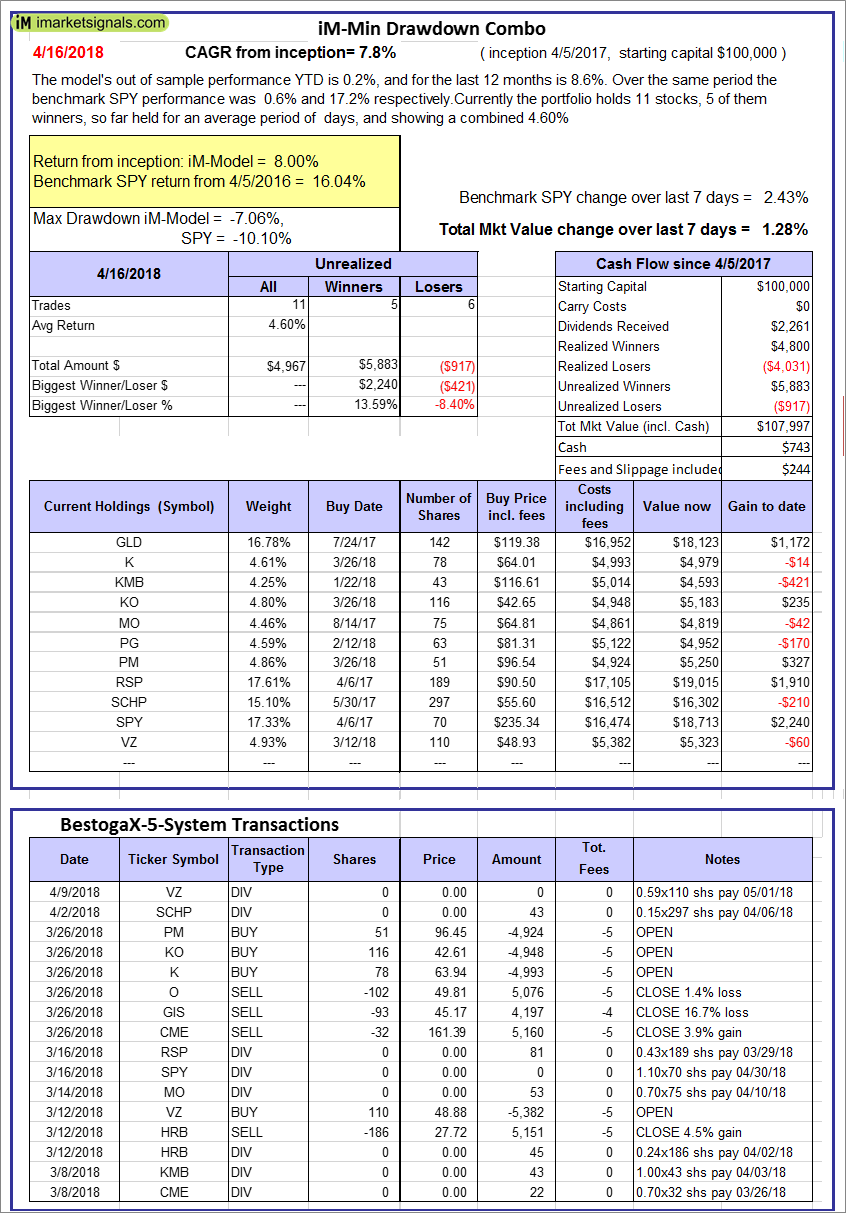 |
iM-Min Drawdown Combo: The model’s out of sample performance YTD is 0.2%, and for the last 12 months is 8.6%. Over the same period the benchmark SPY performance was 0.6% and 17.2% respectively. Over the previous week the market value of the iM-Min Drawdown Combo gained 1.28% at a time when SPY gained 2.43%. A starting capital of $100,000 at inception on 4/5/2017 would have grown to $107,997 which includes $743 cash and excludes $244 spent on fees and slippage. |
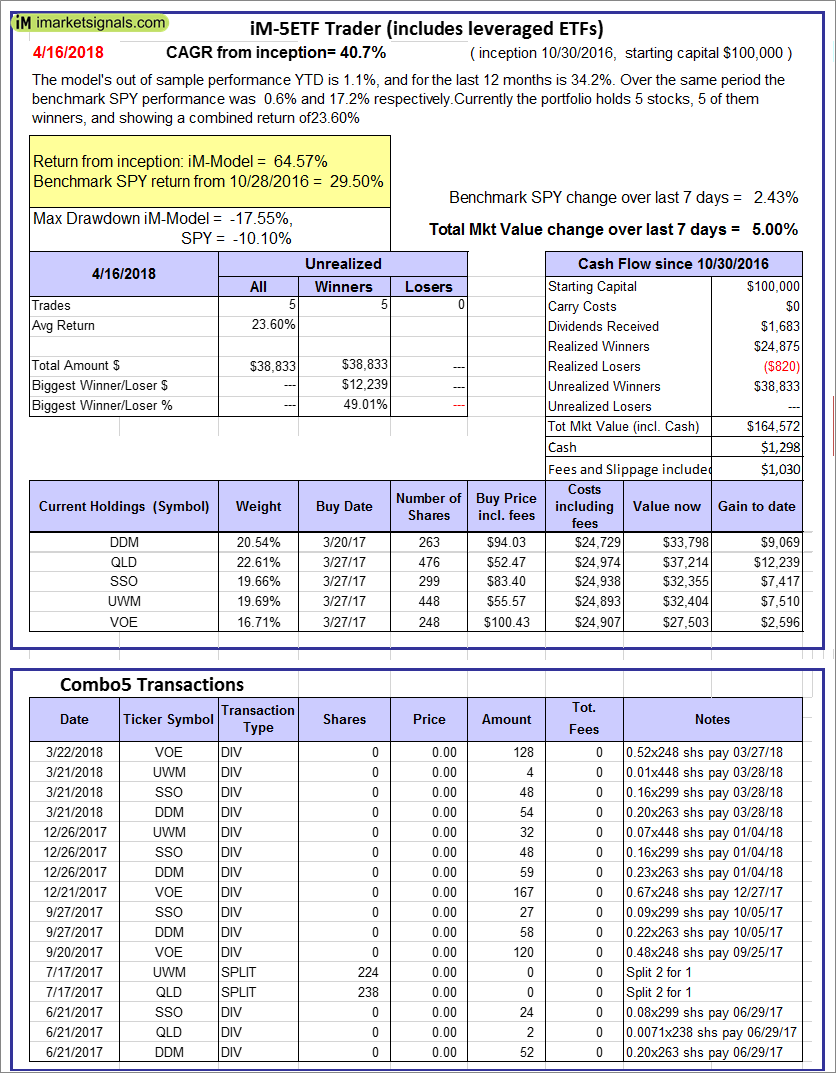 |
iM-5ETF Trader (includes leveraged ETFs): The model’s out of sample performance YTD is 1.1%, and for the last 12 months is 34.2%. Over the same period the benchmark SPY performance was 0.6% and 17.2% respectively. Over the previous week the market value of the iM-5ETF Trader (includes leveraged ETFs) gained 5.00% at a time when SPY gained 2.43%. A starting capital of $100,000 at inception on 10/30/2016 would have grown to $164,572 which includes $1,298 cash and excludes $1,030 spent on fees and slippage. |
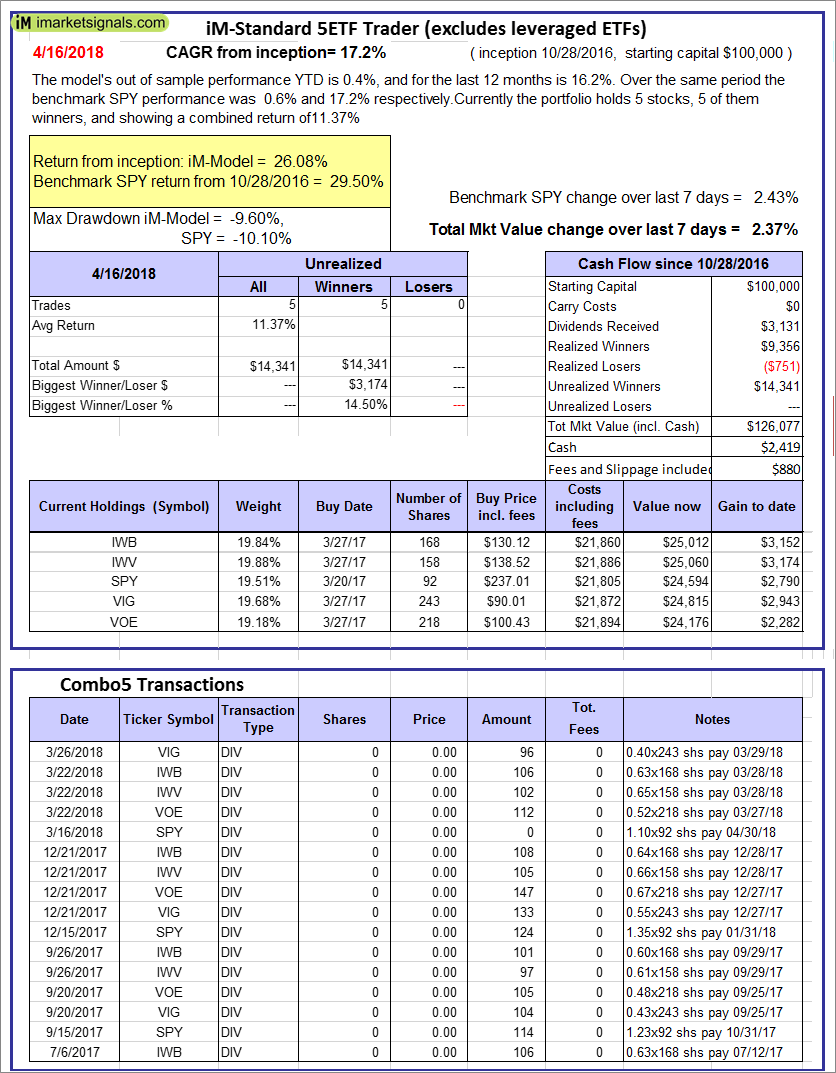 |
iM-Standard 5ETF Trader (excludes leveraged ETFs): The model’s out of sample performance YTD is 0.4%, and for the last 12 months is 16.2%. Over the same period the benchmark SPY performance was 0.6% and 17.2% respectively. Over the previous week the market value of the iM-Standard 5ETF Trader (excludes leveraged ETFs) gained 2.37% at a time when SPY gained 2.43%. A starting capital of $100,000 at inception on 10/30/2016 would have grown to $126,077 which includes $2,419 cash and excludes $880 spent on fees and slippage. |
iM-Best Reports – 4/16/2018
Posted in pmp SPY-SH
Leave a Reply
You must be logged in to post a comment.