  |
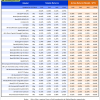
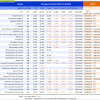
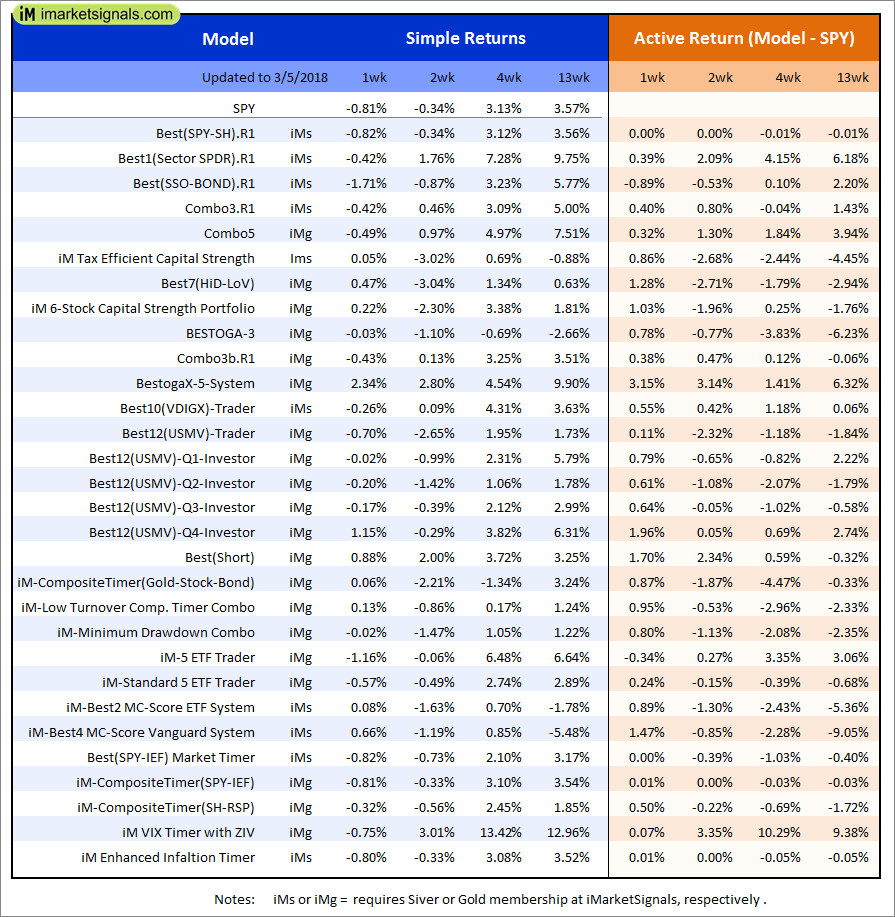
Out of sample performance summary of our models for the past 1, 2, 4 and 13 week periods. The active active return indicates how the models over- or underperformed the benchmark ETF SPY. Also the YTD, and the 1-, 3-, 5- and 10-year annualized returns are shown in the second table |
|
|
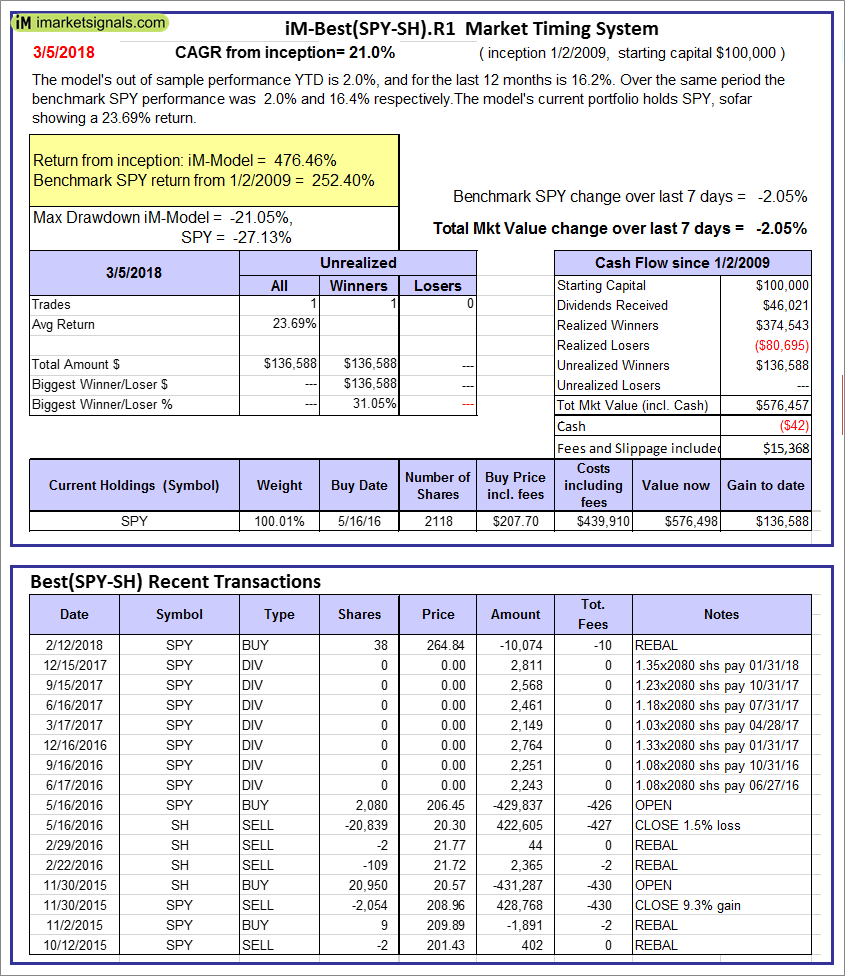
iM-Best(SPY-SH).R1: The model’s out of sample performance YTD is 2.0%, and for the last 12 months is 16.2%. Over the same period the benchmark SPY performance was 2.0% and 16.4% respectively. Over the previous week the market value of Best(SPY-SH) gained -2.05% at a time when SPY gained -2.05%. A starting capital of $100,000 at inception on 1/2/2009 would have grown to $576,457 which includes -$42 cash and excludes $15,368 spent on fees and slippage. |
|
|
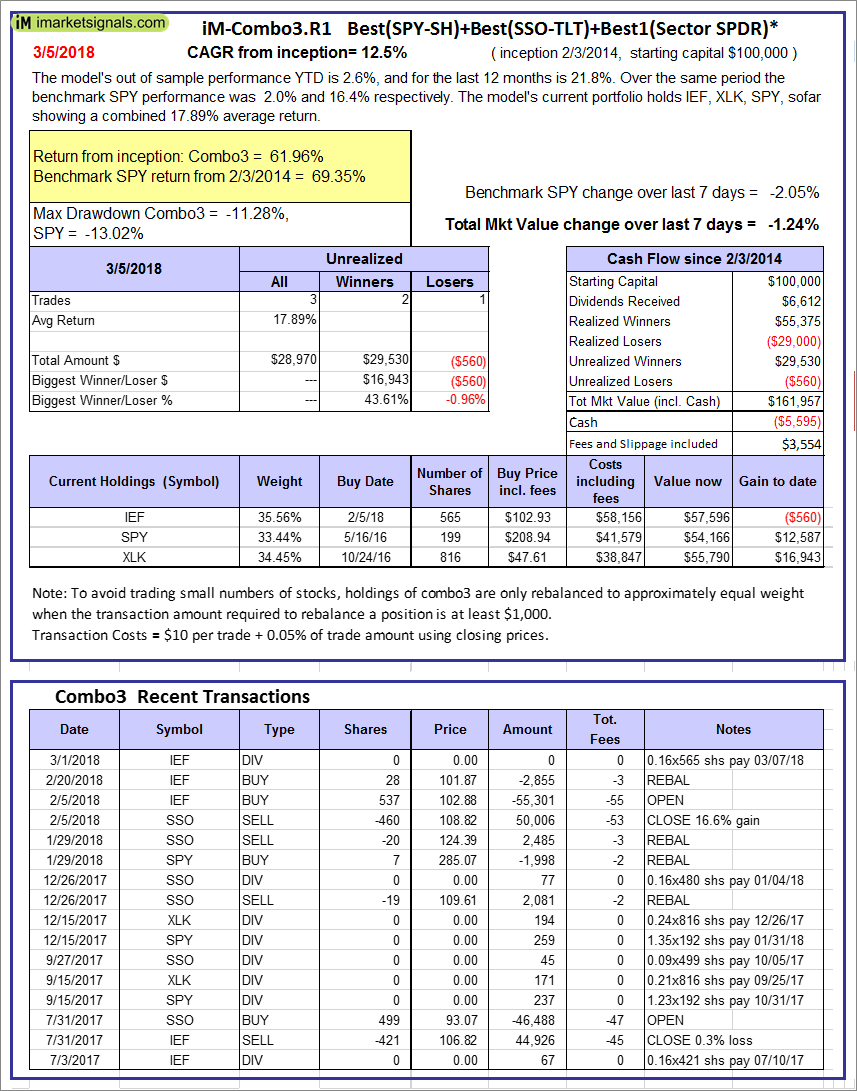
iM-Combo3.R1: The model’s out of sample performance YTD is 2.6%, and for the last 12 months is 21.8%. Over the same period the benchmark SPY performance was 2.0% and 16.4% respectively. Over the previous week the market value of iM-Combo3.R1 gained -1.24% at a time when SPY gained -2.05%. A starting capital of $100,000 at inception on 2/3/2014 would have grown to $161,957 which includes -$5,595 cash and excludes $3,554 spent on fees and slippage. |
|
|
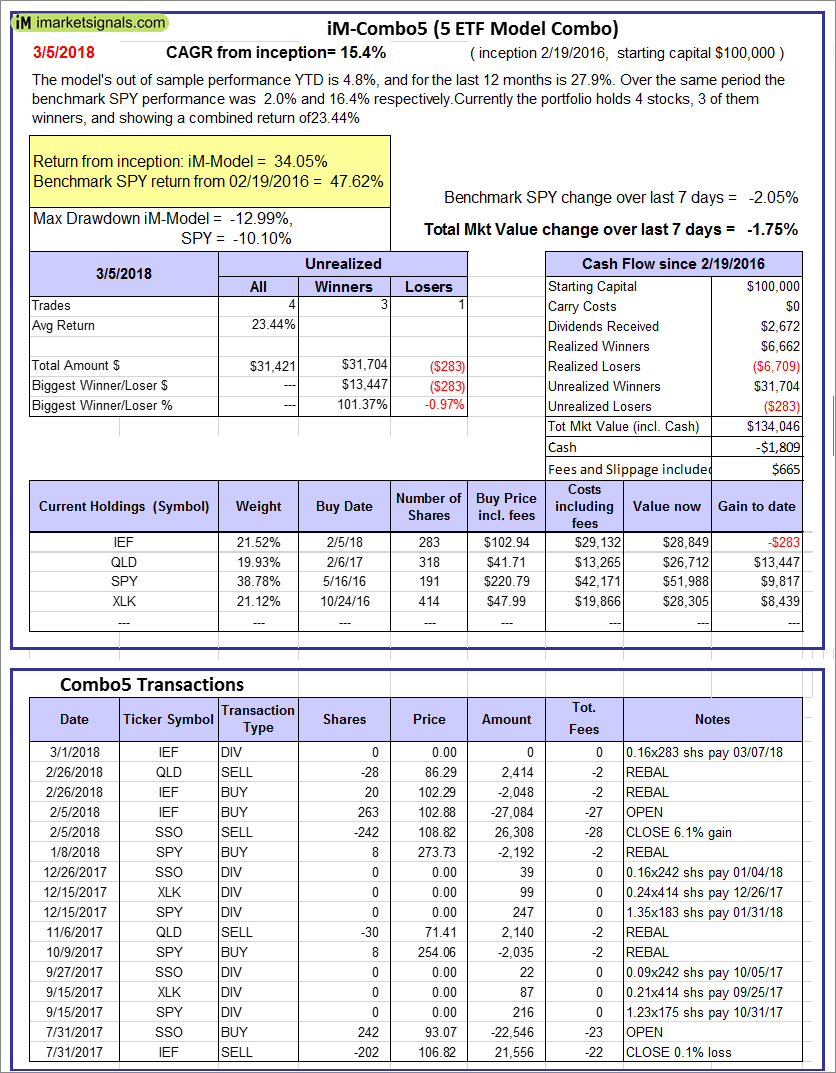
iM-Combo5: The model’s out of sample performance YTD is 4.8%, and for the last 12 months is 27.9%. Over the same period the benchmark SPY performance was 2.0% and 16.4% respectively. Over the previous week the market value of iM-Combo5 gained -1.75% at a time when SPY gained -2.05%. A starting capital of $100,000 at inception on 2/22/2016 would have grown to $134,046 which includes -$1,809 cash and excludes $665 spent on fees and slippage. |
|
|
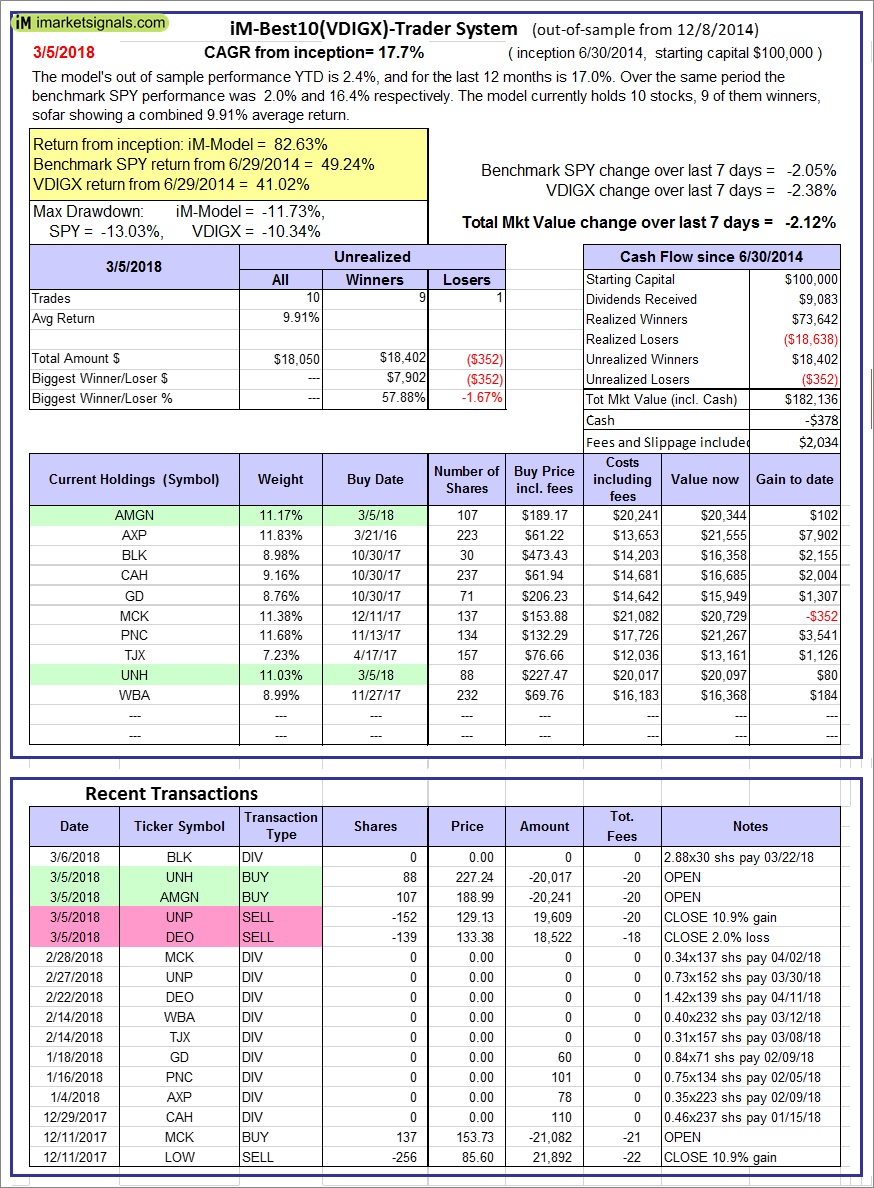
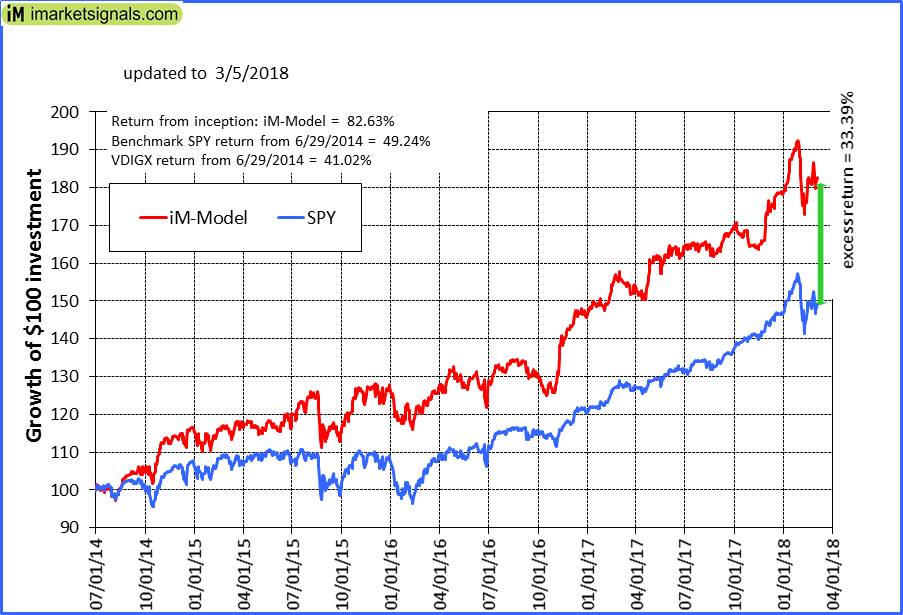
iM-Best10(VDIGX)-Trader: The model’s out of sample performance YTD is 2.4%, and for the last 12 months is 17.0%. Over the same period the benchmark SPY performance was 2.0% and 16.4% respectively. Since inception, on 7/1/2014, the model gained 82.63% while the benchmark SPY gained 49.24% and VDIGX gained 41.02% over the same period. Over the previous week the market value of iM-Best10(VDIGX) gained -2.12% at a time when SPY gained -2.05%. A starting capital of $100,000 at inception on 7/1/2014 would have grown to $182,136 which includes -$378 cash and excludes $2,034 spent on fees and slippage. |
|
|
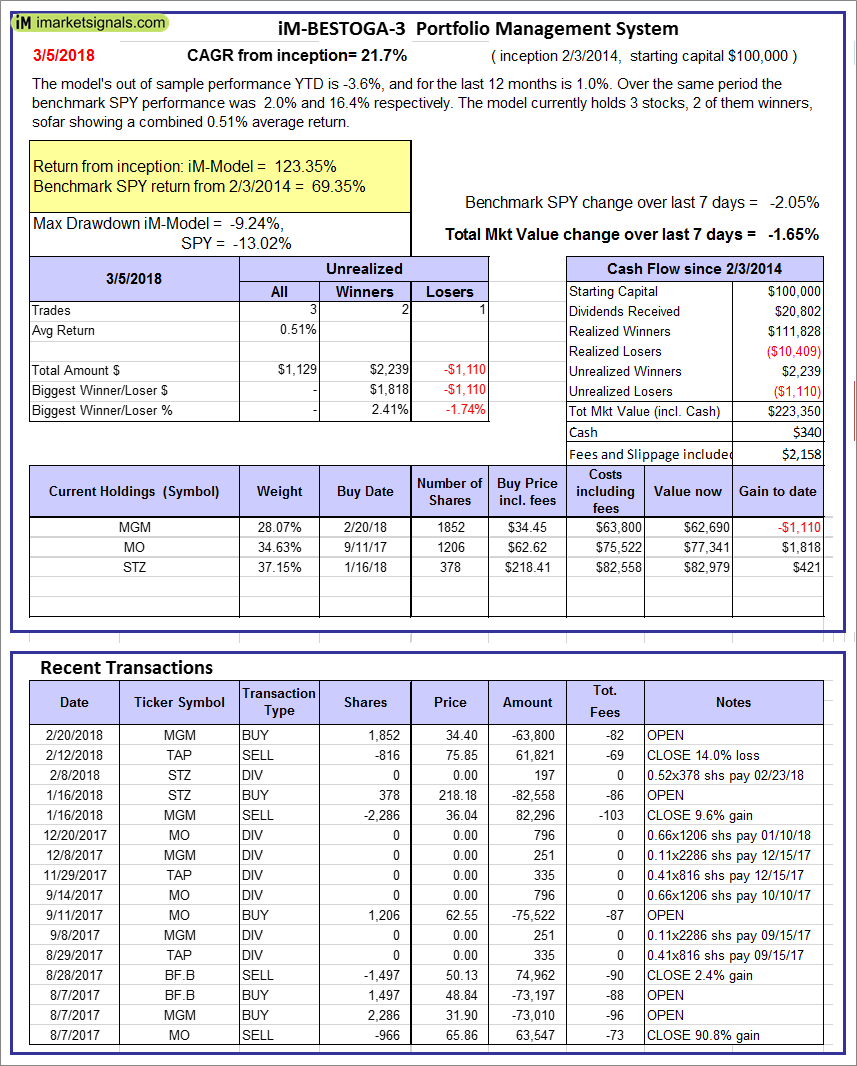
iM-BESTOGA-3: The model’s out of sample performance YTD is -3.6%, and for the last 12 months is 1.0%. Over the same period the benchmark SPY performance was 2.0% and 16.4% respectively. Over the previous week the market value of iM-BESTOGA-3 gained -1.65% at a time when SPY gained -2.05%. A starting capital of $100,000 at inception on 2/3/2014 would have grown to $223,350 which includes $340 cash and excludes $2,158 spent on fees and slippage. |
|
|
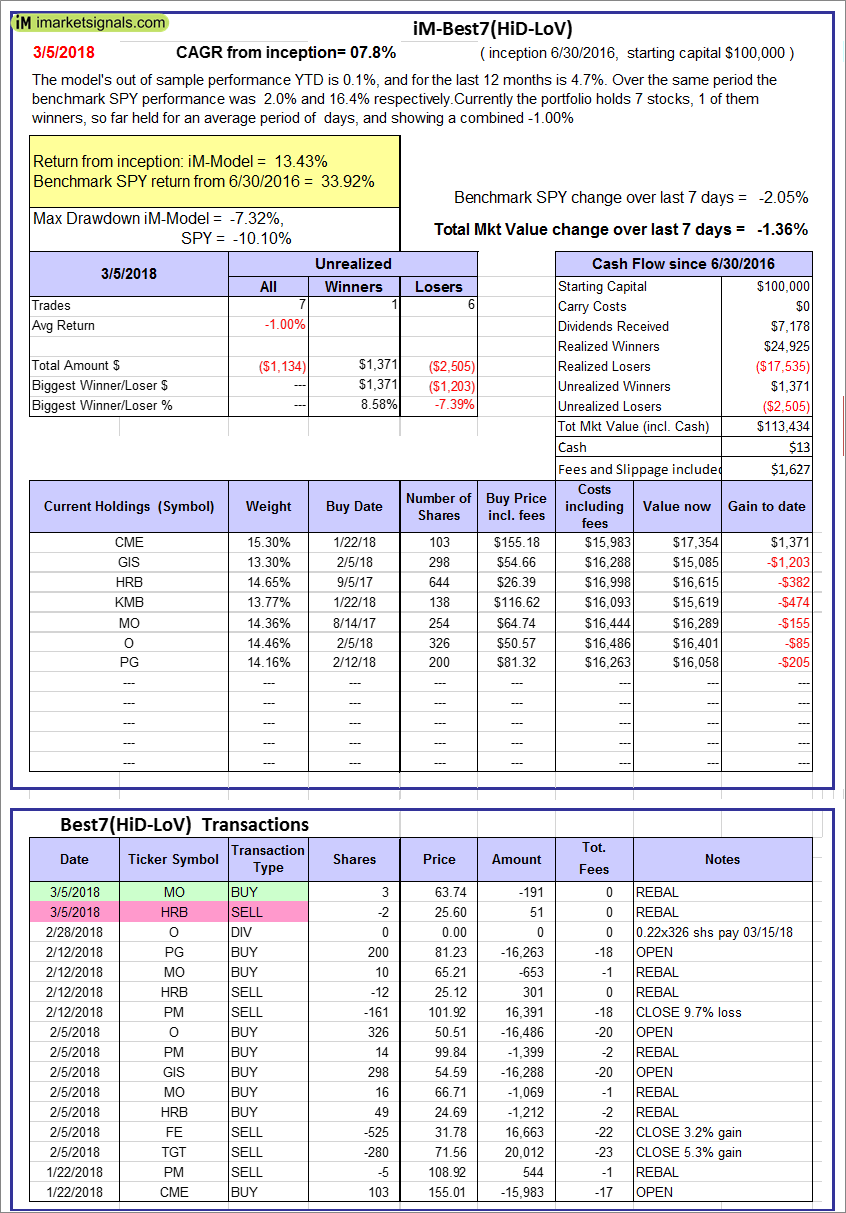
iM-Best7(HiD-LoV): The model’s out of sample performance YTD is 0.1%, and for the last 12 months is 4.7%. Over the same period the benchmark SPY performance was 2.0% and 16.4% respectively. Over the previous week the market value of iM-BESTOGA-3 gained -1.36% at a time when SPY gained -2.05%. A starting capital of $100,000 at inception on 6/30/2016 would have grown to $113,434 which includes $13 cash and excludes $1,627 spent on fees and slippage. |
|
|
iM 6-Stock Capital Strength Portfolio: The model’s out of sample performance YTD is 3.1%, and for the last 12 months is 30.5%. Over the same period the benchmark SPY performance was 4.1% and 19.7% respectively. Over the previous week the market value of the iM 6-Stock Capital Strength Portfolio gained 1.47% at a time when SPY gained 2.39%. A starting capital of $100,000 at inception on 10/28/2016 would have grown to $156,128 which includes $785 cash and excludes $630 spent on fees and slippage. |
|
|
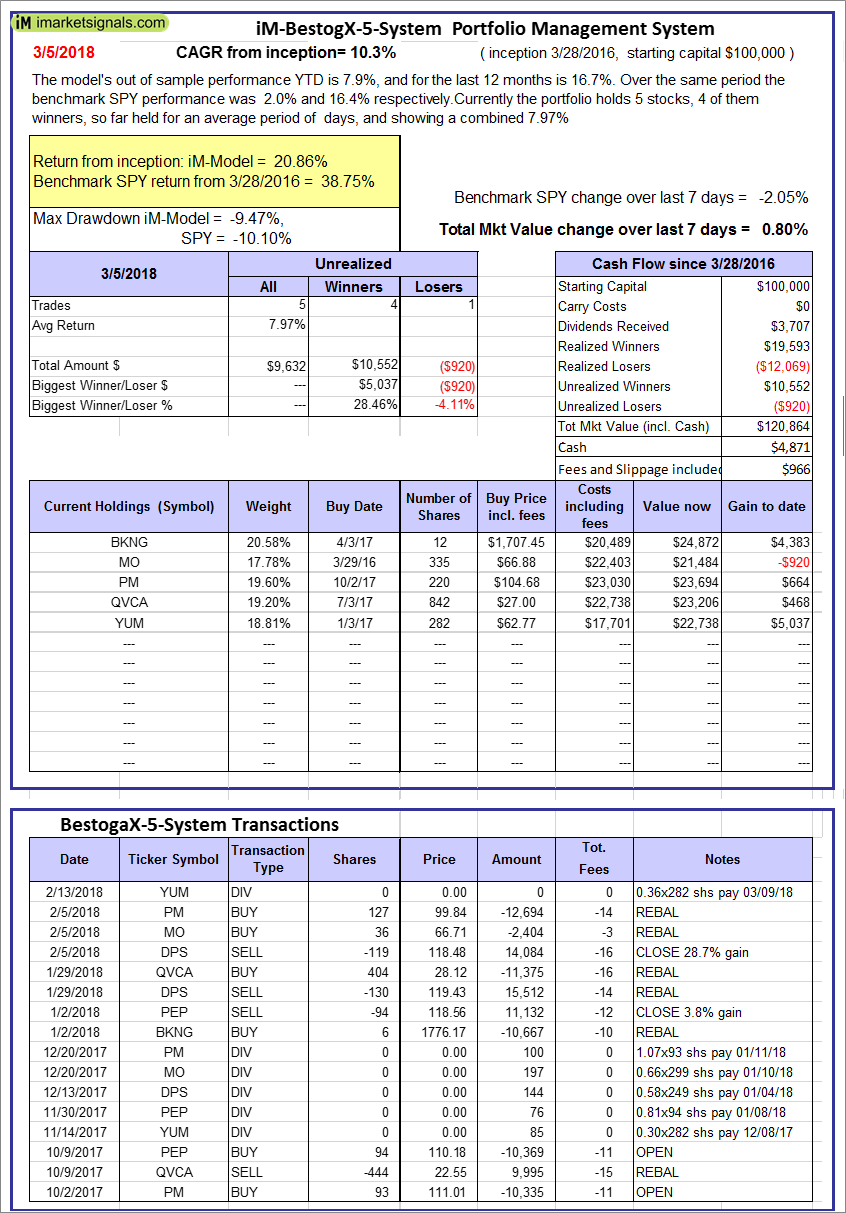
iM-BestogaX5-System: The model’s out of sample performance YTD is 7.9%, and for the last 12 months is 16.7%. Over the same period the benchmark SPY performance was 2.0% and 16.4% respectively. Over the previous week the market value of iM-BestogaX5-System gained 0.80% at a time when SPY gained -2.05%. A starting capital of $100,000 at inception on 3/28/2016 would have grown to $120,864 which includes $4,871 cash and excludes $966 spent on fees and slippage. |
|
|
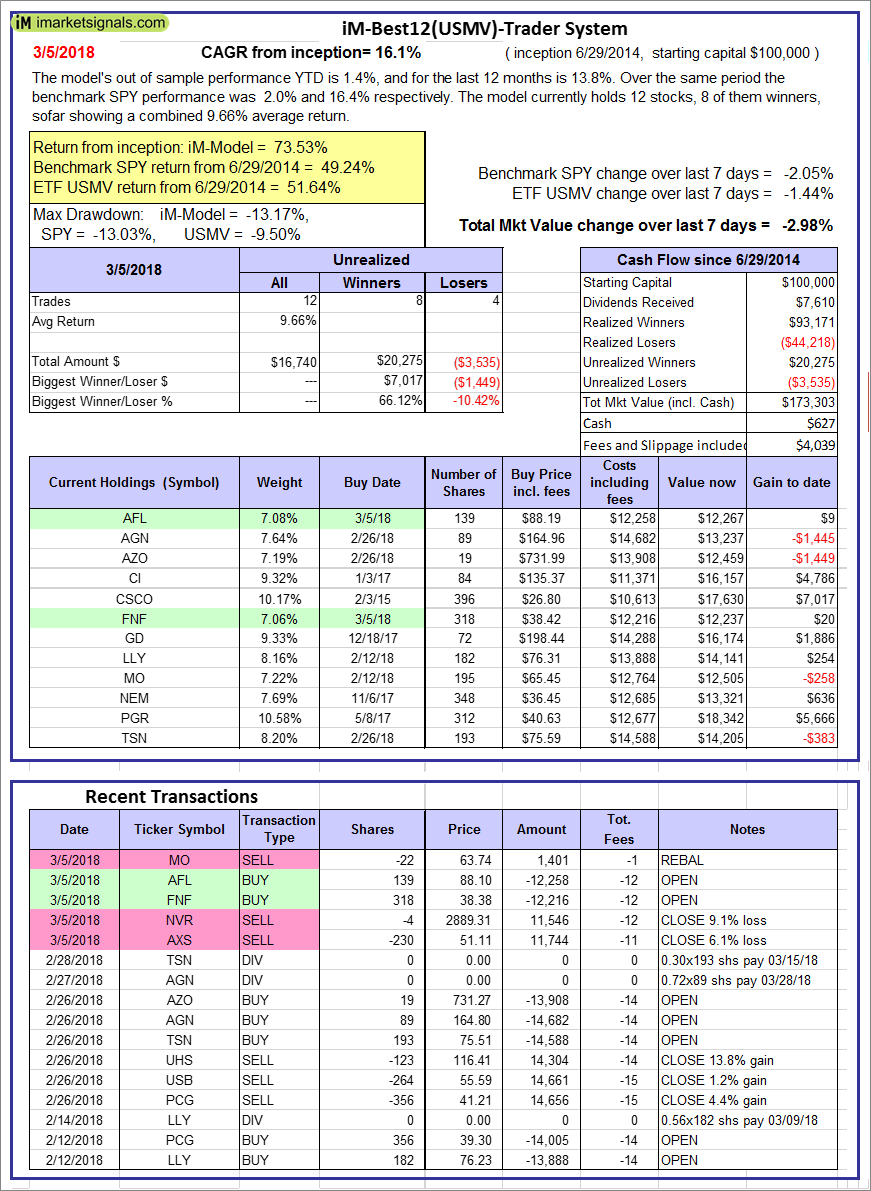
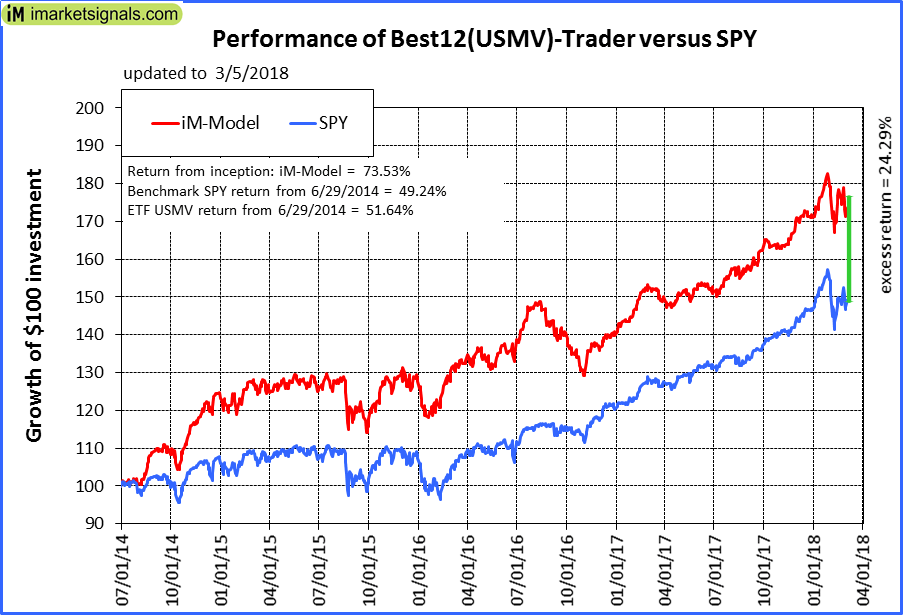
iM-Best12(USMV)-Trader: The model’s out of sample performance YTD is 1.4%, and for the last 12 months is 13.8%. Over the same period the benchmark SPY performance was 2.0% and 16.4% respectively. Since inception, on 6/30/2014, the model gained 73.53% while the benchmark SPY gained 49.24% and the ETF USMV gained 51.64% over the same period. Over the previous week the market value of iM-Best12(USMV)-Trader gained -2.98% at a time when SPY gained -2.05%. A starting capital of $100,000 at inception on 6/30/2014 would have grown to $173,303 which includes $627 cash and excludes $4,039 spent on fees and slippage. |
|
|
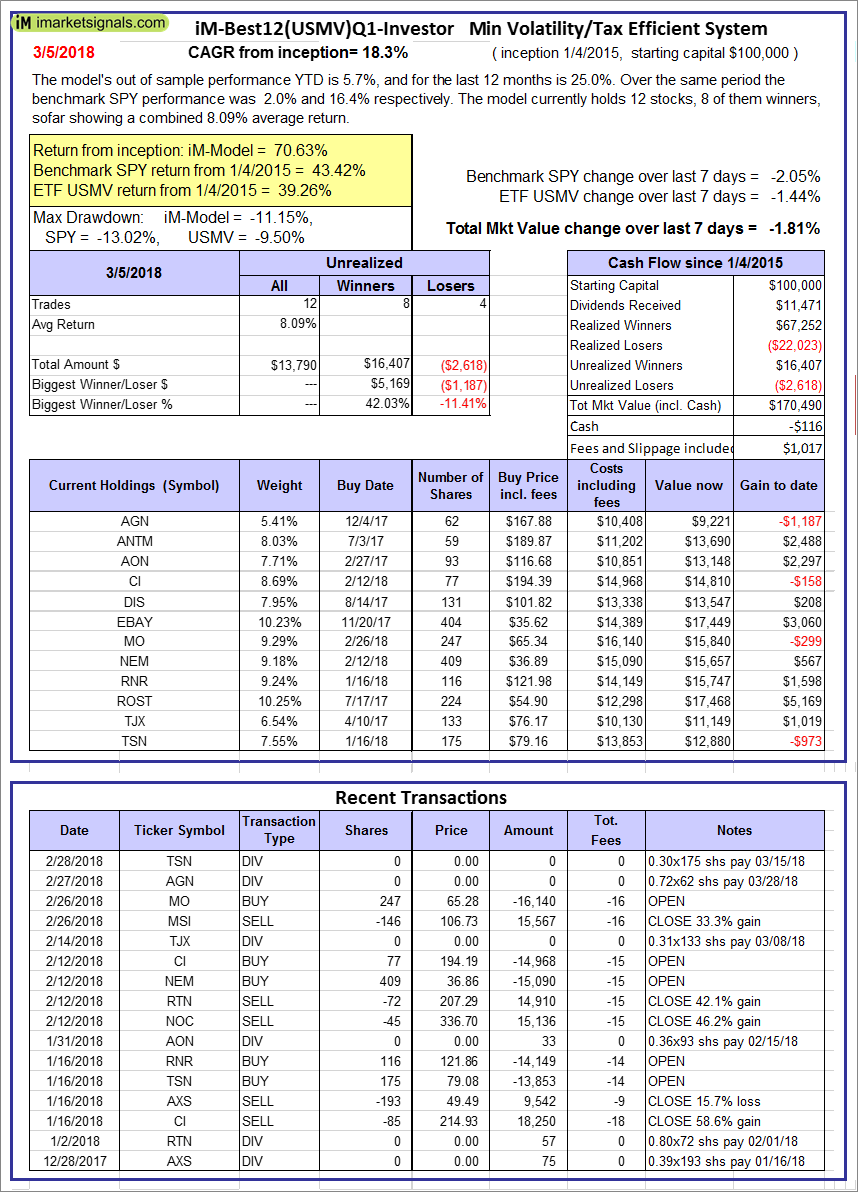
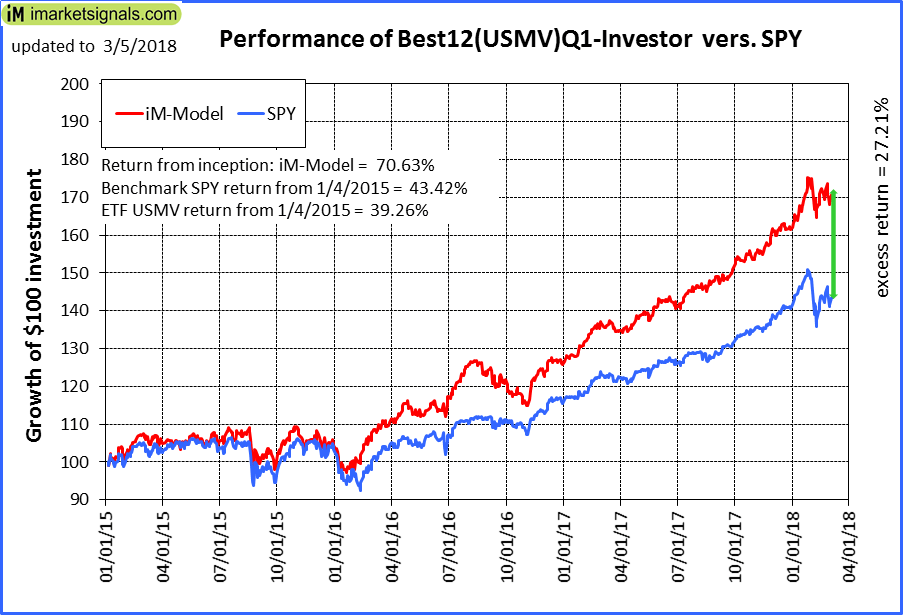
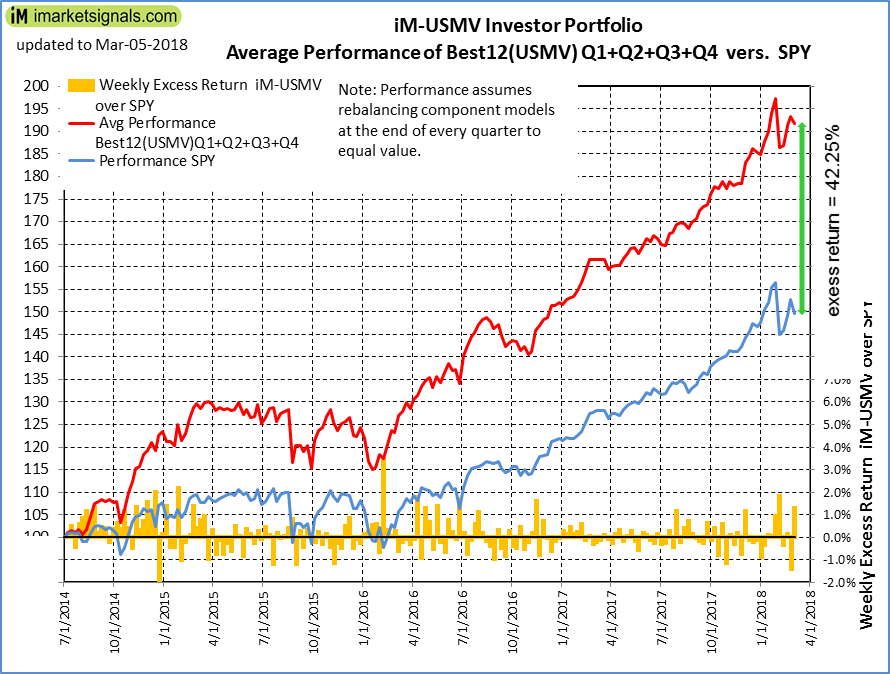
iM-Best12(USMV)Q1-Investor: The model’s out of sample performance YTD is 5.7%, and for the last 12 months is 25.0%. Over the same period the benchmark SPY performance was 2.0% and 16.4% respectively. Since inception, on 1/5/2015, the model gained 70.63% while the benchmark SPY gained 43.42% and the ETF USMV gained 39.26% over the same period. Over the previous week the market value of iM-Best12(USMV)Q1 gained -1.81% at a time when SPY gained -2.05%. A starting capital of $100,000 at inception on 1/5/2015 would have grown to $170,490 which includes -$116 cash and excludes $1,017 spent on fees and slippage. |
|
|
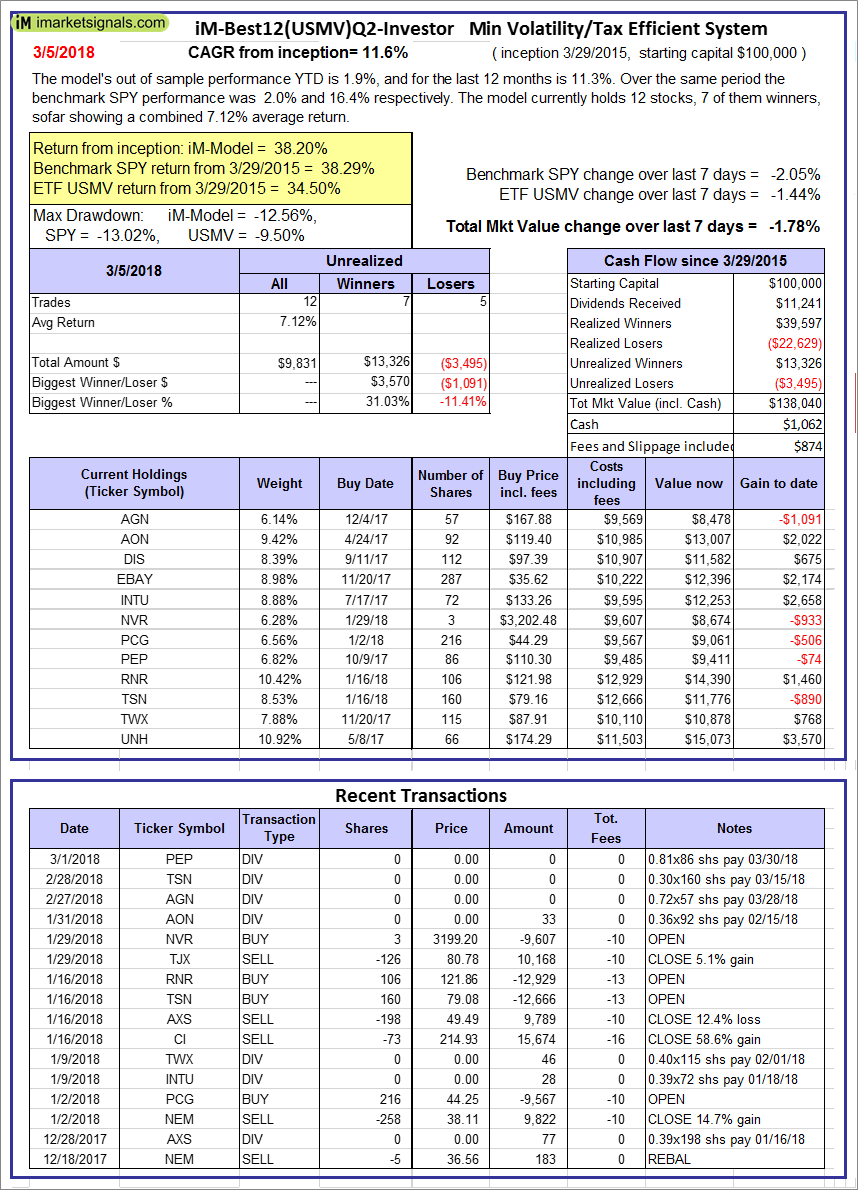
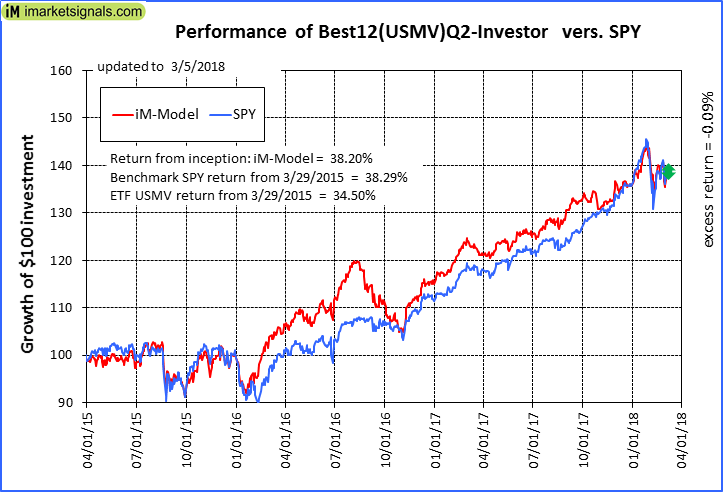
iM-Best12(USMV)Q2-Investor: The model’s out of sample performance YTD is 1.9%, and for the last 12 months is 11.3%. Over the same period the benchmark SPY performance was 2.0% and 16.4% respectively. Since inception, on 3/30/2015, the model gained 38.20% while the benchmark SPY gained 38.29% and the ETF USMV gained 34.50% over the same period. Over the previous week the market value of iM-Best12(USMV)Q2 gained -1.78% at a time when SPY gained -2.05%. A starting capital of $100,000 at inception on 3/30/2015 would have grown to $138,040 which includes $1,062 cash and excludes $874 spent on fees and slippage. |
|
|
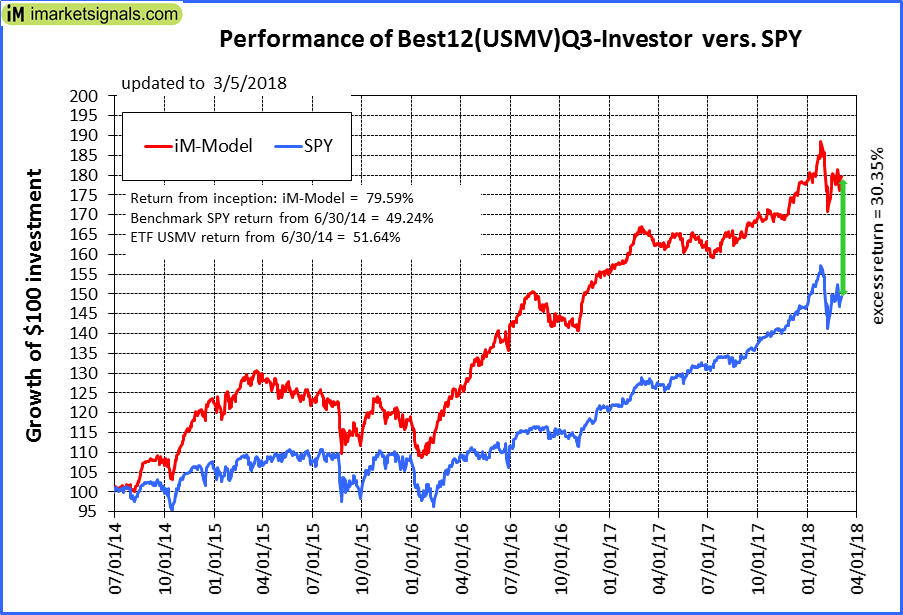
iM-Best12(USMV)Q3-Investor: The model’s out of sample performance YTD is 1.1%, and for the last 12 months is 7.8%. Over the same period the benchmark SPY performance was 2.0% and 16.4% respectively. Since inception, on 7/1/2014, the model gained 79.59% while the benchmark SPY gained 49.24% and the ETF USMV gained 51.64% over the same period. Over the previous week the market value of iM-Best12(USMV)Q3 gained -1.06% at a time when SPY gained -2.05%. A starting capital of $100,000 at inception on 7/1/2014 would have grown to $179,442 which includes $828 cash and excludes $1,359 spent on fees and slippage. |
|
|
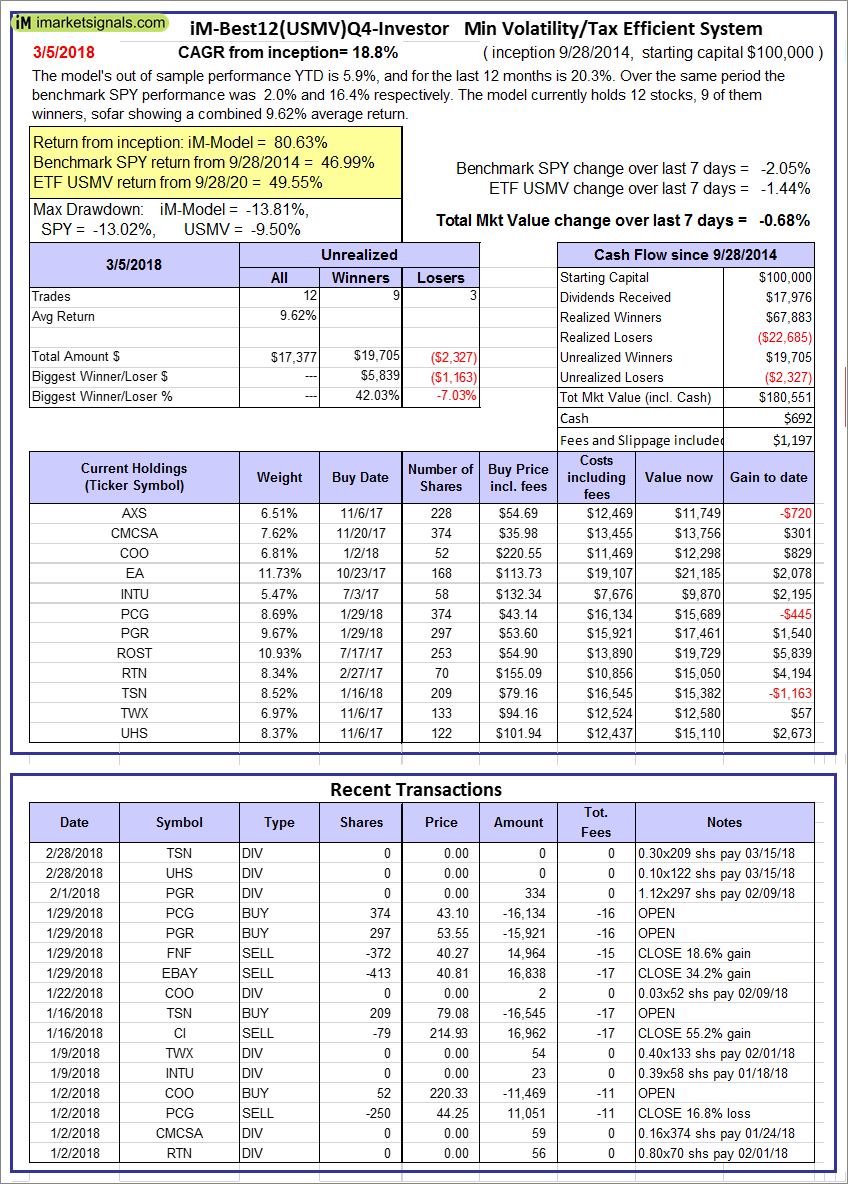
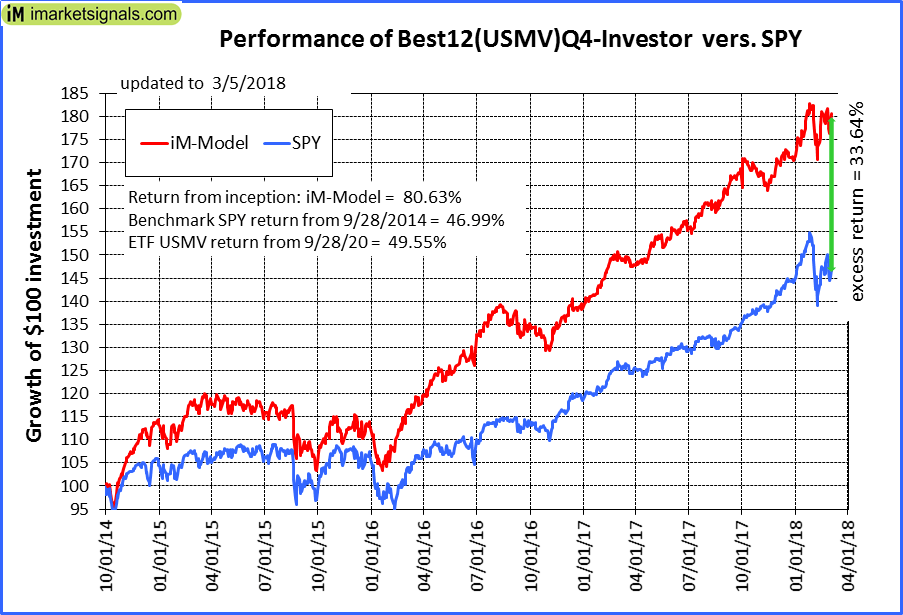
iM-Best12(USMV)Q4-Investor: Since inception, on 9/29/2014, the model gained 80.63% while the benchmark SPY gained 46.99% and the ETF USMV gained 49.55% over the same period. Over the previous week the market value of iM-Best12(USMV)Q4 gained -0.68% at a time when SPY gained -2.05%. A starting capital of $100,000 at inception on 9/29/2014 would have grown to $180,551 which includes $692 cash and excludes $1,197 spent on fees and slippage. |
|
|
Average Performance of iM-Best12(USMV)Q1+Q2+Q3+Q4-Investor resulted in an excess return of 42.25% over SPY. (see iM-USMV Investor Portfolio) |
|
|
iM-Best(Short): The model’s out of sample performance YTD is 2.9%, and for the last 12 months is -1.9%. Over the same period the benchmark SPY performance was 2.0% and 16.4% respectively. Over the previous week the market value of iM-Best(Short) gained 1.97% at a time when SPY gained -2.05%. Over the period 1/2/2009 to 3/5/2018 the starting capital of $100,000 would have grown to $93,914 which includes $113,054 cash and excludes $23,796 spent on fees and slippage. |
|
|
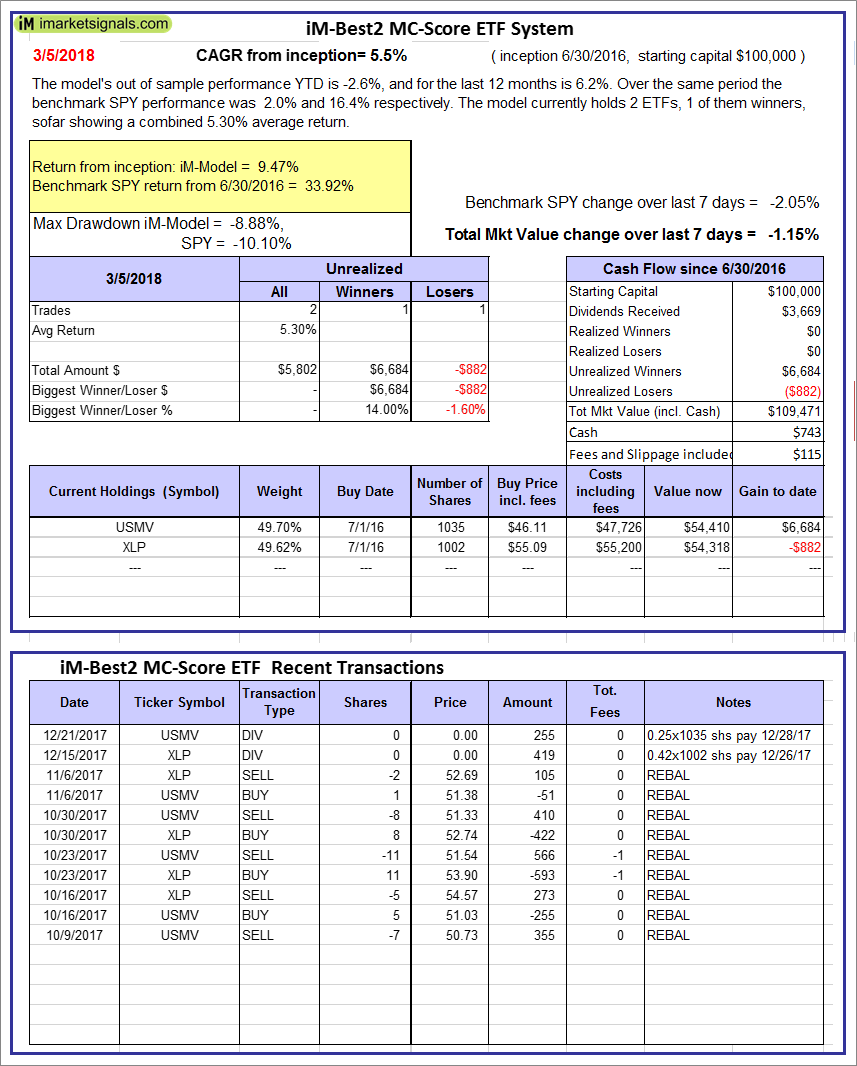
iM-Best2 MC-Score ETF System: The model’s out of sample performance YTD is -2.6%, and for the last 12 months is 6.2%. Over the same period the benchmark SPY performance was 2.0% and 16.4% respectively. Over the previous week the market value of the iM-Best2 MC-Score ETF System gained -1.15% at a time when SPY gained -2.05%. A starting capital of $100,000 at inception on 6/30/2016 would have grown to $109,471 which includes $743 cash and excludes $115 spent on fees and slippage. |
|
|
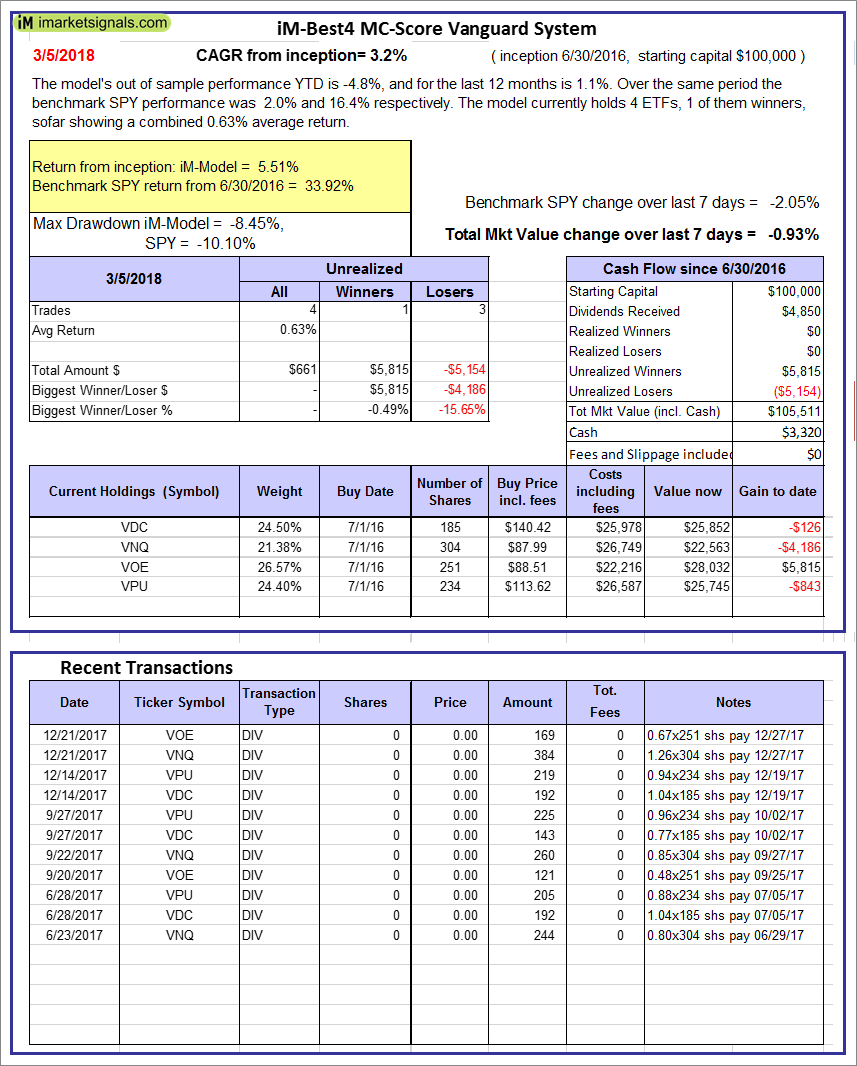
iM-Best4 MC-Score Vanguard System: The model’s out of sample performance YTD is -4.8%, and for the last 12 months is 1.1%. Over the same period the benchmark SPY performance was 2.0% and 16.4% respectively. Over the previous week the market value of the iM-Best4 MC-Score Vanguard System gained -0.93% at a time when SPY gained -2.05%. A starting capital of $100,000 at inception on 6/30/2016 would have grown to $105,511 which includes $3,320 cash and excludes $00 spent on fees and slippage. |
|
|
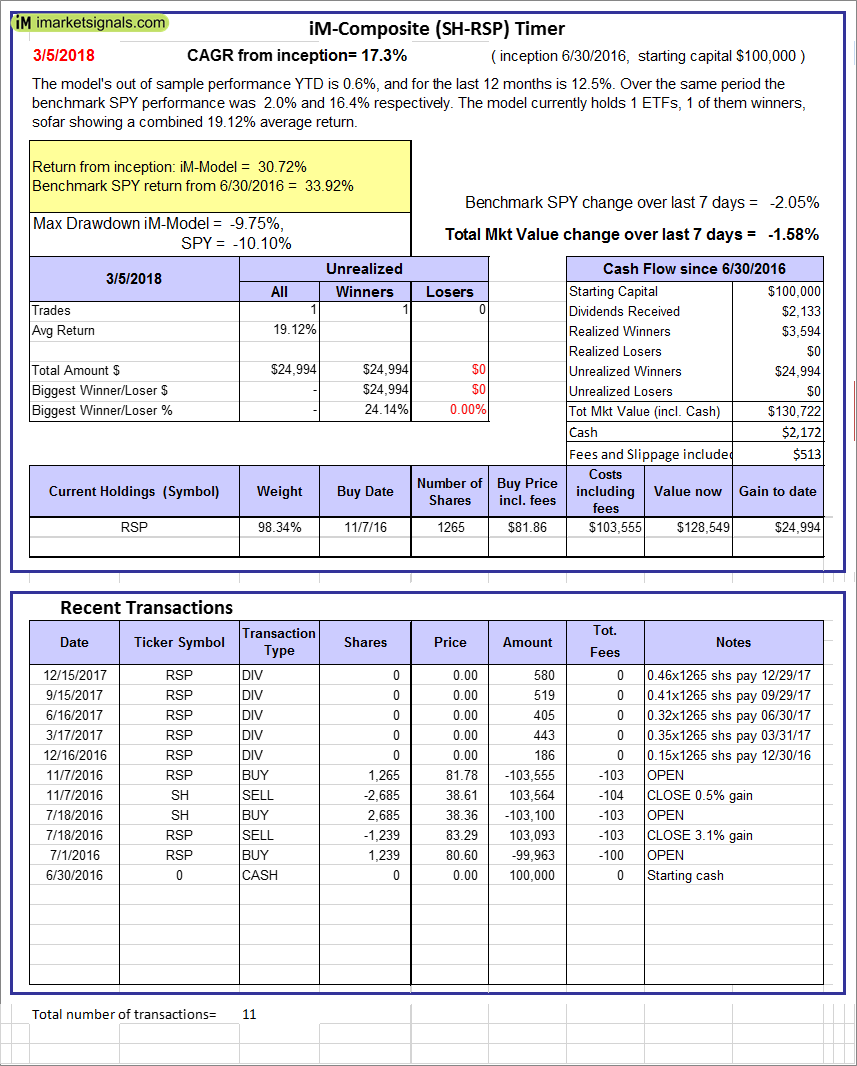
iM-Composite (SH-RSP) Timer: The model’s out of sample performance YTD is 0.6%, and for the last 12 months is 12.5%. Over the same period the benchmark SPY performance was 2.0% and 16.4% respectively. Over the previous week the market value of the iM-Composite (SH-RSP) Timer gained -1.58% at a time when SPY gained -2.05%. A starting capital of $100,000 at inception on 6/30/2016 would have grown to $130,722 which includes $2,172 cash and excludes $513 spent on fees and slippage. |
|
|
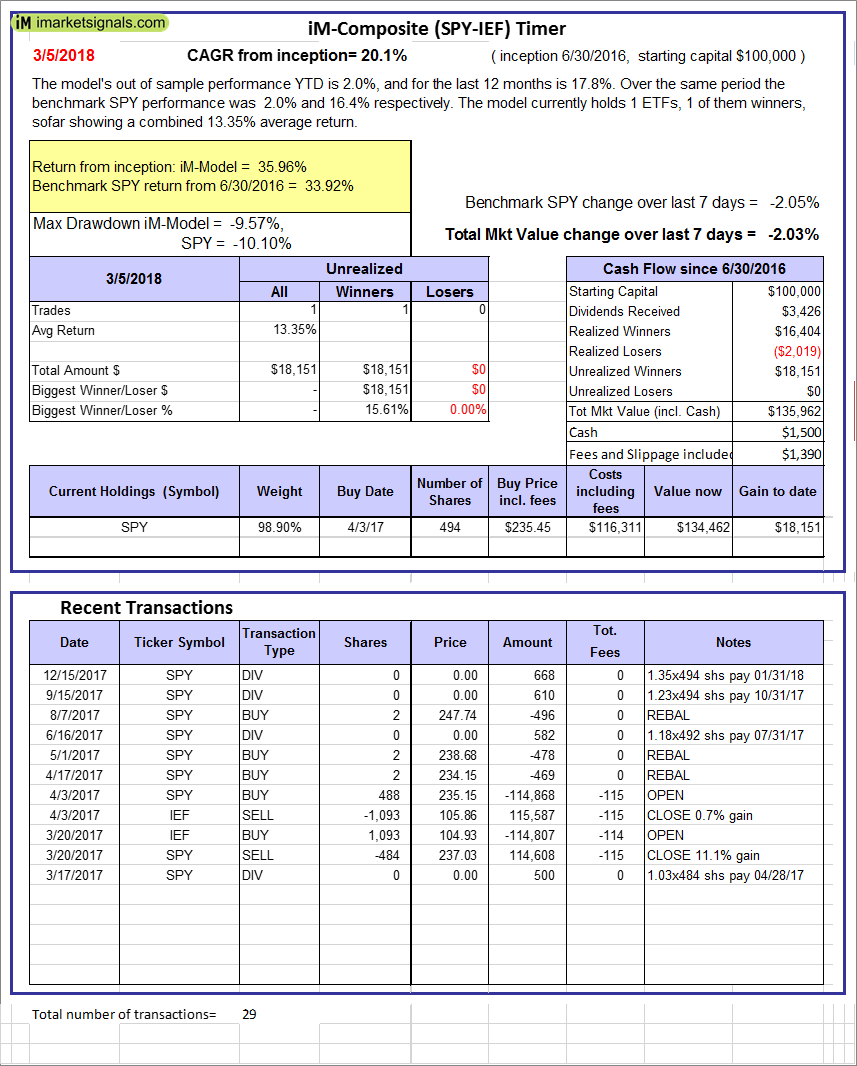
iM-Composite (SPY-IEF) Timer: The model’s out of sample performance YTD is 2.0%, and for the last 12 months is 17.8%. Over the same period the benchmark SPY performance was 2.0% and 16.4% respectively. Over the previous week the market value of the iM-Composite (SPY-IEF) Timer gained -2.03% at a time when SPY gained -2.05%. A starting capital of $100,000 at inception on 6/30/2016 would have grown to $135,962 which includes $1,500 cash and excludes $1,390 spent on fees and slippage. |
|
|
iM-VIX Timer with ZIV: The model’s out of sample performance YTD is 8.9%, and for the last 12 months is 60.3%. Over the same period the benchmark SPY performance was 2.0% and 16.4% respectively. Over the previous week the market value of the iM-VIX Timer with ZIV gained -3.22% at a time when SPY gained -2.05%. A starting capital of $100,000 at inception on 6/30/2016 would have grown to $191,605 which includes -$1,015 cash and excludes $1,288 spent on fees and slippage. |
|
|
iM-Composite(Gold-Stocks-Bond) Timer: The model’s out of sample performance YTD is 1.2%, and for the last 12 months is 12.4%. Over the same period the benchmark SPY performance was 2.0% and 16.4% respectively. Over the previous week the market value of the iM-Composite(Gold-Stocks-Bond) Timer gained -1.01% at a time when SPY gained -2.05%. A starting capital of $100,000 at inception on 6/30/2016 would have grown to $130,282 which includes $53 cash and excludes $1,955 spent on fees and slippage. |
|
|
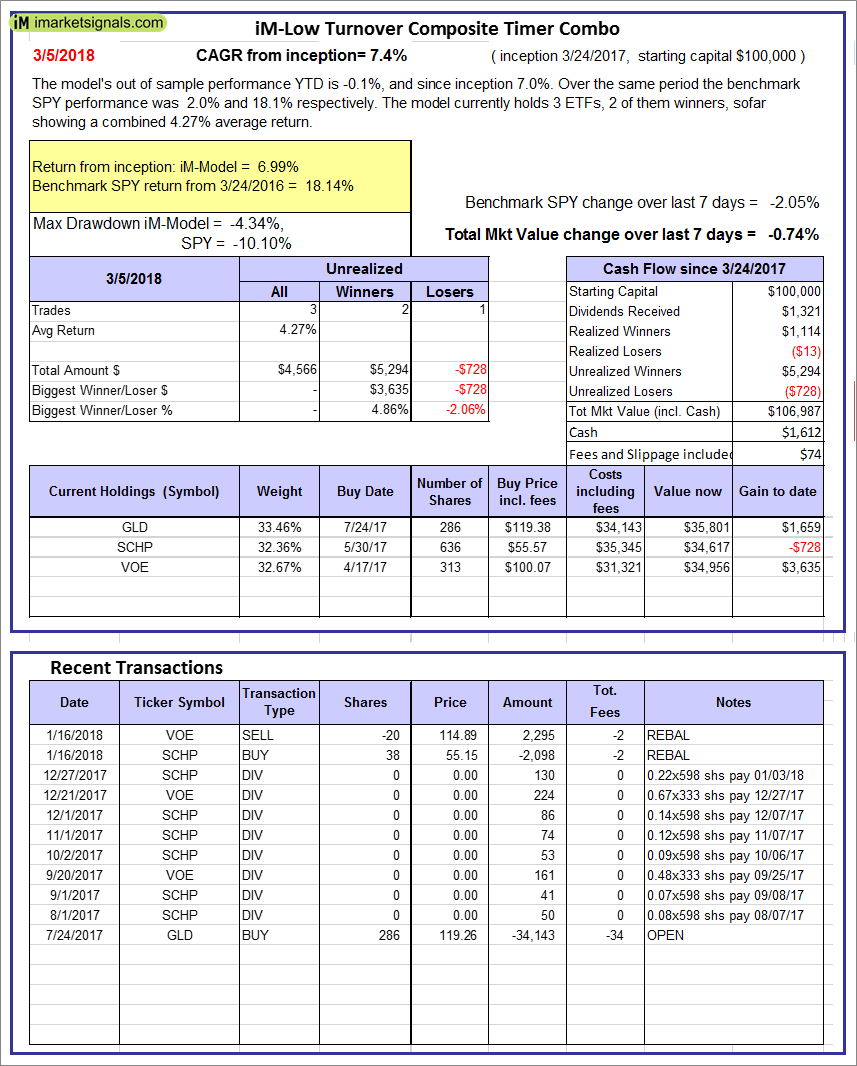
iM-Low Turnover Composite Timer Combo: The model’s out of sample performance YTD is -0.1%, and since inception 7.0%. Over the same period the benchmark SPY performance was 2.0% and 18.1% respectively. Over the previous week the market value of the iM-Low Turnover Composite Timer Combo gained -0.74% at a time when SPY gained -2.05%. A starting capital of $100,000 at inception on 3/24/27 would have grown to $106,987 which includes $1,612 cash and excludes $74 spent on fees and slippage. |
|
|
iM-Min Drawdown Combo: The model’s out of sample performance YTD is 0.2%, and since inception 8.1%. Over the same period the benchmark SPY performance was 2.0% and 17.7% respectively. Over the previous week the market value of the iM-Min Drawdown Combo gained -1.25% at a time when SPY gained -2.05%. A starting capital of $100,000 at inception on 4/5/2017 would have grown to $108,063 which includes $1,097 cash and excludes $205 spent on fees and slippage. |
|
|
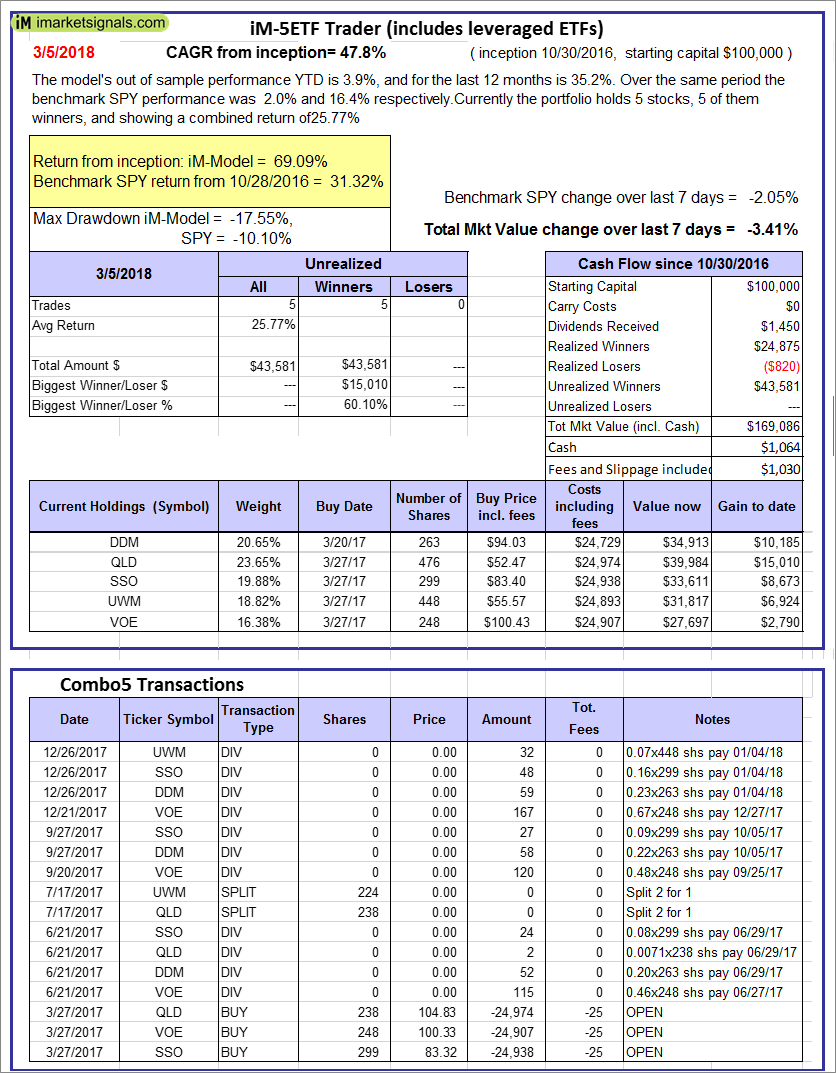
iM-5ETF Trader (includes leveraged ETFs): The model’s out of sample performance YTD is 3.9%, and for the last 12 months is 35.2%. Over the same period the benchmark SPY performance was 2.0% and 16.4% respectively. Over the previous week the market value of the iM-5ETF Trader (includes leveraged ETFs) gained -3.41% at a time when SPY gained -2.05%. A starting capital of $100,000 at inception on 10/30/2016 would have grown to $169,086 which includes $1,064 cash and excludes $1,030 spent on fees and slippage. |
|
|
iM-Standard 5ETF Trader (excludes leveraged ETFs): The model’s out of sample performance YTD is 1.3%, and for the last 12 months is 15.6%. Over the same period the benchmark SPY performance was 2.0% and 16.4% respectively. Over the previous week the market value of the iM-Standard 5ETF Trader (excludes leveraged ETFs) gained -1.79% at a time when SPY gained -2.05%. A starting capital of $100,000 at inception on 10/30/2016 would have grown to $127,299 which includes $2,002 cash and excludes $880 spent on fees and slippage. |


Leave a Reply
You must be logged in to post a comment.