
  |
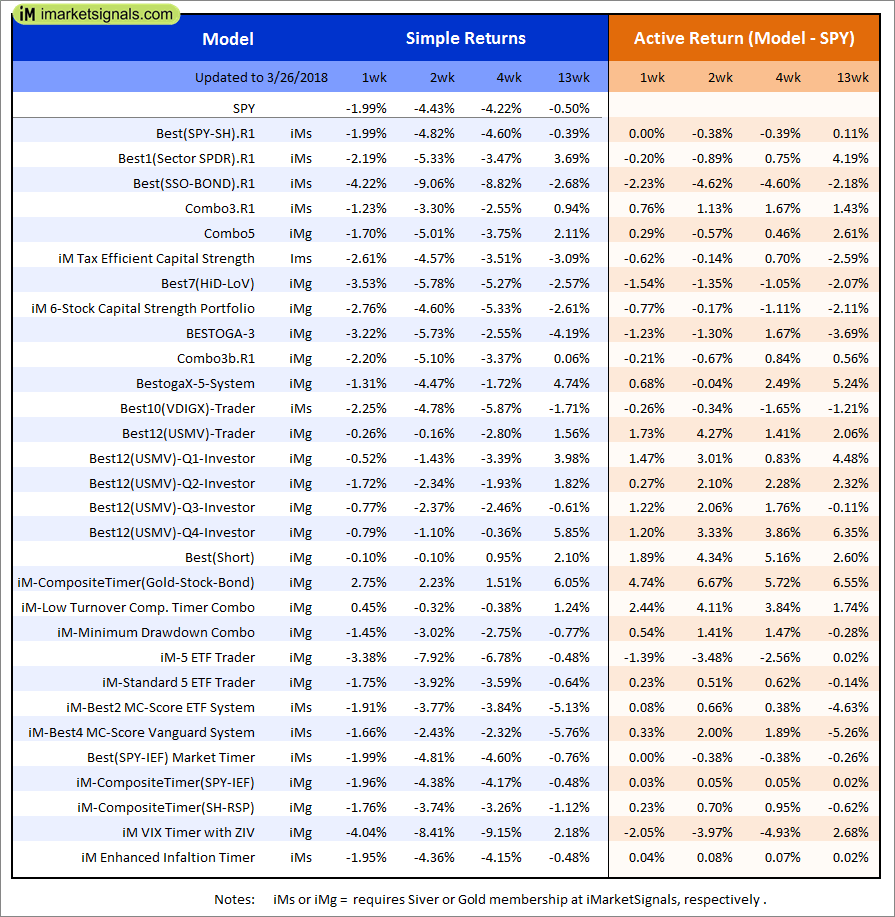
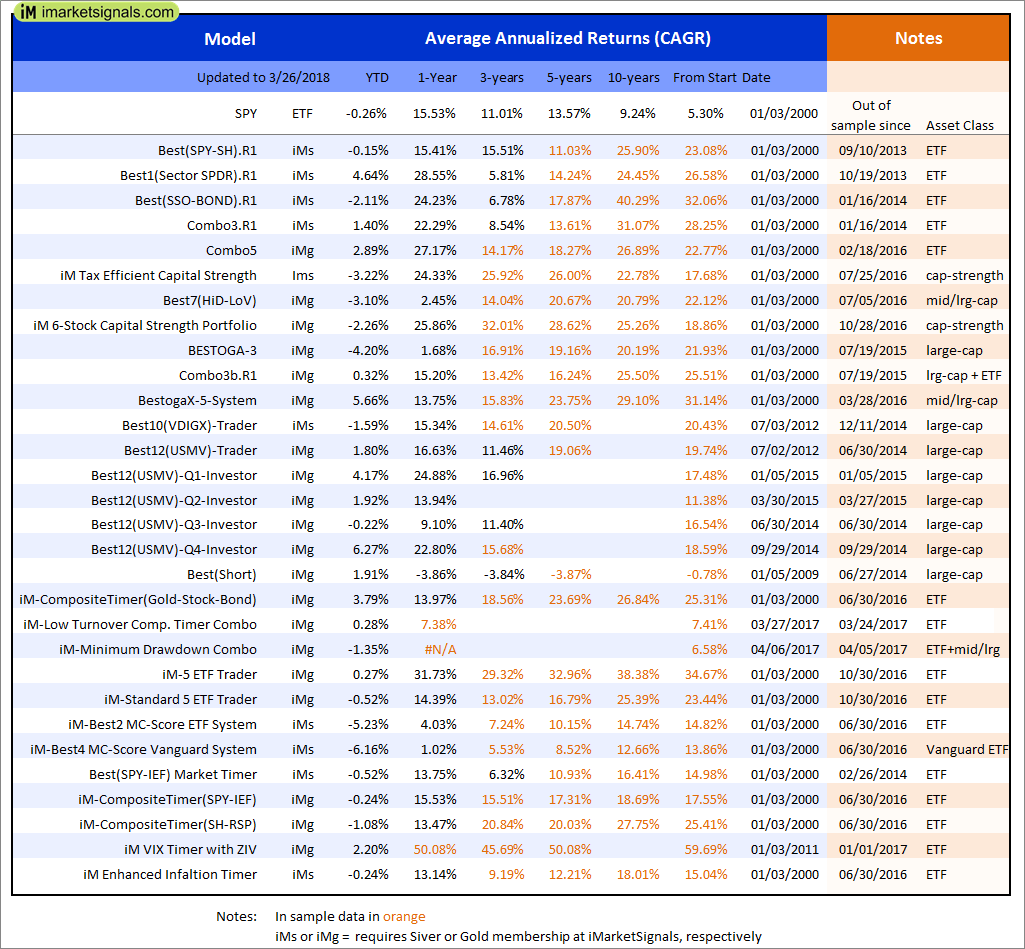
Out of sample performance summary of our models for the past 1, 2, 4 and 13 week periods. The active active return indicates how the models over- or underperformed the benchmark ETF SPY. Also the YTD, and the 1-, 3-, 5- and 10-year annualized returns are shown in the second table |
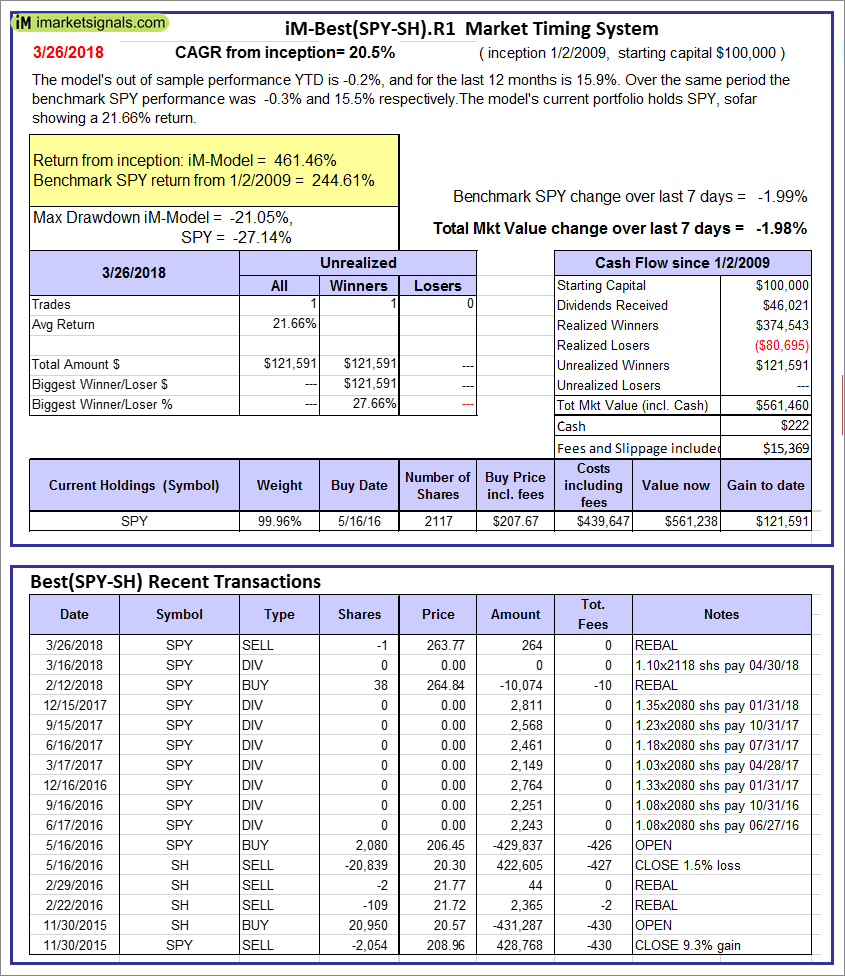 |
iM-Best(SPY-SH).R1: The model’s out of sample performance YTD is -0.2%, and for the last 12 months is 15.9%. Over the same period the benchmark SPY performance was -0.3% and 15.5% respectively. Over the previous week the market value of Best(SPY-SH) gained -1.98% at a time when SPY gained -1.99%. A starting capital of $100,000 at inception on 1/2/2009 would have grown to $561,460 which includes $222 cash and excludes $15,369 spent on fees and slippage. |
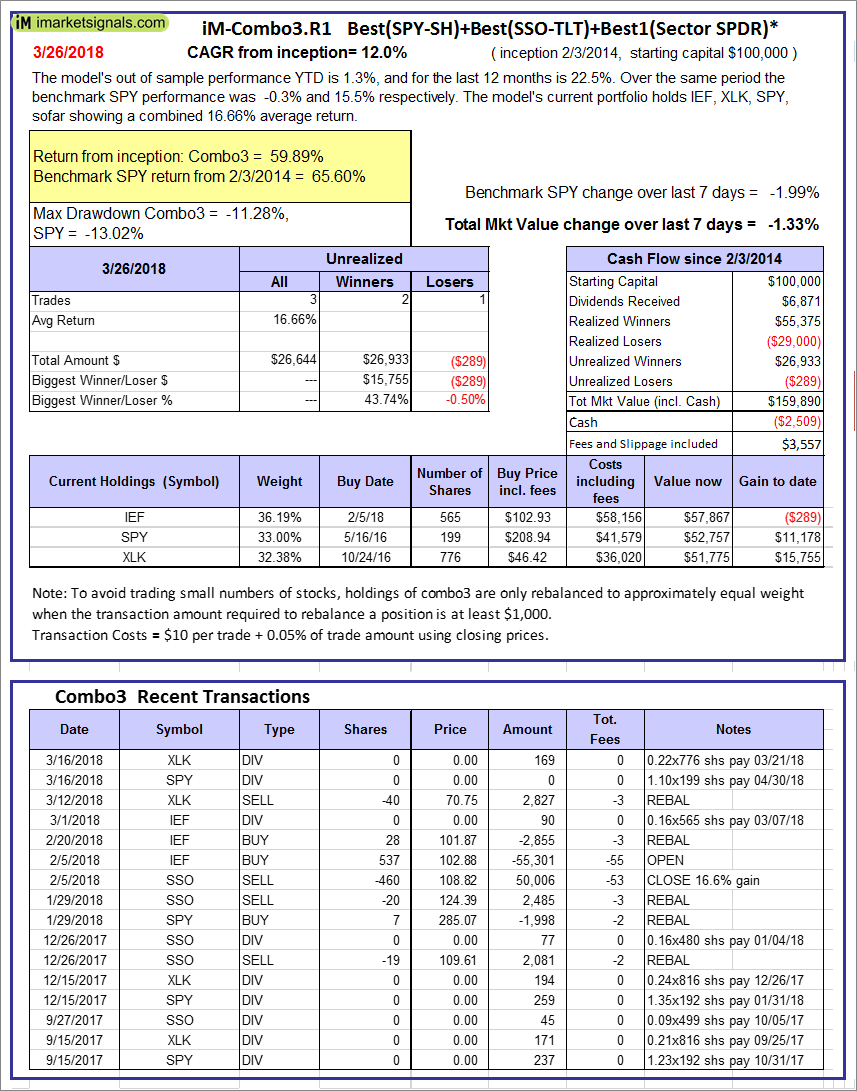 |
iM-Combo3.R1: The model’s out of sample performance YTD is 1.3%, and for the last 12 months is 22.5%. Over the same period the benchmark SPY performance was -0.3% and 15.5% respectively. Over the previous week the market value of iM-Combo3.R1 gained -1.33% at a time when SPY gained -1.99%. A starting capital of $100,000 at inception on 2/3/2014 would have grown to $159,890 which includes -$2,509 cash and excludes $3,557 spent on fees and slippage. |
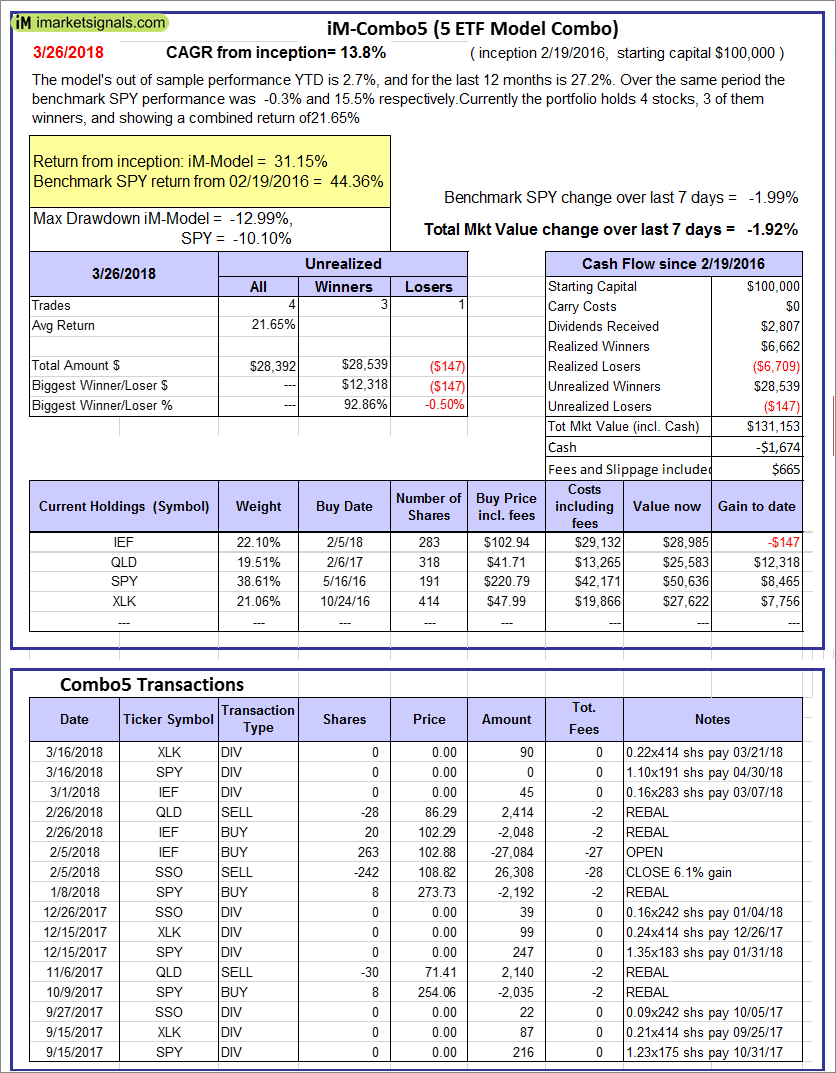 |
iM-Combo5: The model’s out of sample performance YTD is 2.7%, and for the last 12 months is 27.2%. Over the same period the benchmark SPY performance was -0.3% and 15.5% respectively. Over the previous week the market value of iM-Combo5 gained -1.92% at a time when SPY gained -1.99%. A starting capital of $100,000 at inception on 2/22/2016 would have grown to $131,153 which includes -$1,674 cash and excludes $665 spent on fees and slippage. |
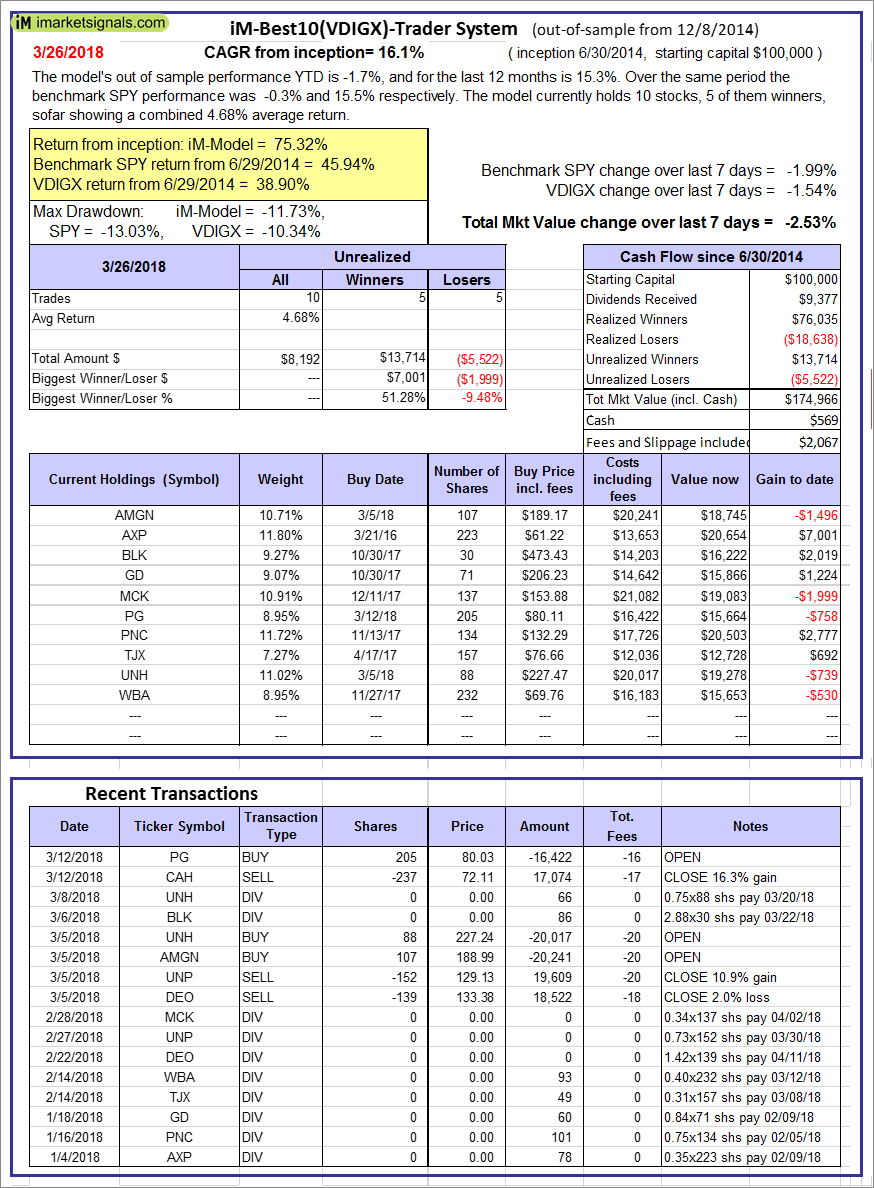 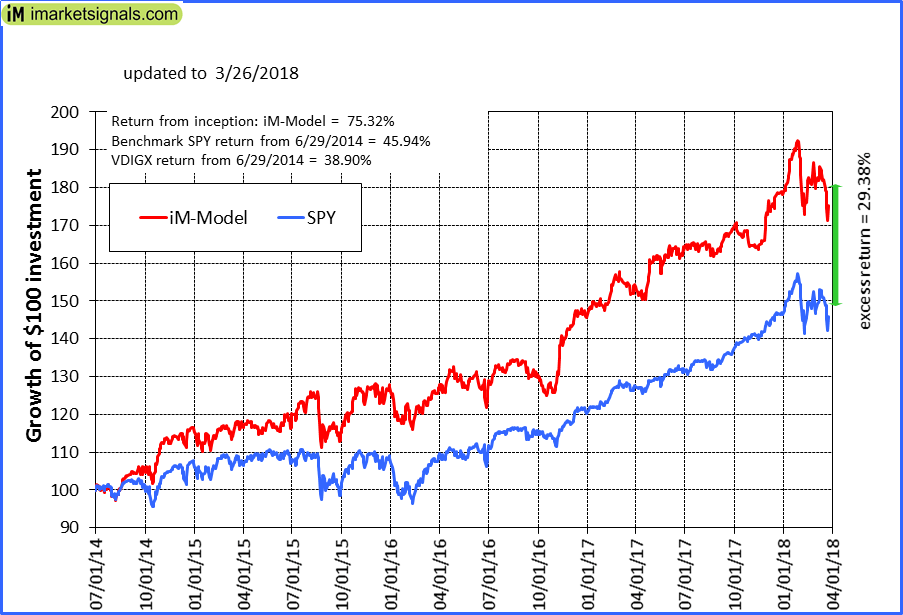 |
iM-Best10(VDIGX)-Trader: The model’s out of sample performance YTD is -1.7%, and for the last 12 months is 15.3%. Over the same period the benchmark SPY performance was -0.3% and 15.5% respectively. Since inception, on 7/1/2014, the model gained 75.32% while the benchmark SPY gained 45.94% and VDIGX gained 38.90% over the same period. Over the previous week the market value of iM-Best10(VDIGX) gained -2.53% at a time when SPY gained -1.99%. A starting capital of $100,000 at inception on 7/1/2014 would have grown to $174,966 which includes $569 cash and excludes $2,067 spent on fees and slippage. |
 |
iM-BESTOGA-3: The model’s out of sample performance YTD is -4.5%, and for the last 12 months is 1.7%. Over the same period the benchmark SPY performance was -0.3% and 15.5% respectively. Over the previous week the market value of iM-BESTOGA-3 gained -3.57% at a time when SPY gained -1.99%. A starting capital of $100,000 at inception on 2/3/2014 would have grown to $220,465 which includes -$1,114 cash and excludes $2,324 spent on fees and slippage. |
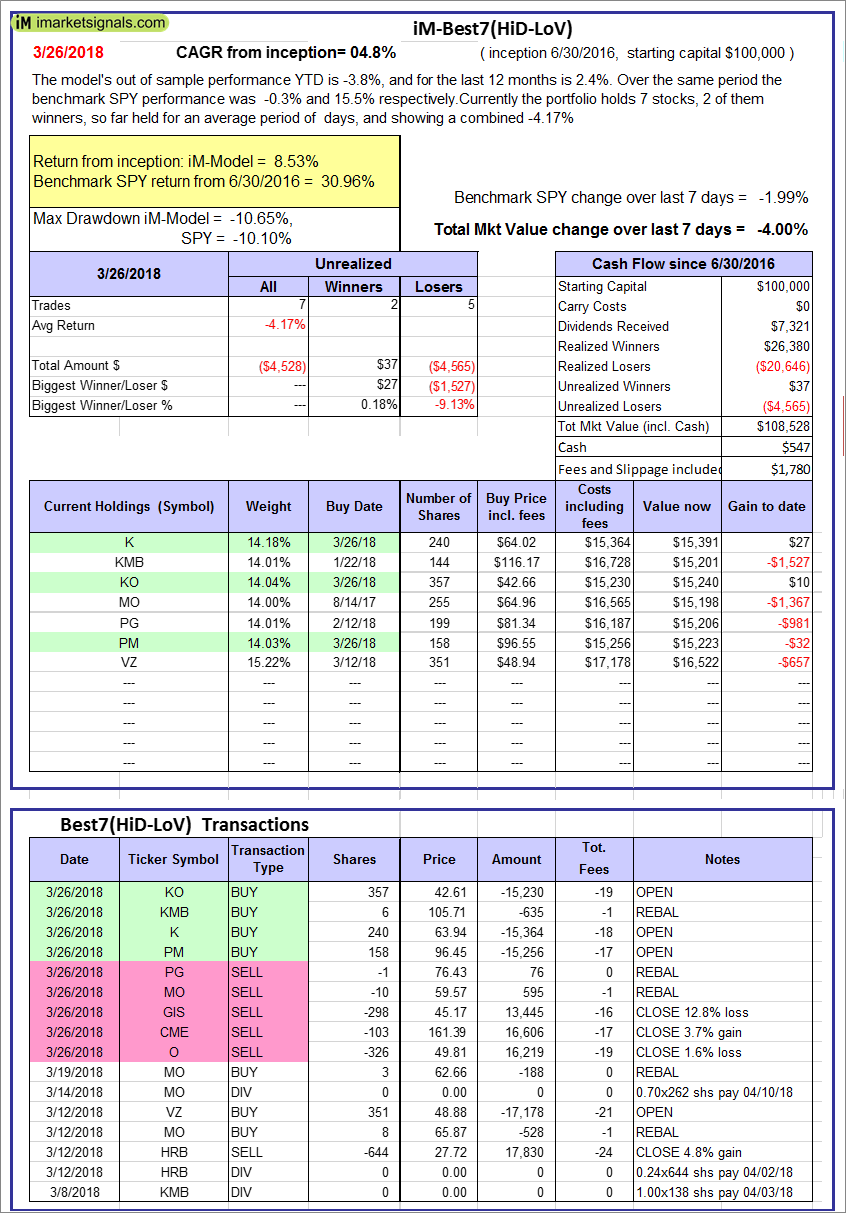 |
iM-Best7(HiD-LoV): The model’s out of sample performance YTD is -3.8%, and for the last 12 months is 2.4%. Over the same period the benchmark SPY performance was -0.3% and 15.5% respectively. Over the previous week the market value of iM-BESTOGA-3 gained -4.00% at a time when SPY gained -1.99%. A starting capital of $100,000 at inception on 6/30/2016 would have grown to $108,528 which includes $547 cash and excludes $1,780 spent on fees and slippage. |
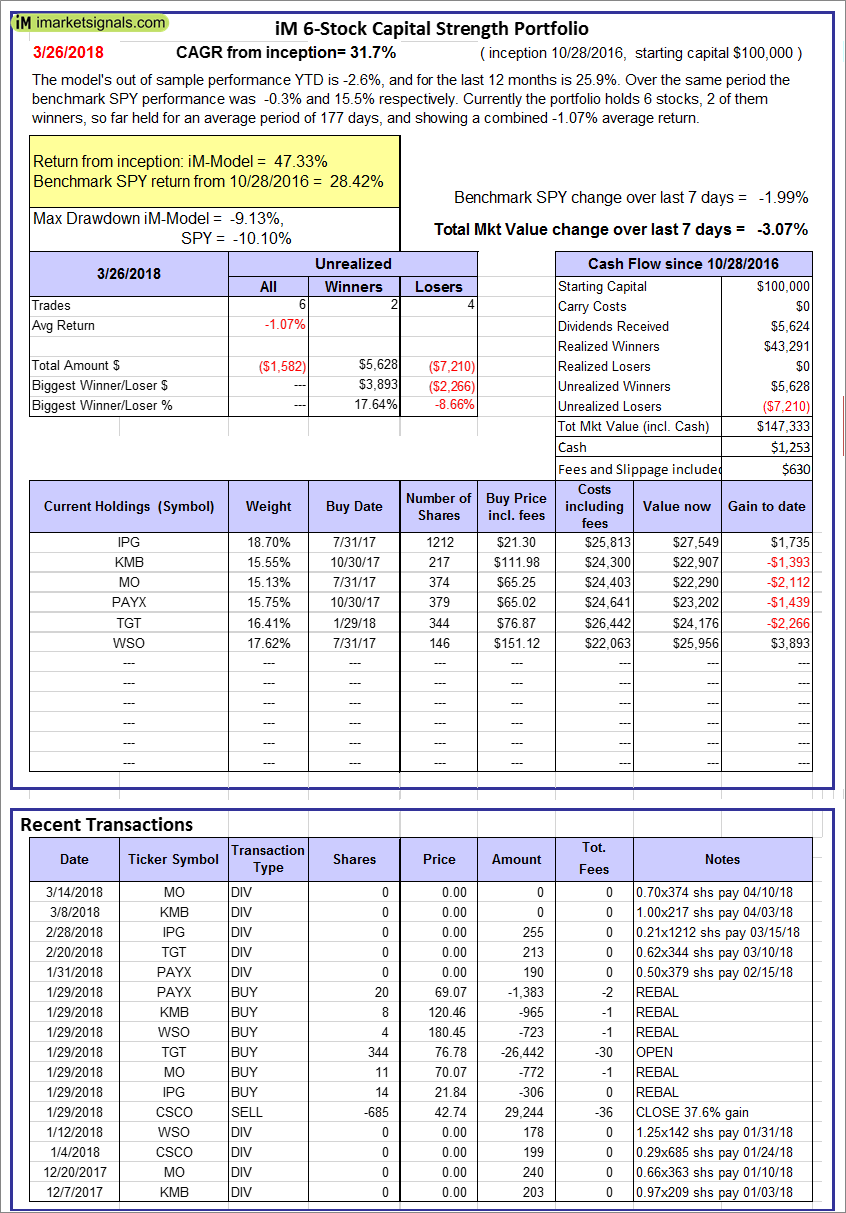 |
iM 6-Stock Capital Strength Portfolio: The model’s out of sample performance YTD is -2.6%, and for the last 12 months is 25.9%. Over the same period the benchmark SPY performance was -0.3% and 15.5% respectively. Over the previous week the market value of the iM 6-Stock Capital Strength Portfolio gained -3.07% at a time when SPY gained -1.99%. A starting capital of $100,000 at inception on 10/28/2016 would have grown to $147,333 which includes $1,253 cash and excludes $630 spent on fees and slippage. |
 |
iM-BestogaX5-System: The model’s out of sample performance YTD is 4.9%, and for the last 12 months is 13.7%. Over the same period the benchmark SPY performance was -0.3% and 15.5% respectively. Over the previous week the market value of iM-BestogaX5-System gained -1.75% at a time when SPY gained -1.99%. A starting capital of $100,000 at inception on 3/28/2016 would have grown to $117,059 which includes $4,973 cash and excludes $966 spent on fees and slippage. |
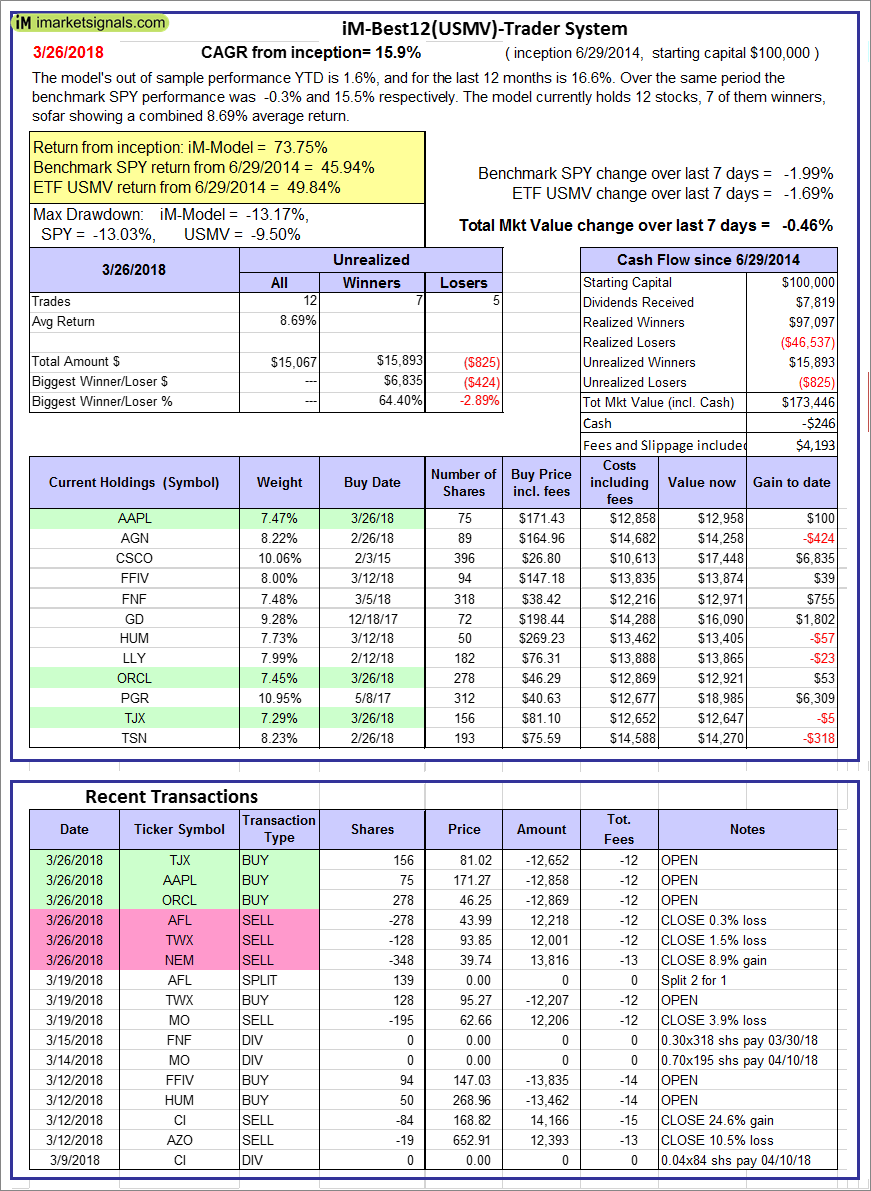 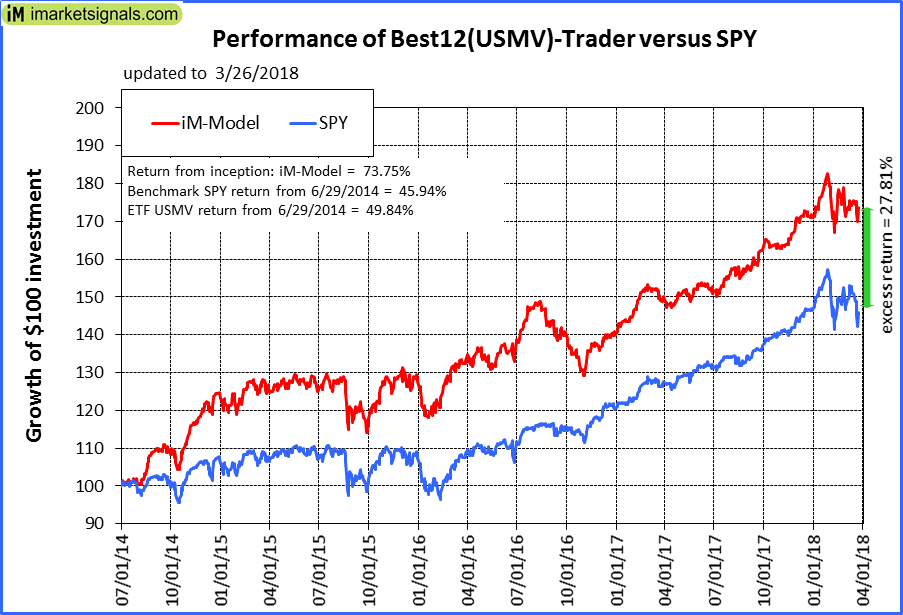 |
iM-Best12(USMV)-Trader: The model’s out of sample performance YTD is 1.6%, and for the last 12 months is 16.6%. Over the same period the benchmark SPY performance was -0.3% and 15.5% respectively. Since inception, on 6/30/2014, the model gained 73.75% while the benchmark SPY gained 45.94% and the ETF USMV gained 49.84% over the same period. Over the previous week the market value of iM-Best12(USMV)-Trader gained -0.46% at a time when SPY gained -1.99%. A starting capital of $100,000 at inception on 6/30/2014 would have grown to $173,446 which includes -$246 cash and excludes $4,193 spent on fees and slippage. |
 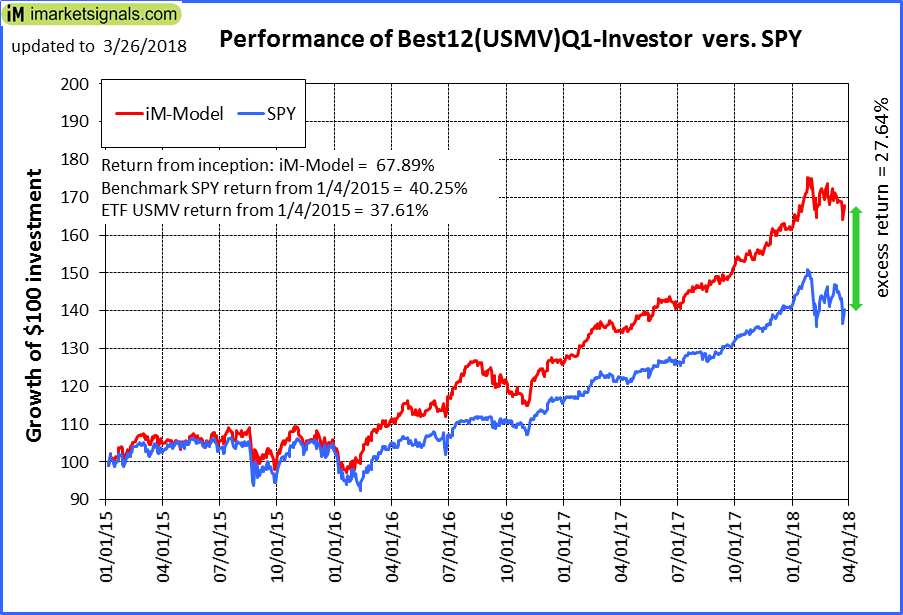 |
iM-Best12(USMV)Q1-Investor: The model’s out of sample performance YTD is 4.0%, and for the last 12 months is 24.9%. Over the same period the benchmark SPY performance was -0.3% and 15.5% respectively. Since inception, on 1/5/2015, the model gained 67.89% while the benchmark SPY gained 40.25% and the ETF USMV gained 37.61% over the same period. Over the previous week the market value of iM-Best12(USMV)Q1 gained -0.52% at a time when SPY gained -1.99%. A starting capital of $100,000 at inception on 1/5/2015 would have grown to $167,393 which includes -$235 cash and excludes $1,115 spent on fees and slippage. |
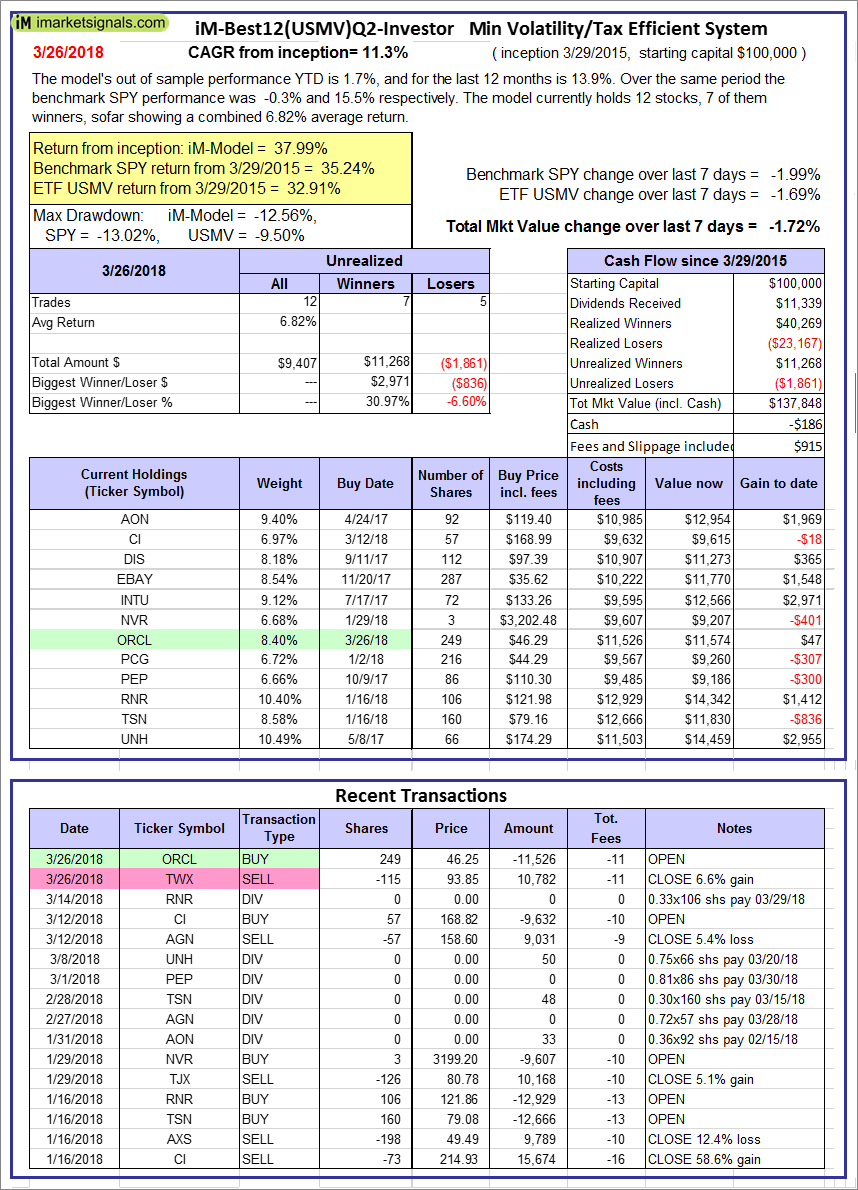 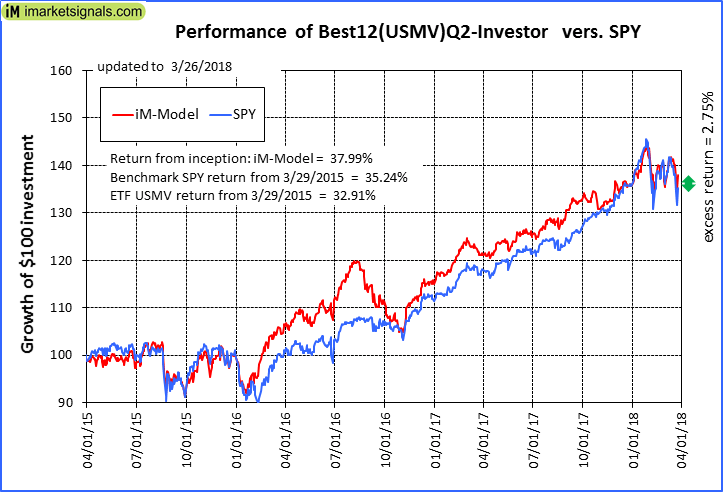 |
iM-Best12(USMV)Q2-Investor: The model’s out of sample performance YTD is 1.7%, and for the last 12 months is 13.9%. Over the same period the benchmark SPY performance was -0.3% and 15.5% respectively. Since inception, on 3/30/2015, the model gained 37.99% while the benchmark SPY gained 35.24% and the ETF USMV gained 32.91% over the same period. Over the previous week the market value of iM-Best12(USMV)Q2 gained -1.72% at a time when SPY gained -1.99%. A starting capital of $100,000 at inception on 3/30/2015 would have grown to $137,848 which includes -$186 cash and excludes $915 spent on fees and slippage. |
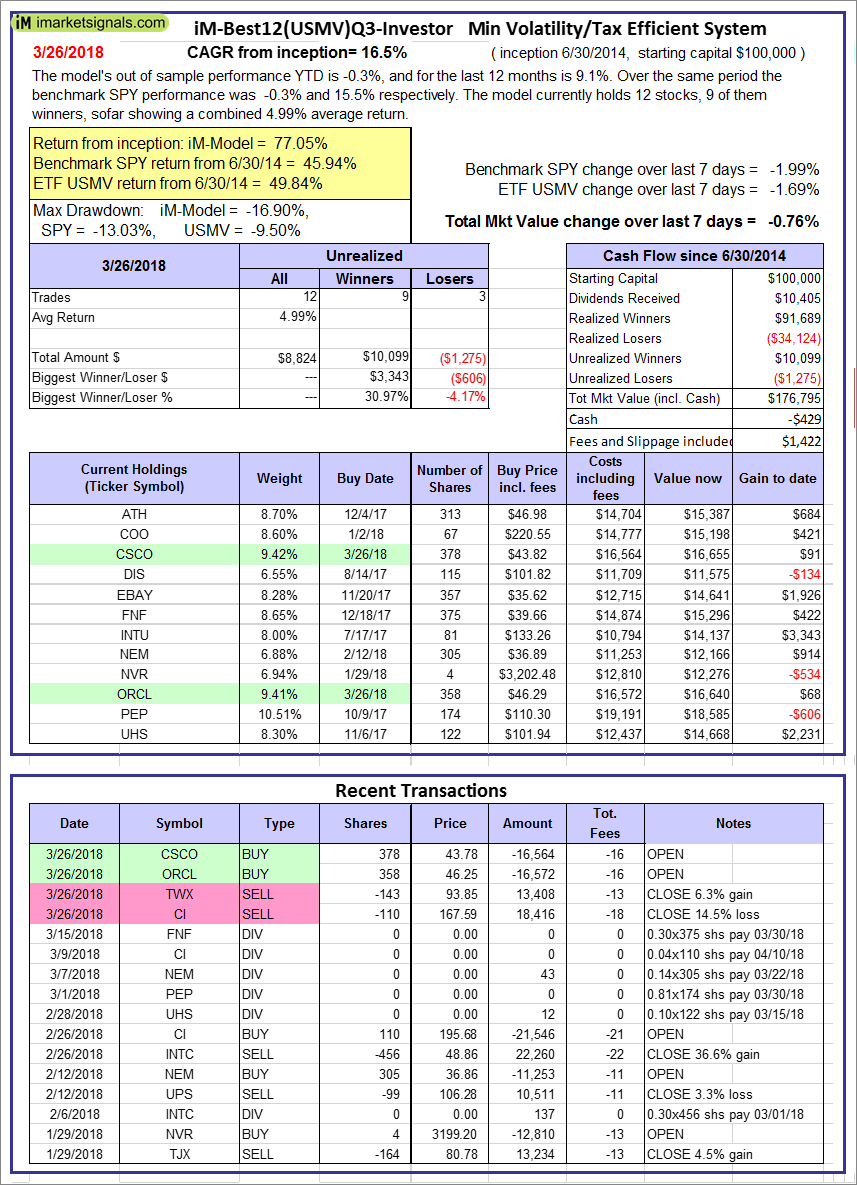 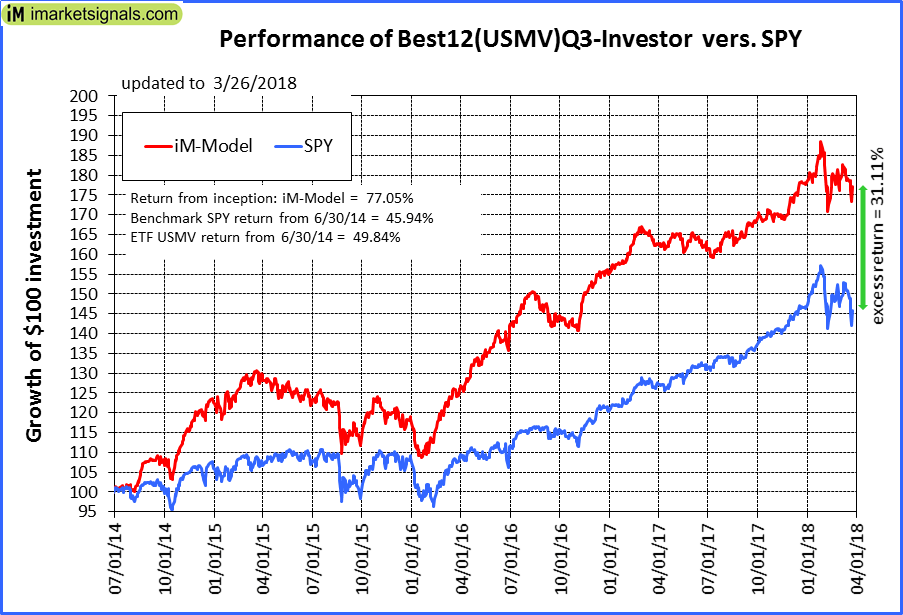 |
iM-Best12(USMV)Q3-Investor: The model’s out of sample performance YTD is -0.3%, and for the last 12 months is 9.1%. Over the same period the benchmark SPY performance was -0.3% and 15.5% respectively. Since inception, on 7/1/2014, the model gained 77.05% while the benchmark SPY gained 45.94% and the ETF USMV gained 49.84% over the same period. Over the previous week the market value of iM-Best12(USMV)Q3 gained -0.76% at a time when SPY gained -1.99%. A starting capital of $100,000 at inception on 7/1/2014 would have grown to $176,795 which includes -$429 cash and excludes $1,422 spent on fees and slippage. |
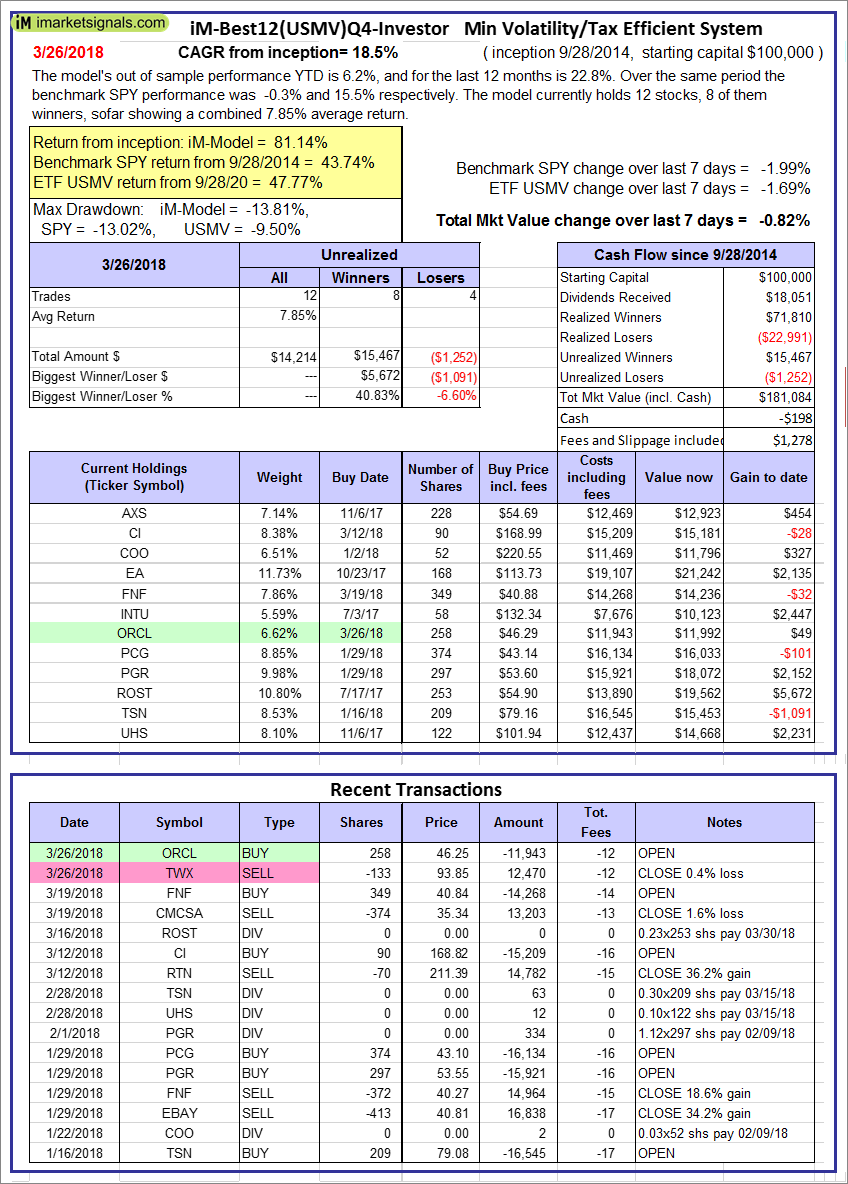 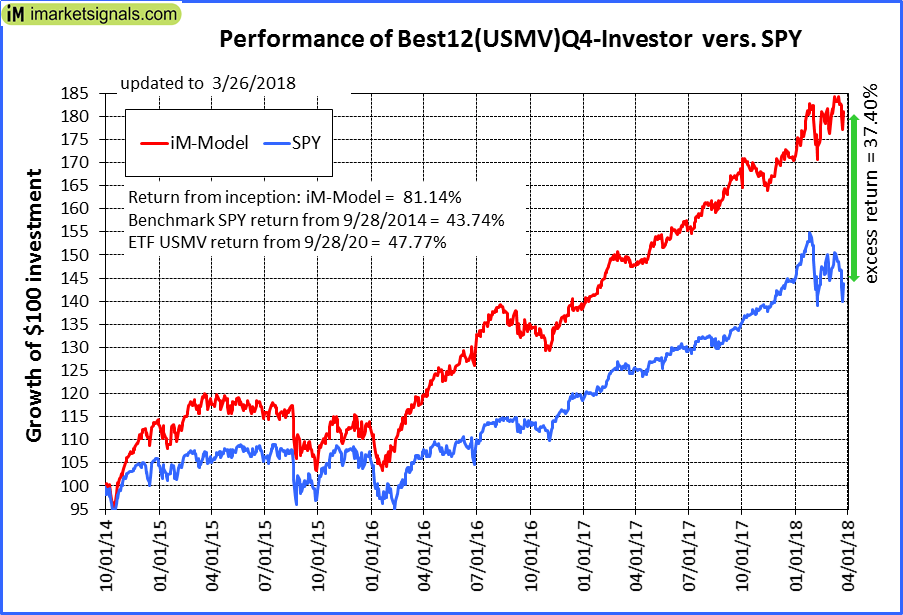 |
iM-Best12(USMV)Q4-Investor: Since inception, on 9/29/2014, the model gained 81.14% while the benchmark SPY gained 43.74% and the ETF USMV gained 47.77% over the same period. Over the previous week the market value of iM-Best12(USMV)Q4 gained -0.82% at a time when SPY gained -1.99%. A starting capital of $100,000 at inception on 9/29/2014 would have grown to $181,084 which includes -$198 cash and excludes $1,278 spent on fees and slippage. |
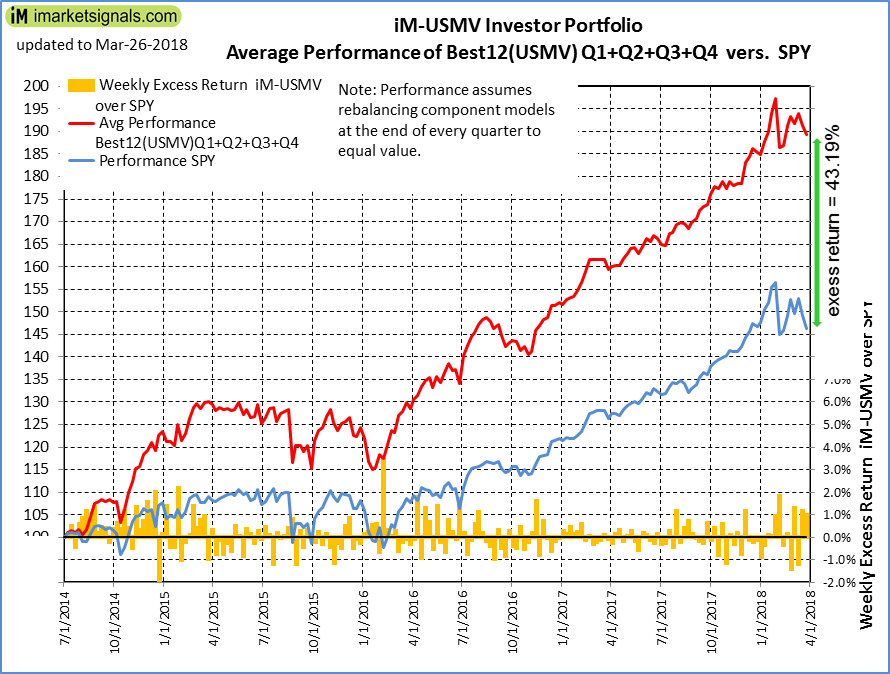 |
Average Performance of iM-Best12(USMV)Q1+Q2+Q3+Q4-Investor resulted in an excess return of 43.19% over SPY. (see iM-USMV Investor Portfolio) |
 |
iM-Best(Short): The model’s out of sample performance YTD is 1.9%, and for the last 12 months is -4.1%. Over the same period the benchmark SPY performance was -0.3% and 15.5% respectively. Over the previous week the market value of iM-Best(Short) gained -0.10% at a time when SPY gained -1.99%. Over the period 1/2/2009 to 3/26/2018 the starting capital of $100,000 would have grown to $92,967 which includes $111,888 cash and excludes $23,837 spent on fees and slippage. |
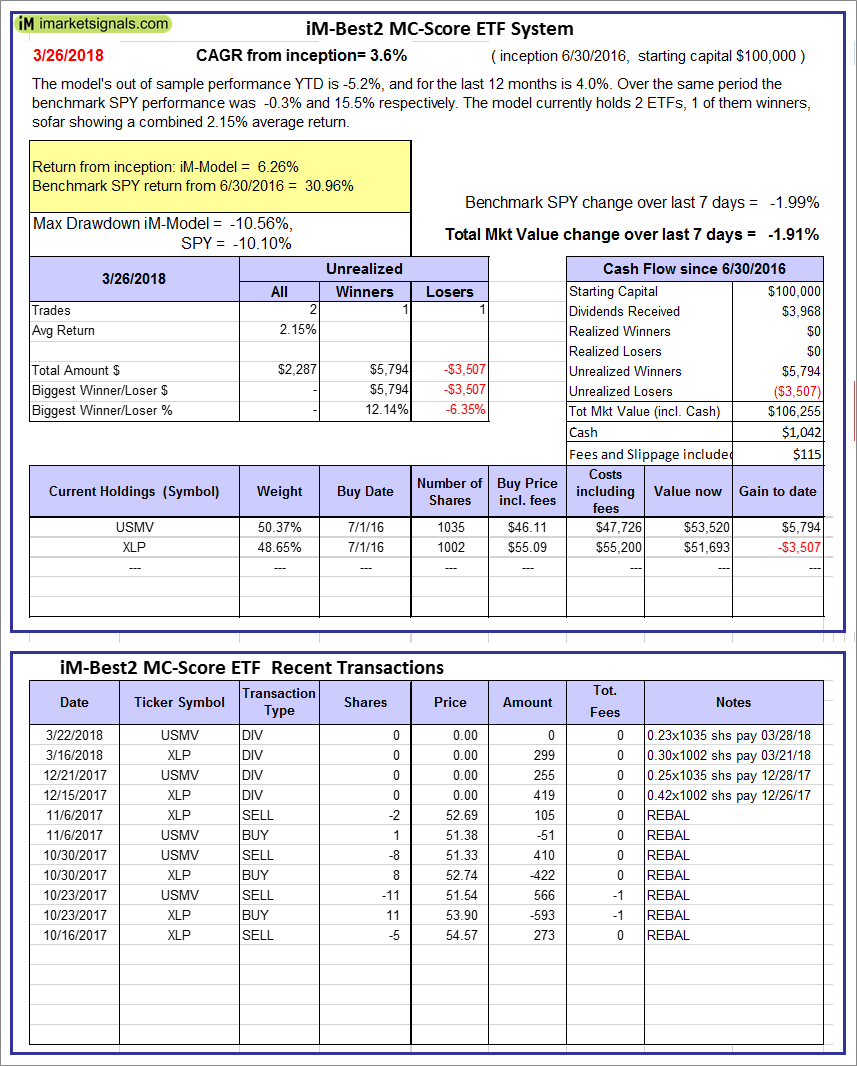 |
iM-Best2 MC-Score ETF System: The model’s out of sample performance YTD is -5.2%, and for the last 12 months is 4.0%. Over the same period the benchmark SPY performance was -0.3% and 15.5% respectively. Over the previous week the market value of the iM-Best2 MC-Score ETF System gained -1.91% at a time when SPY gained -1.99%. A starting capital of $100,000 at inception on 6/30/2016 would have grown to $106,255 which includes $1,042 cash and excludes $115 spent on fees and slippage. |
 |
iM-Best4 MC-Score Vanguard System: The model’s out of sample performance YTD is -6.2%, and for the last 12 months is 1.0%. Over the same period the benchmark SPY performance was -0.3% and 15.5% respectively. Over the previous week the market value of the iM-Best4 MC-Score Vanguard System gained -1.65% at a time when SPY gained -1.99%. A starting capital of $100,000 at inception on 6/30/2016 would have grown to $103,682 which includes $3,616 cash and excludes $00 spent on fees and slippage. |
 |
iM-Composite (SH-RSP) Timer: The model’s out of sample performance YTD is -1.0%, and for the last 12 months is 13.0%. Over the same period the benchmark SPY performance was -0.3% and 15.5% respectively. Over the previous week the market value of the iM-Composite (SH-RSP) Timer gained -1.70% at a time when SPY gained -1.99%. A starting capital of $100,000 at inception on 6/30/2016 would have grown to $128,078 which includes $2,172 cash and excludes $513 spent on fees and slippage. |
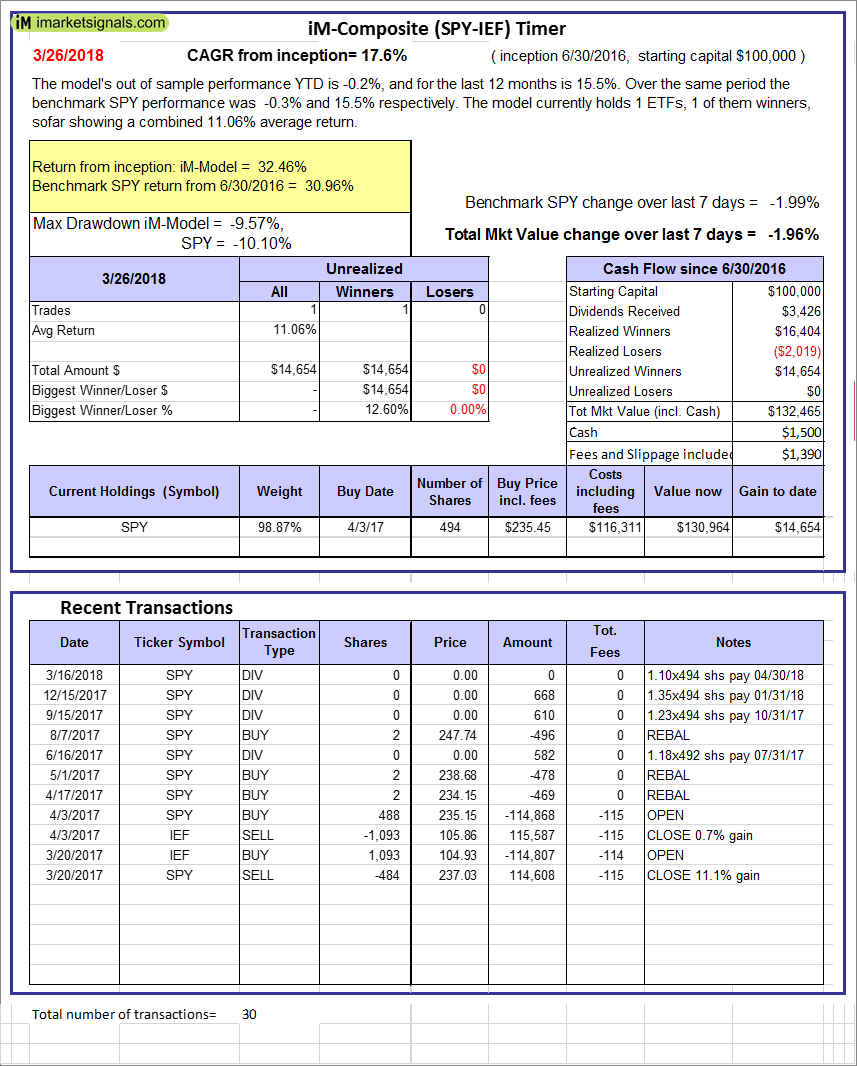 |
iM-Composite (SPY-IEF) Timer: The model’s out of sample performance YTD is -0.2%, and for the last 12 months is 15.5%. Over the same period the benchmark SPY performance was -0.3% and 15.5% respectively. Over the previous week the market value of the iM-Composite (SPY-IEF) Timer gained -1.96% at a time when SPY gained -1.99%. A starting capital of $100,000 at inception on 6/30/2016 would have grown to $132,465 which includes $1,500 cash and excludes $1,390 spent on fees and slippage. |
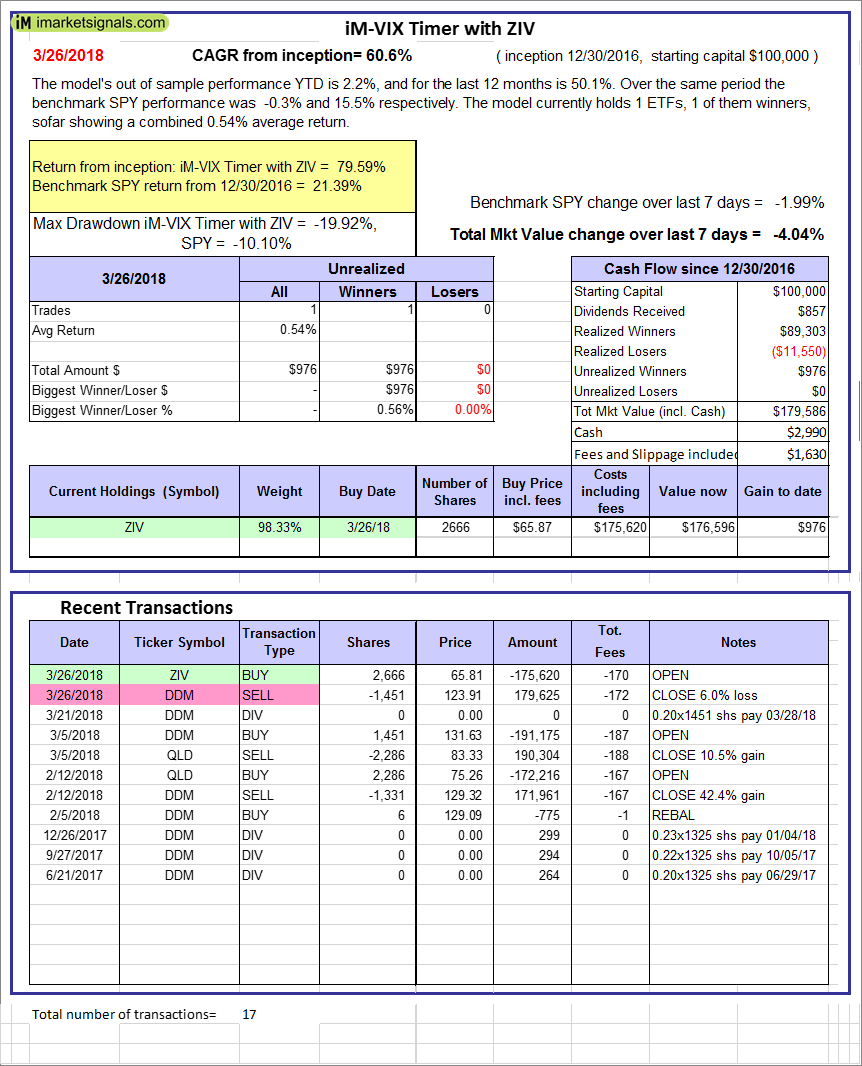 |
iM-VIX Timer with ZIV: The model’s out of sample performance YTD is 2.2%, and for the last 12 months is 50.1%. Over the same period the benchmark SPY performance was -0.3% and 15.5% respectively. Over the previous week the market value of the iM-VIX Timer with ZIV gained -4.04% at a time when SPY gained -1.99%. A starting capital of $100,000 at inception on 6/30/2016 would have grown to $179,586 which includes $2,990 cash and excludes $1,630 spent on fees and slippage. |
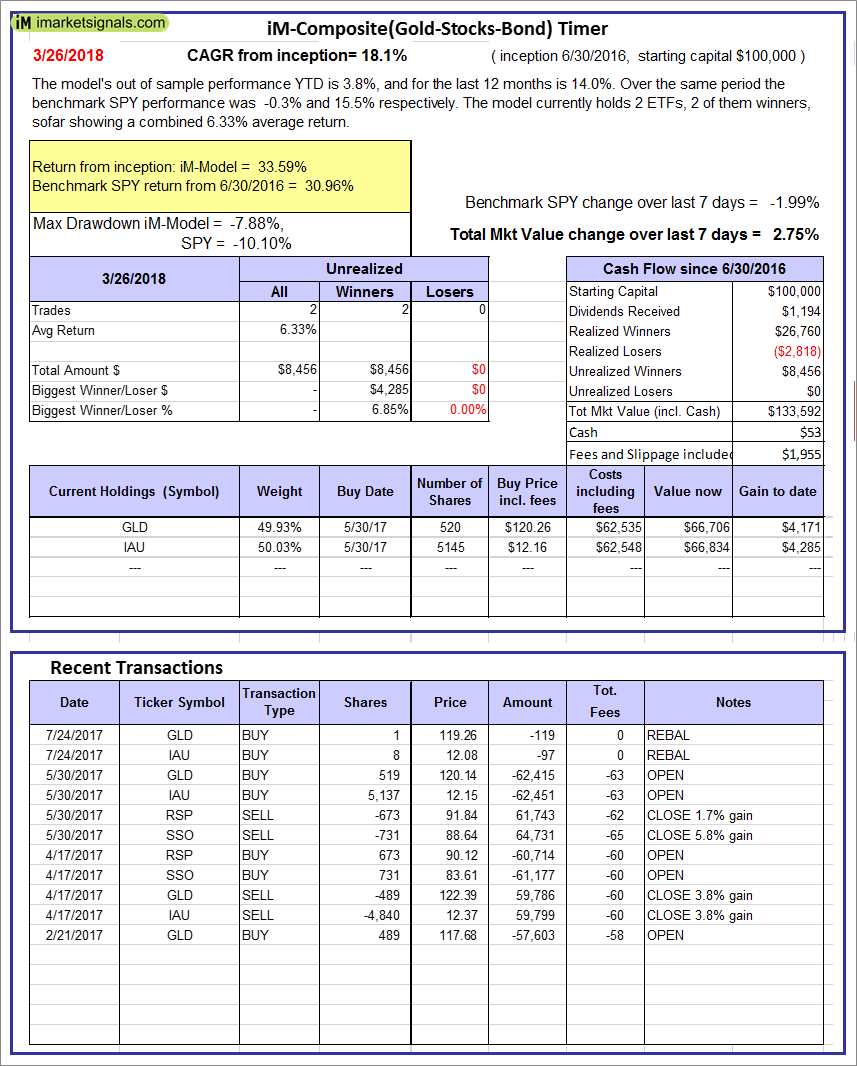 |
iM-Composite(Gold-Stocks-Bond) Timer: The model’s out of sample performance YTD is 3.8%, and for the last 12 months is 14.0%. Over the same period the benchmark SPY performance was -0.3% and 15.5% respectively. Over the previous week the market value of the iM-Composite(Gold-Stocks-Bond) Timer gained 2.75% at a time when SPY gained -1.99%. A starting capital of $100,000 at inception on 6/30/2016 would have grown to $133,592 which includes $53 cash and excludes $1,955 spent on fees and slippage. |
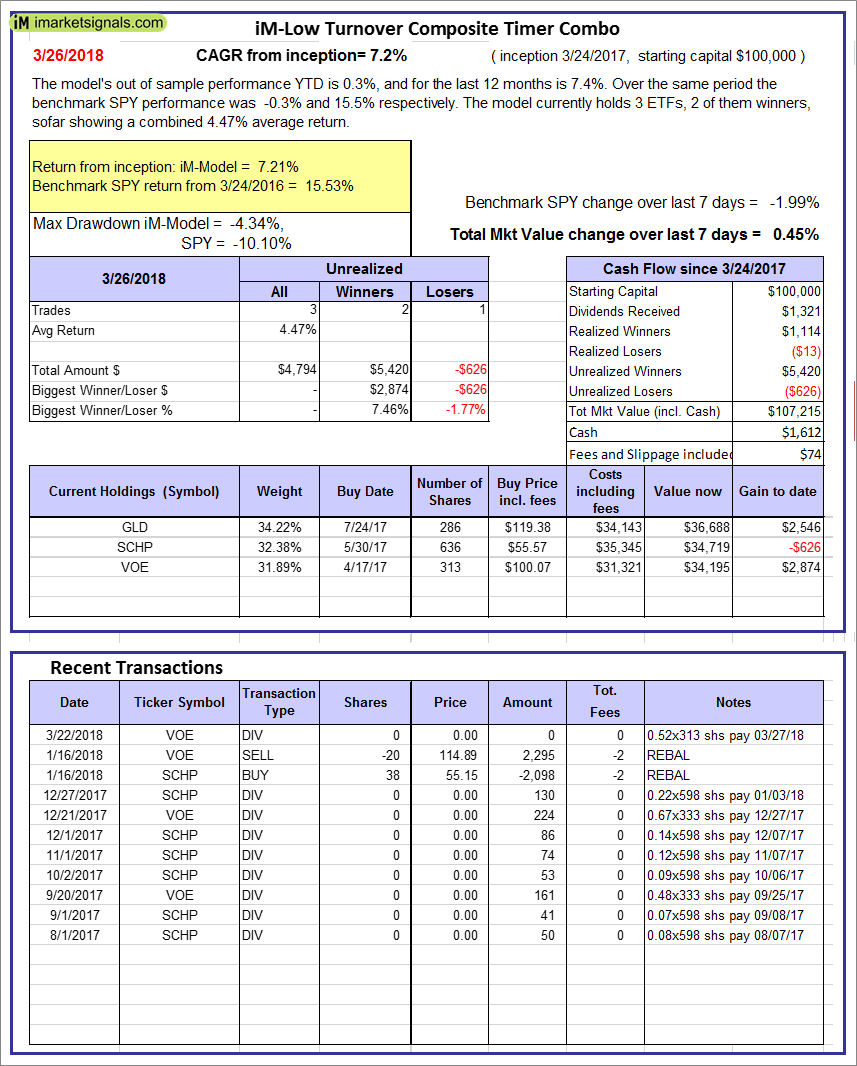 |
iM-Low Turnover Composite Timer Combo: The model’s out of sample performance YTD is 0.3%, and for the last 12 months is 7.4%. Over the same period the benchmark SPY performance was -0.3% and 15.5% respectively. Over the previous week the market value of the iM-Low Turnover Composite Timer Combo gained 0.45% at a time when SPY gained -1.99%. A starting capital of $100,000 at inception on 3/24/27 would have grown to $107,215 which includes $1,612 cash and excludes $74 spent on fees and slippage. |
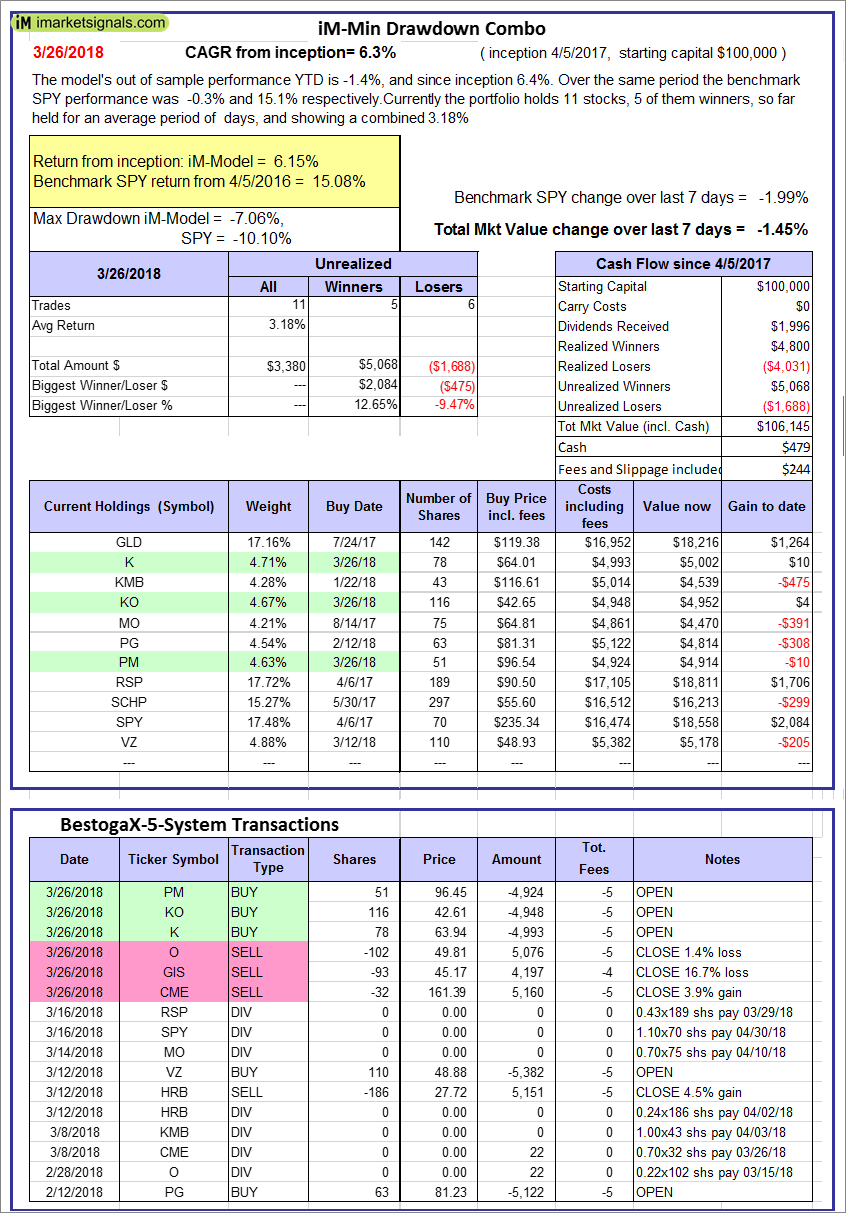 |
iM-Min Drawdown Combo: The model’s out of sample performance YTD is -1.4%, and since inception 6.4%. Over the same period the benchmark SPY performance was -0.3% and 15.1% respectively. Over the previous week the market value of the iM-Min Drawdown Combo gained -1.45% at a time when SPY gained -1.99%. A starting capital of $100,000 at inception on 4/5/2017 would have grown to $106,145 which includes $479 cash and excludes $244 spent on fees and slippage. |
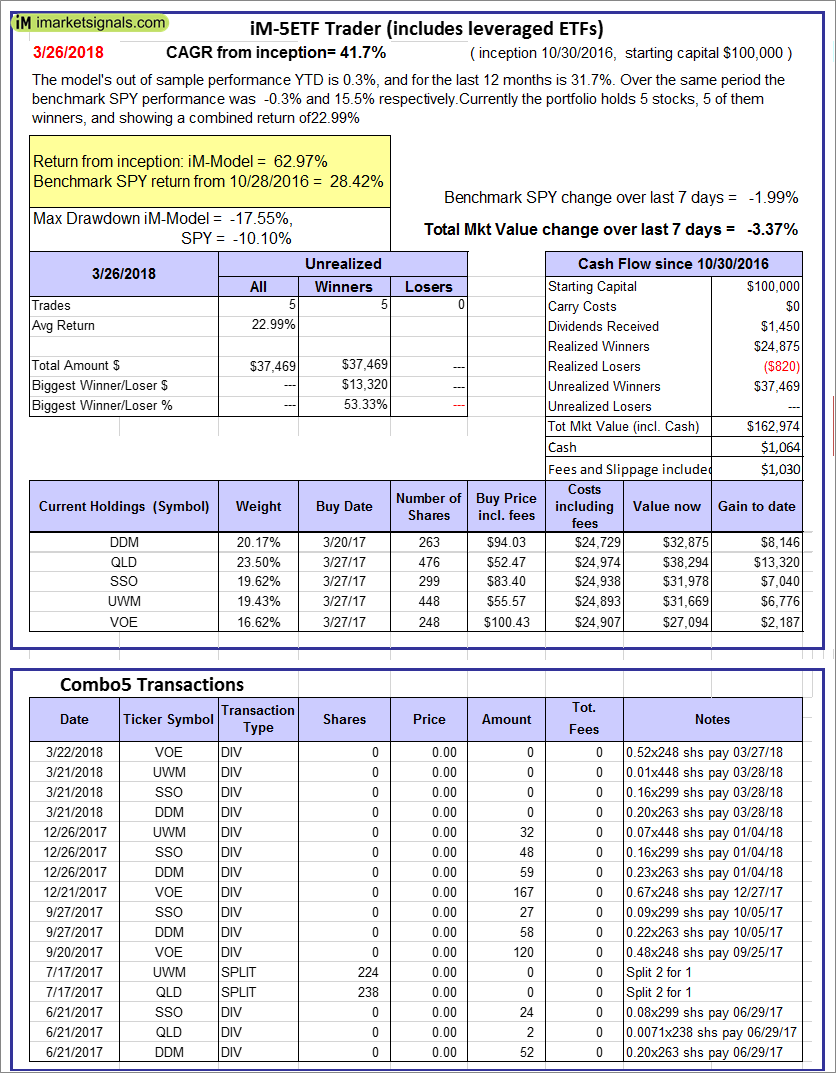 |
iM-5ETF Trader (includes leveraged ETFs): The model’s out of sample performance YTD is 0.3%, and for the last 12 months is 31.7%. Over the same period the benchmark SPY performance was -0.3% and 15.5% respectively. Over the previous week the market value of the iM-5ETF Trader (includes leveraged ETFs) gained -3.37% at a time when SPY gained -1.99%. A starting capital of $100,000 at inception on 10/30/2016 would have grown to $162,974 which includes $1,064 cash and excludes $1,030 spent on fees and slippage. |
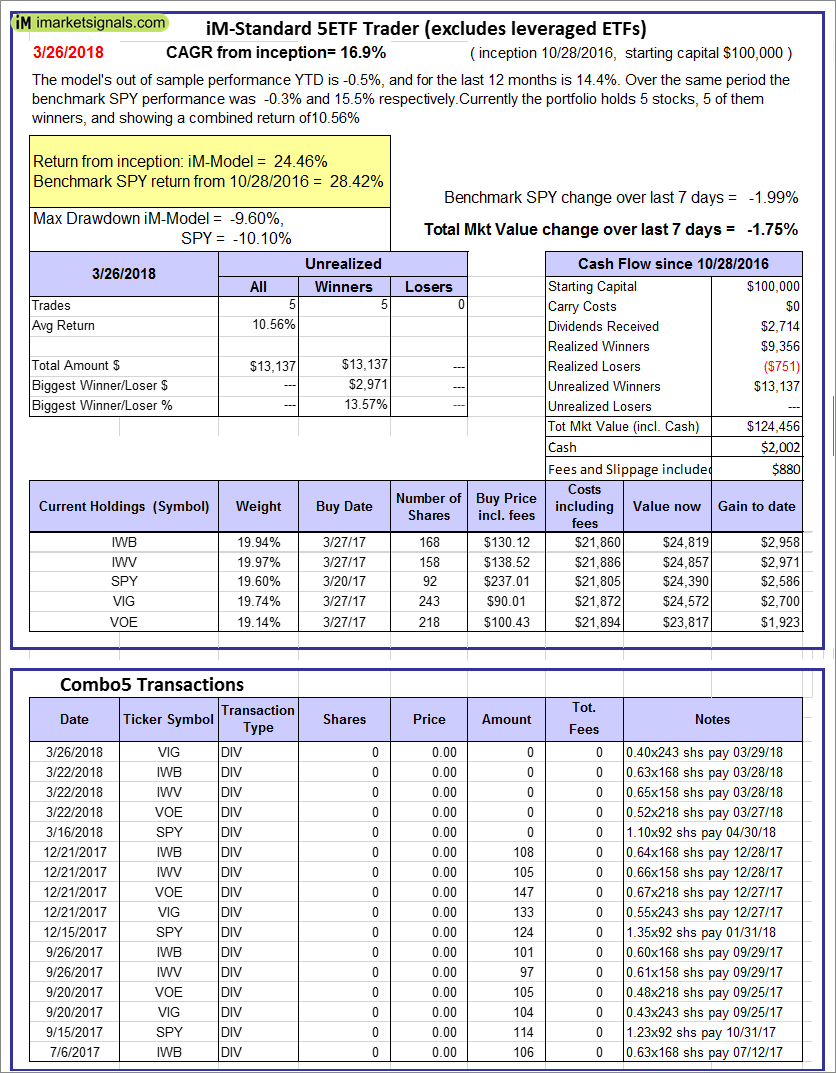 |
iM-Standard 5ETF Trader (excludes leveraged ETFs): The model’s out of sample performance YTD is -0.5%, and for the last 12 months is 14.4%. Over the same period the benchmark SPY performance was -0.3% and 15.5% respectively. Over the previous week the market value of the iM-Standard 5ETF Trader (excludes leveraged ETFs) gained -1.75% at a time when SPY gained -1.99%. A starting capital of $100,000 at inception on 10/30/2016 would have grown to $124,456 which includes $2,002 cash and excludes $880 spent on fees and slippage. |
iM-Best Reports – 3/26/2018
Posted in pmp SPY-SH
Leave a Reply
You must be logged in to post a comment.