  |
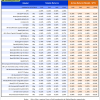
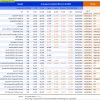
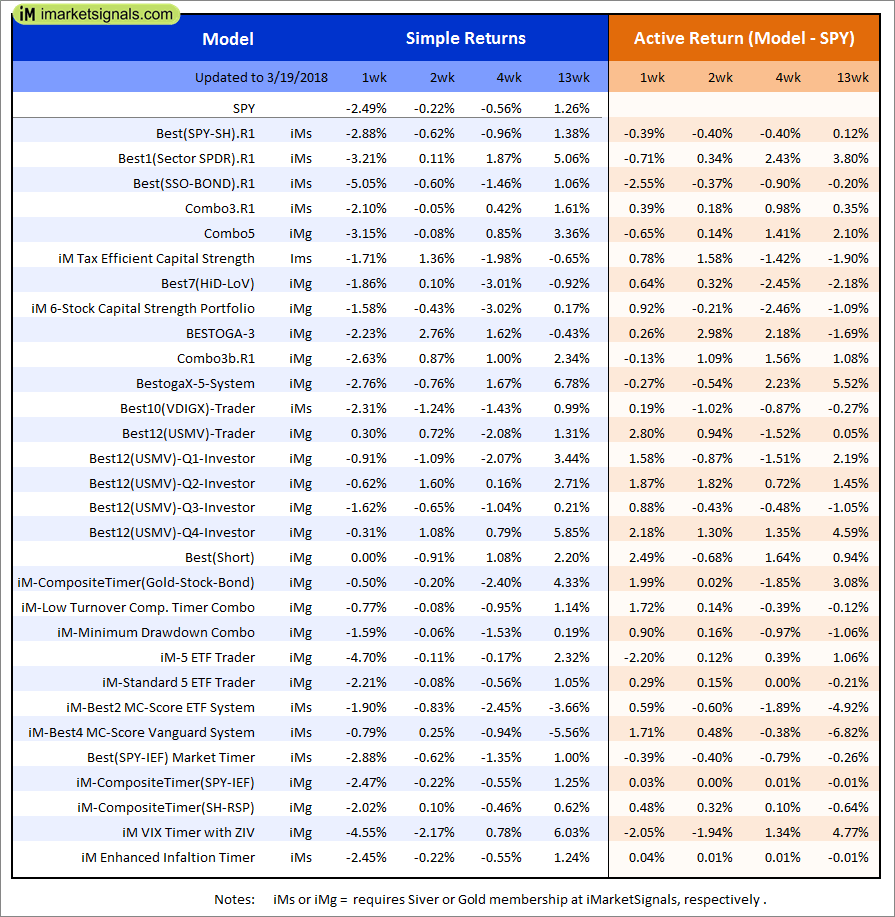
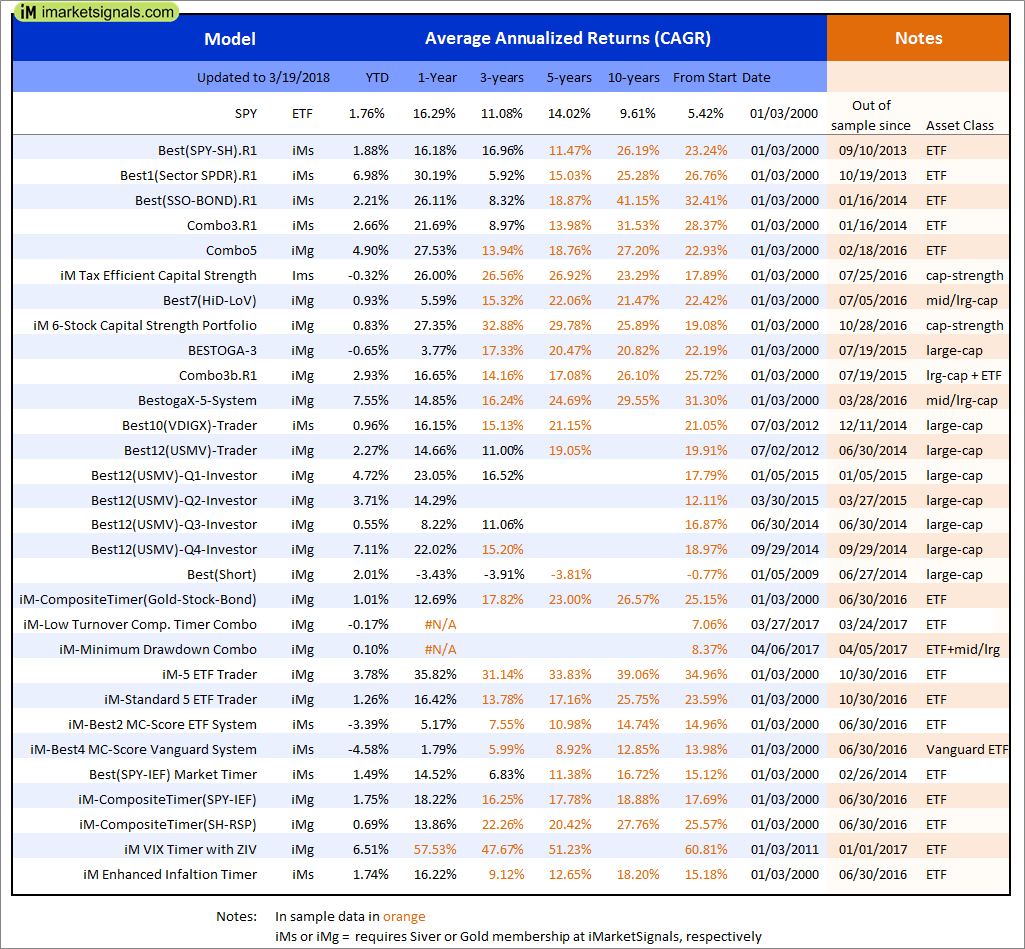
Out of sample performance summary of our models for the past 1, 2, 4 and 13 week periods. The active active return indicates how the models over- or underperformed the benchmark ETF SPY. Also the YTD, and the 1-, 3-, 5- and 10-year annualized returns are shown in the second table |
|
|
iM-Best(SPY-SH).R1: The model’s out of sample performance YTD is 1.8%, and for the last 12 months is 16.7%. Over the same period the benchmark SPY performance was 1.8% and 16.3% respectively. Over the previous week the market value of Best(SPY-SH) gained -2.49% at a time when SPY gained -2.49%. A starting capital of $100,000 at inception on 1/2/2009 would have grown to $572,856 which includes -$42 cash and excludes $15,368 spent on fees and slippage. |
|
|
iM-Combo3.R1: The model’s out of sample performance YTD is 2.7%, and for the last 12 months is 22.0%. Over the same period the benchmark SPY performance was 1.8% and 16.3% respectively. Over the previous week the market value of iM-Combo3.R1 gained -1.87% at a time when SPY gained -2.49%. A starting capital of $100,000 at inception on 2/3/2014 would have grown to $161,879 which includes -$2,678 cash and excludes $3,557 spent on fees and slippage. |
|
|
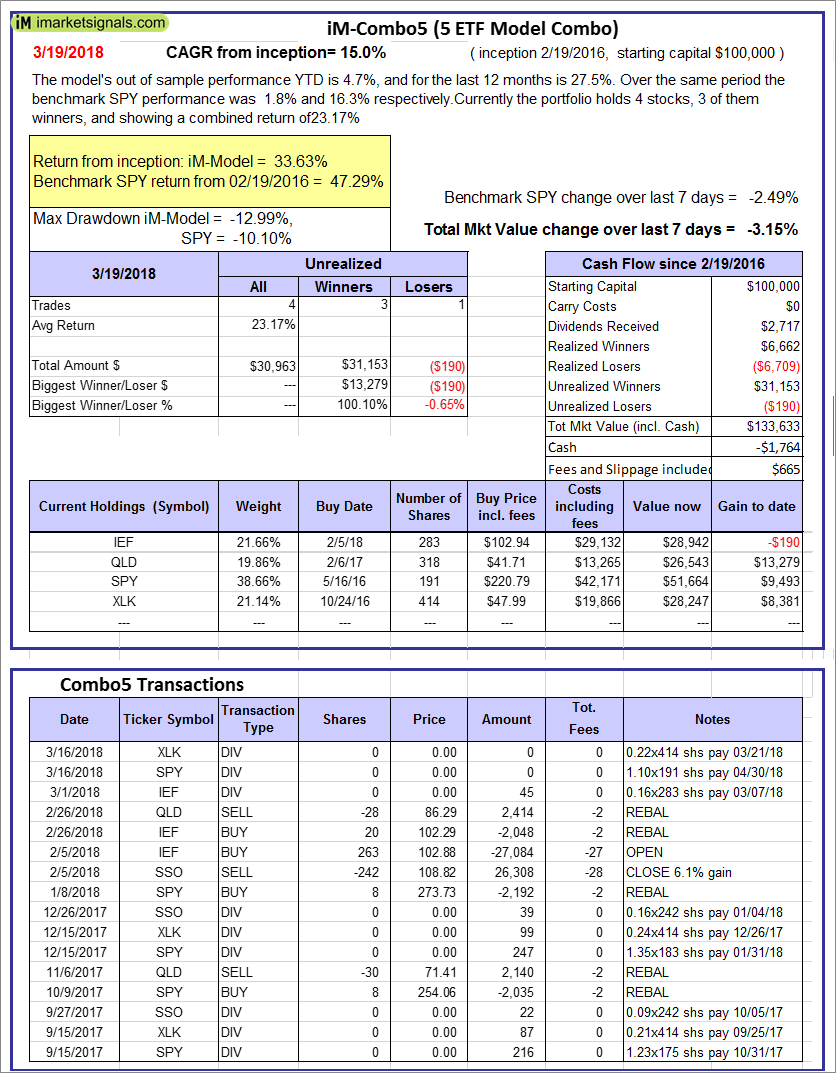
iM-Combo5: The model’s out of sample performance YTD is 4.7%, and for the last 12 months is 27.5%. Over the same period the benchmark SPY performance was 1.8% and 16.3% respectively. Over the previous week the market value of iM-Combo5 gained -3.15% at a time when SPY gained -2.49%. A starting capital of $100,000 at inception on 2/22/2016 would have grown to $133,633 which includes -$1,764 cash and excludes $665 spent on fees and slippage. |
|
|
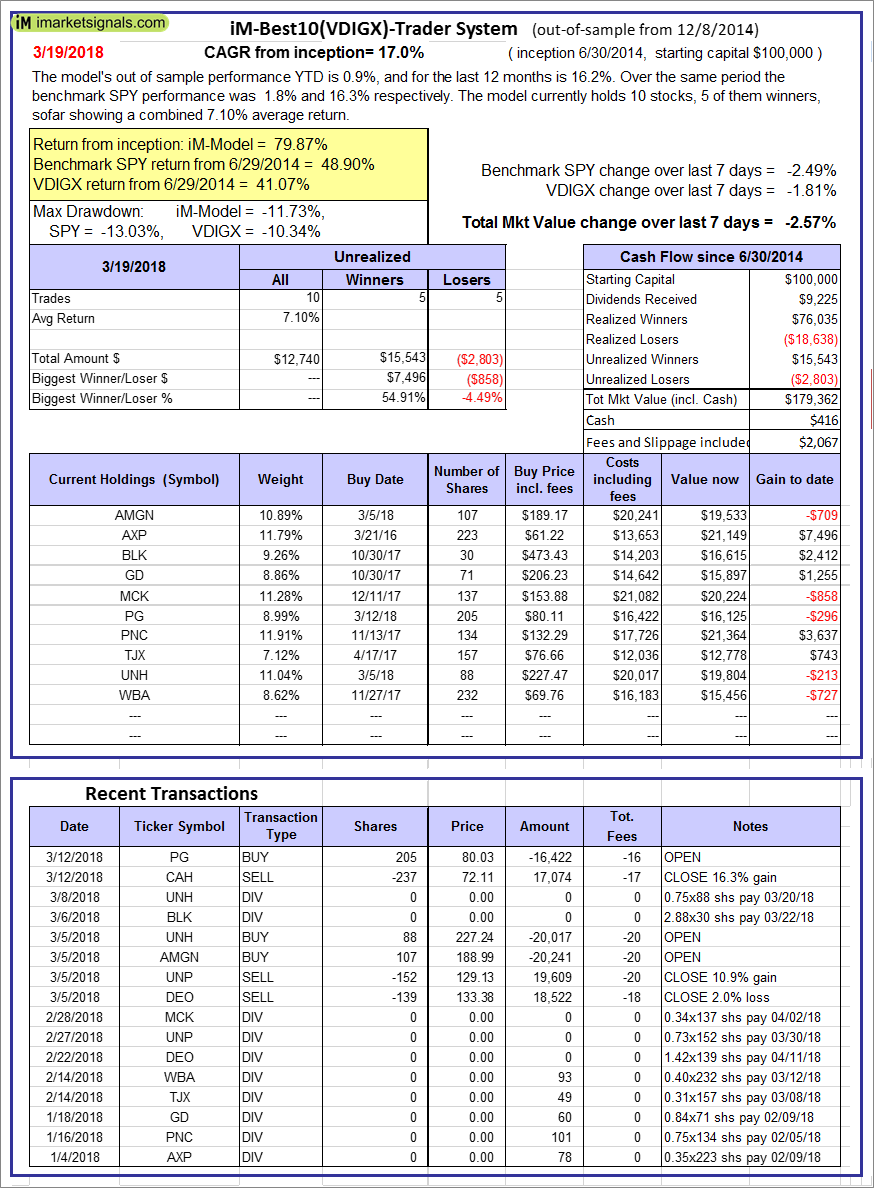
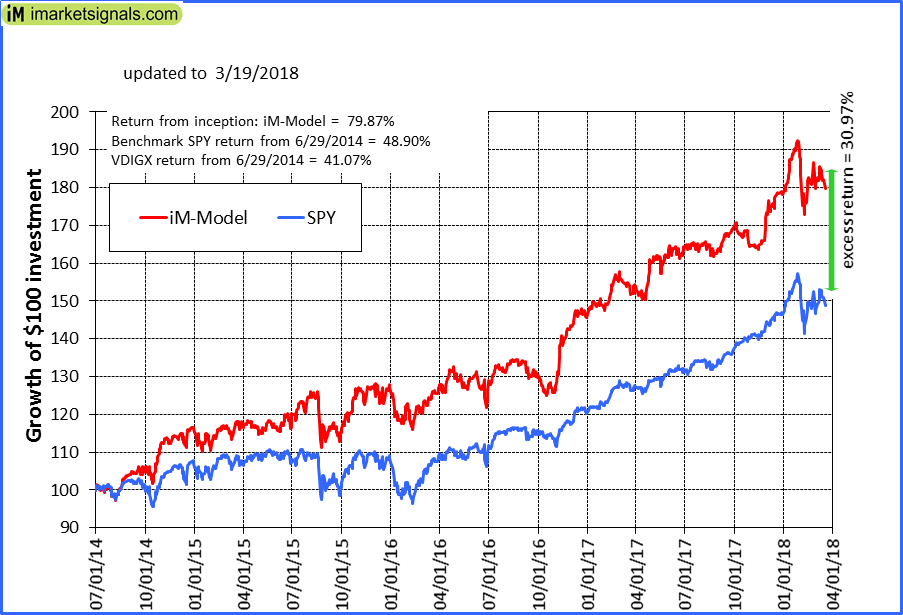
iM-Best10(VDIGX)-Trader: The model’s out of sample performance YTD is 0.9%, and for the last 12 months is 16.2%. Over the same period the benchmark SPY performance was 1.8% and 16.3% respectively. Since inception, on 7/1/2014, the model gained 79.87% while the benchmark SPY gained 48.90% and VDIGX gained 41.07% over the same period. Over the previous week the market value of iM-Best10(VDIGX) gained -2.57% at a time when SPY gained -2.49%. A starting capital of $100,000 at inception on 7/1/2014 would have grown to $179,362 which includes $416 cash and excludes $2,067 spent on fees and slippage. |
|
|
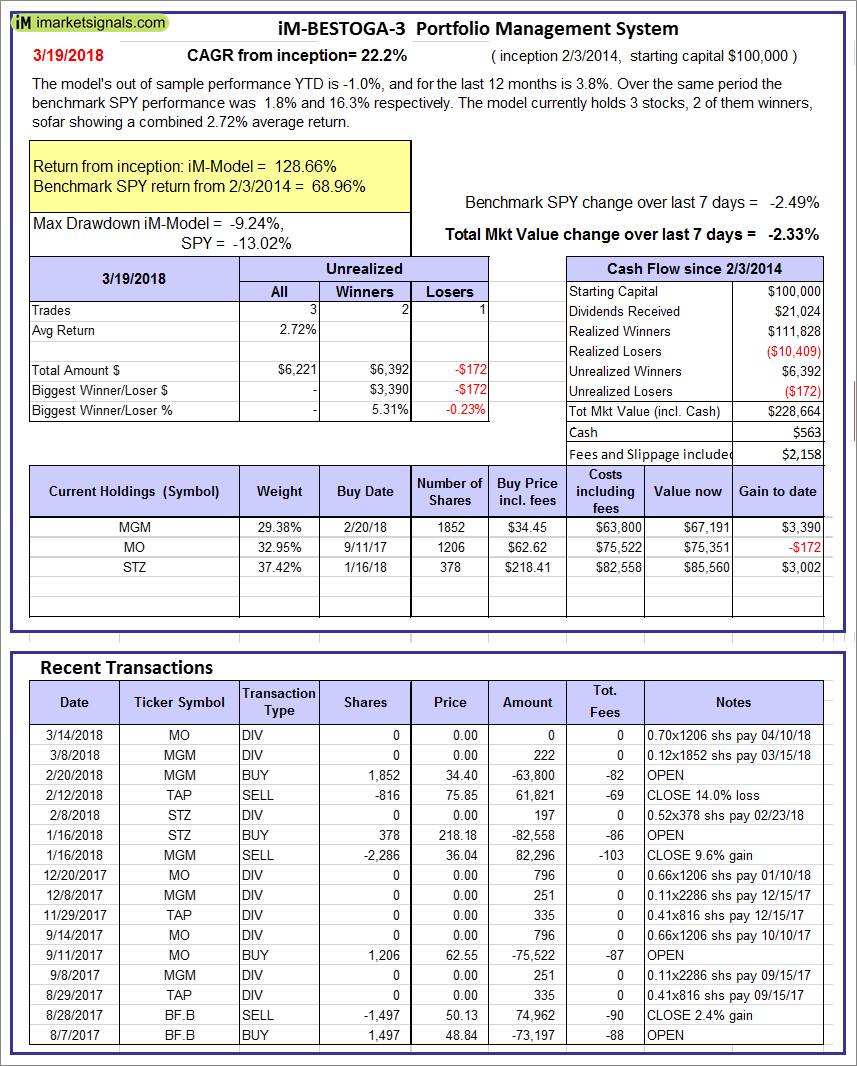
iM-BESTOGA-3: The model’s out of sample performance YTD is -1.0%, and for the last 12 months is 3.8%. Over the same period the benchmark SPY performance was 1.8% and 16.3% respectively. Over the previous week the market value of iM-BESTOGA-3 gained -2.33% at a time when SPY gained -2.49%. A starting capital of $100,000 at inception on 2/3/2014 would have grown to $228,664 which includes $563 cash and excludes $2,158 spent on fees and slippage. |
|
|
iM-Best7(HiD-LoV): The model’s out of sample performance YTD is 0.2%, and for the last 12 months is 5.6%. Over the same period the benchmark SPY performance was 1.8% and 16.3% respectively. Over the previous week the market value of iM-BESTOGA-3 gained -2.22% at a time when SPY gained -2.49%. A starting capital of $100,000 at inception on 6/30/2016 would have grown to $112,997 which includes $20 cash and excludes $1,673 spent on fees and slippage. |
|
|
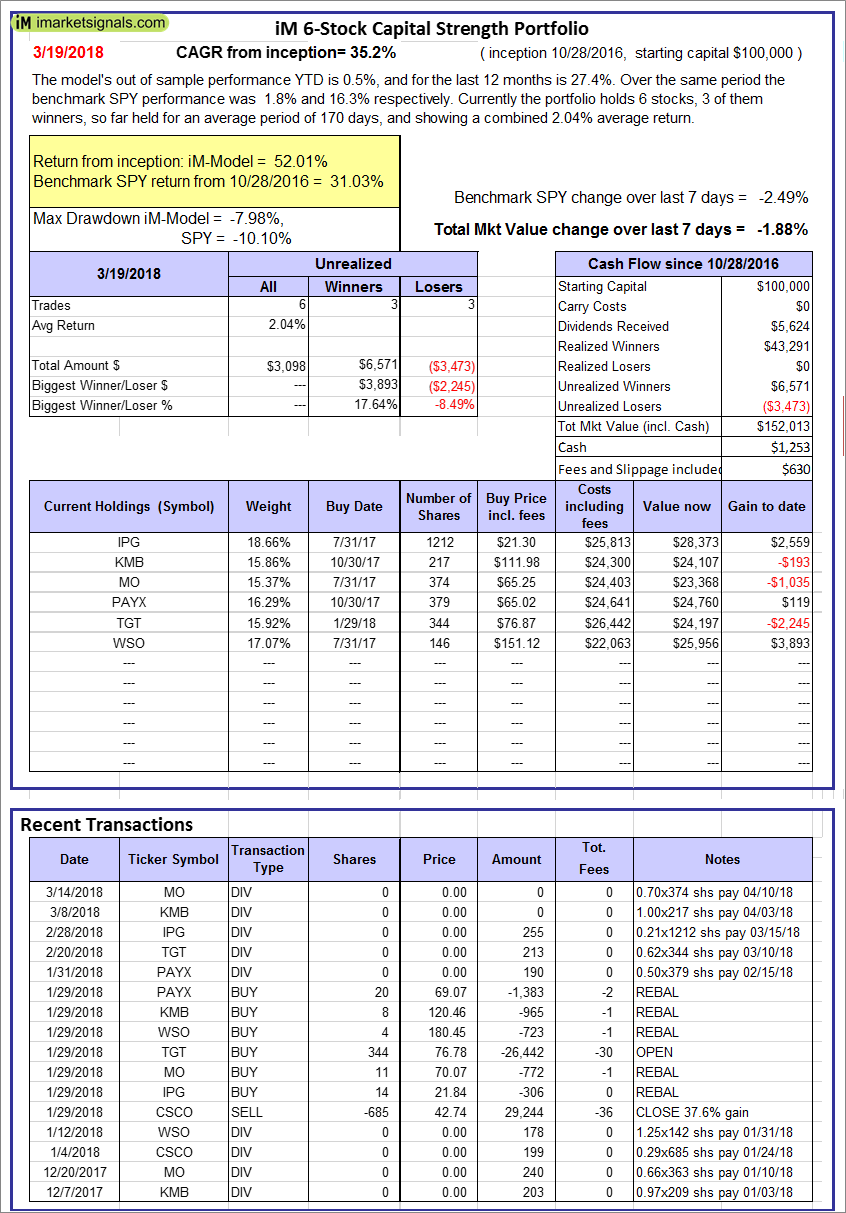
iM 6-Stock Capital Strength Portfolio: The model’s out of sample performance YTD is 0.5%, and for the last 12 months is 27.4%. Over the same period the benchmark SPY performance was 1.8% and 16.3% respectively. Over the previous week the market value of the iM 6-Stock Capital Strength Portfolio gained -1.88% at a time when SPY gained -2.49%. A starting capital of $100,000 at inception on 10/28/2016 would have grown to $152,013 which includes $1,253 cash and excludes $630 spent on fees and slippage. |
|
|
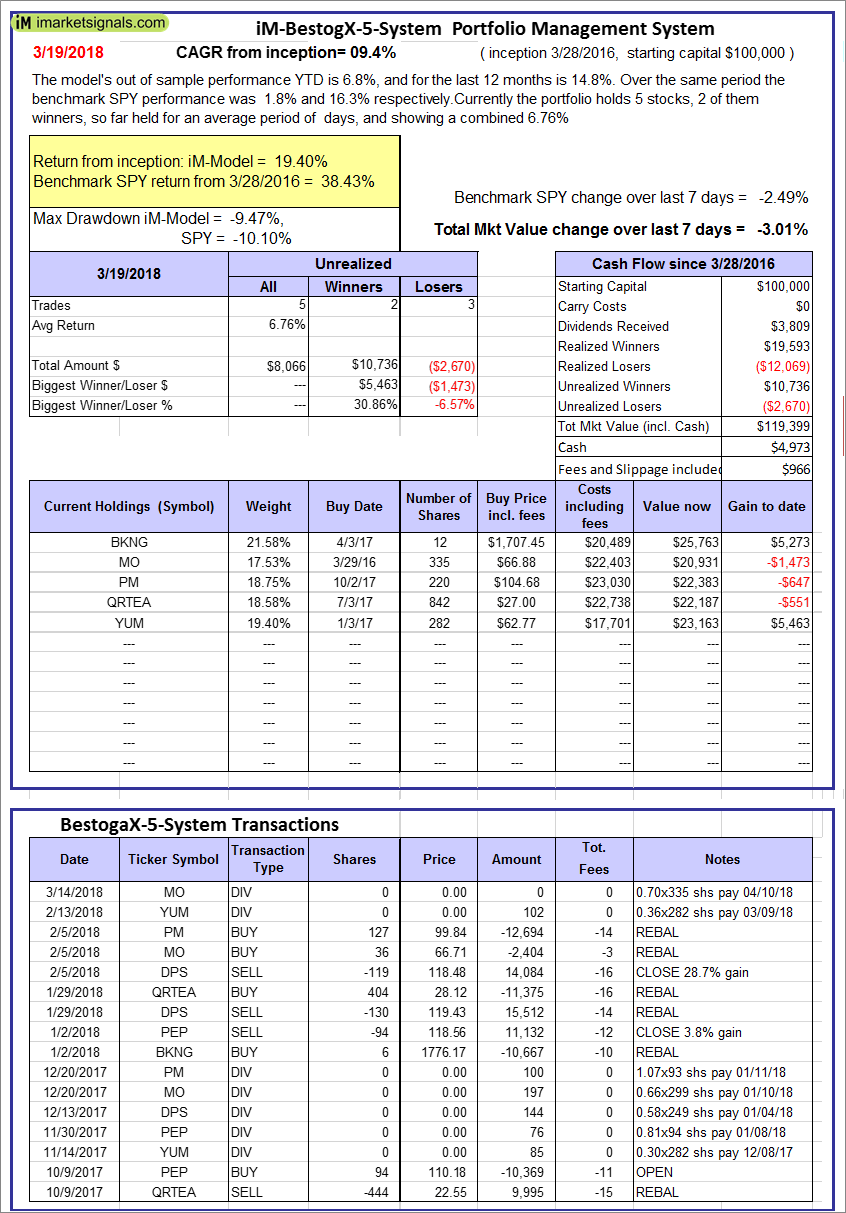
iM-BestogaX5-System: The model’s out of sample performance YTD is 6.8%, and for the last 12 months is 14.8%. Over the same period the benchmark SPY performance was 1.8% and 16.3% respectively. Over the previous week the market value of iM-BestogaX5-System gained -3.01% at a time when SPY gained -2.49%. A starting capital of $100,000 at inception on 3/28/2016 would have grown to $119,399 which includes $4,973 cash and excludes $966 spent on fees and slippage. |
|
|
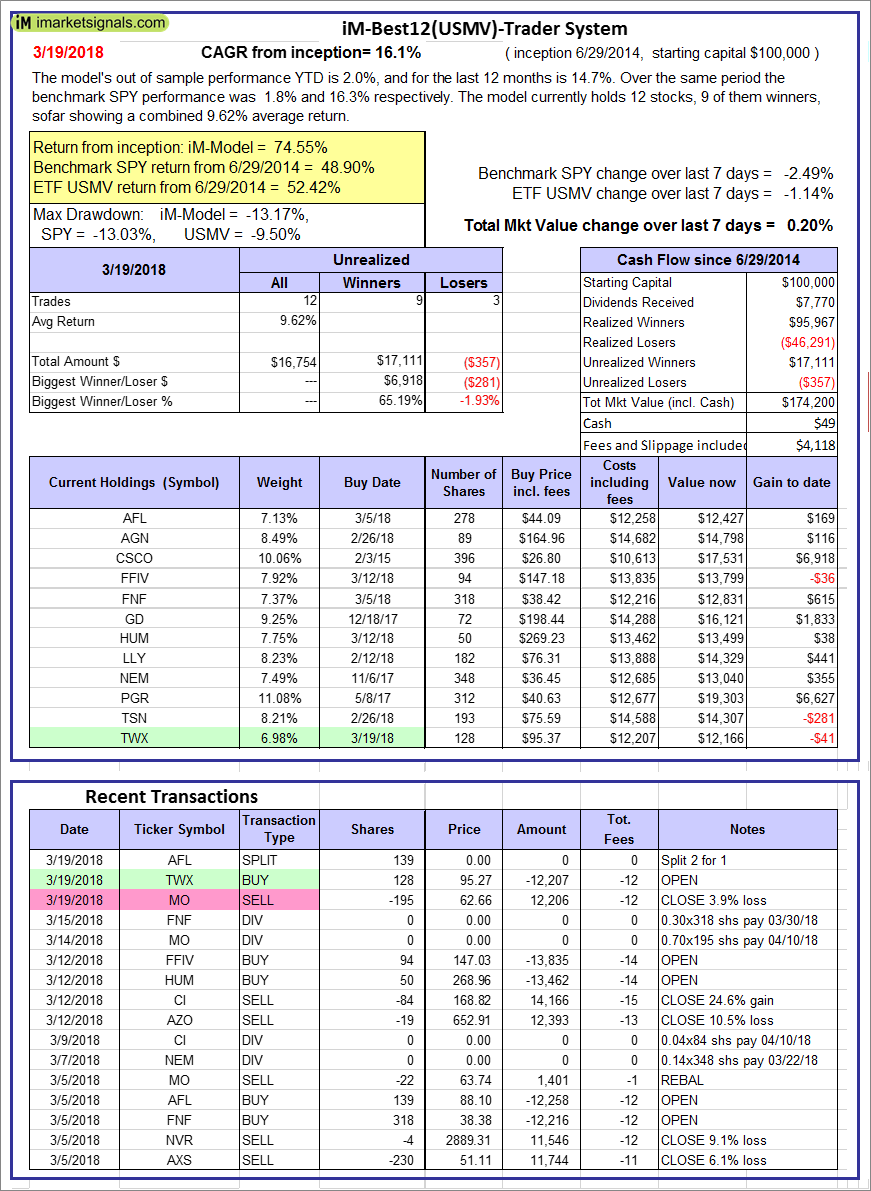
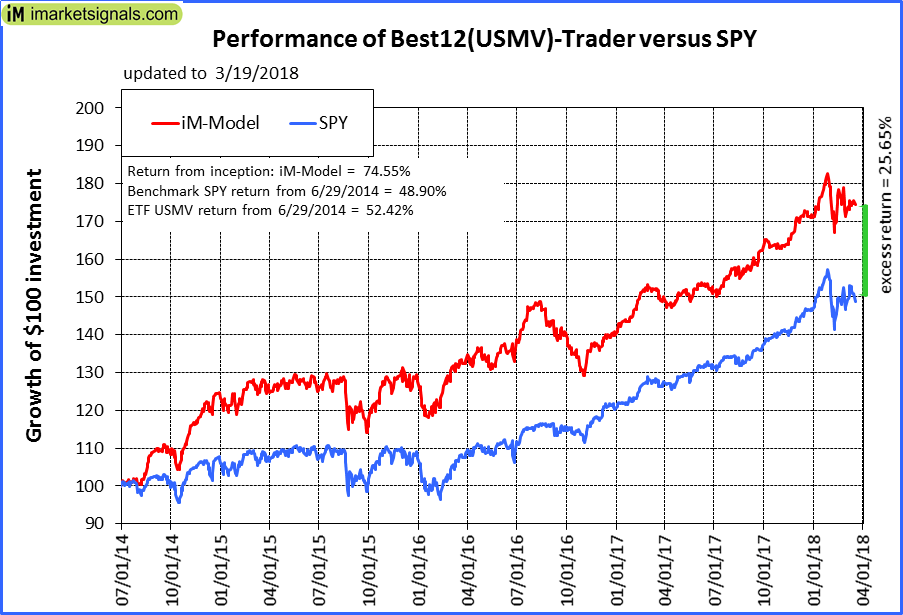
iM-Best12(USMV)-Trader: The model’s out of sample performance YTD is 2.0%, and for the last 12 months is 14.7%. Over the same period the benchmark SPY performance was 1.8% and 16.3% respectively. Since inception, on 6/30/2014, the model gained 74.55% while the benchmark SPY gained 48.90% and the ETF USMV gained 52.42% over the same period. Over the previous week the market value of iM-Best12(USMV)-Trader gained 0.20% at a time when SPY gained -2.49%. A starting capital of $100,000 at inception on 6/30/2014 would have grown to $174,200 which includes $49 cash and excludes $4,118 spent on fees and slippage. |
|
|
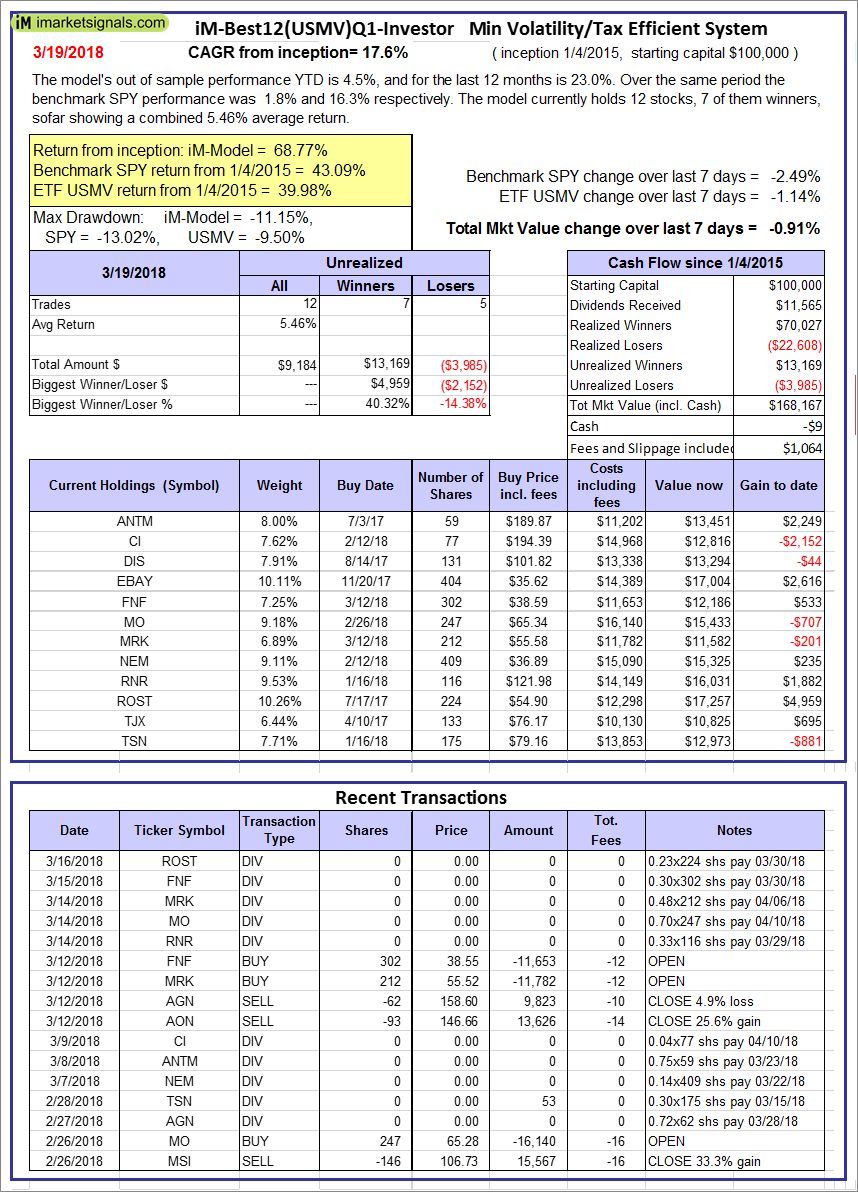
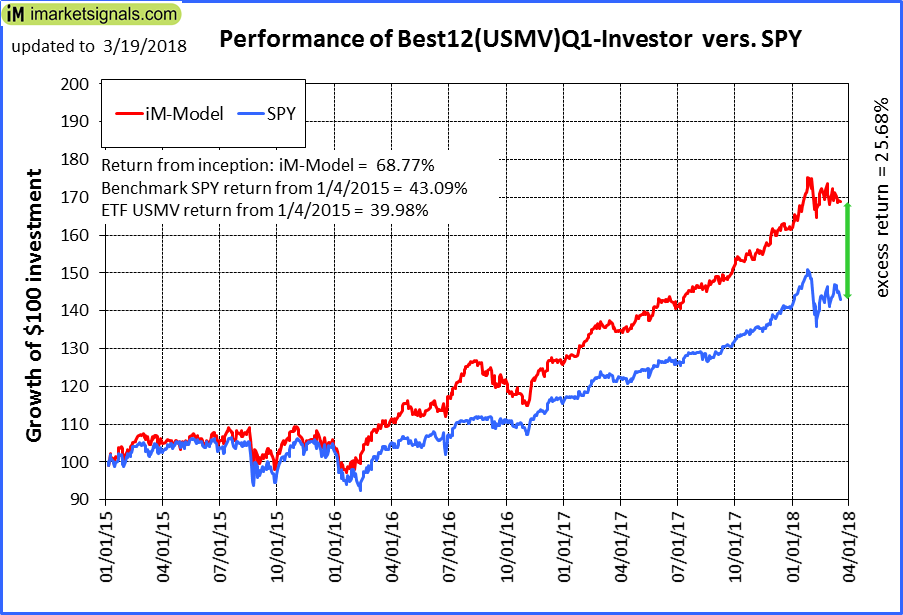
iM-Best12(USMV)Q1-Investor: The model’s out of sample performance YTD is 4.5%, and for the last 12 months is 23.0%. Over the same period the benchmark SPY performance was 1.8% and 16.3% respectively. Since inception, on 1/5/2015, the model gained 68.77% while the benchmark SPY gained 43.09% and the ETF USMV gained 39.98% over the same period. Over the previous week the market value of iM-Best12(USMV)Q1 gained -0.91% at a time when SPY gained -2.49%. A starting capital of $100,000 at inception on 1/5/2015 would have grown to $168,167 which includes -$9 cash and excludes $1,064 spent on fees and slippage. |
|
|
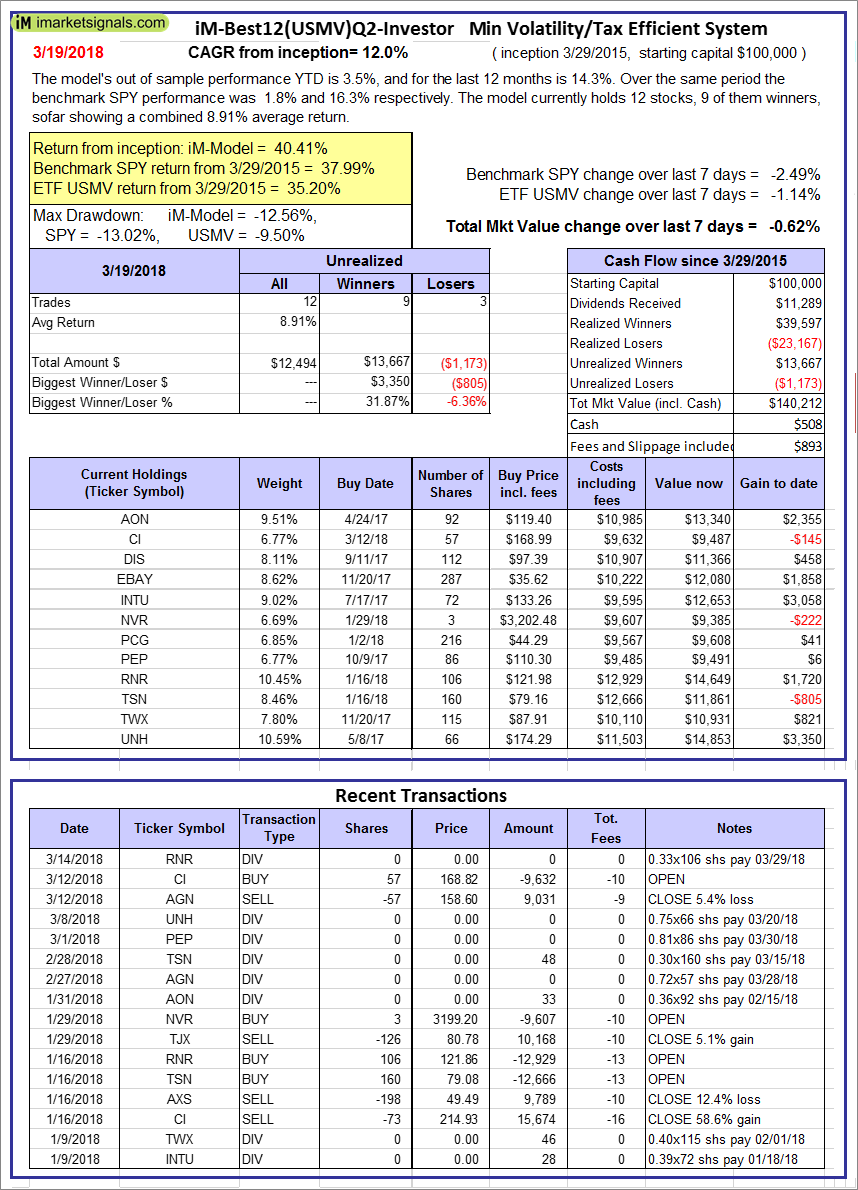
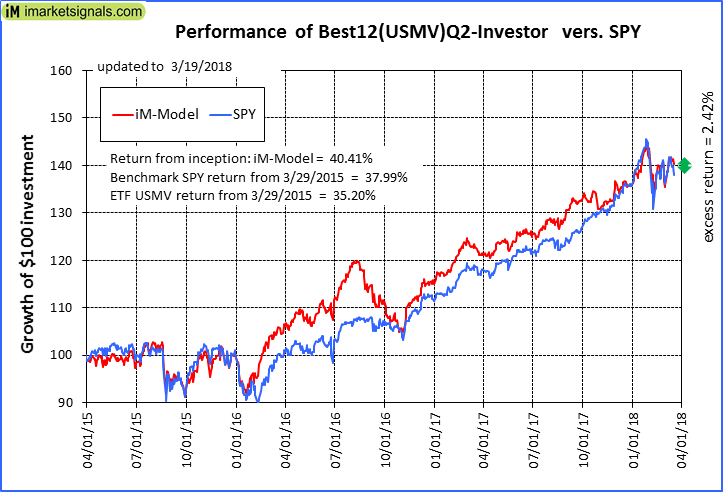
iM-Best12(USMV)Q2-Investor: The model’s out of sample performance YTD is 3.5%, and for the last 12 months is 14.3%. Over the same period the benchmark SPY performance was 1.8% and 16.3% respectively. Since inception, on 3/30/2015, the model gained 40.41% while the benchmark SPY gained 37.99% and the ETF USMV gained 35.20% over the same period. Over the previous week the market value of iM-Best12(USMV)Q2 gained -0.62% at a time when SPY gained -2.49%. A starting capital of $100,000 at inception on 3/30/2015 would have grown to $140,212 which includes $508 cash and excludes $893 spent on fees and slippage. |
|
|
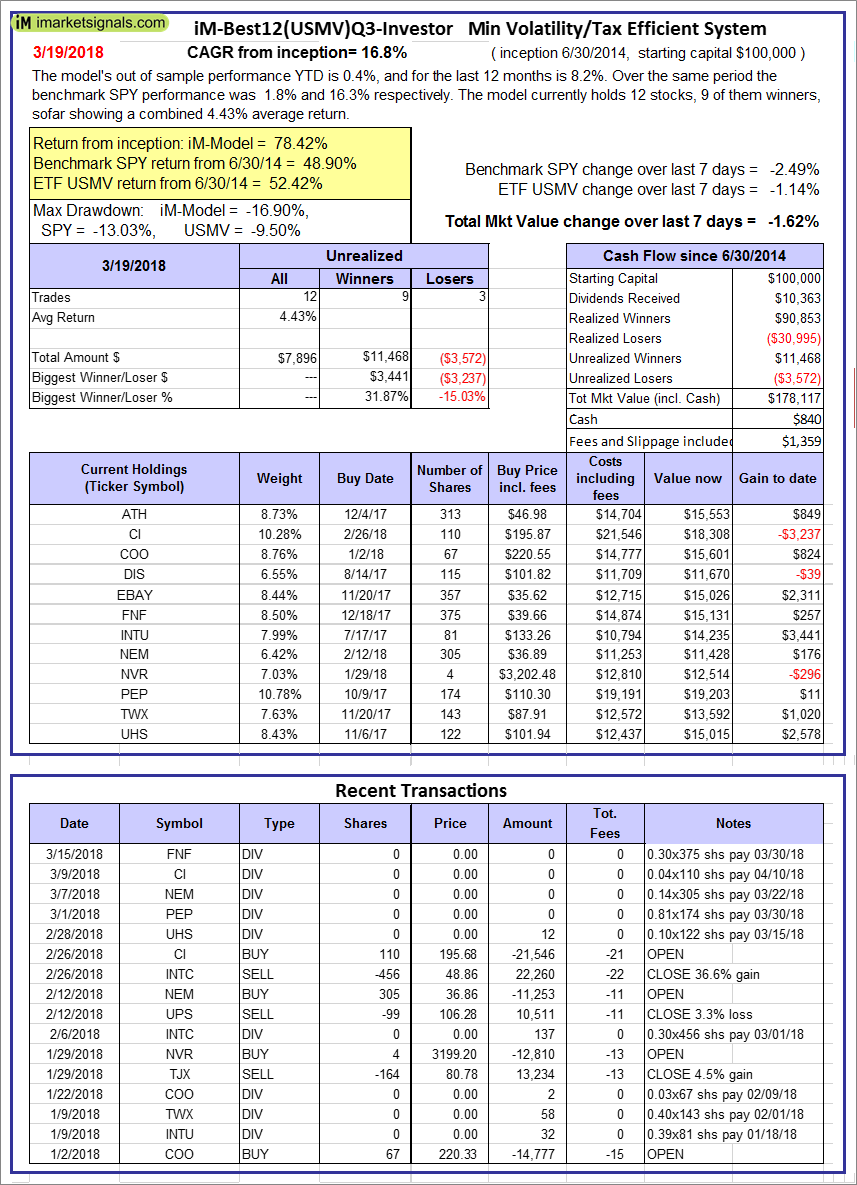
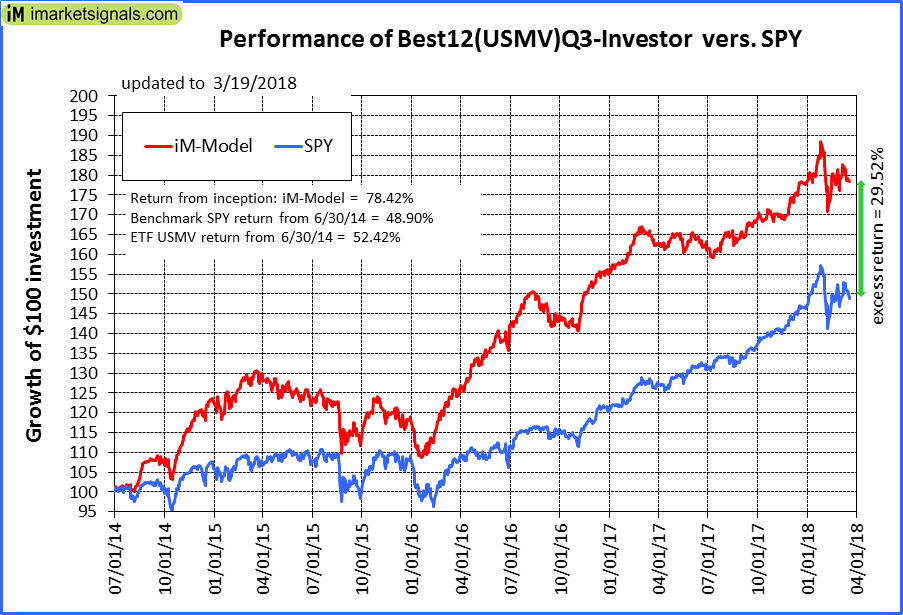
iM-Best12(USMV)Q3-Investor: The model’s out of sample performance YTD is 0.4%, and for the last 12 months is 8.2%. Over the same period the benchmark SPY performance was 1.8% and 16.3% respectively. Since inception, on 7/1/2014, the model gained 78.42% while the benchmark SPY gained 48.90% and the ETF USMV gained 52.42% over the same period. Over the previous week the market value of iM-Best12(USMV)Q3 gained -1.62% at a time when SPY gained -2.49%. A starting capital of $100,000 at inception on 7/1/2014 would have grown to $178,117 which includes $840 cash and excludes $1,359 spent on fees and slippage. |
|
|
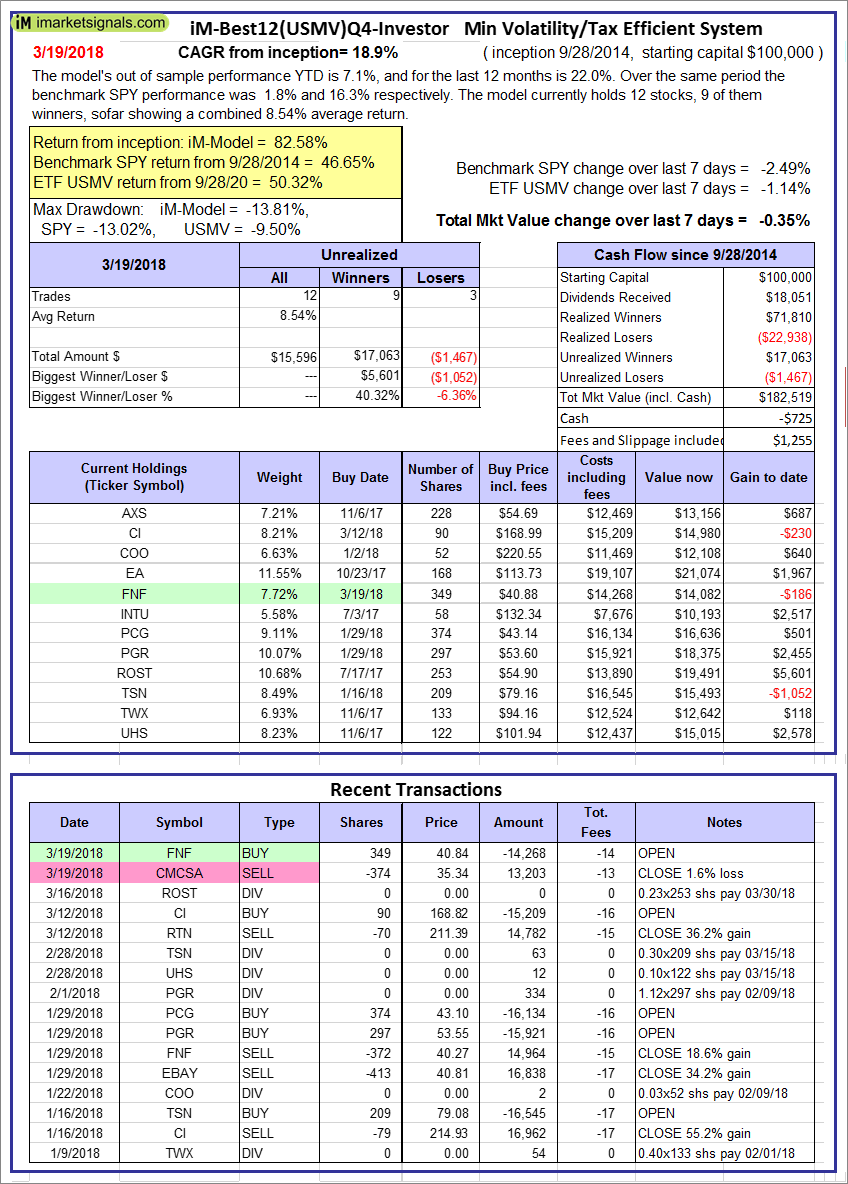
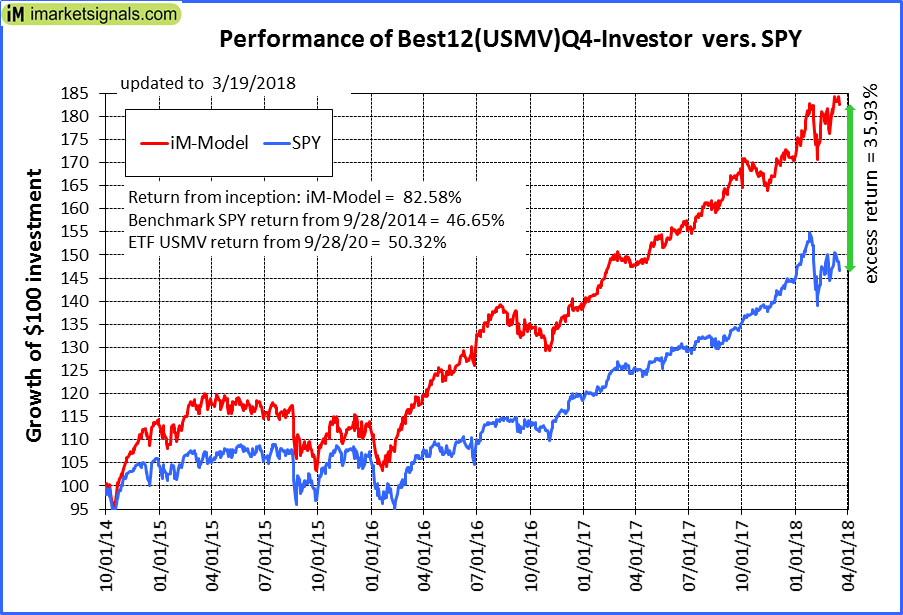
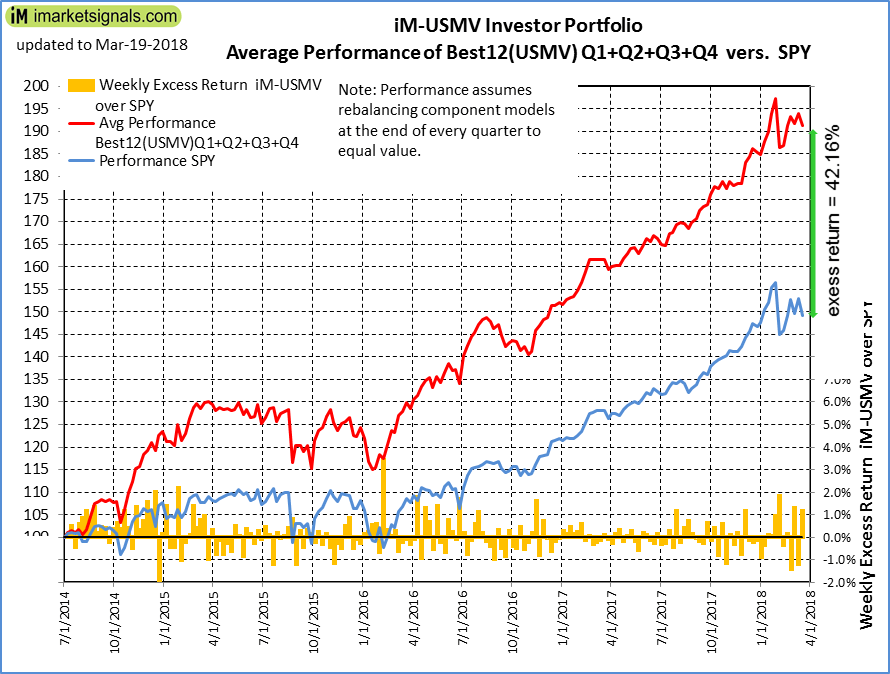
iM-Best12(USMV)Q4-Investor: Since inception, on 9/29/2014, the model gained 82.58% while the benchmark SPY gained 46.65% and the ETF USMV gained 50.32% over the same period. Over the previous week the market value of iM-Best12(USMV)Q4 gained -0.35% at a time when SPY gained -2.49%. A starting capital of $100,000 at inception on 9/29/2014 would have grown to $182,519 which includes -$725 cash and excludes $1,255 spent on fees and slippage. |
|
|
Average Performance of iM-Best12(USMV)Q1+Q2+Q3+Q4-Investor resulted in an excess return of 42.16% over SPY. (see iM-USMV Investor Portfolio) |
|
|
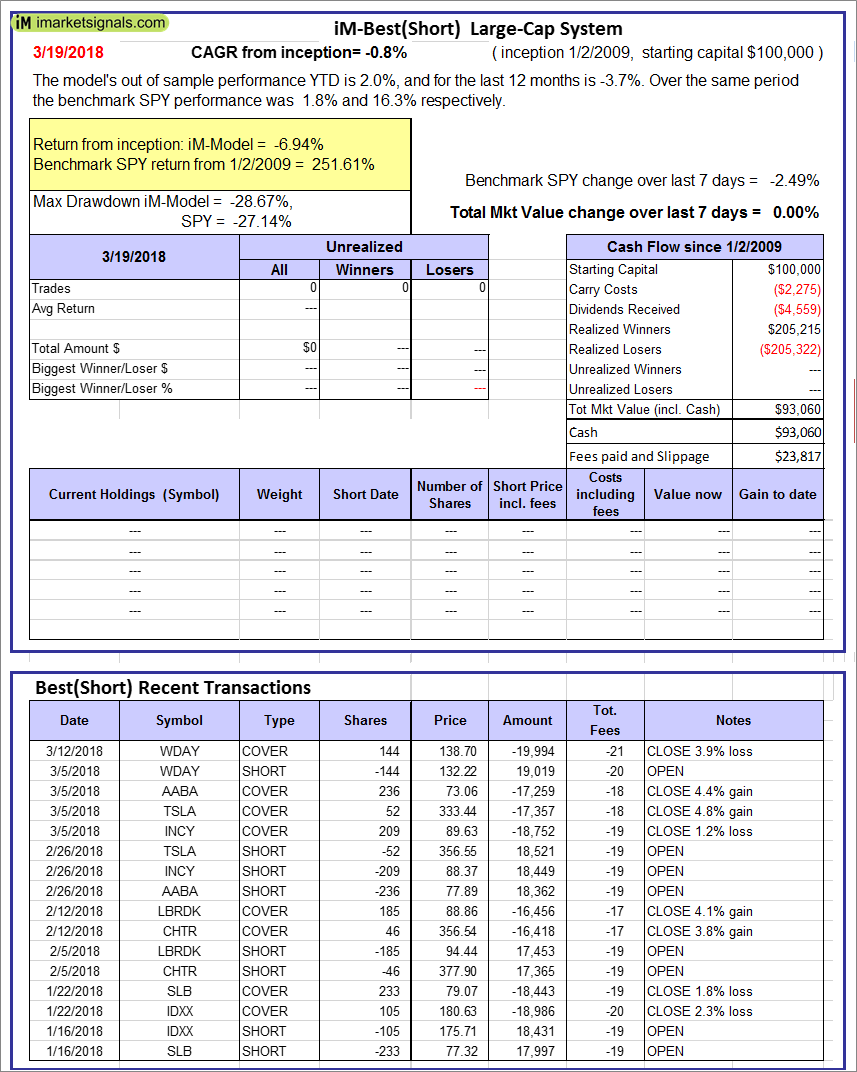
iM-Best(Short): The model’s out of sample performance YTD is 2.0%, and for the last 12 months is -3.7%. Over the same period the benchmark SPY performance was 1.8% and 16.3% respectively. Over the previous week the market value of iM-Best(Short) gained 0.00% at a time when SPY gained -2.49%. Over the period 1/2/2009 to 3/19/2018 the starting capital of $100,000 would have grown to $93,060 which includes $93,060 cash and excludes $23,817 spent on fees and slippage. |
|
|
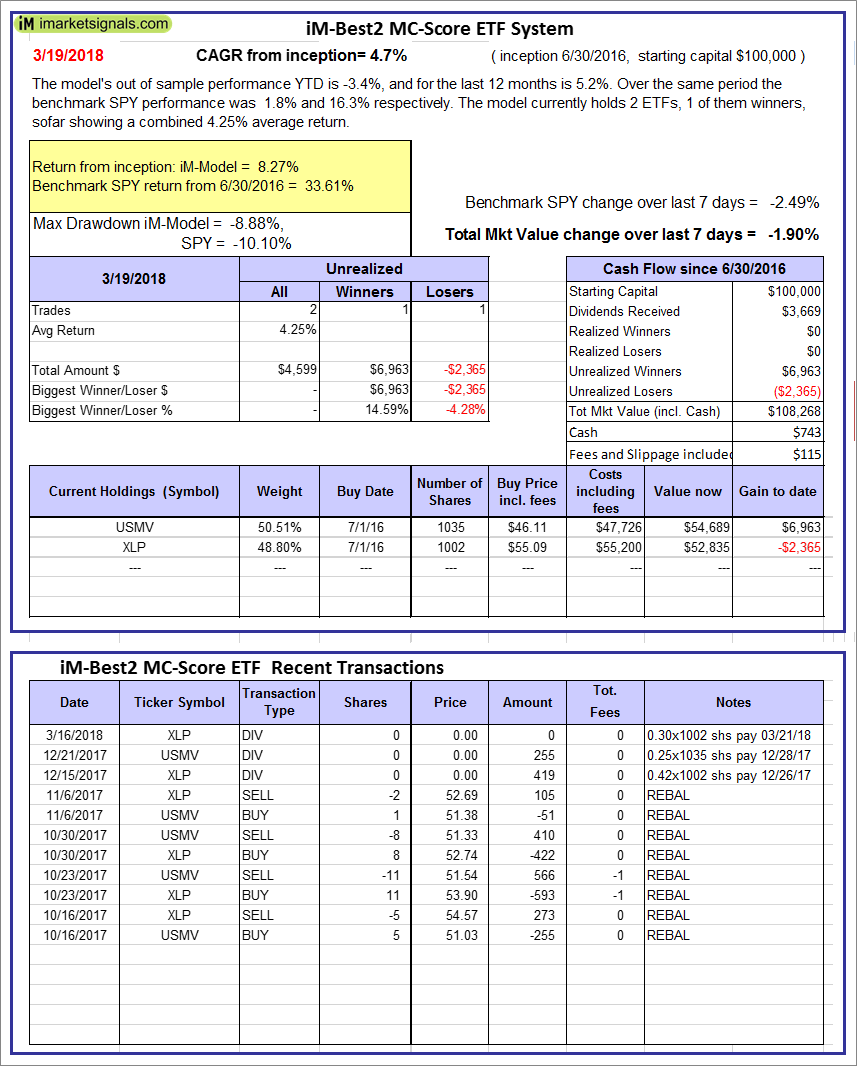
iM-Best2 MC-Score ETF System: The model’s out of sample performance YTD is -3.4%, and for the last 12 months is 5.2%. Over the same period the benchmark SPY performance was 1.8% and 16.3% respectively. Over the previous week the market value of the iM-Best2 MC-Score ETF System gained -1.90% at a time when SPY gained -2.49%. A starting capital of $100,000 at inception on 6/30/2016 would have grown to $108,268 which includes $743 cash and excludes $115 spent on fees and slippage. |
|
|
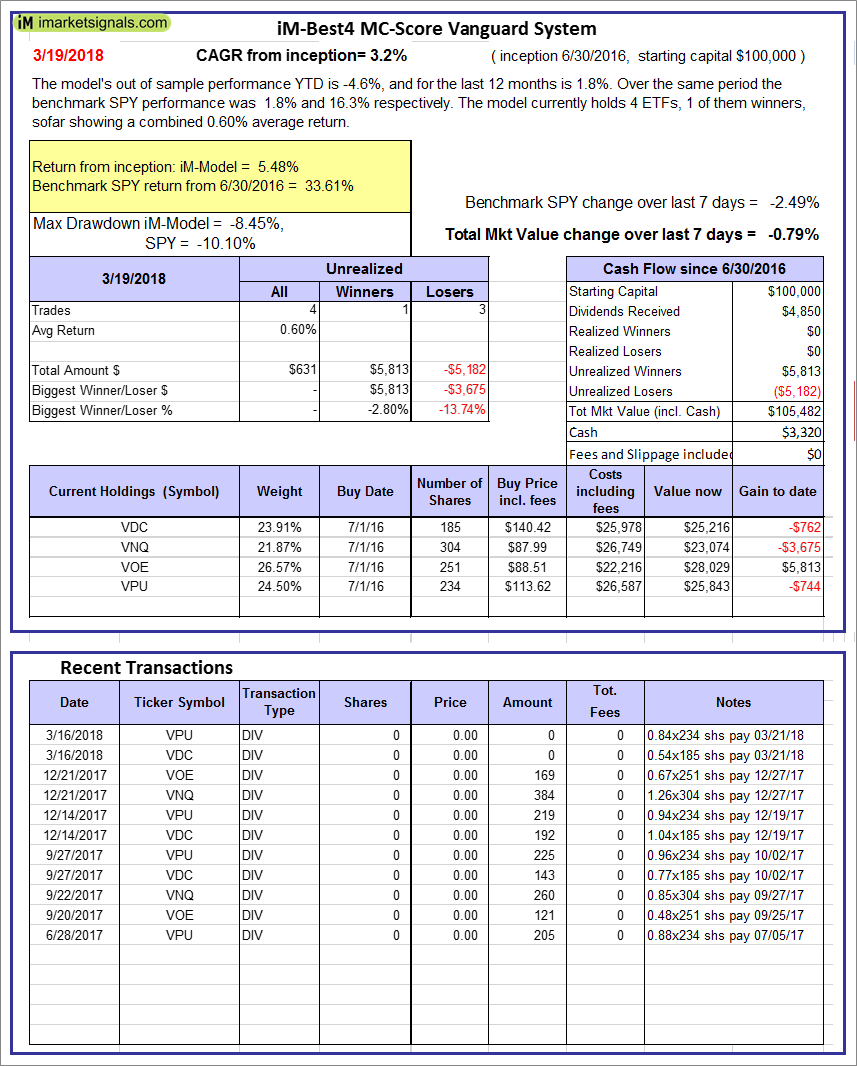
iM-Best4 MC-Score Vanguard System: The model’s out of sample performance YTD is -4.6%, and for the last 12 months is 1.8%. Over the same period the benchmark SPY performance was 1.8% and 16.3% respectively. Over the previous week the market value of the iM-Best4 MC-Score Vanguard System gained -0.79% at a time when SPY gained -2.49%. A starting capital of $100,000 at inception on 6/30/2016 would have grown to $105,482 which includes $3,320 cash and excludes $00 spent on fees and slippage. |
|
|
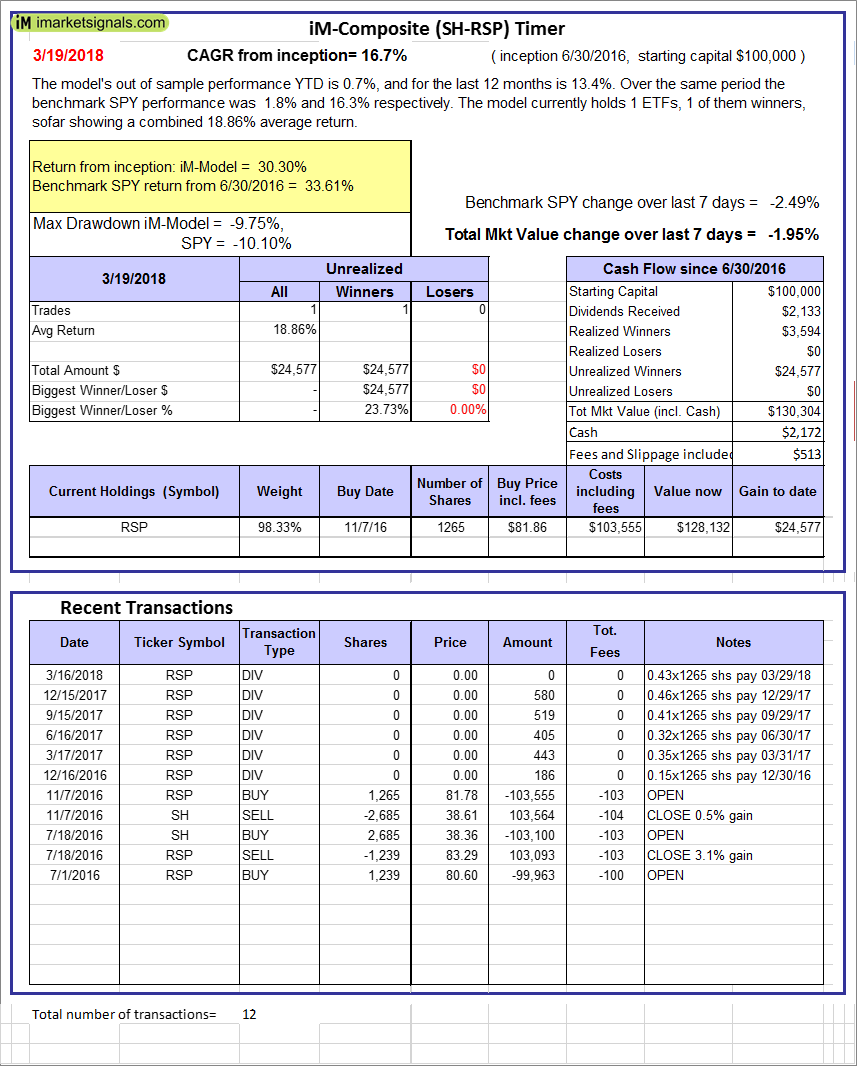
iM-Composite (SH-RSP) Timer: The model’s out of sample performance YTD is 0.7%, and for the last 12 months is 13.4%. Over the same period the benchmark SPY performance was 1.8% and 16.3% respectively. Over the previous week the market value of the iM-Composite (SH-RSP) Timer gained -1.95% at a time when SPY gained -2.49%. A starting capital of $100,000 at inception on 6/30/2016 would have grown to $130,304 which includes $2,172 cash and excludes $513 spent on fees and slippage. |
|
|
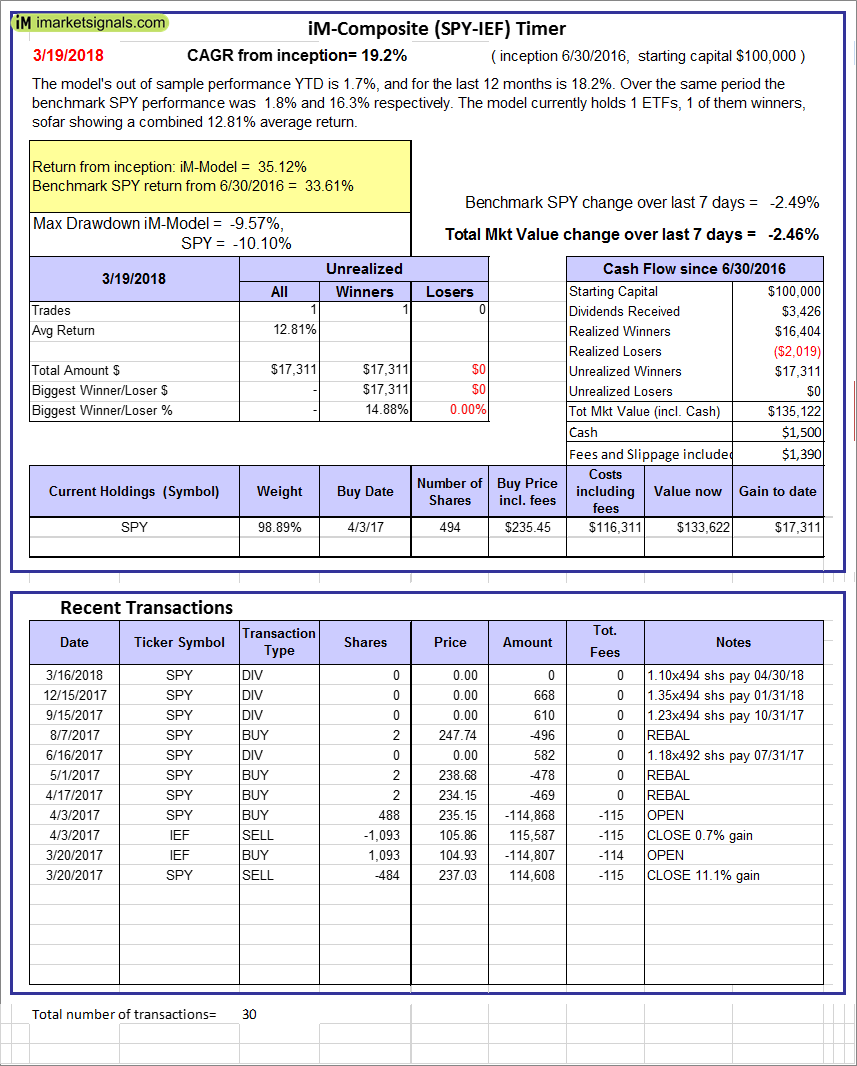
iM-Composite (SPY-IEF) Timer: The model’s out of sample performance YTD is 1.7%, and for the last 12 months is 18.2%. Over the same period the benchmark SPY performance was 1.8% and 16.3% respectively. Over the previous week the market value of the iM-Composite (SPY-IEF) Timer gained -2.46% at a time when SPY gained -2.49%. A starting capital of $100,000 at inception on 6/30/2016 would have grown to $135,122 which includes $1,500 cash and excludes $1,390 spent on fees and slippage. |
|
|
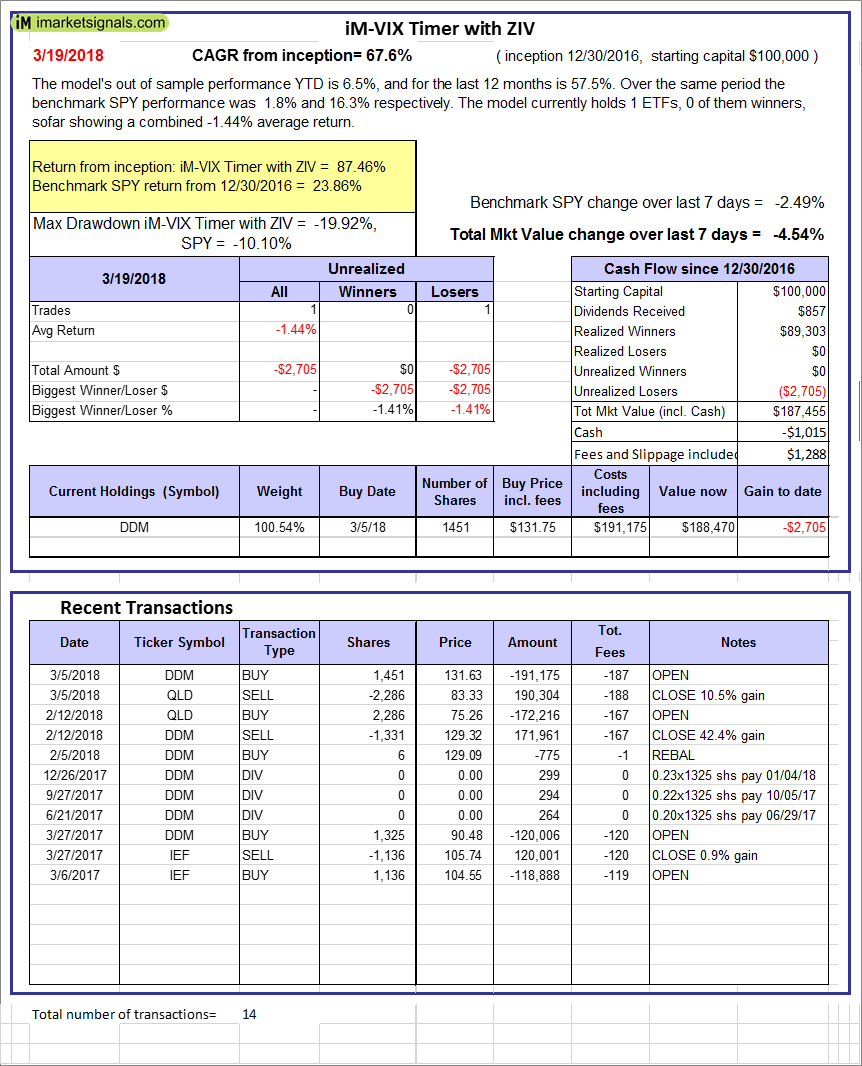
iM-VIX Timer with ZIV: The model’s out of sample performance YTD is 6.5%, and for the last 12 months is 57.5%. Over the same period the benchmark SPY performance was 1.8% and 16.3% respectively. Over the previous week the market value of the iM-VIX Timer with ZIV gained -4.54% at a time when SPY gained -2.49%. A starting capital of $100,000 at inception on 6/30/2016 would have grown to $187,455 which includes -$1,015 cash and excludes $1,288 spent on fees and slippage. |
|
|
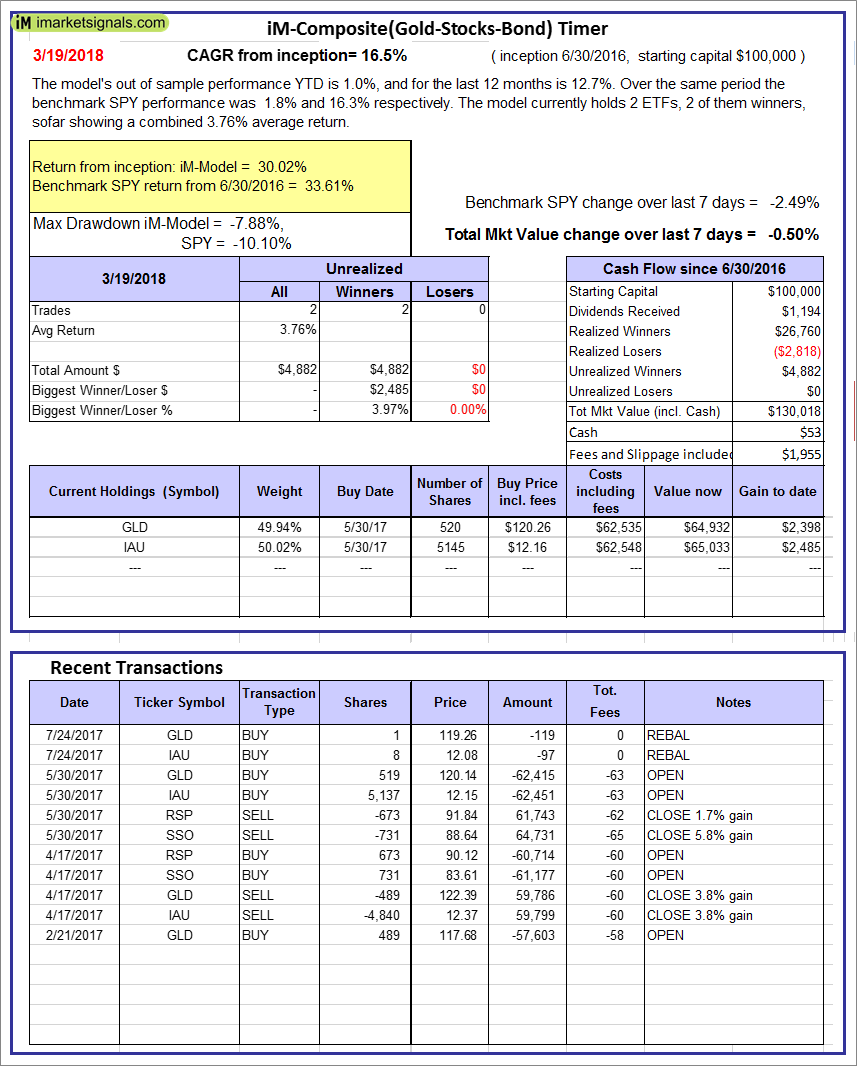
iM-Composite(Gold-Stocks-Bond) Timer: The model’s out of sample performance YTD is 1.0%, and for the last 12 months is 12.7%. Over the same period the benchmark SPY performance was 1.8% and 16.3% respectively. Over the previous week the market value of the iM-Composite(Gold-Stocks-Bond) Timer gained -0.50% at a time when SPY gained -2.49%. A starting capital of $100,000 at inception on 6/30/2016 would have grown to $130,018 which includes $53 cash and excludes $1,955 spent on fees and slippage. |
|
|
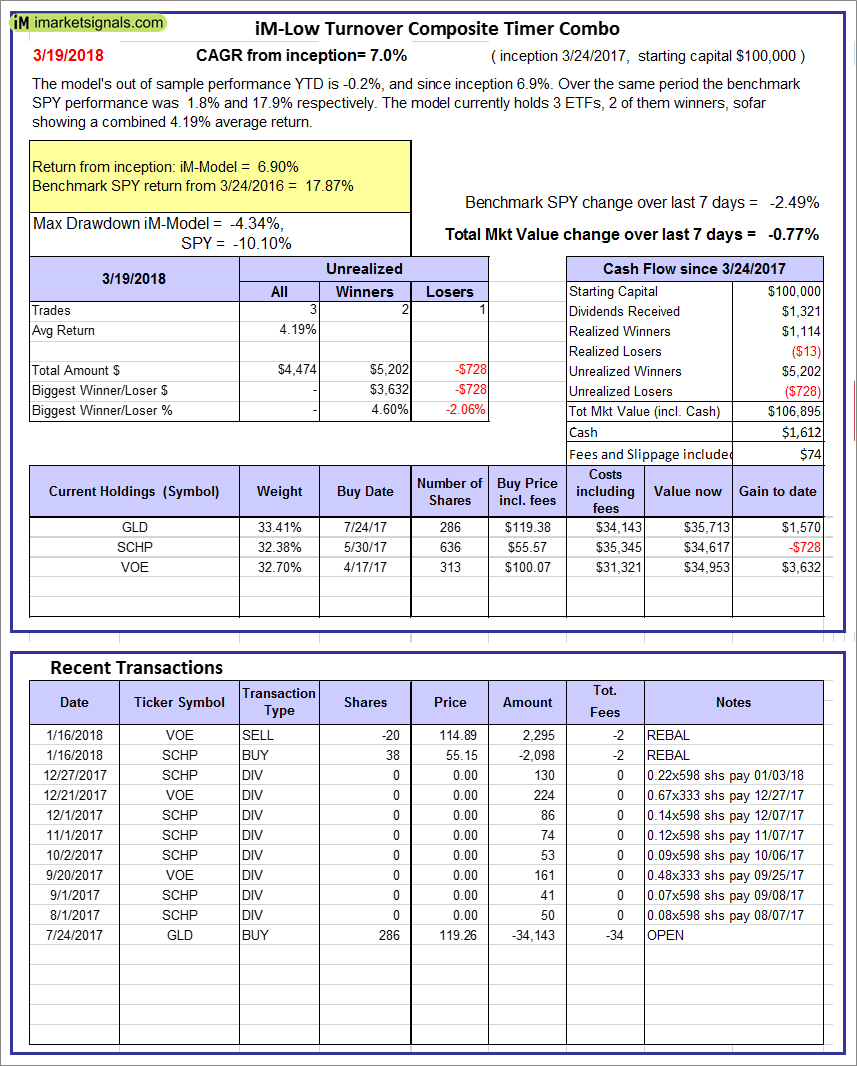
iM-Low Turnover Composite Timer Combo: The model’s out of sample performance YTD is -0.2%, and since inception 6.9%. Over the same period the benchmark SPY performance was 1.8% and 17.9% respectively. Over the previous week the market value of the iM-Low Turnover Composite Timer Combo gained -0.77% at a time when SPY gained -2.49%. A starting capital of $100,000 at inception on 3/24/27 would have grown to $106,895 which includes $1,612 cash and excludes $74 spent on fees and slippage. |
|
|
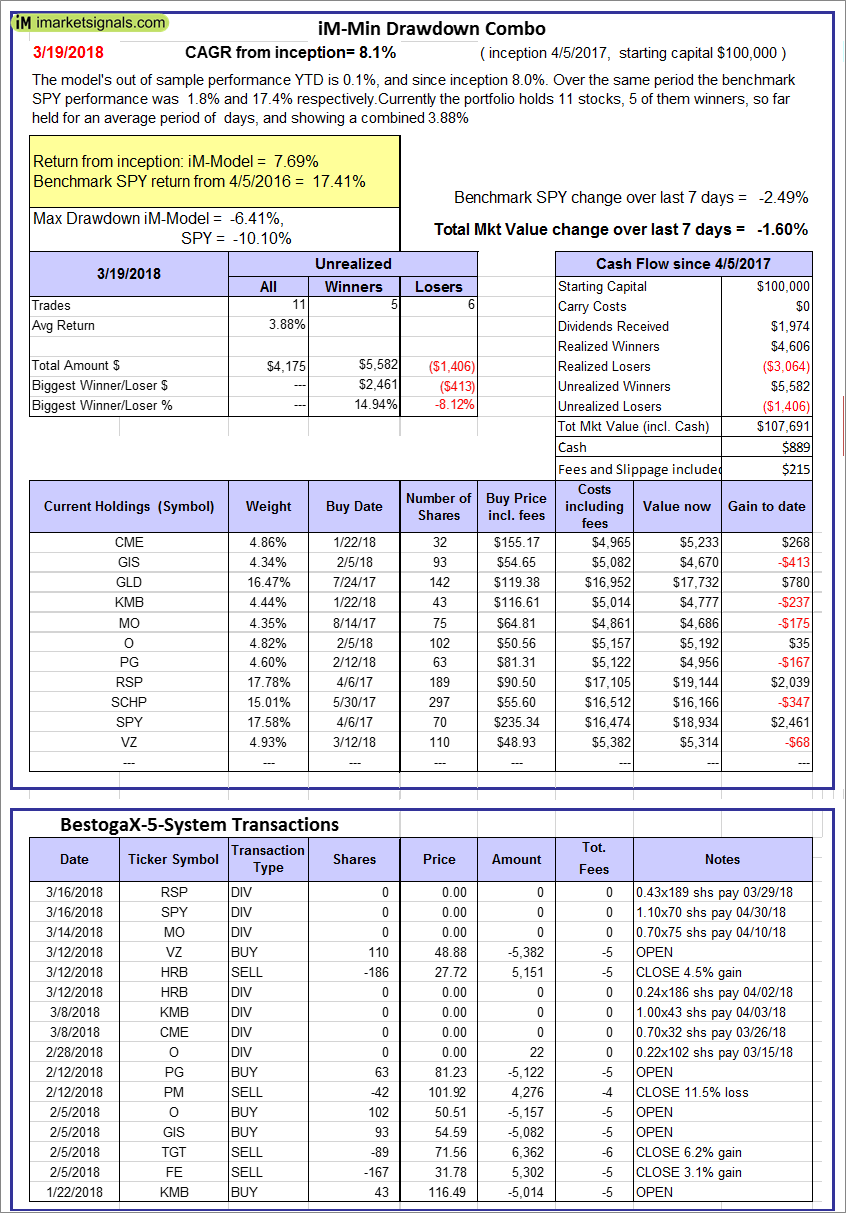
iM-Min Drawdown Combo: The model’s out of sample performance YTD is 0.1%, and since inception 8.0%. Over the same period the benchmark SPY performance was 1.8% and 17.4% respectively. Over the previous week the market value of the iM-Min Drawdown Combo gained -1.60% at a time when SPY gained -2.49%. A starting capital of $100,000 at inception on 4/5/2017 would have grown to $107,691 which includes $889 cash and excludes $215 spent on fees and slippage. |
|
|
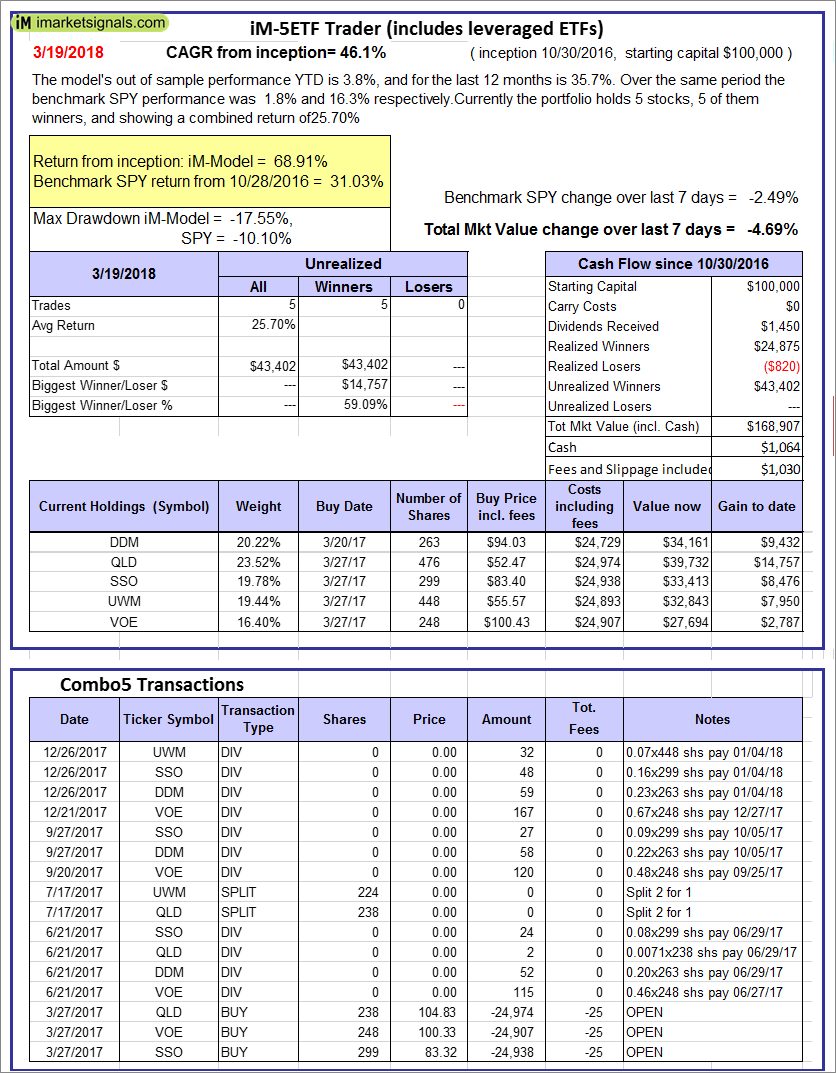
iM-5ETF Trader (includes leveraged ETFs): The model’s out of sample performance YTD is 3.8%, and for the last 12 months is 35.7%. Over the same period the benchmark SPY performance was 1.8% and 16.3% respectively. Over the previous week the market value of the iM-5ETF Trader (includes leveraged ETFs) gained -4.69% at a time when SPY gained -2.49%. A starting capital of $100,000 at inception on 10/30/2016 would have grown to $168,907 which includes $1,064 cash and excludes $1,030 spent on fees and slippage. |
|
|
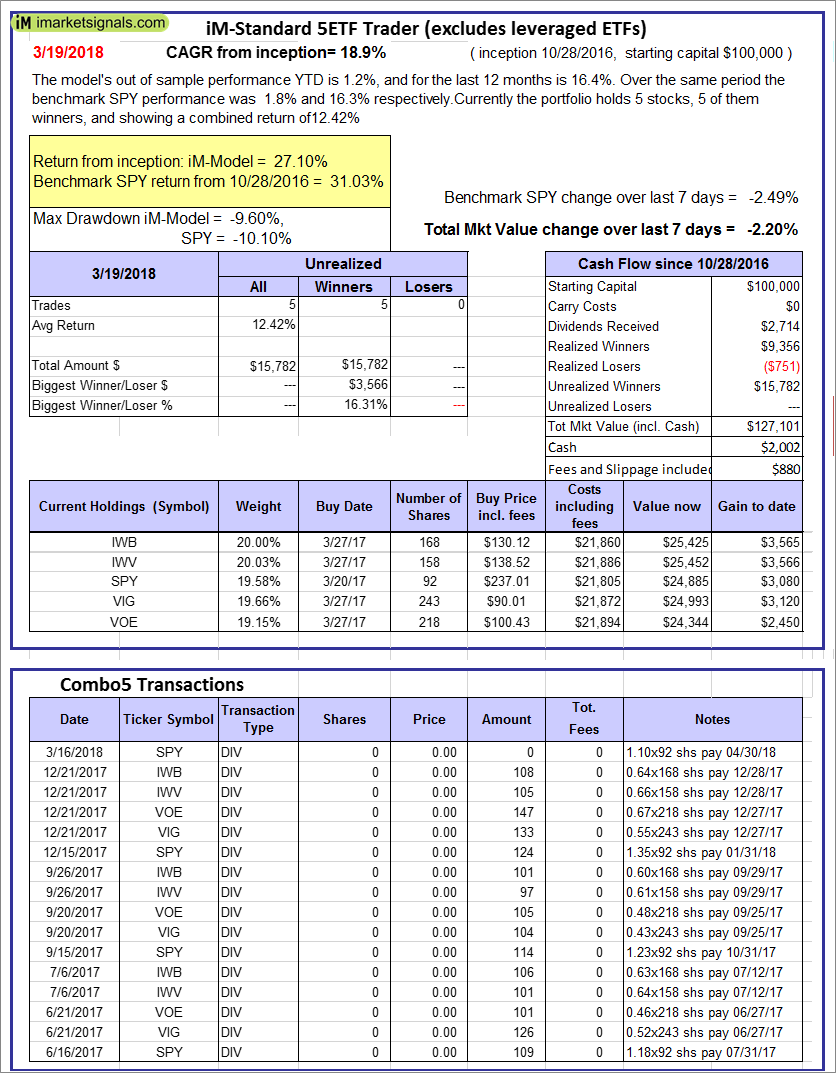
iM-Standard 5ETF Trader (excludes leveraged ETFs): The model’s out of sample performance YTD is 1.2%, and for the last 12 months is 16.4%. Over the same period the benchmark SPY performance was 1.8% and 16.3% respectively. Over the previous week the market value of the iM-Standard 5ETF Trader (excludes leveraged ETFs) gained -2.20% at a time when SPY gained -2.49%. A starting capital of $100,000 at inception on 10/30/2016 would have grown to $127,101 which includes $2,002 cash and excludes $880 spent on fees and slippage. |


Leave a Reply
You must be logged in to post a comment.