  |
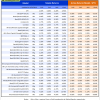
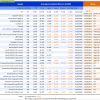
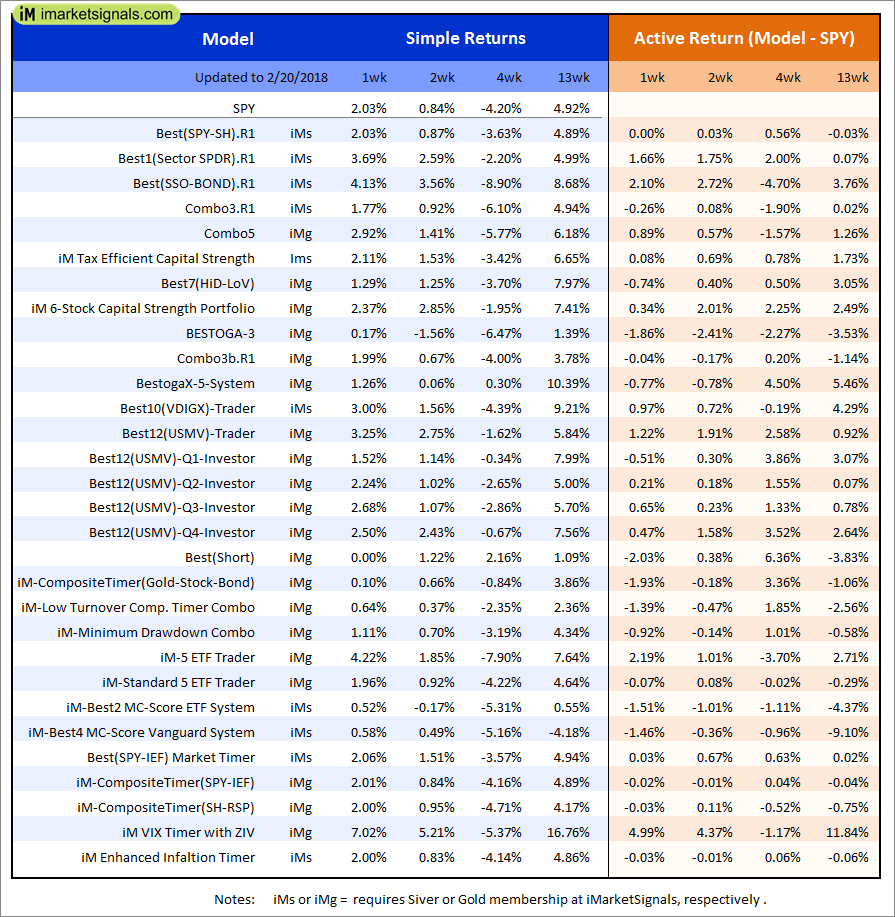
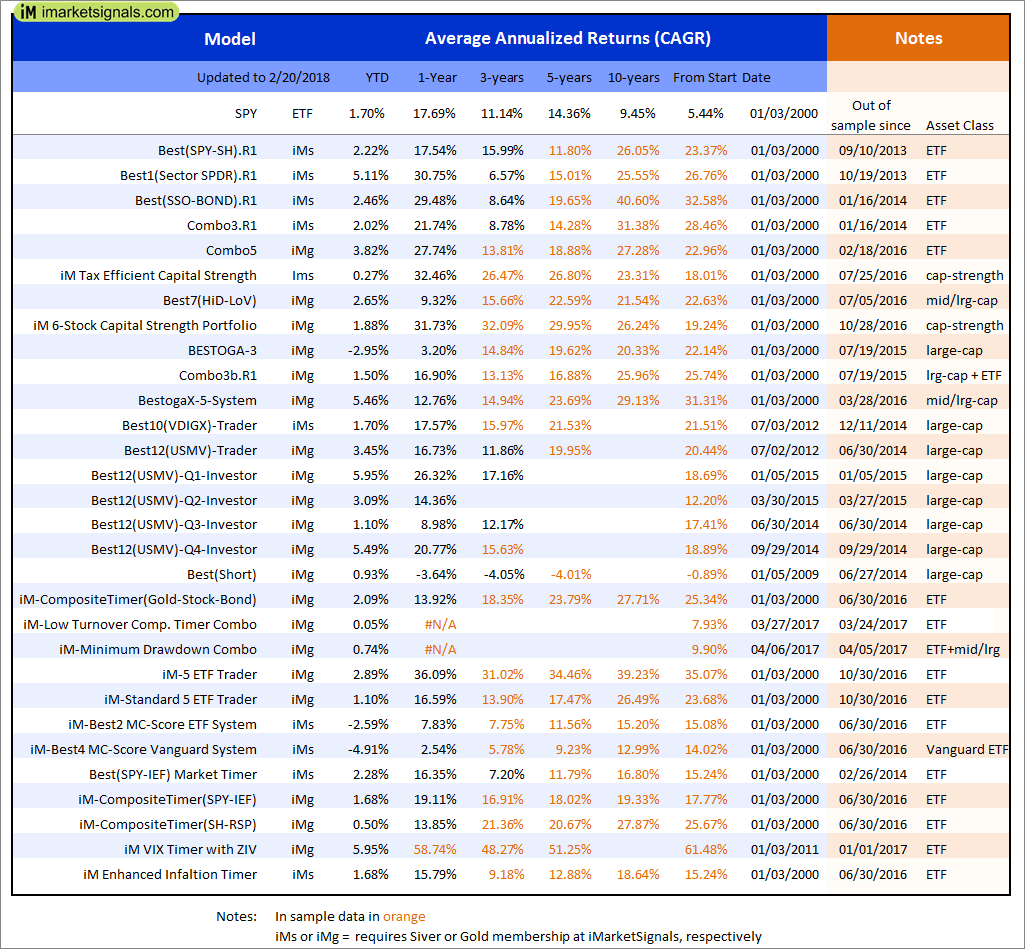
Out of sample performance summary of our models for the past 1, 2, 4 and 13 week periods. The active active return indicates how the models over- or underperformed the benchmark ETF SPY. Also the YTD, and the 1-, 3-, 5- and 10-year annualized returns are shown in the second table |
|
|
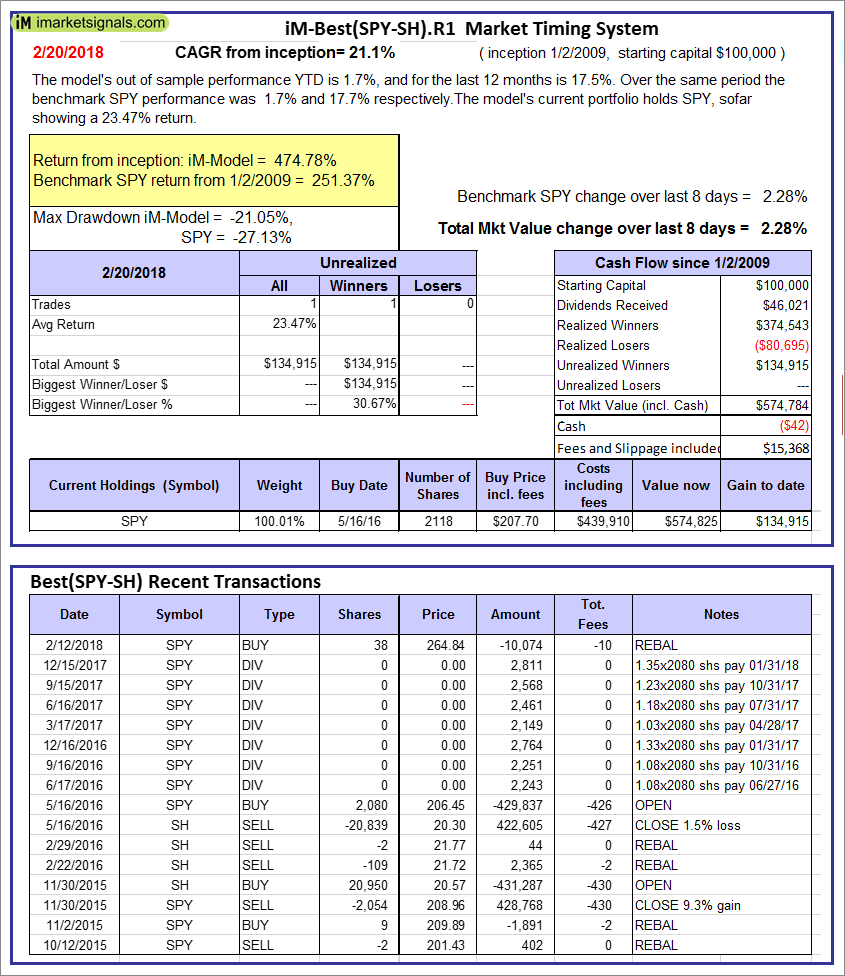
iM-Best(SPY-SH).R1: The model’s out of sample performance YTD is 1.7%, and for the last 12 months is 17.5%. Over the same period the benchmark SPY performance was 1.7% and 17.7% respectively. Over the previous week the market value of Best(SPY-SH) gained 2.28% at a time when SPY gained 2.28%. A starting capital of $100,000 at inception on 1/2/2009 would have grown to $574,784 which includes -$42 cash and excludes $15,368 spent on fees and slippage. |
|
|
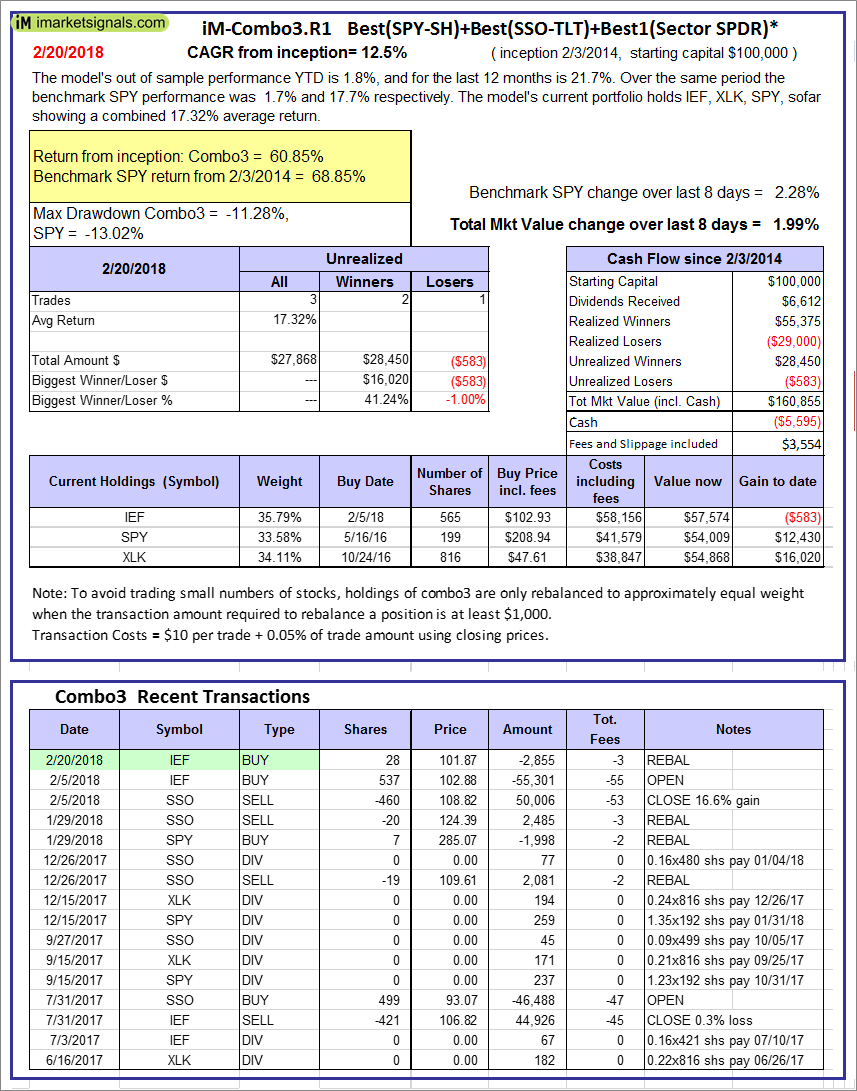
iM-Combo3.R1: The model’s out of sample performance YTD is 1.8%, and for the last 12 months is 21.7%. Over the same period the benchmark SPY performance was 1.7% and 17.7% respectively. Over the previous week the market value of iM-Combo3.R1 gained 1.99% at a time when SPY gained 2.28%. A starting capital of $100,000 at inception on 2/3/2014 would have grown to $160,855 which includes -$5,595 cash and excludes $3,554 spent on fees and slippage. |
|
|
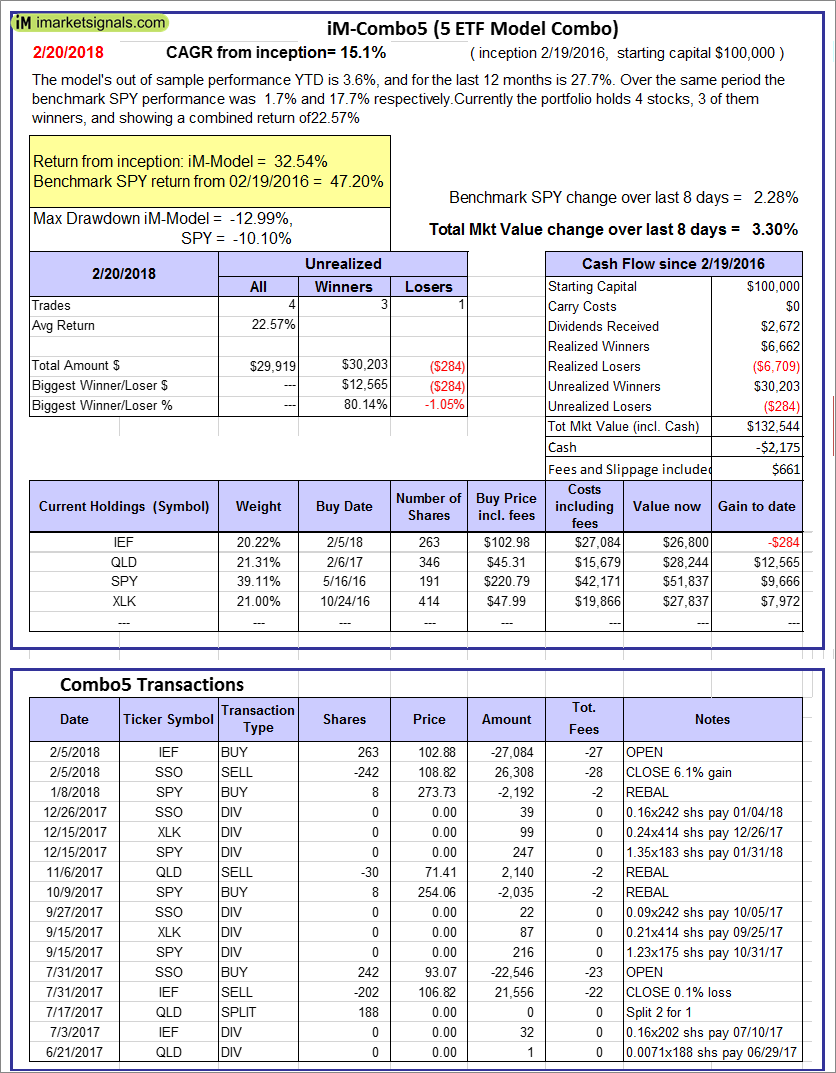
iM-Combo5: The model’s out of sample performance YTD is 3.6%, and for the last 12 months is 27.7%. Over the same period the benchmark SPY performance was 1.7% and 17.7% respectively. Over the previous week the market value of iM-Combo5 gained 3.30% at a time when SPY gained 2.28%. A starting capital of $100,000 at inception on 2/22/2016 would have grown to $132,544 which includes -$2,175 cash and excludes $661 spent on fees and slippage. |
|
|
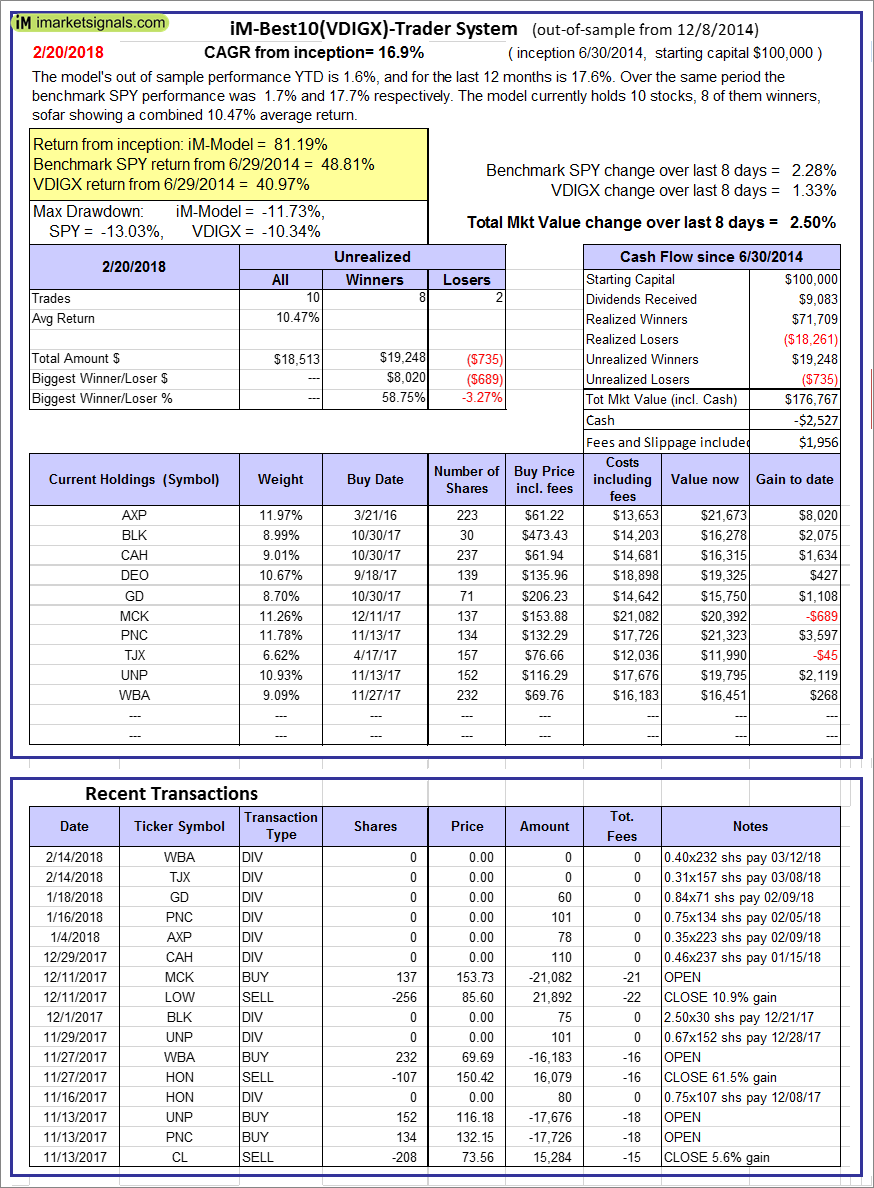
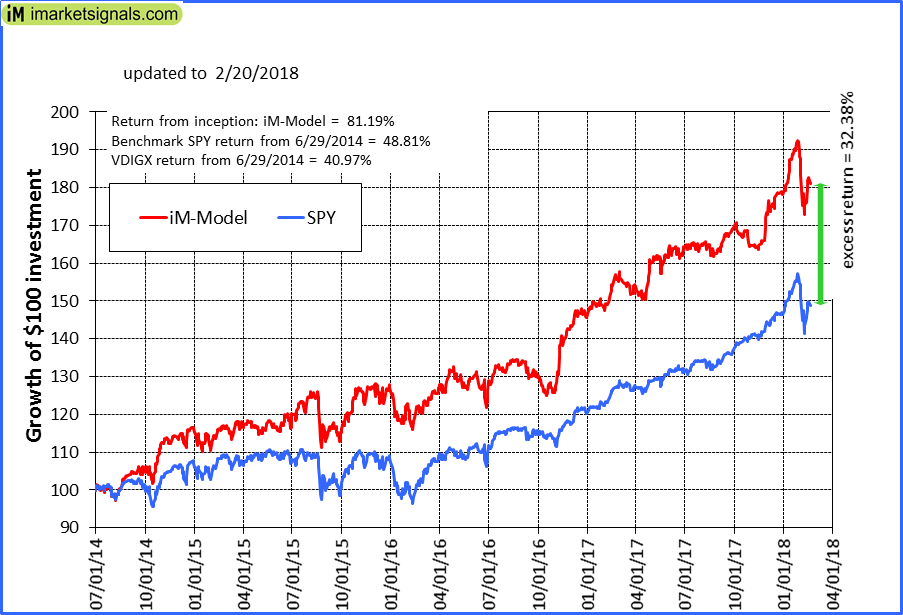
iM-Best10(VDIGX)-Trader: The model’s out of sample performance YTD is 1.6%, and for the last 12 months is 17.6%. Over the same period the benchmark SPY performance was 1.7% and 17.7% respectively. Since inception, on 7/1/2014, the model gained 81.19% while the benchmark SPY gained 48.81% and VDIGX gained 40.97% over the same period. Over the previous week the market value of iM-Best10(VDIGX) gained 2.50% at a time when SPY gained 2.28%. A starting capital of $100,000 at inception on 7/1/2014 would have grown to $176,767 which includes -$2,527 cash and excludes $1,956 spent on fees and slippage. |
|
|
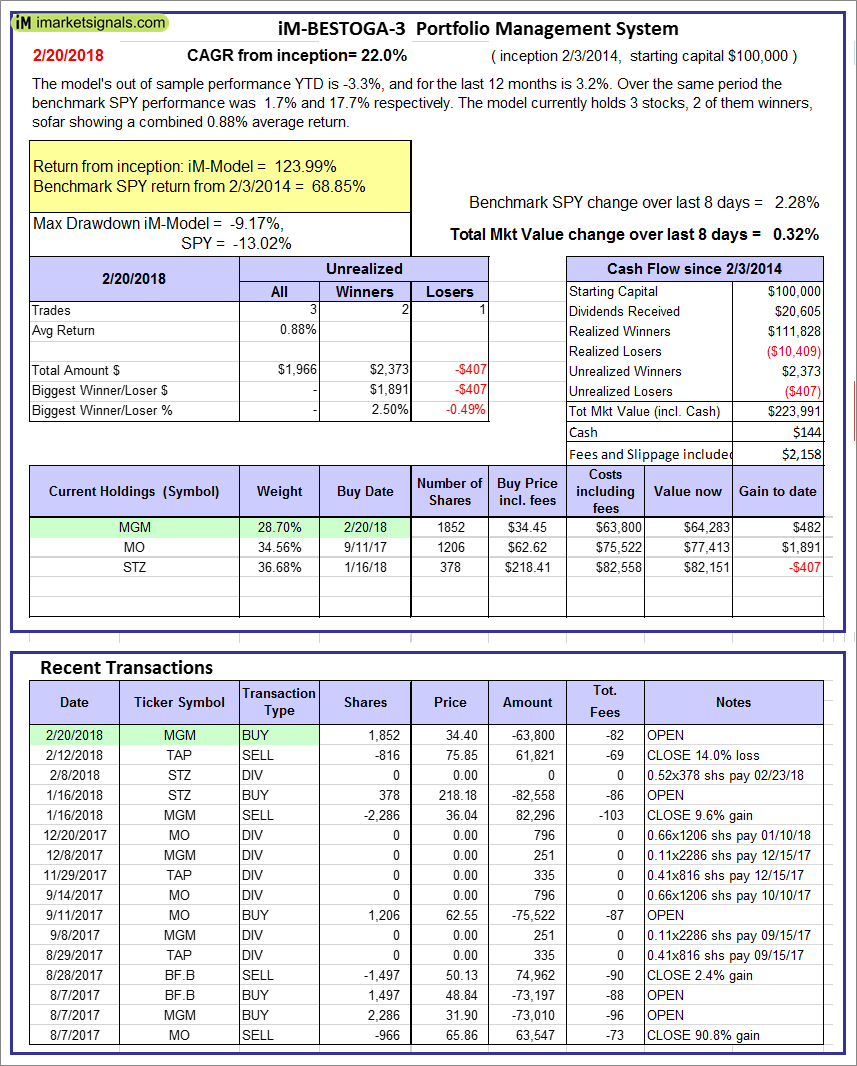
iM-BESTOGA-3: The model’s out of sample performance YTD is -3.3%, and for the last 12 months is 3.2%. Over the same period the benchmark SPY performance was 1.7% and 17.7% respectively. Over the previous week the market value of iM-BESTOGA-3 gained 0.32% at a time when SPY gained 2.28%. A starting capital of $100,000 at inception on 2/3/2014 would have grown to $223,991 which includes $144 cash and excludes $2,158 spent on fees and slippage. |
|
|
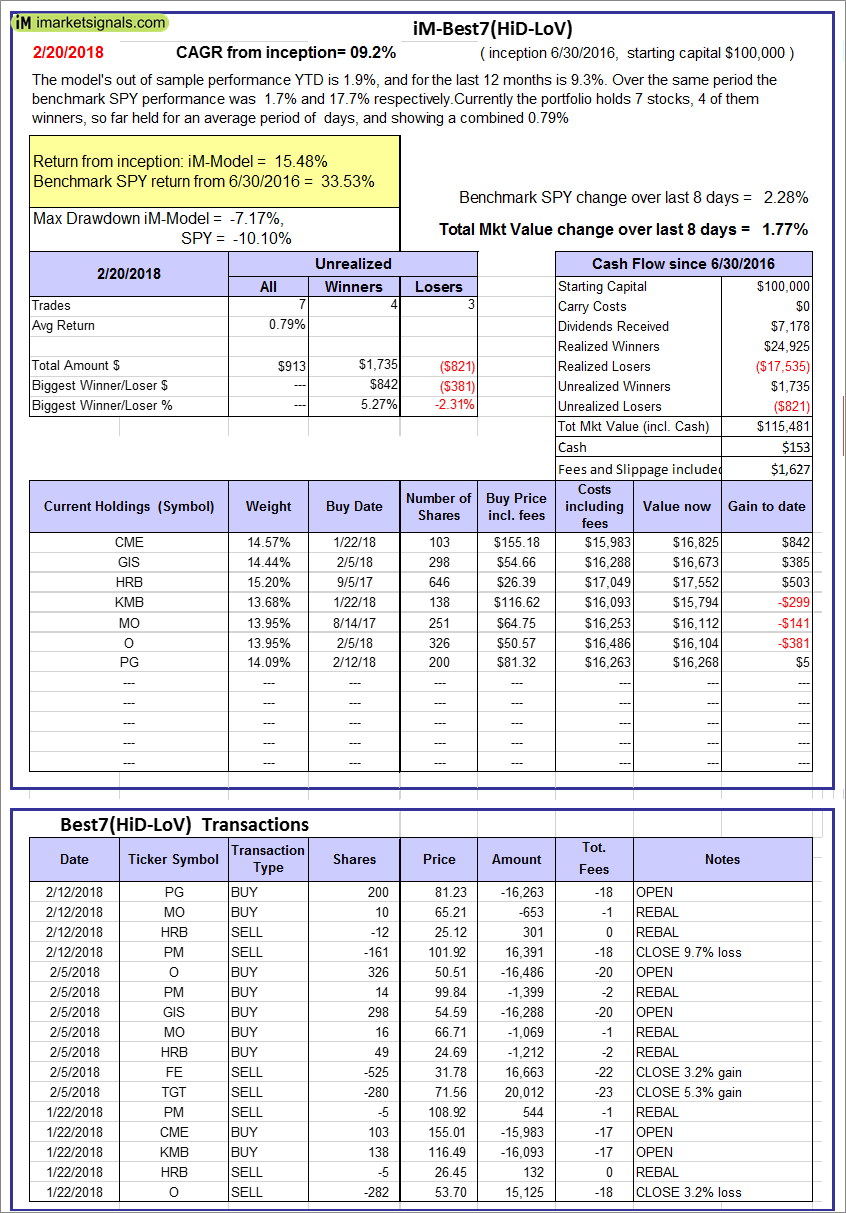
iM-Best7(HiD-LoV): The model’s out of sample performance YTD is 1.9%, and for the last 12 months is 9.3%. Over the same period the benchmark SPY performance was 1.7% and 17.7% respectively. Over the previous week the market value of iM-BESTOGA-3 gained 1.77% at a time when SPY gained 2.28%. A starting capital of $100,000 at inception on 6/30/2016 would have grown to $115,481 which includes $153 cash and excludes $1,627 spent on fees and slippage. |
|
|
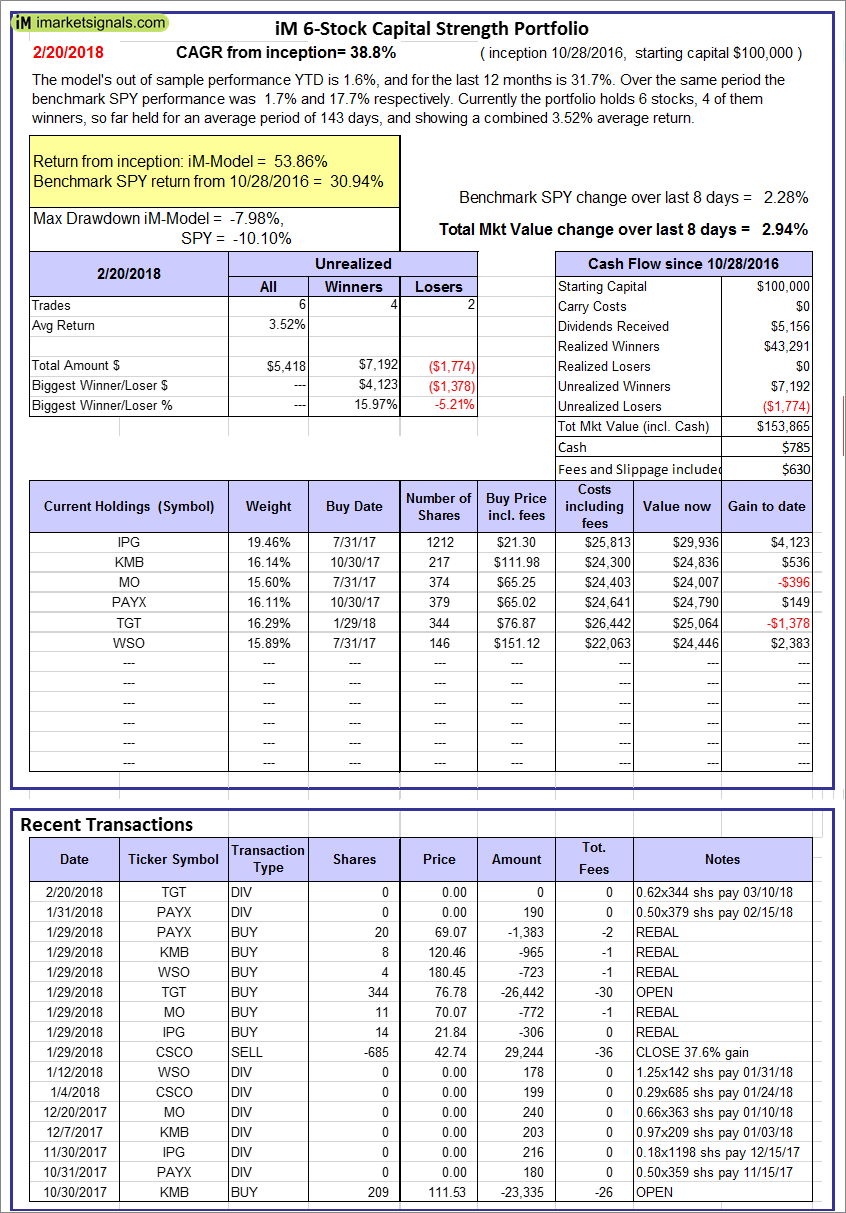
iM 6-Stock Capital Strength Portfolio: The model’s out of sample performance YTD is 1.6%, and for the last 12 months is 31.7%. Over the same period the benchmark SPY performance was 1.7% and 17.7% respectively. Over the previous week the market value of the iM 6-Stock Capital Strength Portfolio gained 2.94% at a time when SPY gained 2.28%. A starting capital of $100,000 at inception on 10/28/2016 would have grown to $153,865 which includes $785 cash and excludes $630 spent on fees and slippage. |
|
|
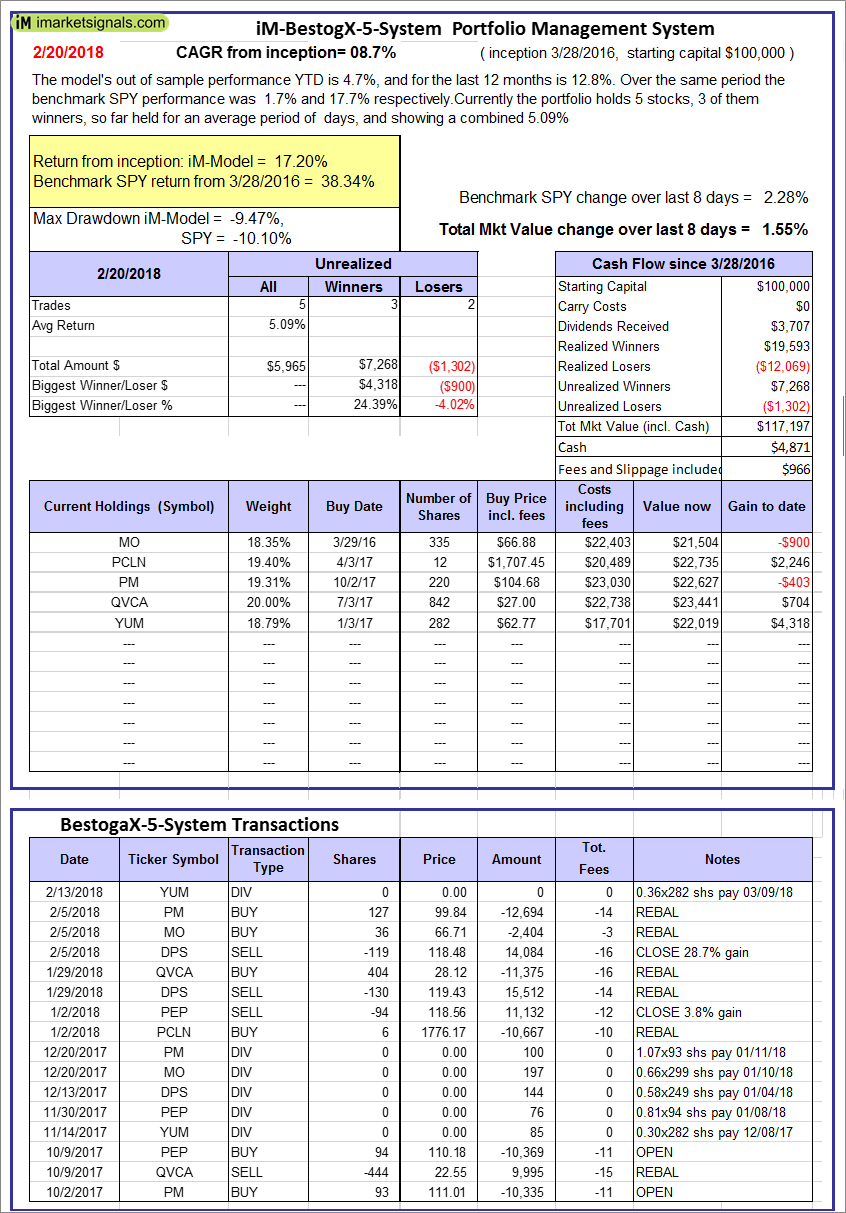
iM-BestogaX5-System: The model’s out of sample performance YTD is 4.7%, and for the last 12 months is 12.8%. Over the same period the benchmark SPY performance was 1.7% and 17.7% respectively. Over the previous week the market value of iM-BestogaX5-System gained 1.55% at a time when SPY gained 2.28%. A starting capital of $100,000 at inception on 3/28/2016 would have grown to $117,197 which includes $4,871 cash and excludes $966 spent on fees and slippage. |
|
|
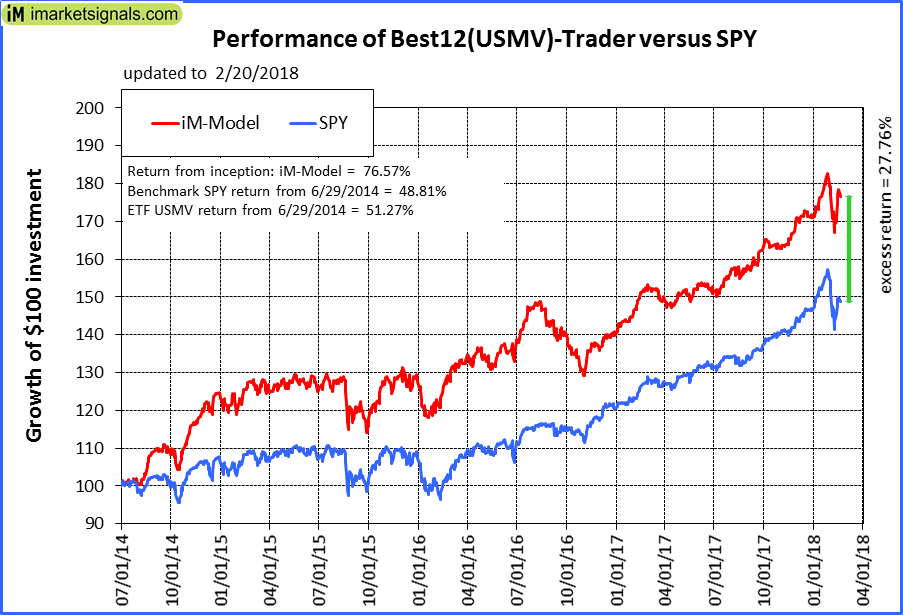
iM-Best12(USMV)-Trader: The model’s out of sample performance YTD is 3.2%, and for the last 12 months is 16.7%. Over the same period the benchmark SPY performance was 1.7% and 17.7% respectively. Since inception, on 6/30/2014, the model gained 76.57% while the benchmark SPY gained 48.81% and the ETF USMV gained 51.27% over the same period. Over the previous week the market value of iM-Best12(USMV)-Trader gained 3.91% at a time when SPY gained 2.28%. A starting capital of $100,000 at inception on 6/30/2014 would have grown to $176,464 which includes -$80 cash and excludes $3,904 spent on fees and slippage. |
|
|
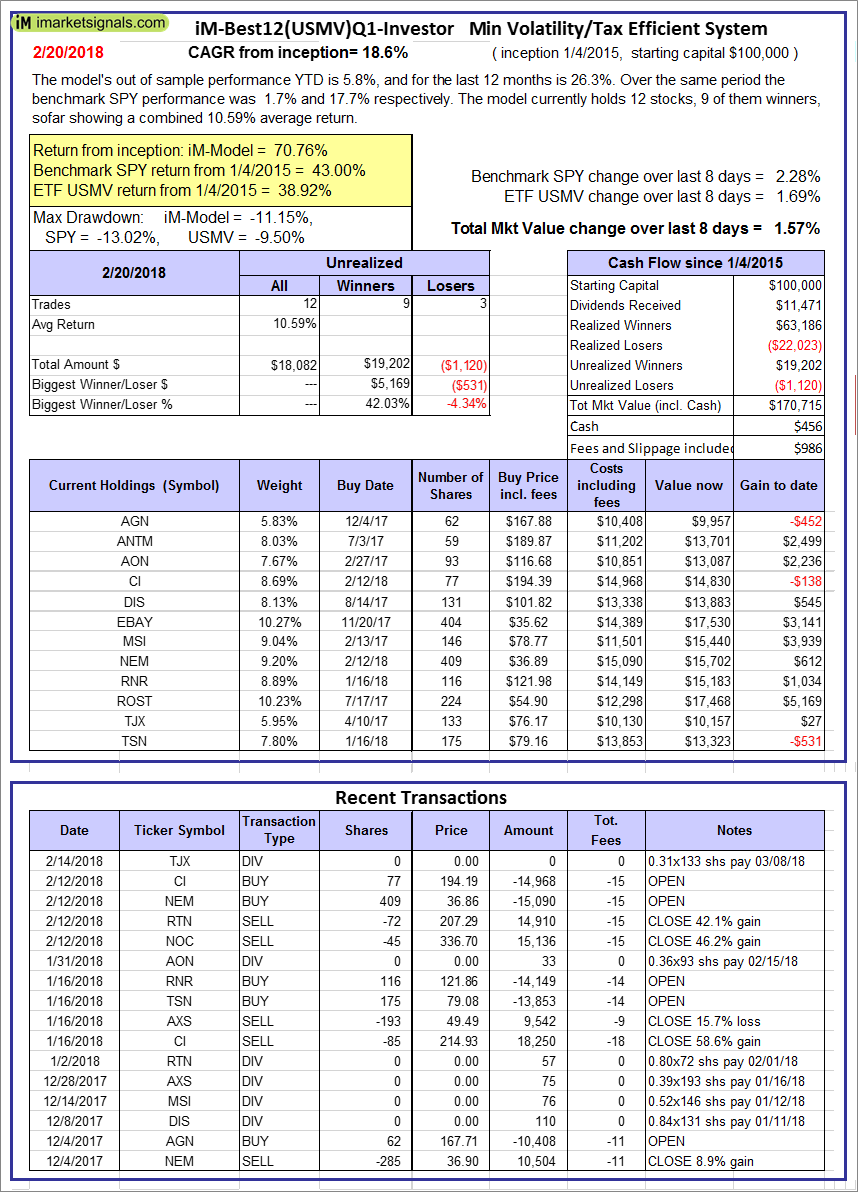
iM-Best12(USMV)Q1-Investor: The model’s out of sample performance YTD is 5.8%, and for the last 12 months is 26.3%. Over the same period the benchmark SPY performance was 1.7% and 17.7% respectively. Since inception, on 1/5/2015, the model gained 70.76% while the benchmark SPY gained 43.00% and the ETF USMV gained 38.92% over the same period. Over the previous week the market value of iM-Best12(USMV)Q1 gained 1.57% at a time when SPY gained 2.28%. A starting capital of $100,000 at inception on 1/5/2015 would have grown to $170,715 which includes $456 cash and excludes $986 spent on fees and slippage. |
|
|
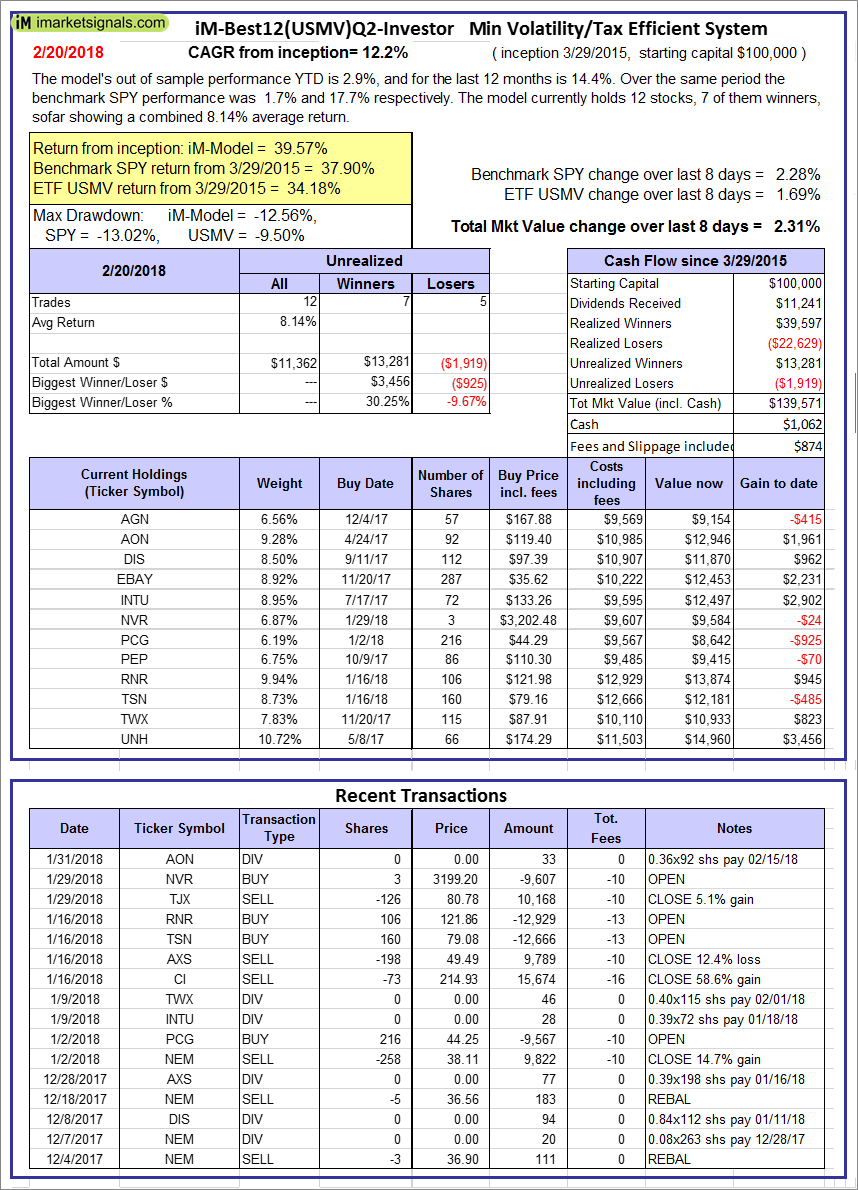
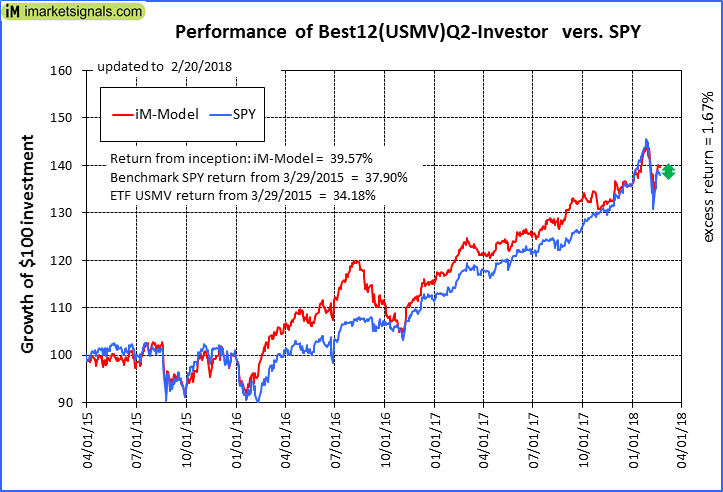
iM-Best12(USMV)Q2-Investor: The model’s out of sample performance YTD is 2.9%, and for the last 12 months is 14.4%. Over the same period the benchmark SPY performance was 1.7% and 17.7% respectively. Since inception, on 3/30/2015, the model gained 39.57% while the benchmark SPY gained 37.90% and the ETF USMV gained 34.18% over the same period. Over the previous week the market value of iM-Best12(USMV)Q2 gained 2.31% at a time when SPY gained 2.28%. A starting capital of $100,000 at inception on 3/30/2015 would have grown to $139,571 which includes $1,062 cash and excludes $874 spent on fees and slippage. |
|
|
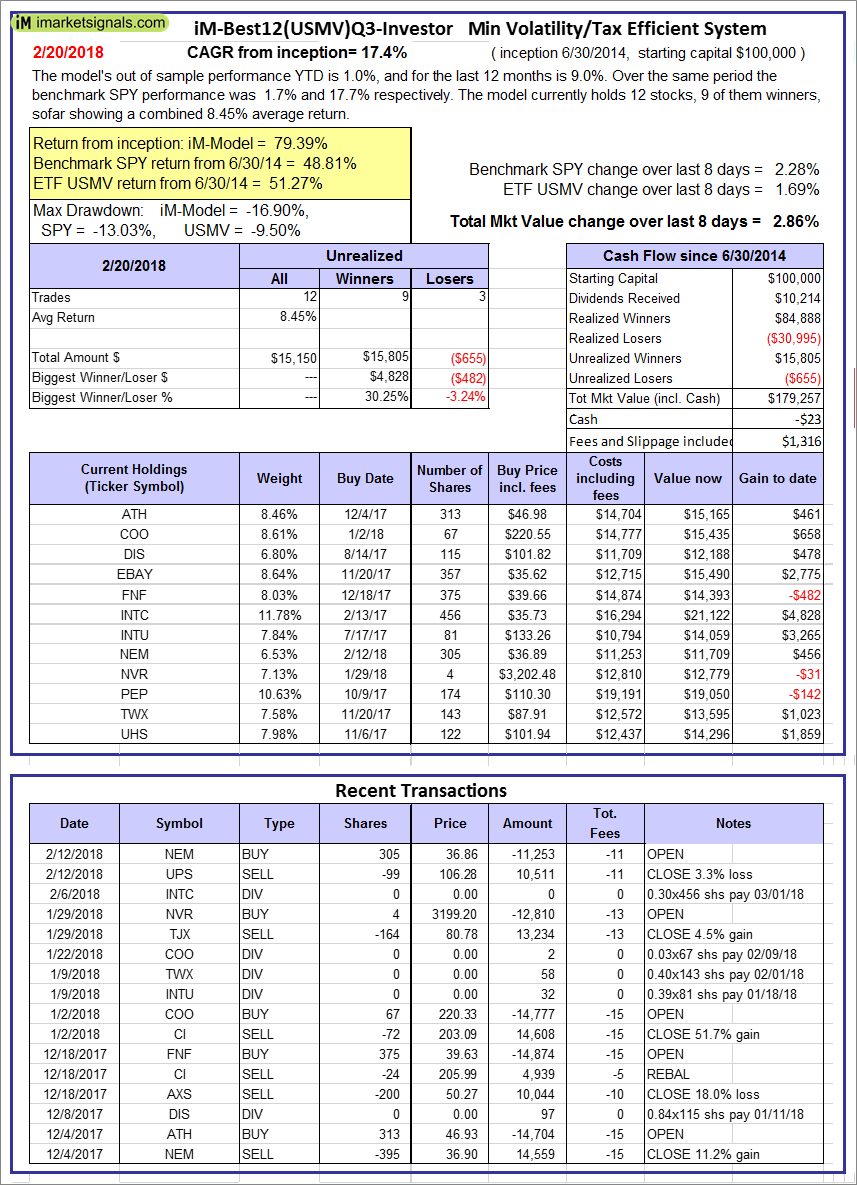
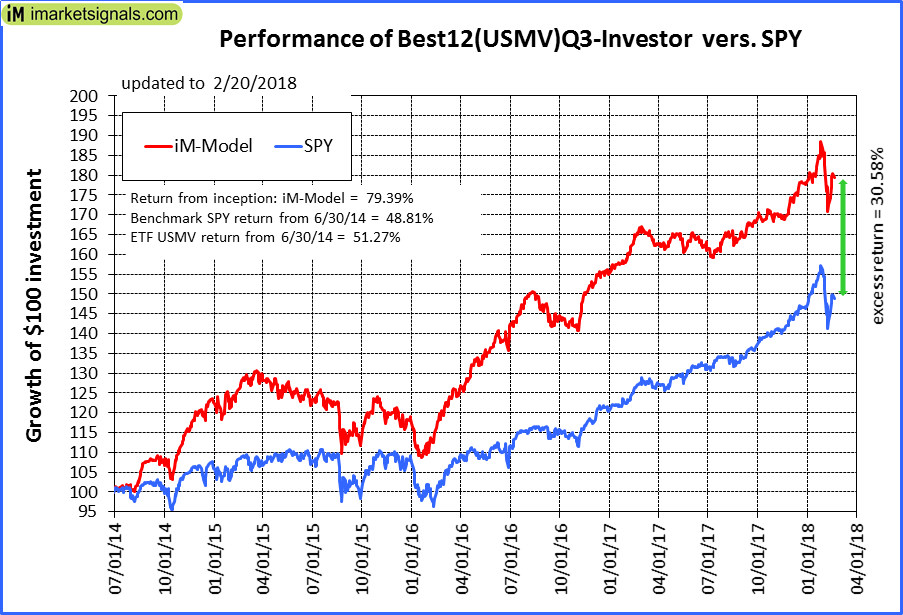
iM-Best12(USMV)Q3-Investor: The model’s out of sample performance YTD is 1.0%, and for the last 12 months is 9.0%. Over the same period the benchmark SPY performance was 1.7% and 17.7% respectively. Since inception, on 7/1/2014, the model gained 79.39% while the benchmark SPY gained 48.81% and the ETF USMV gained 51.27% over the same period. Over the previous week the market value of iM-Best12(USMV)Q3 gained 2.86% at a time when SPY gained 2.28%. A starting capital of $100,000 at inception on 7/1/2014 would have grown to $179,257 which includes -$23 cash and excludes $1,316 spent on fees and slippage. |
|
|
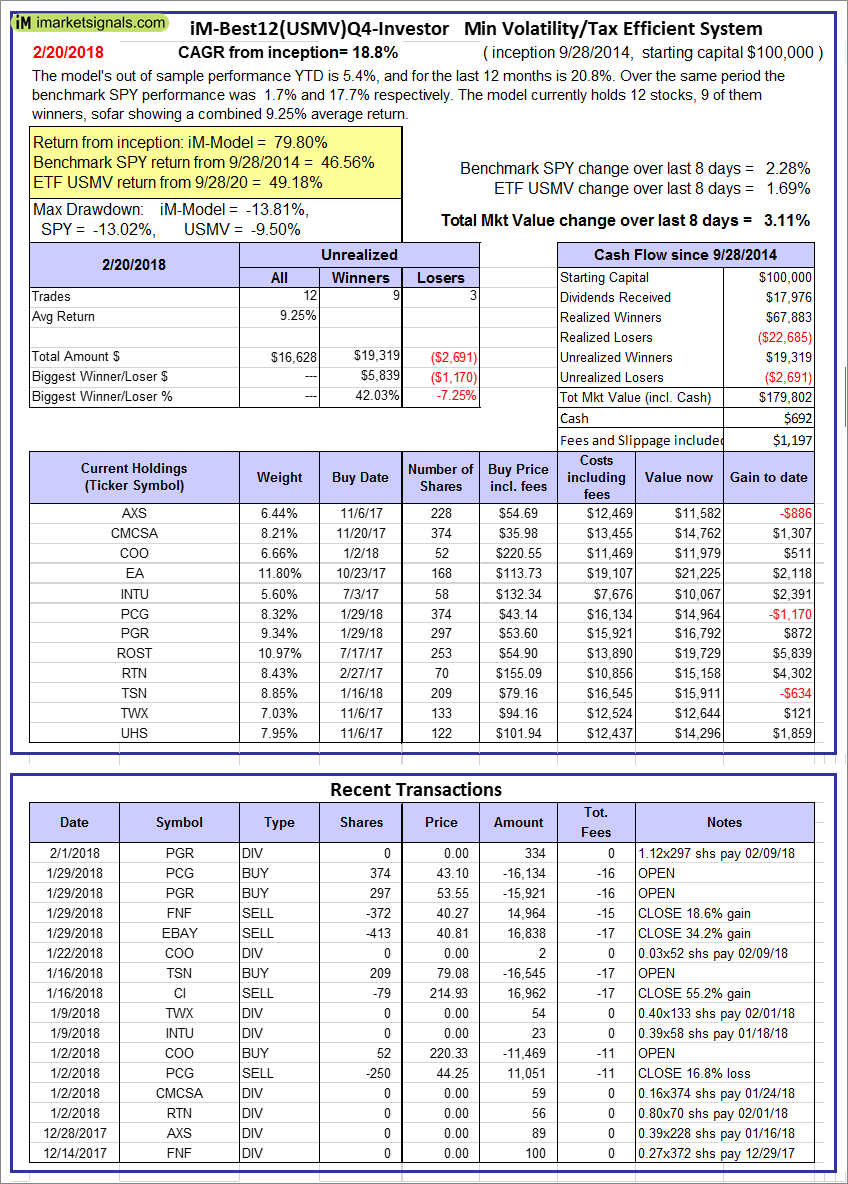
iM-Best12(USMV)Q4-Investor: Since inception, on 9/29/2014, the model gained 79.80% while the benchmark SPY gained 46.56% and the ETF USMV gained 49.18% over the same period. Over the previous week the market value of iM-Best12(USMV)Q4 gained 3.11% at a time when SPY gained 2.28%. A starting capital of $100,000 at inception on 9/29/2014 would have grown to $179,802 which includes $692 cash and excludes $1,197 spent on fees and slippage. |
|
|
Average Performance of iM-Best12(USMV)Q1+Q2+Q3+Q4-Investor resulted in an excess return of 42.27% over SPY. (see iM-USMV Investor Portfolio) |
|
|
iM-Best(Short): The model’s out of sample performance YTD is 0.9%, and for the last 12 months is -3.9%. Over the same period the benchmark SPY performance was 1.7% and 17.7% respectively. Over the previous week the market value of iM-Best(Short) gained 0.00% at a time when SPY gained 2.28%. Over the period 1/2/2009 to 2/20/2018 the starting capital of $100,000 would have grown to $92,070 which includes $92,070 cash and excludes $23,663 spent on fees and slippage. |
|
|
iM-Best2 MC-Score ETF System: The model’s out of sample performance YTD is -2.6%, and for the last 12 months is 7.8%. Over the same period the benchmark SPY performance was 1.7% and 17.7% respectively. Over the previous week the market value of the iM-Best2 MC-Score ETF System gained 0.90% at a time when SPY gained 2.28%. A starting capital of $100,000 at inception on 6/30/2016 would have grown to $109,467 which includes $743 cash and excludes $115 spent on fees and slippage. |
|
|
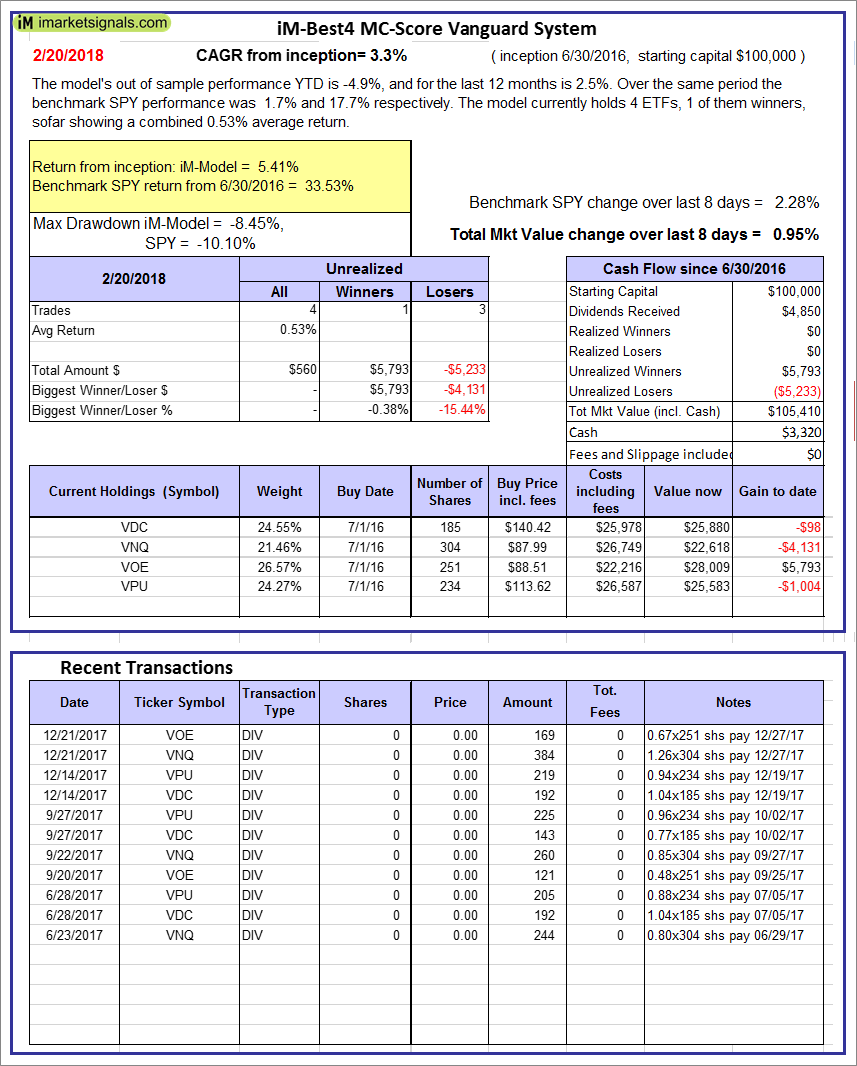
iM-Best4 MC-Score Vanguard System: The model’s out of sample performance YTD is -4.9%, and for the last 12 months is 2.5%. Over the same period the benchmark SPY performance was 1.7% and 17.7% respectively. Over the previous week the market value of the iM-Best4 MC-Score Vanguard System gained 0.95% at a time when SPY gained 2.28%. A starting capital of $100,000 at inception on 6/30/2016 would have grown to $105,410 which includes $3,320 cash and excludes $00 spent on fees and slippage. |
|
|
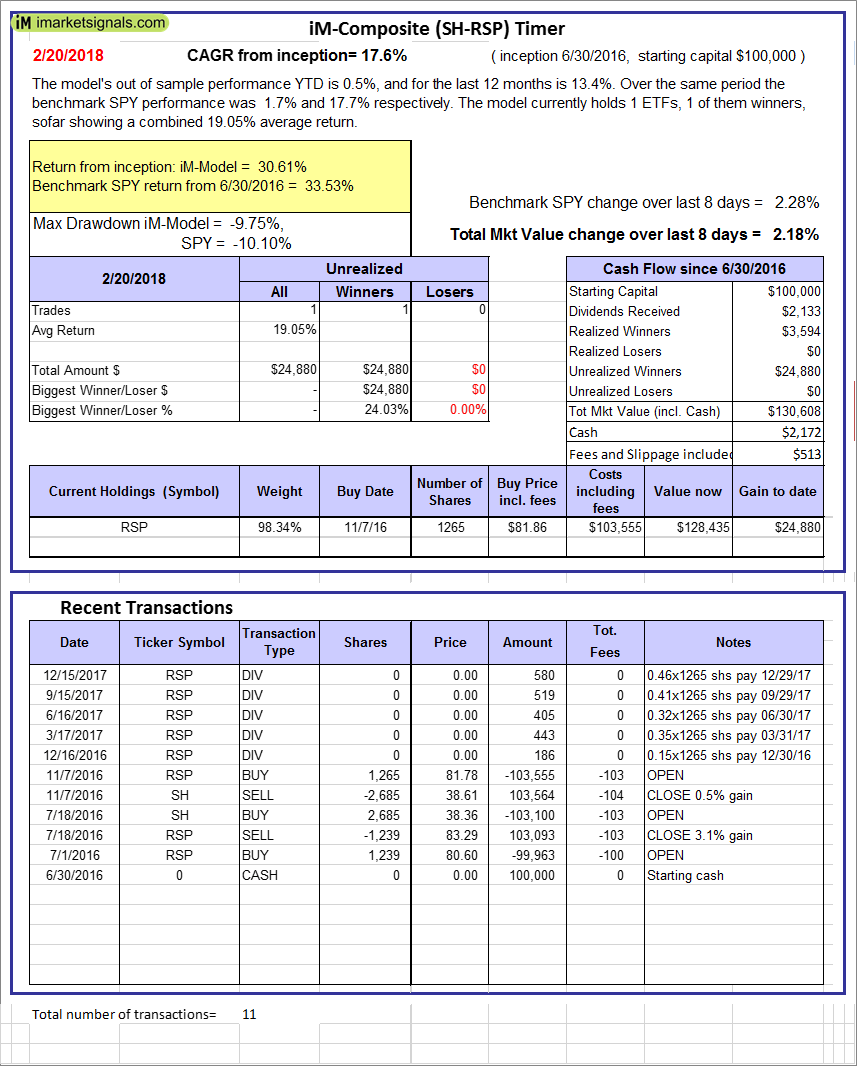
iM-Composite (SH-RSP) Timer: The model’s out of sample performance YTD is 0.5%, and for the last 12 months is 13.4%. Over the same period the benchmark SPY performance was 1.7% and 17.7% respectively. Over the previous week the market value of the iM-Composite (SH-RSP) Timer gained 2.18% at a time when SPY gained 2.28%. A starting capital of $100,000 at inception on 6/30/2016 would have grown to $130,608 which includes $2,172 cash and excludes $513 spent on fees and slippage. |
|
|
iM-Composite (SPY-IEF) Timer: The model’s out of sample performance YTD is 1.7%, and for the last 12 months is 19.1%. Over the same period the benchmark SPY performance was 1.7% and 17.7% respectively. Over the previous week the market value of the iM-Composite (SPY-IEF) Timer gained 2.26% at a time when SPY gained 2.28%. A starting capital of $100,000 at inception on 6/30/2016 would have grown to $135,572 which includes $1,500 cash and excludes $1,390 spent on fees and slippage. |
|
|
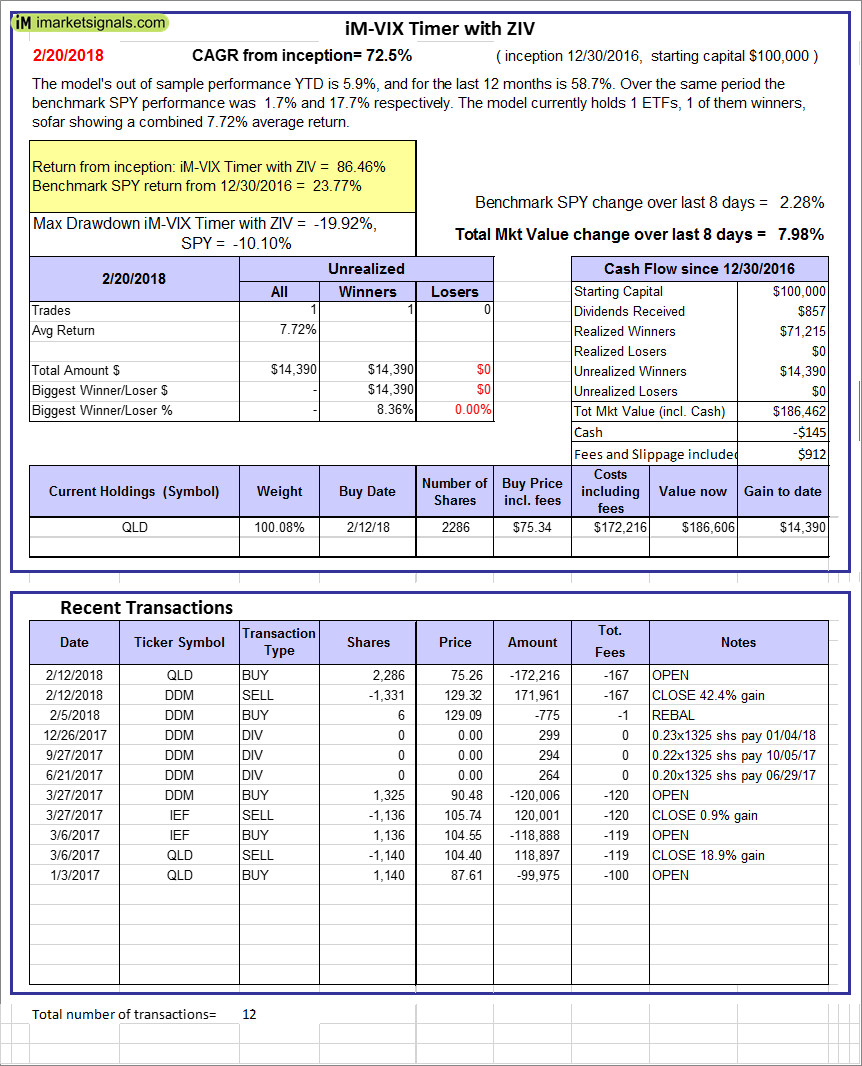
iM-VIX Timer with ZIV: The model’s out of sample performance YTD is 5.9%, and for the last 12 months is 58.7%. Over the same period the benchmark SPY performance was 1.7% and 17.7% respectively. Over the previous week the market value of the iM-VIX Timer with ZIV gained 7.98% at a time when SPY gained 2.28%. A starting capital of $100,000 at inception on 6/30/2016 would have grown to $186,462 which includes -$145 cash and excludes $912 spent on fees and slippage. |
|
|
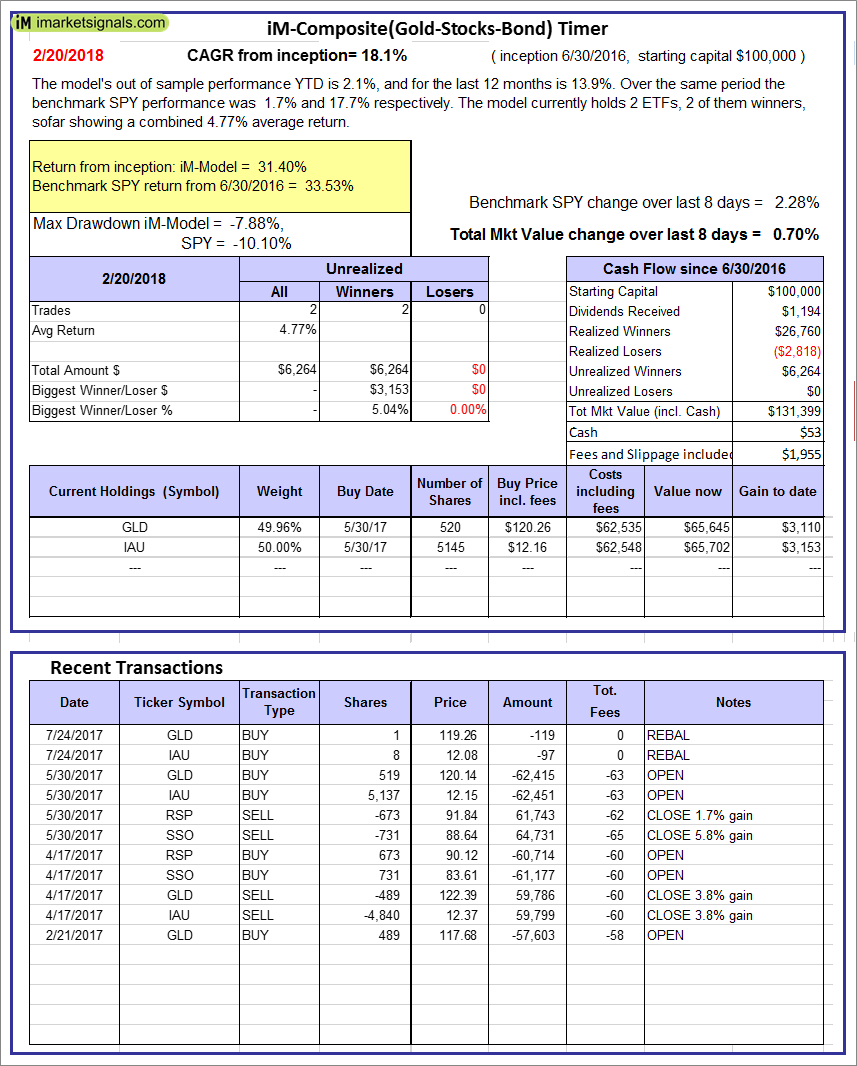
iM-Composite(Gold-Stocks-Bond) Timer: The model’s out of sample performance YTD is 2.1%, and for the last 12 months is 13.9%. Over the same period the benchmark SPY performance was 1.7% and 17.7% respectively. Over the previous week the market value of the iM-Composite(Gold-Stocks-Bond) Timer gained 0.70% at a time when SPY gained 2.28%. A starting capital of $100,000 at inception on 6/30/2016 would have grown to $131,399 which includes $53 cash and excludes $1,955 spent on fees and slippage. |
|
|
iM-Low Turnover Composite Timer Combo: The model’s out of sample performance YTD is 0.0%, and since inception 7.1%. Over the same period the benchmark SPY performance was 1.7% and 17.8% respectively. Over the previous week the market value of the iM-Low Turnover Composite Timer Combo gained 0.94% at a time when SPY gained 2.28%. A starting capital of $100,000 at inception on 3/24/27 would have grown to $107,135 which includes $1,612 cash and excludes $74 spent on fees and slippage. |
|
|
iM-Min Drawdown Combo: The model’s out of sample performance YTD is 0.7%, and since inception 8.7%. Over the same period the benchmark SPY performance was 1.7% and 17.3% respectively. Over the previous week the market value of the iM-Min Drawdown Combo gained 1.46% at a time when SPY gained 2.28%. A starting capital of $100,000 at inception on 4/5/2017 would have grown to $108,700 which includes $1,097 cash and excludes $205 spent on fees and slippage. |
|
|
iM-5ETF Trader (includes leveraged ETFs): The model’s out of sample performance YTD is 2.9%, and for the last 12 months is 36.0%. Over the same period the benchmark SPY performance was 1.7% and 17.7% respectively. Over the previous week the market value of the iM-5ETF Trader (includes leveraged ETFs) gained 4.73% at a time when SPY gained 2.28%. A starting capital of $100,000 at inception on 10/30/2016 would have grown to $167,471 which includes $1,064 cash and excludes $1,030 spent on fees and slippage. |
|
|
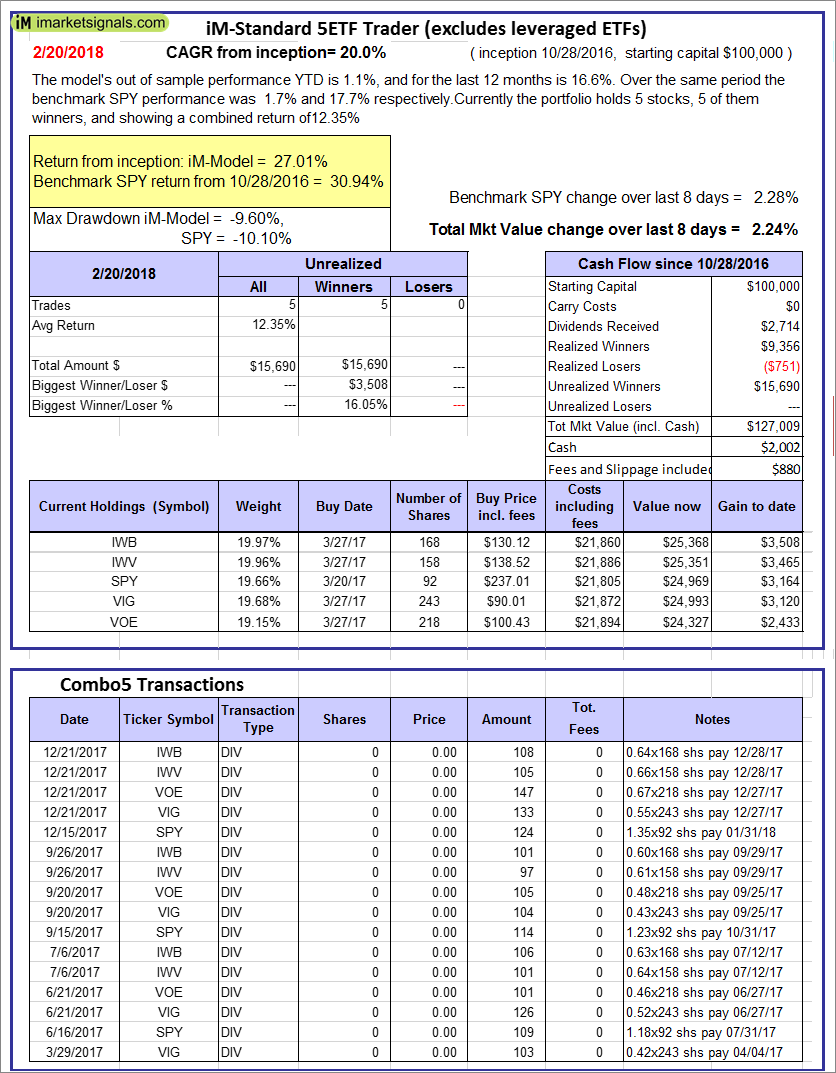
iM-Standard 5ETF Trader (excludes leveraged ETFs): The model’s out of sample performance YTD is 1.1%, and for the last 12 months is 16.6%. Over the same period the benchmark SPY performance was 1.7% and 17.7% respectively. Over the previous week the market value of the iM-Standard 5ETF Trader (excludes leveraged ETFs) gained 2.24% at a time when SPY gained 2.28%. A starting capital of $100,000 at inception on 10/30/2016 would have grown to $127,009 which includes $2,002 cash and excludes $880 spent on fees and slippage. |


Leave a Reply
You must be logged in to post a comment.