
  |
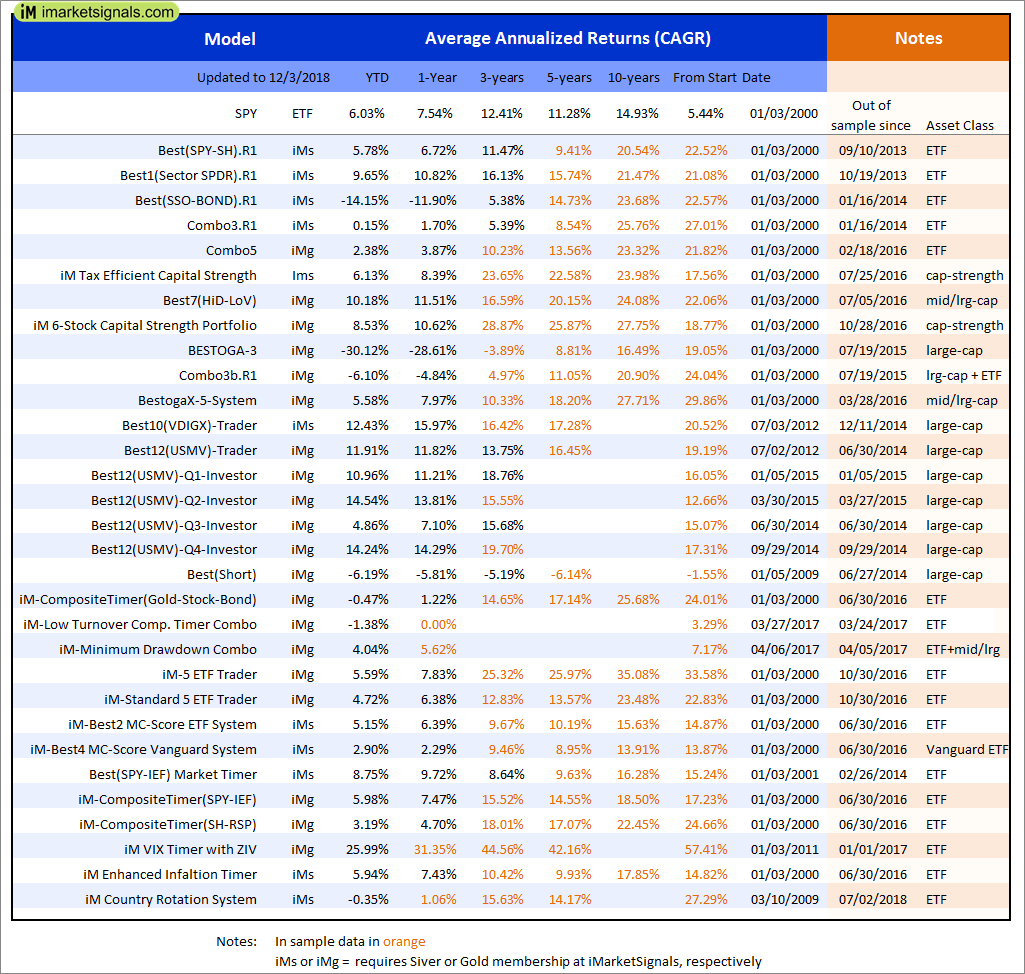
Out of sample performance summary of our models for the past 1, 2, 4 and 13 week periods. The active active return indicates how the models over- or underperformed the benchmark ETF SPY. Also the YTD, and the 1-, 3-, 5- and 10-year annualized returns are shown in the second table |
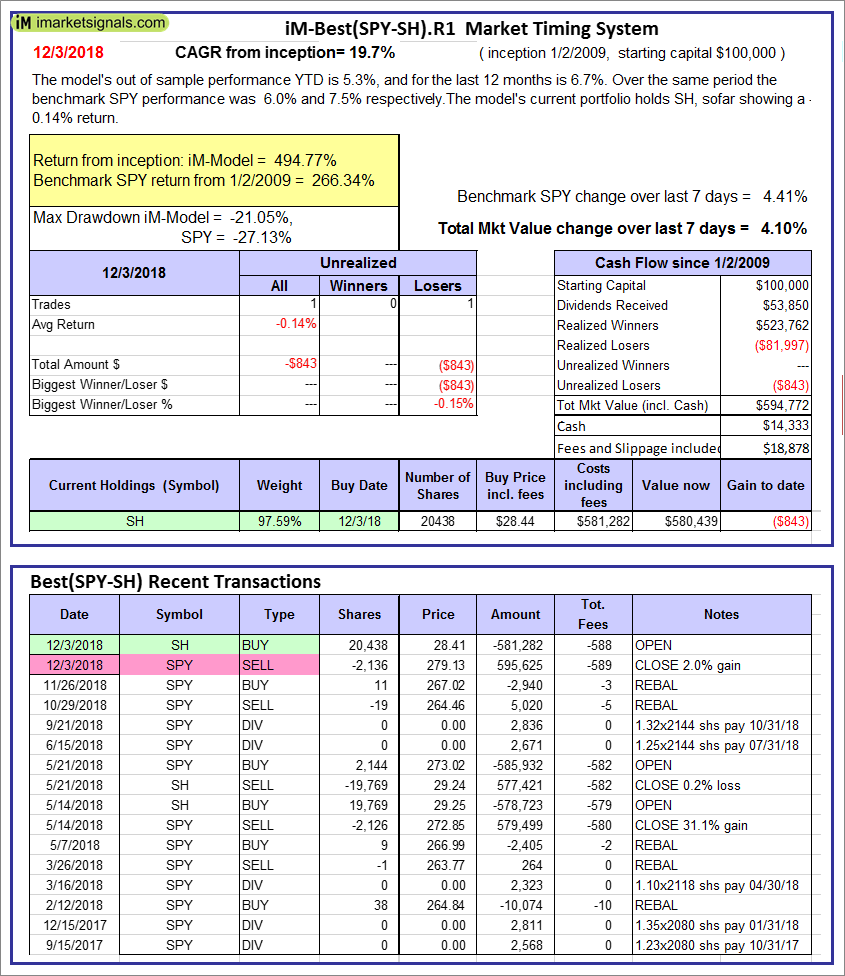 |
iM-Best(SPY-SH).R1: The model’s out of sample performance YTD is 5.3%, and for the last 12 months is 6.7%. Over the same period the benchmark SPY performance was 6.0% and 7.5% respectively. Over the previous week the market value of Best(SPY-SH) gained 4.10% at a time when SPY gained 4.41%. A starting capital of $100,000 at inception on 1/2/2009 would have grown to $594,772 which includes $14,333 cash and excludes $18,878 spent on fees and slippage. |
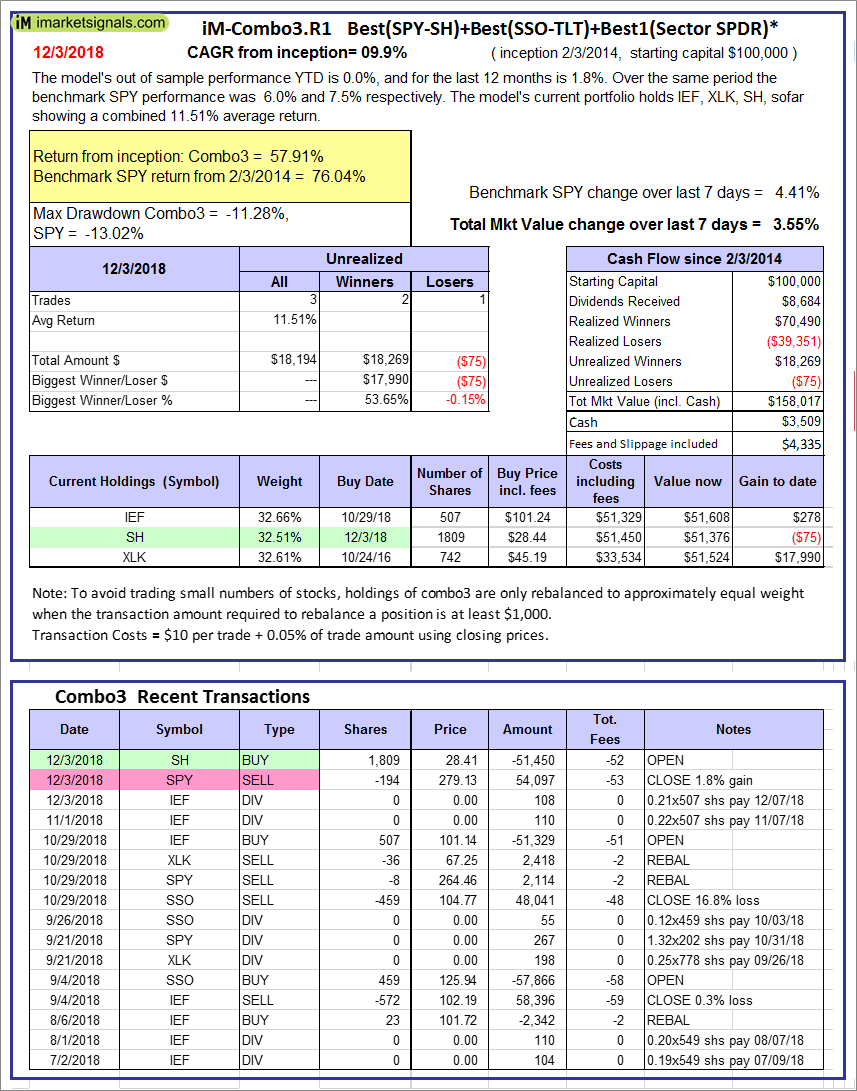 |
iM-Combo3.R1: The model’s out of sample performance YTD is 0.0%, and for the last 12 months is 1.8%. Over the same period the benchmark SPY performance was 6.0% and 7.5% respectively. Over the previous week the market value of iM-Combo3.R1 gained 3.55% at a time when SPY gained 4.41%. A starting capital of $100,000 at inception on 2/3/2014 would have grown to $158,017 which includes $3,509 cash and excludes $4,335 spent on fees and slippage. |
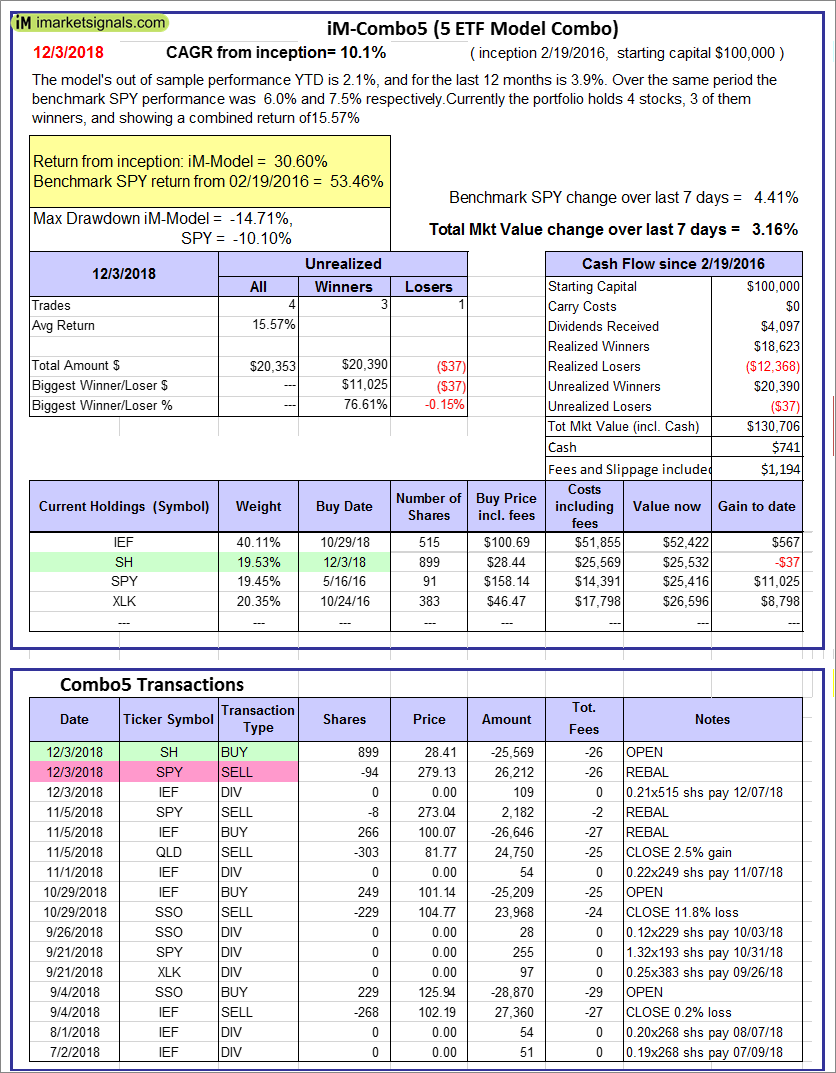 |
iM-Combo5: The model’s out of sample performance YTD is 2.1%, and for the last 12 months is 3.9%. Over the same period the benchmark SPY performance was 6.0% and 7.5% respectively. Over the previous week the market value of iM-Combo5 gained 3.16% at a time when SPY gained 4.41%. A starting capital of $100,000 at inception on 2/22/2016 would have grown to $130,706 which includes $741 cash and excludes $1,194 spent on fees and slippage. |
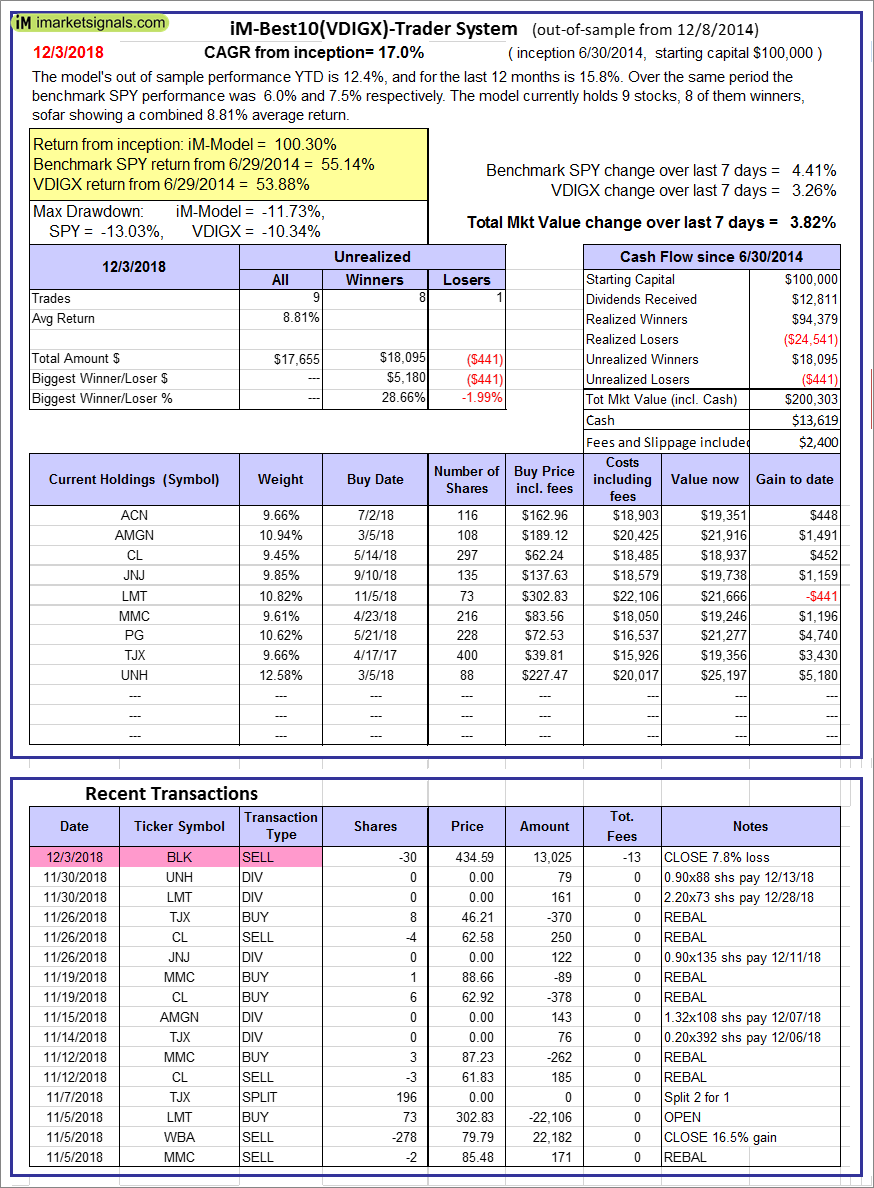 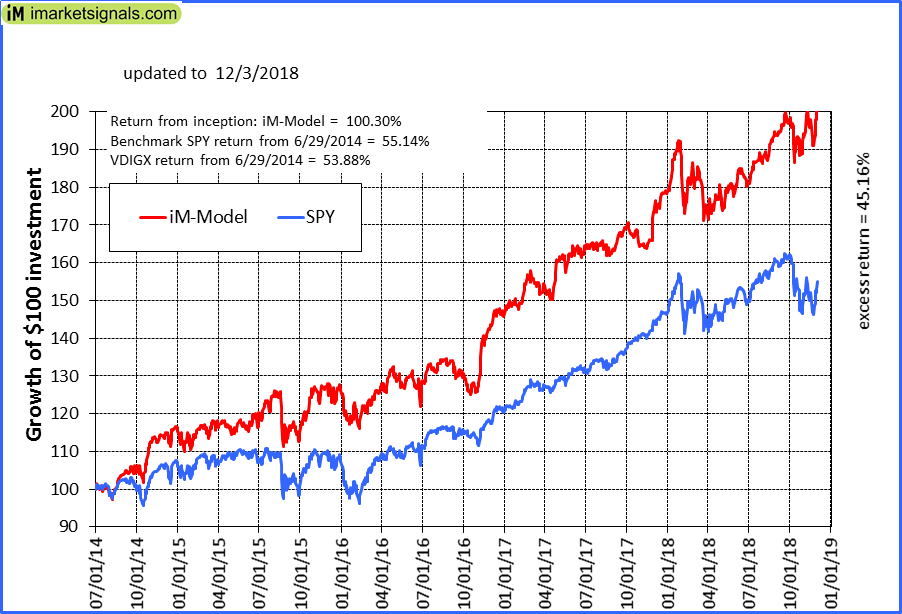 |
iM-Best10(VDIGX)-Trader: The model’s out of sample performance YTD is 12.4%, and for the last 12 months is 15.8%. Over the same period the benchmark SPY performance was 6.0% and 7.5% respectively. Since inception, on 7/1/2014, the model gained 100.30% while the benchmark SPY gained 55.14% and VDIGX gained 53.88% over the same period. Over the previous week the market value of iM-Best10(VDIGX) gained 3.82% at a time when SPY gained 4.41%. A starting capital of $100,000 at inception on 7/1/2014 would have grown to $200,303 which includes $13,619 cash and excludes $2,400 spent on fees and slippage. |
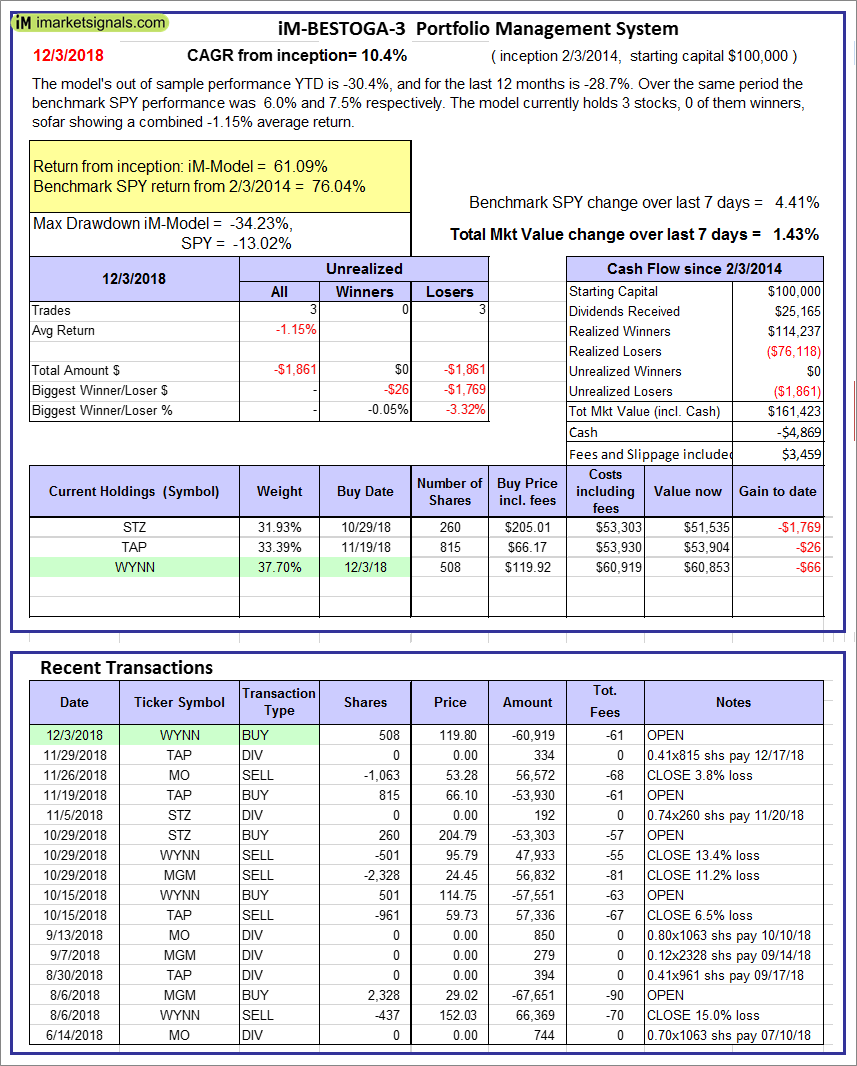 |
iM-BESTOGA-3: The model’s out of sample performance YTD is -30.4%, and for the last 12 months is -28.7%. Over the same period the benchmark SPY performance was 6.0% and 7.5% respectively. Over the previous week the market value of iM-BESTOGA-3 gained 1.43% at a time when SPY gained 4.41%. A starting capital of $100,000 at inception on 2/3/2014 would have grown to $161,423 which includes -$4,869 cash and excludes $3,459 spent on fees and slippage. |
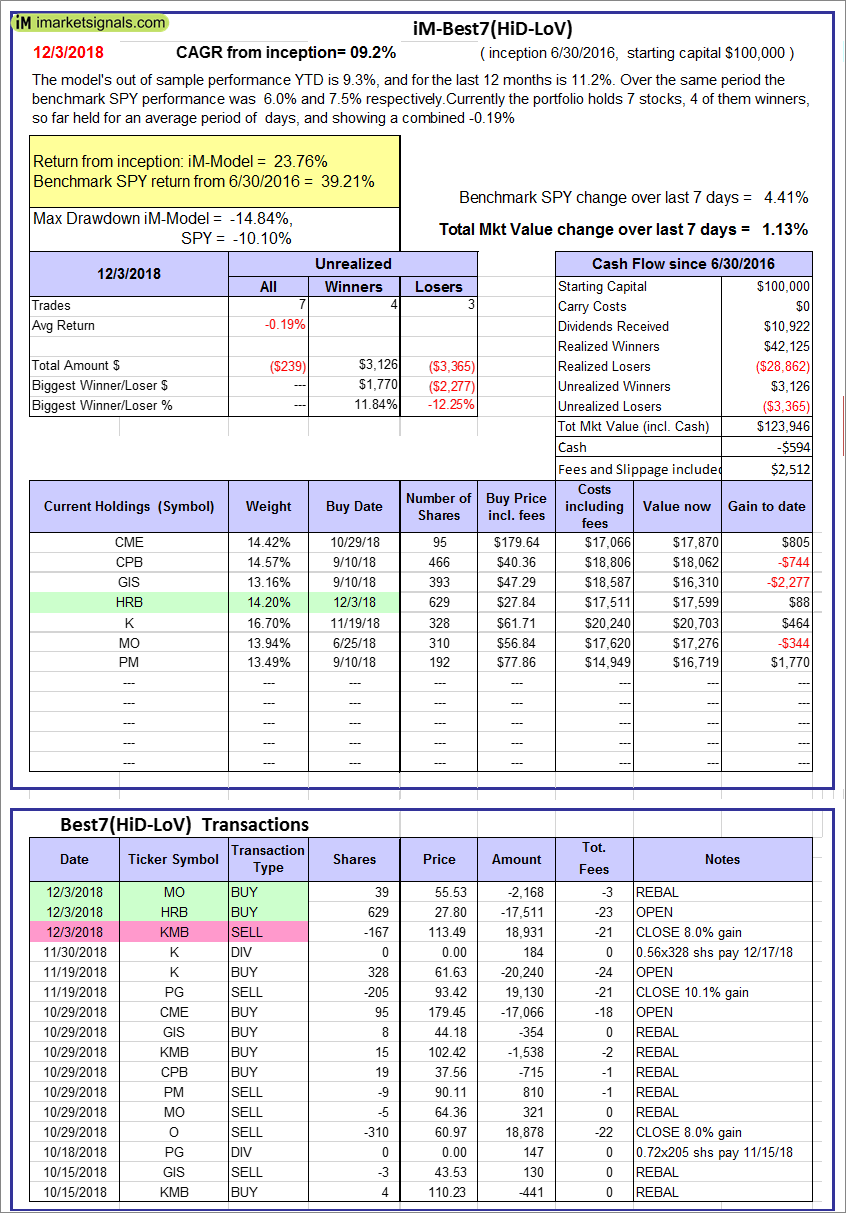 |
iM-Best7(HiD-LoV): The model’s out of sample performance YTD is 9.3%, and for the last 12 months is 11.2%. Over the same period the benchmark SPY performance was 6.0% and 7.5% respectively. Over the previous week the market value of iM-BESTOGA-3 gained 1.13% at a time when SPY gained 4.41%. A starting capital of $100,000 at inception on 6/30/2016 would have grown to $123,946 which includes -$594 cash and excludes $2,512 spent on fees and slippage. |
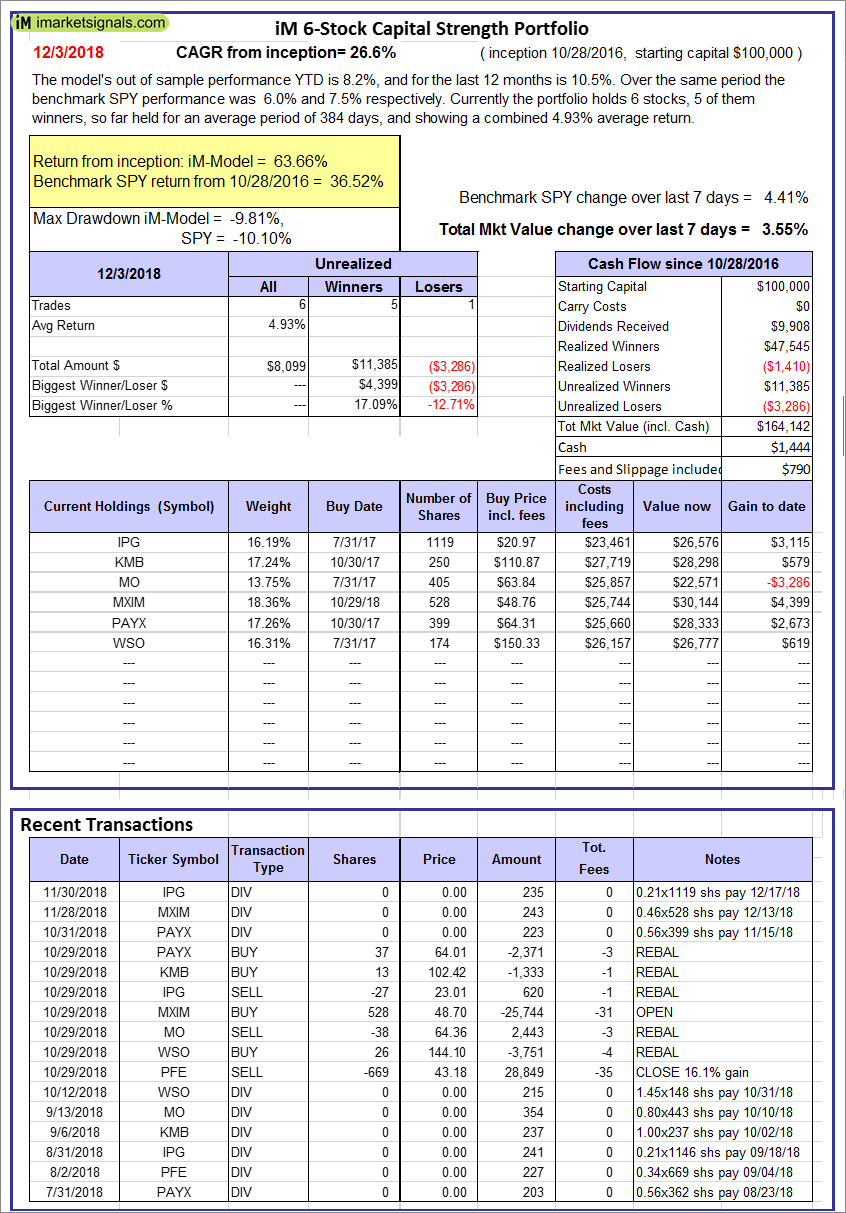 |
iM 6-Stock Capital Strength Portfolio: The model’s out of sample performance YTD is 8.2%, and for the last 12 months is 10.5%. Over the same period the benchmark SPY performance was 6.0% and 7.5% respectively. Over the previous week the market value of the iM 6-Stock Capital Strength Portfolio gained 3.55% at a time when SPY gained 4.41%. A starting capital of $100,000 at inception on 10/28/2016 would have grown to $164,142 which includes $1,444 cash and excludes $790 spent on fees and slippage. |
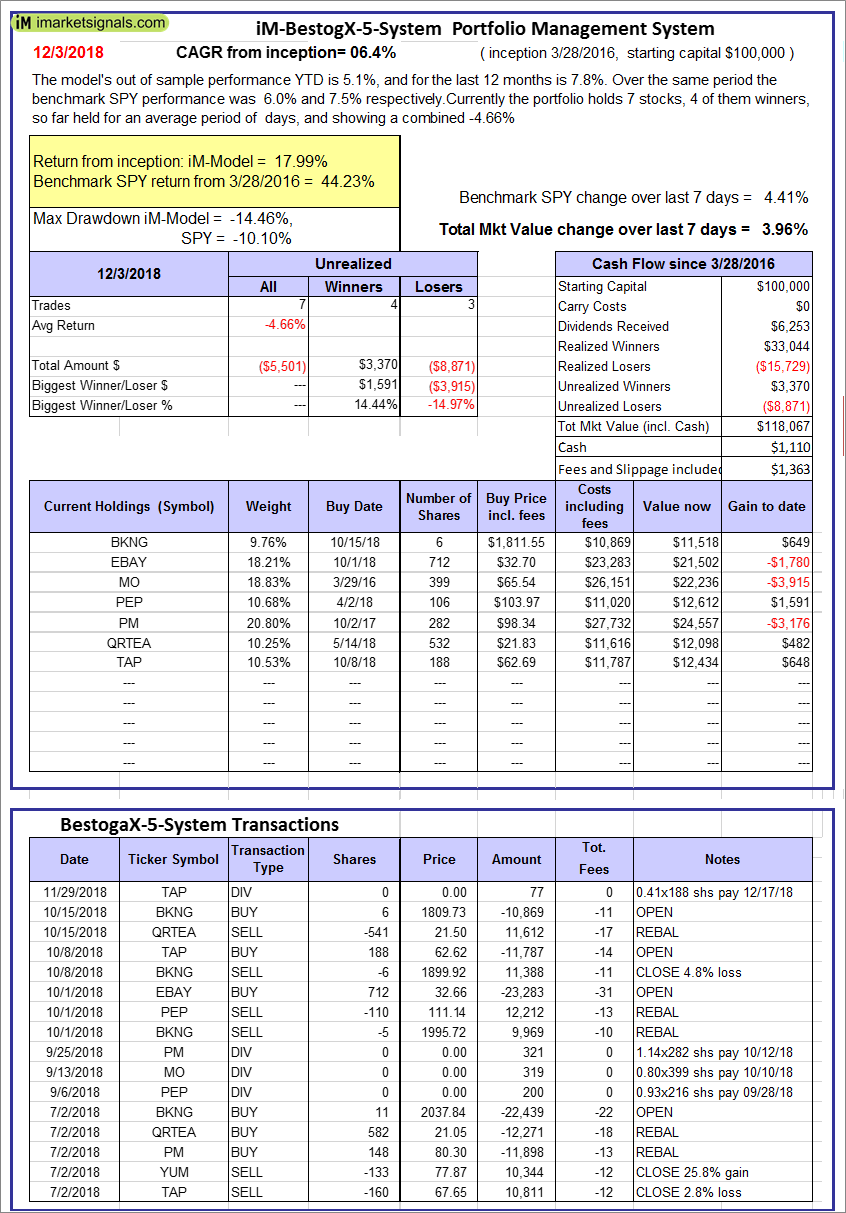 |
iM-BestogaX5-System: The model’s out of sample performance YTD is 5.1%, and for the last 12 months is 7.8%. Over the same period the benchmark SPY performance was 6.0% and 7.5% respectively. Over the previous week the market value of iM-BestogaX5-System gained 3.96% at a time when SPY gained 4.41%. A starting capital of $100,000 at inception on 3/28/2016 would have grown to $118,067 which includes $1,110 cash and excludes $1,363 spent on fees and slippage. |
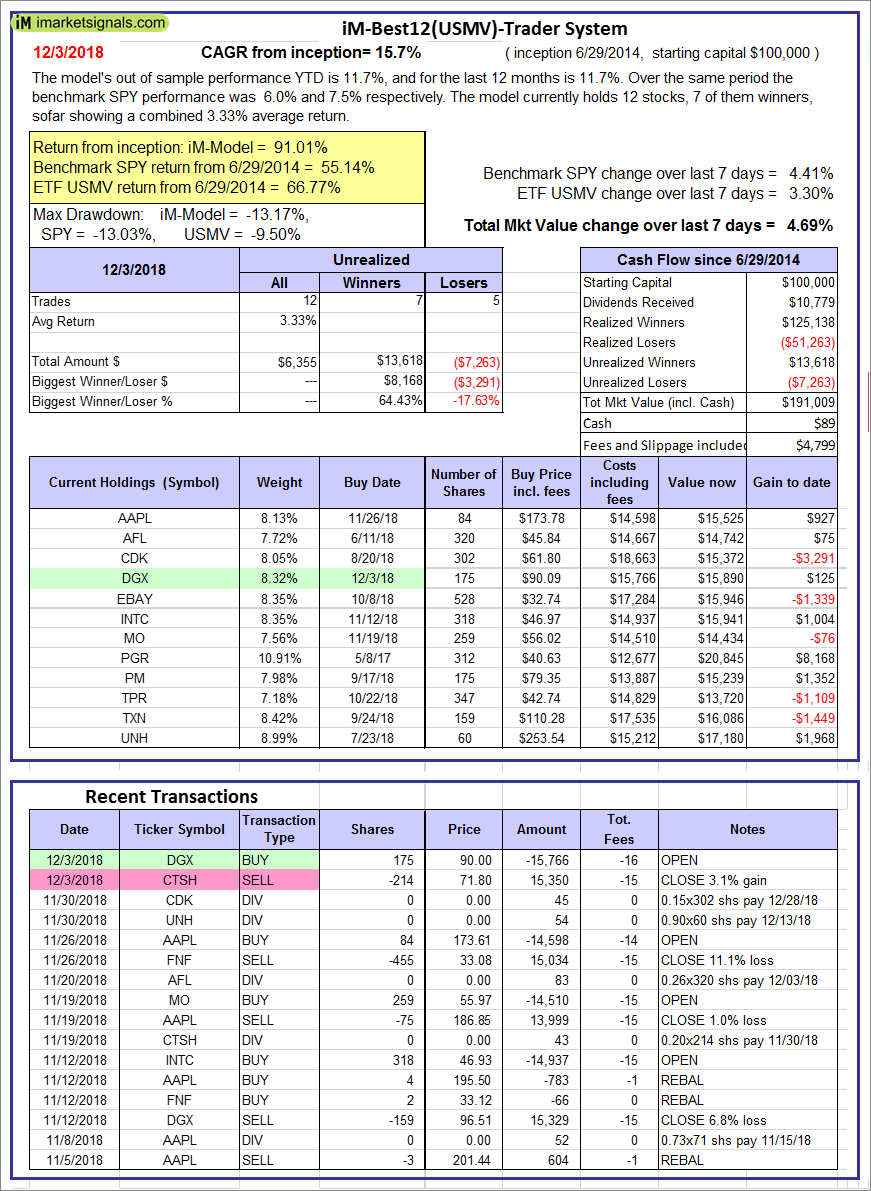 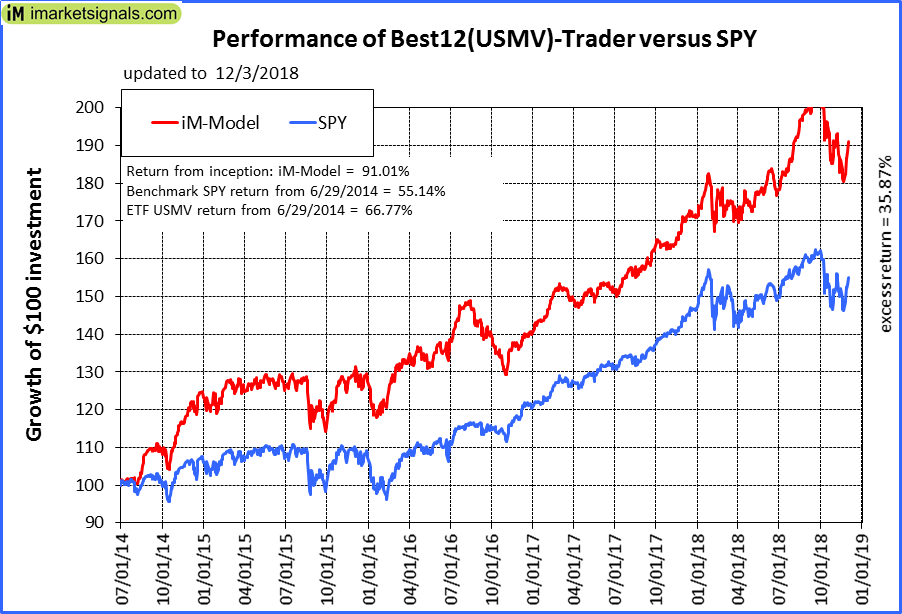 |
iM-Best12(USMV)-Trader: The model’s out of sample performance YTD is 11.7%, and for the last 12 months is 11.7%. Over the same period the benchmark SPY performance was 6.0% and 7.5% respectively. Since inception, on 6/30/2014, the model gained 91.01% while the benchmark SPY gained 55.14% and the ETF USMV gained 66.77% over the same period. Over the previous week the market value of iM-Best12(USMV)-Trader gained 4.69% at a time when SPY gained 4.41%. A starting capital of $100,000 at inception on 6/30/2014 would have grown to $191,009 which includes $89 cash and excludes $4,799 spent on fees and slippage. |
 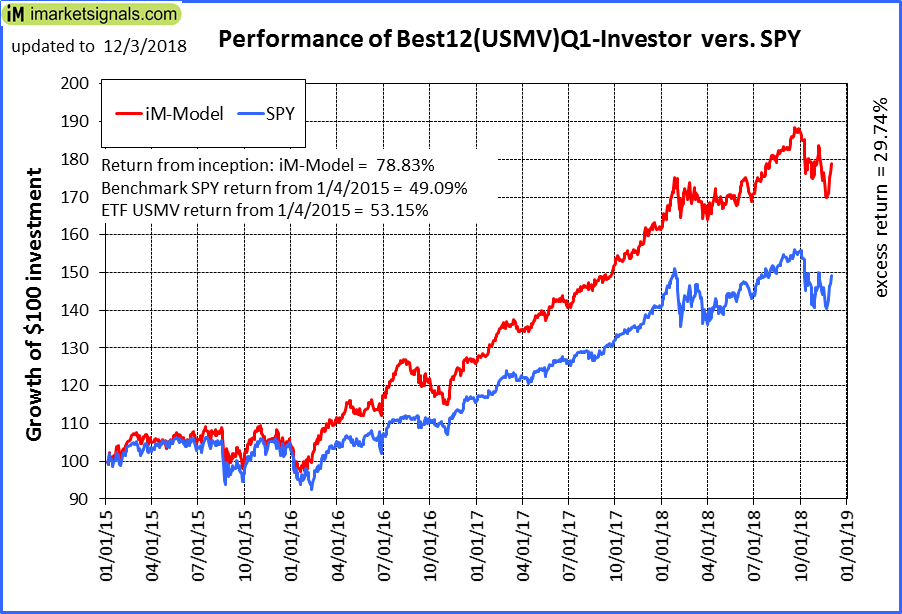 |
iM-Best12(USMV)Q1-Investor: The model’s out of sample performance YTD is 10.8%, and for the last 12 months is 11.1%. Over the same period the benchmark SPY performance was 6.0% and 7.5% respectively. Since inception, on 1/5/2015, the model gained 78.83% while the benchmark SPY gained 49.09% and the ETF USMV gained 53.15% over the same period. Over the previous week the market value of iM-Best12(USMV)Q1 gained 4.47% at a time when SPY gained 4.41%. A starting capital of $100,000 at inception on 1/5/2015 would have grown to $178,831 which includes $2,011 cash and excludes $1,345 spent on fees and slippage. |
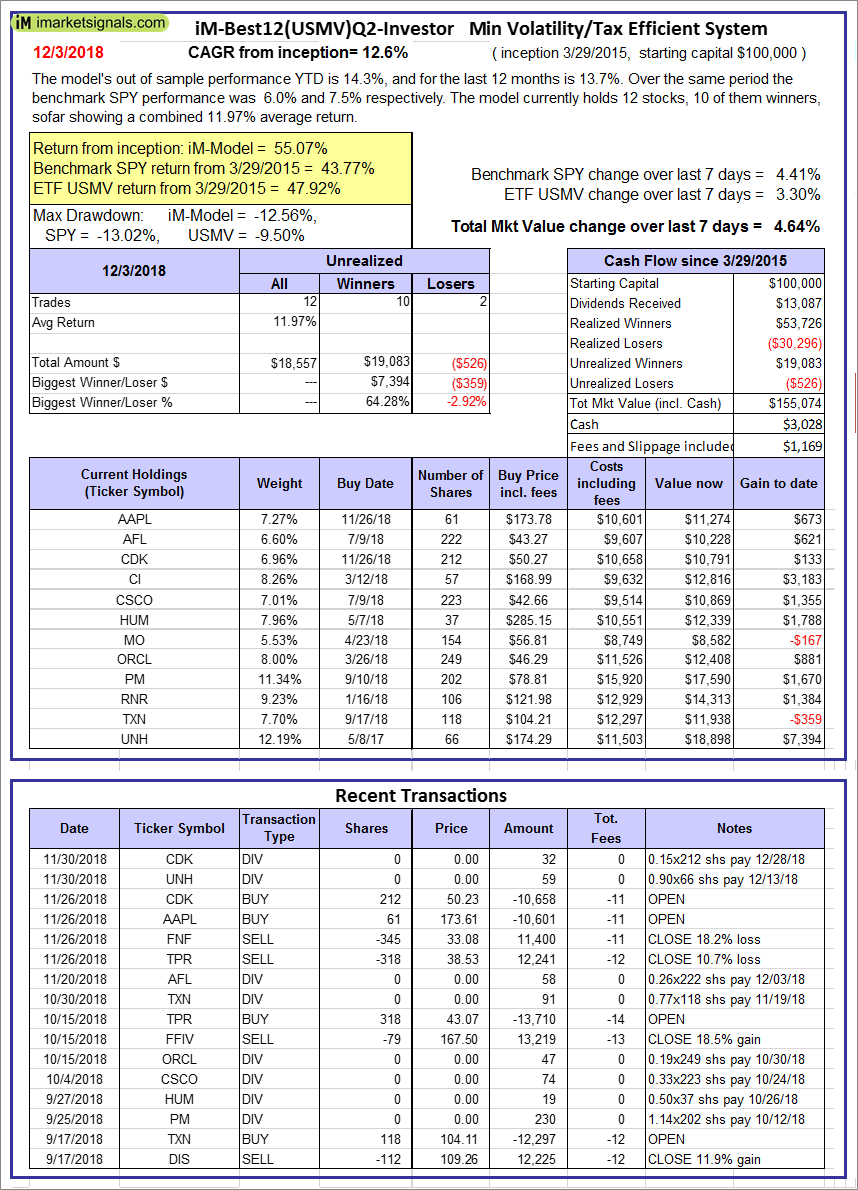 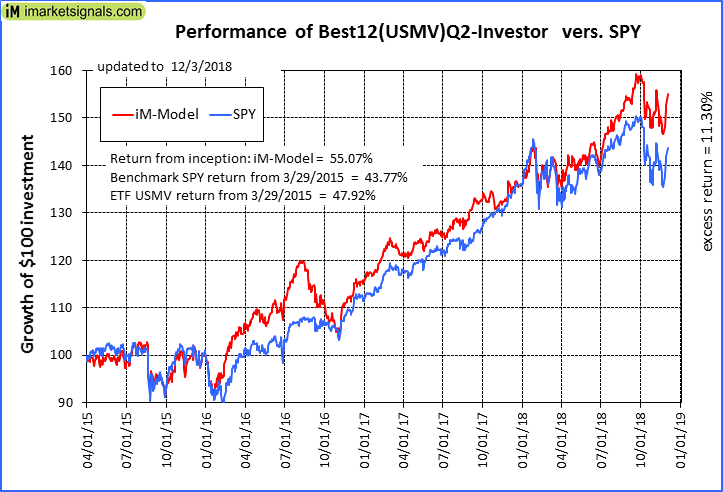 |
iM-Best12(USMV)Q2-Investor: The model’s out of sample performance YTD is 14.3%, and for the last 12 months is 13.7%. Over the same period the benchmark SPY performance was 6.0% and 7.5% respectively. Since inception, on 3/30/2015, the model gained 55.07% while the benchmark SPY gained 43.77% and the ETF USMV gained 47.92% over the same period. Over the previous week the market value of iM-Best12(USMV)Q2 gained 4.64% at a time when SPY gained 4.41%. A starting capital of $100,000 at inception on 3/30/2015 would have grown to $155,074 which includes $3,028 cash and excludes $1,169 spent on fees and slippage. |
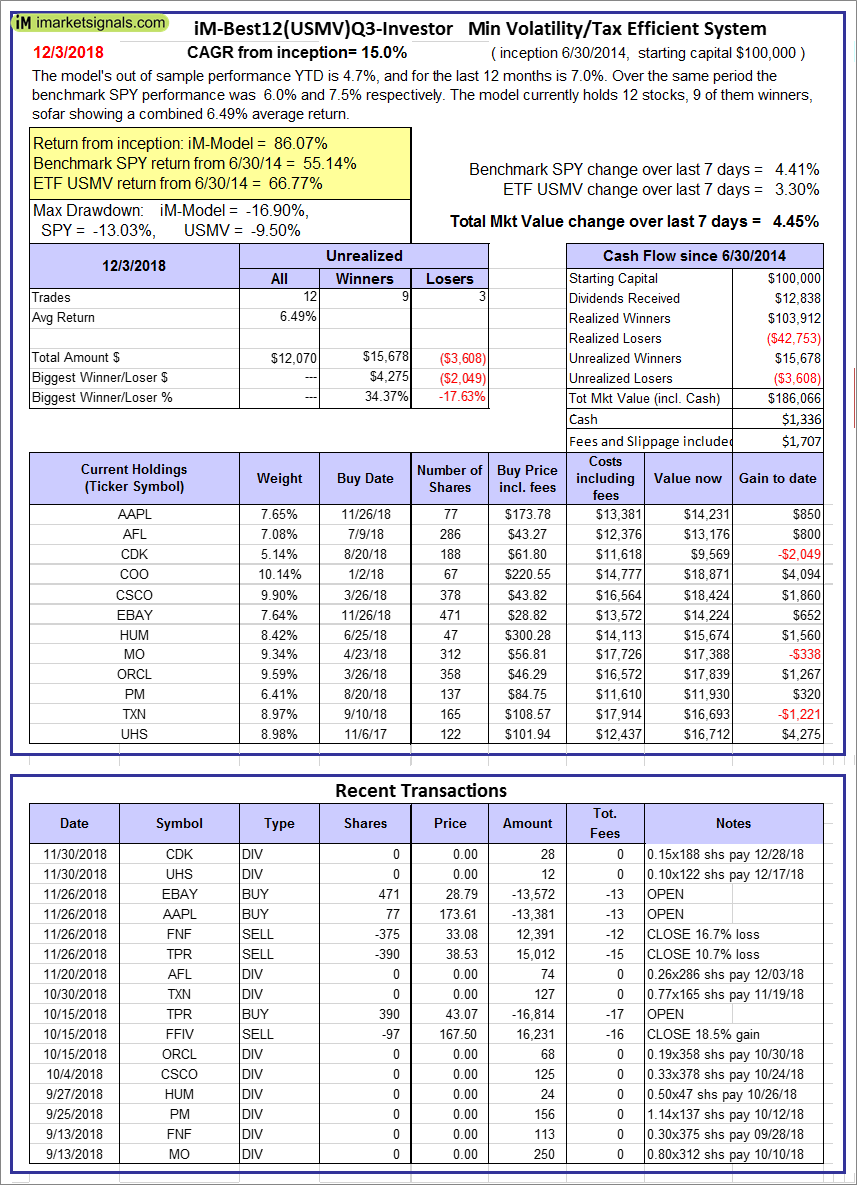 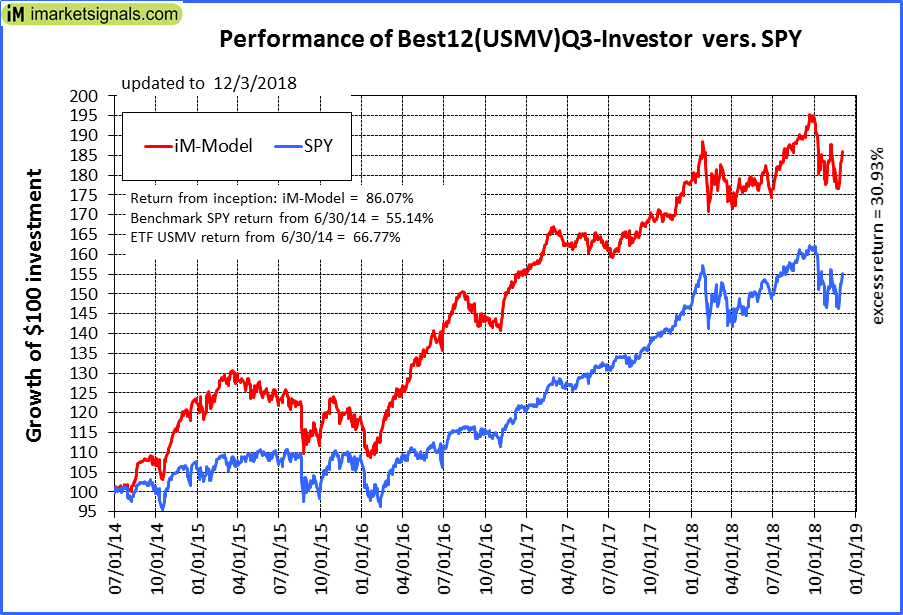 |
iM-Best12(USMV)Q3-Investor: The model’s out of sample performance YTD is 4.7%, and for the last 12 months is 7.0%. Over the same period the benchmark SPY performance was 6.0% and 7.5% respectively. Since inception, on 7/1/2014, the model gained 86.07% while the benchmark SPY gained 55.14% and the ETF USMV gained 66.77% over the same period. Over the previous week the market value of iM-Best12(USMV)Q3 gained 4.45% at a time when SPY gained 4.41%. A starting capital of $100,000 at inception on 7/1/2014 would have grown to $186,066 which includes $1,336 cash and excludes $1,707 spent on fees and slippage. |
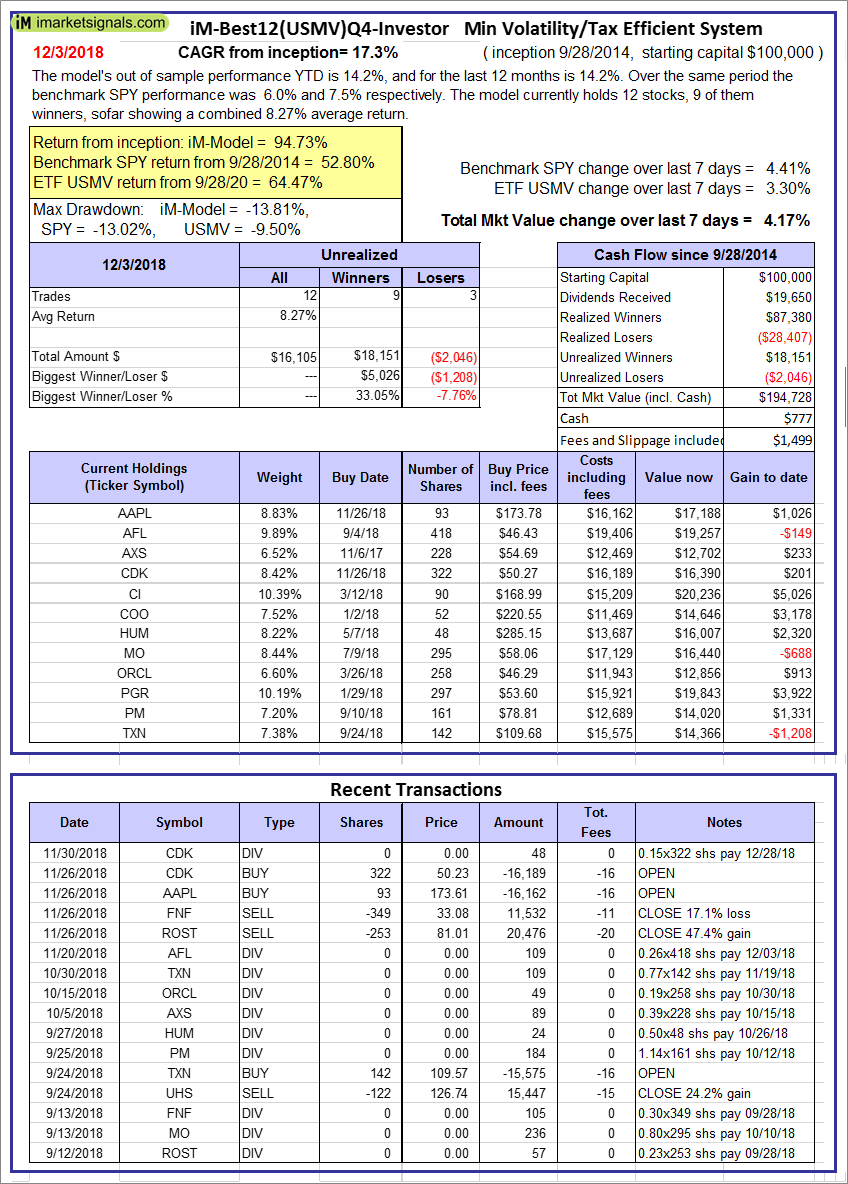 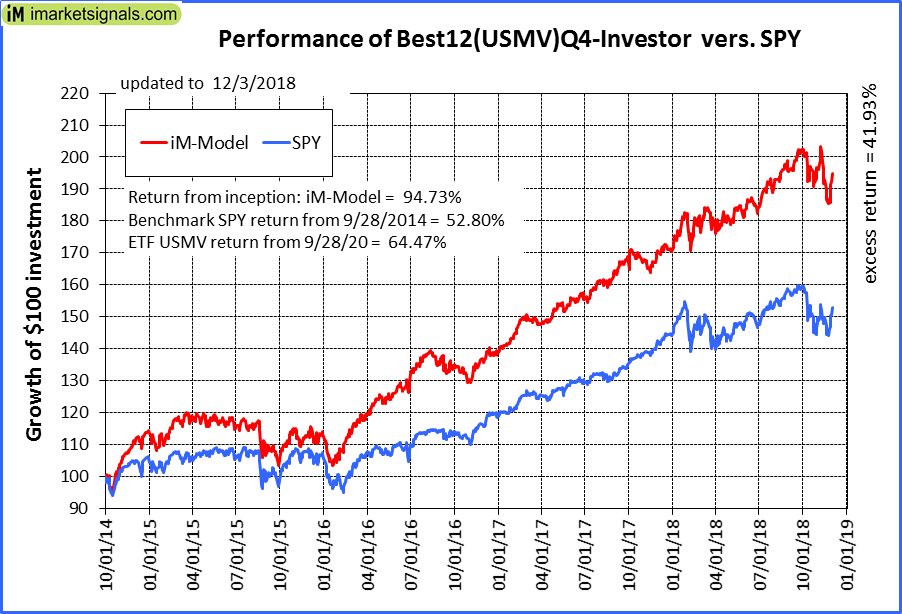 |
iM-Best12(USMV)Q4-Investor: Since inception, on 9/29/2014, the model gained 94.73% while the benchmark SPY gained 52.80% and the ETF USMV gained 64.47% over the same period. Over the previous week the market value of iM-Best12(USMV)Q4 gained 4.17% at a time when SPY gained 4.41%. A starting capital of $100,000 at inception on 9/29/2014 would have grown to $194,728 which includes $777 cash and excludes $1,499 spent on fees and slippage. |
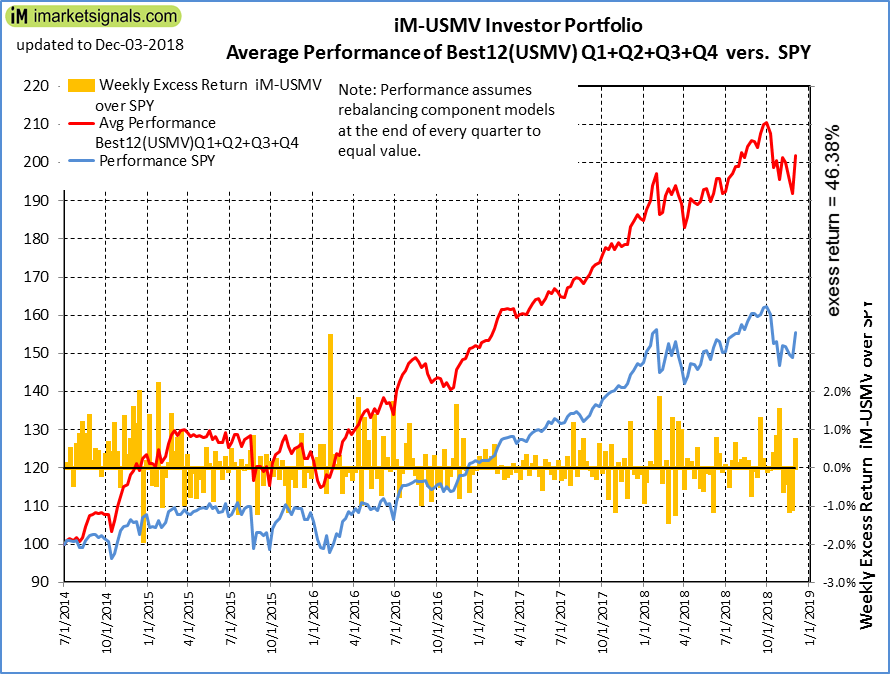 |
Average Performance of iM-Best12(USMV)Q1+Q2+Q3+Q4-Investor resulted in an excess return of 46.38% over SPY. (see iM-USMV Investor Portfolio) |
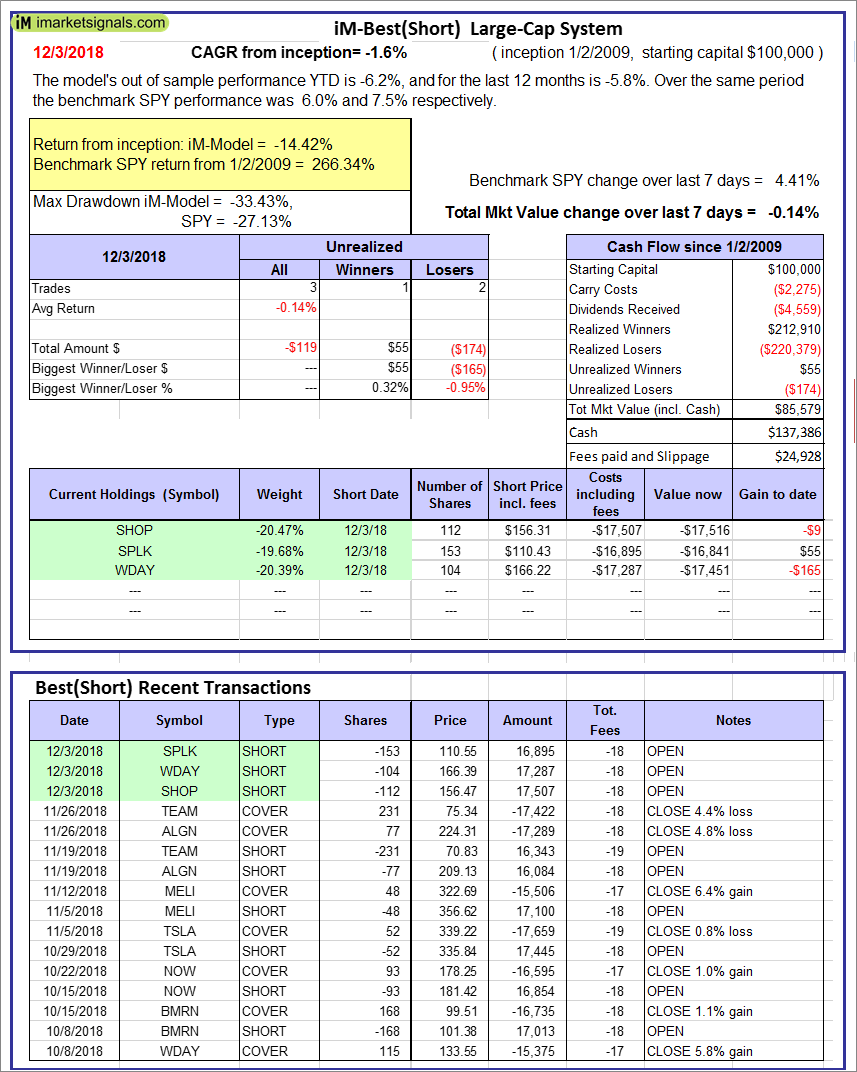 |
iM-Best(Short): The model’s out of sample performance YTD is -6.2%, and for the last 12 months is -5.8%. Over the same period the benchmark SPY performance was 6.0% and 7.5% respectively. Over the previous week the market value of iM-Best(Short) gained -0.14% at a time when SPY gained 4.41%. Over the period 1/2/2009 to 12/3/2018 the starting capital of $100,000 would have grown to $85,579 which includes $137,386 cash and excludes $24,928 spent on fees and slippage. |
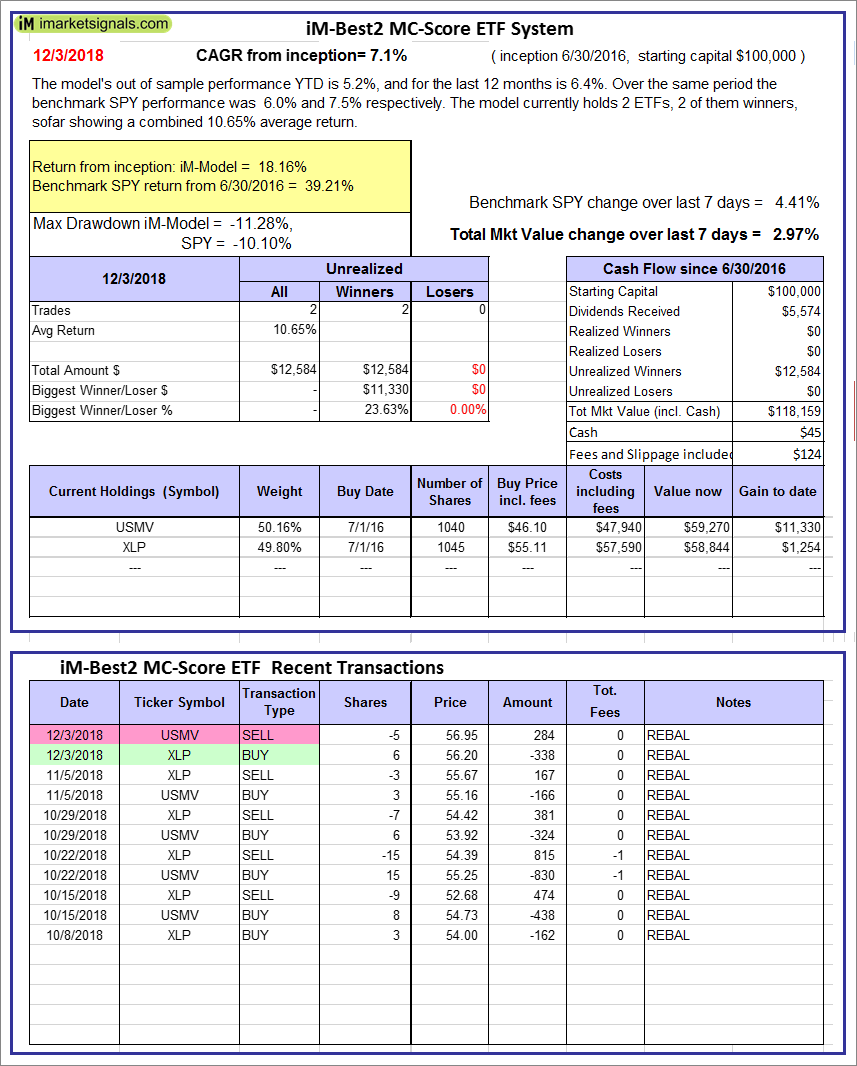 |
iM-Best2 MC-Score ETF System: The model’s out of sample performance YTD is 5.2%, and for the last 12 months is 6.4%. Over the same period the benchmark SPY performance was 6.0% and 7.5% respectively. Over the previous week the market value of the iM-Best2 MC-Score ETF System gained 2.97% at a time when SPY gained 4.41%. A starting capital of $100,000 at inception on 6/30/2016 would have grown to $118,159 which includes $45 cash and excludes $124 spent on fees and slippage. |
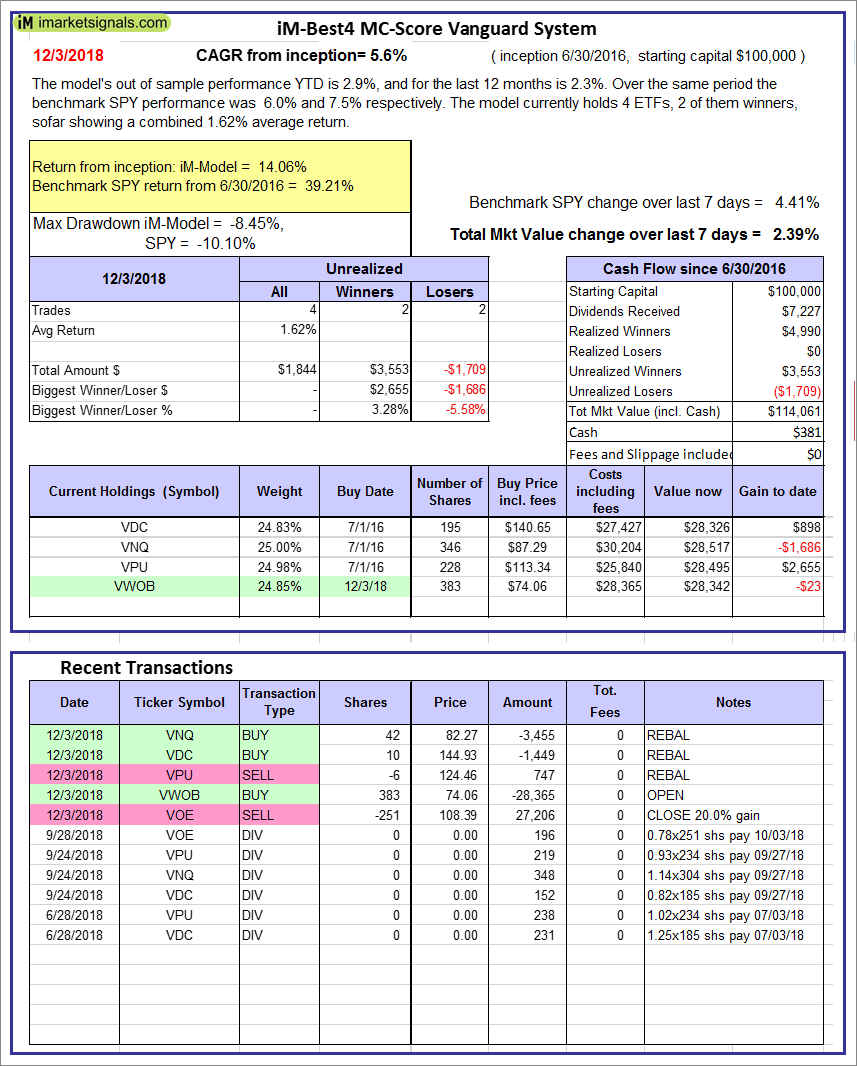 |
iM-Best4 MC-Score Vanguard System: The model’s out of sample performance YTD is 2.9%, and for the last 12 months is 2.3%. Over the same period the benchmark SPY performance was 6.0% and 7.5% respectively. Over the previous week the market value of the iM-Best4 MC-Score Vanguard System gained 2.39% at a time when SPY gained 4.41%. A starting capital of $100,000 at inception on 6/30/2016 would have grown to $114,061 which includes $381 cash and excludes $00 spent on fees and slippage. |
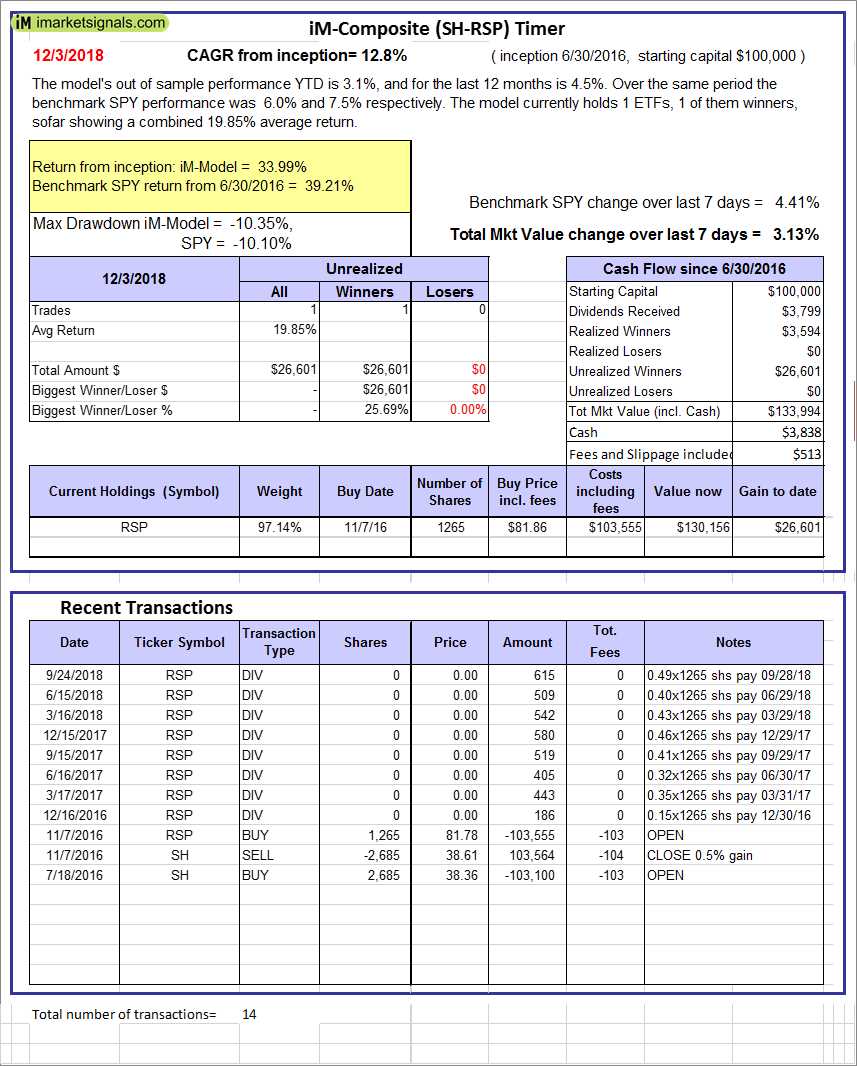 |
iM-Composite (SH-RSP) Timer: The model’s out of sample performance YTD is 3.1%, and for the last 12 months is 4.5%. Over the same period the benchmark SPY performance was 6.0% and 7.5% respectively. Over the previous week the market value of the iM-Composite (SH-RSP) Timer gained 3.13% at a time when SPY gained 4.41%. A starting capital of $100,000 at inception on 6/30/2016 would have grown to $133,994 which includes $3,838 cash and excludes $513 spent on fees and slippage. |
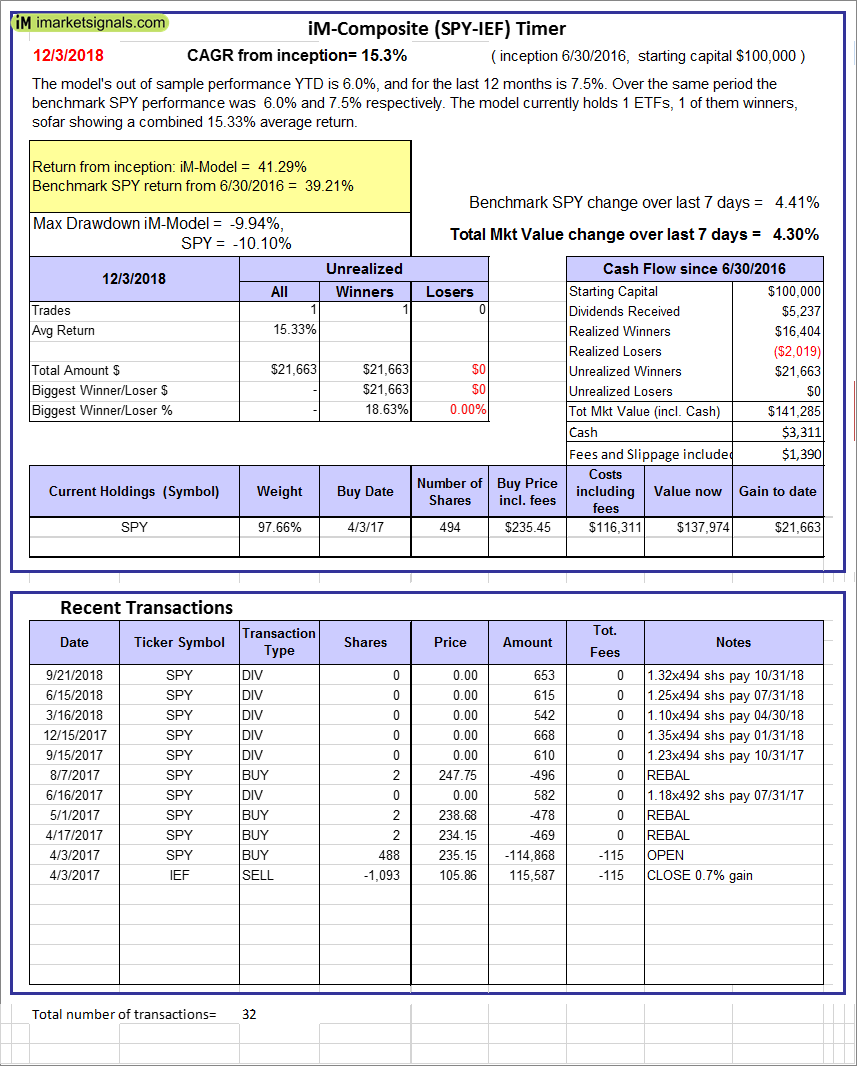 |
iM-Composite (SPY-IEF) Timer: The model’s out of sample performance YTD is 6.0%, and for the last 12 months is 7.5%. Over the same period the benchmark SPY performance was 6.0% and 7.5% respectively. Over the previous week the market value of the iM-Composite (SPY-IEF) Timer gained 4.30% at a time when SPY gained 4.41%. A starting capital of $100,000 at inception on 6/30/2016 would have grown to $141,285 which includes $3,311 cash and excludes $1,390 spent on fees and slippage. |
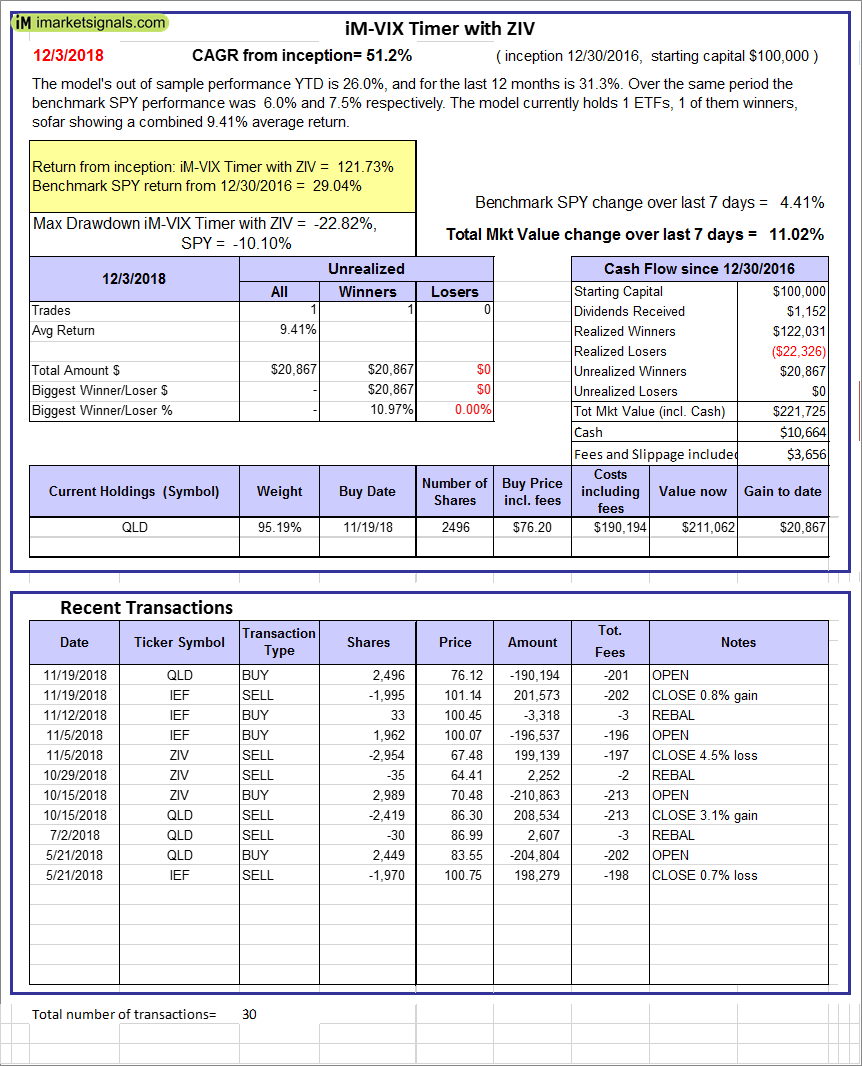 |
iM-VIX Timer with ZIV: The model’s out of sample performance YTD is 26.0%, and for the last 12 months is 31.3%. Over the same period the benchmark SPY performance was 6.0% and 7.5% respectively. Over the previous week the market value of the iM-VIX Timer with ZIV gained 11.02% at a time when SPY gained 4.41%. A starting capital of $100,000 at inception on 6/30/2016 would have grown to $221,725 which includes $10,664 cash and excludes $3,656 spent on fees and slippage. |
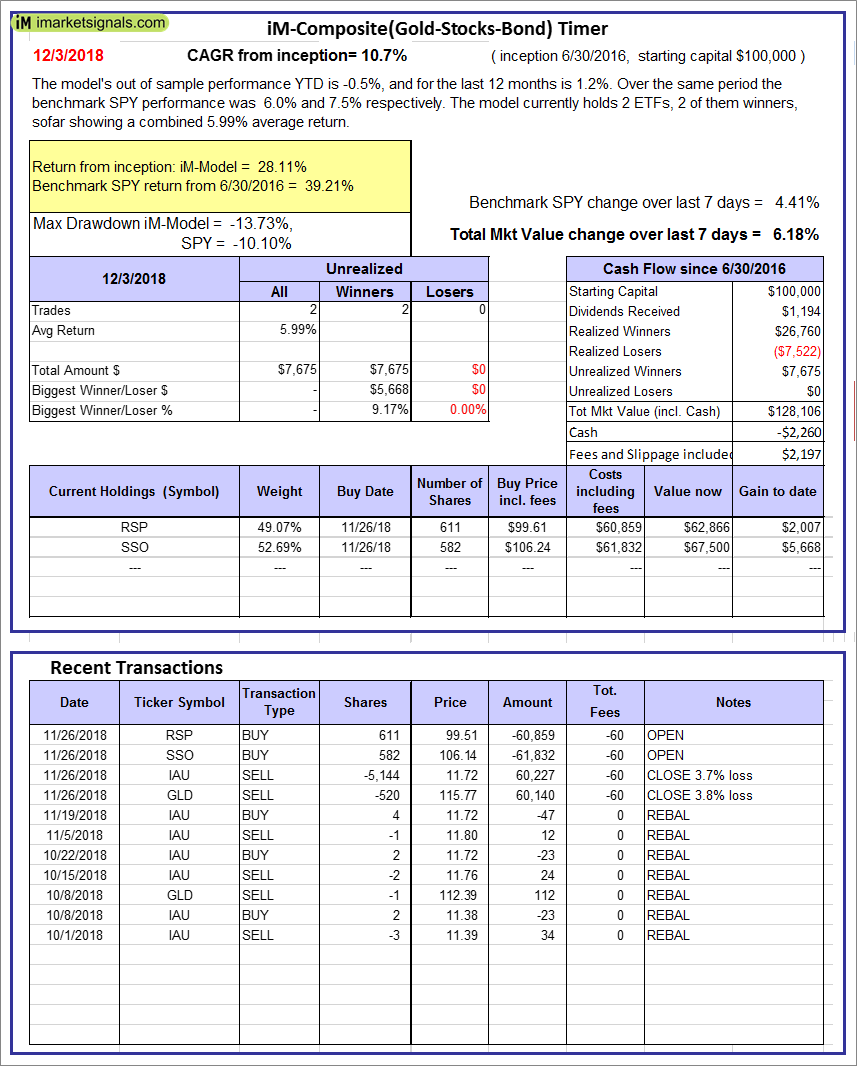 |
iM-Composite(Gold-Stocks-Bond) Timer: The model’s out of sample performance YTD is -0.5%, and for the last 12 months is 1.2%. Over the same period the benchmark SPY performance was 6.0% and 7.5% respectively. Over the previous week the market value of the iM-Composite(Gold-Stocks-Bond) Timer gained 6.18% at a time when SPY gained 4.41%. A starting capital of $100,000 at inception on 6/30/2016 would have grown to $128,106 which includes -$2,260 cash and excludes $2,197 spent on fees and slippage. |
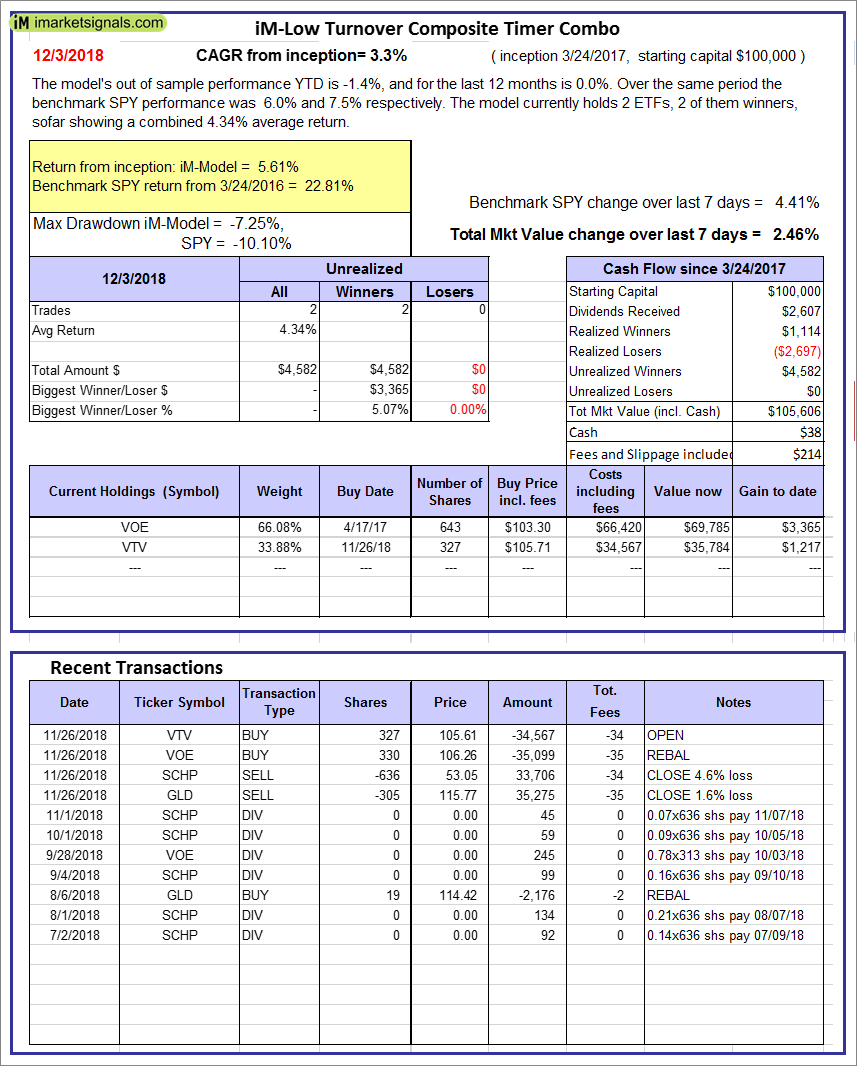 |
iM-Low Turnover Composite Timer Combo: The model’s out of sample performance YTD is -1.4%, and for the last 12 months is 0.0%. Over the same period the benchmark SPY performance was 6.0% and 7.5% respectively. Over the previous week the market value of the iM-Low Turnover Composite Timer Combo gained 2.46% at a time when SPY gained 4.41%. A starting capital of $100,000 at inception on 3/24/27 would have grown to $105,606 which includes $38 cash and excludes $214 spent on fees and slippage. |
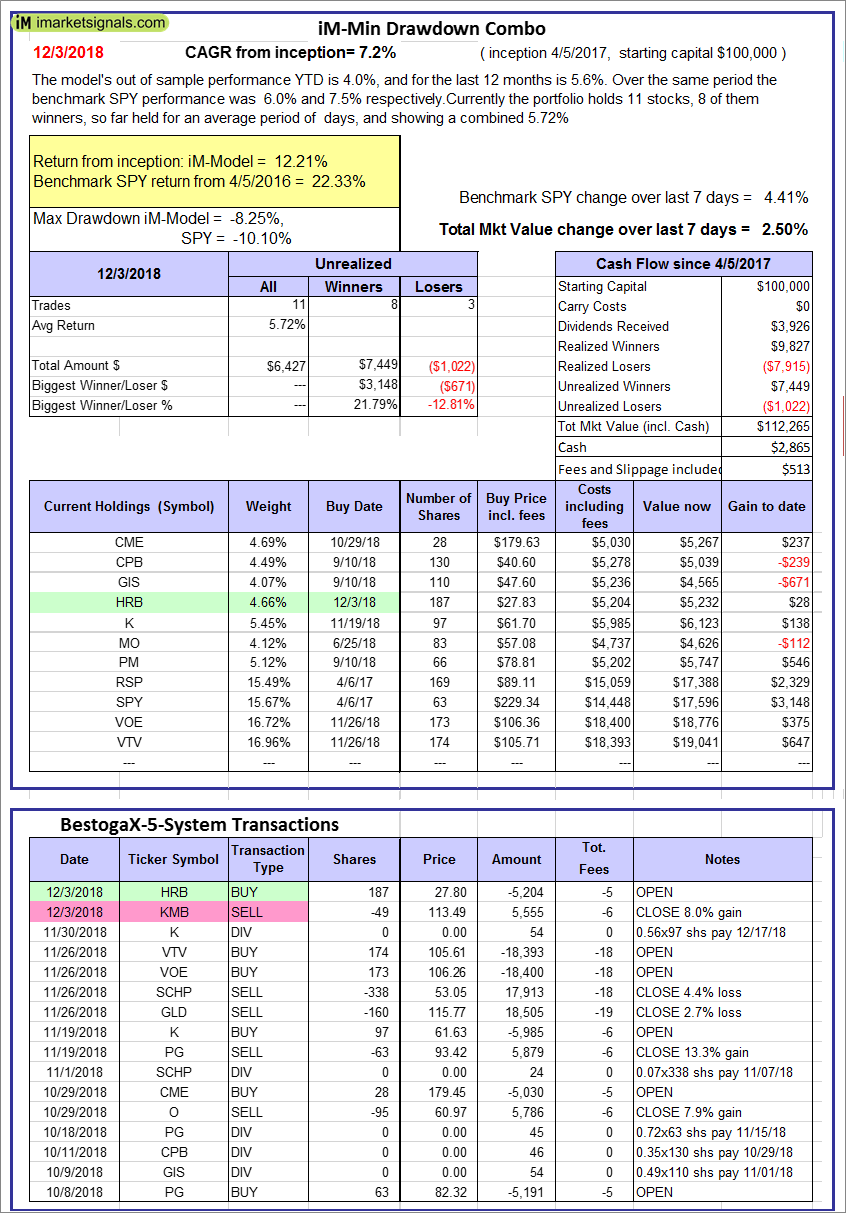 |
iM-Min Drawdown Combo: The model’s out of sample performance YTD is 4.0%, and for the last 12 months is 5.6%. Over the same period the benchmark SPY performance was 6.0% and 7.5% respectively. Over the previous week the market value of the iM-Min Drawdown Combo gained 2.50% at a time when SPY gained 4.41%. A starting capital of $100,000 at inception on 4/5/2017 would have grown to $112,265 which includes $2,865 cash and excludes $513 spent on fees and slippage. |
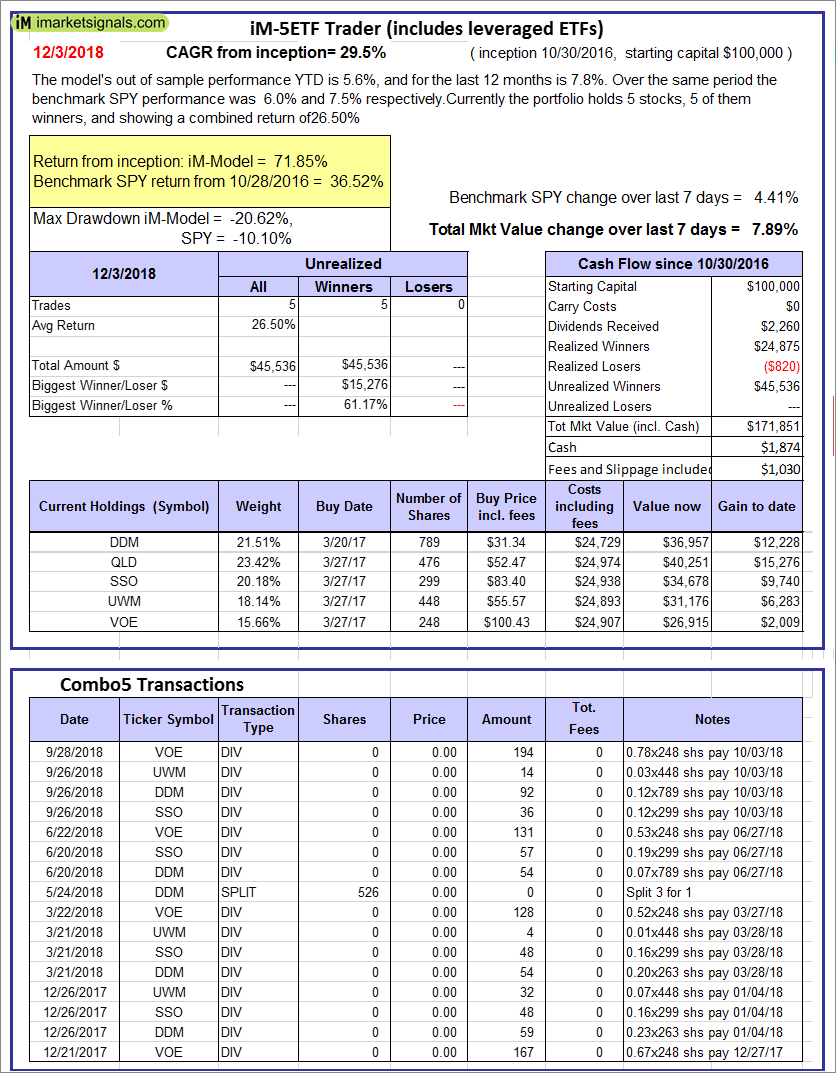 |
iM-5ETF Trader (includes leveraged ETFs): The model’s out of sample performance YTD is 5.6%, and for the last 12 months is 7.8%. Over the same period the benchmark SPY performance was 6.0% and 7.5% respectively. Over the previous week the market value of the iM-5ETF Trader (includes leveraged ETFs) gained 7.89% at a time when SPY gained 4.41%. A starting capital of $100,000 at inception on 10/30/2016 would have grown to $171,851 which includes $1,874 cash and excludes $1,030 spent on fees and slippage. |
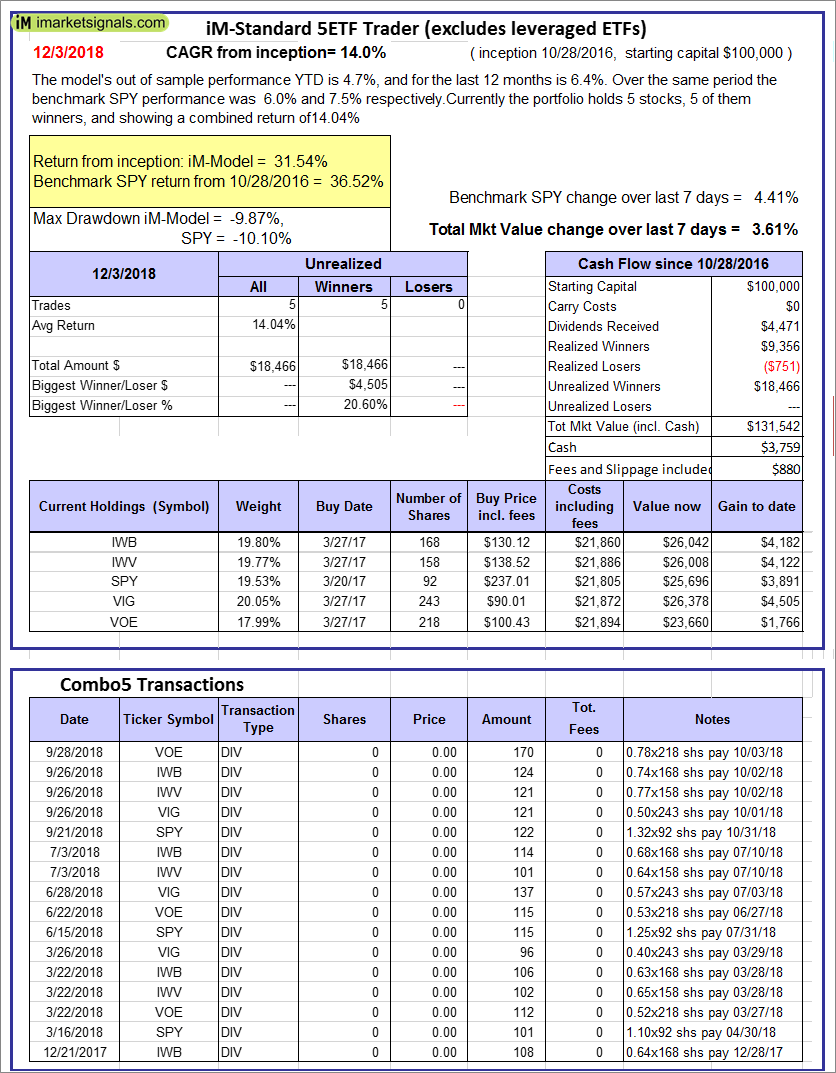 |
iM-Standard 5ETF Trader (excludes leveraged ETFs): The model’s out of sample performance YTD is 4.7%, and for the last 12 months is 6.4%. Over the same period the benchmark SPY performance was 6.0% and 7.5% respectively. Over the previous week the market value of the iM-Standard 5ETF Trader (excludes leveraged ETFs) gained 3.61% at a time when SPY gained 4.41%. A starting capital of $100,000 at inception on 10/30/2016 would have grown to $131,542 which includes $3,759 cash and excludes $880 spent on fees and slippage. |
iM-Best Reports – 12/3/2018
Posted in pmp SPY-SH
Leave a Reply
You must be logged in to post a comment.