
  |
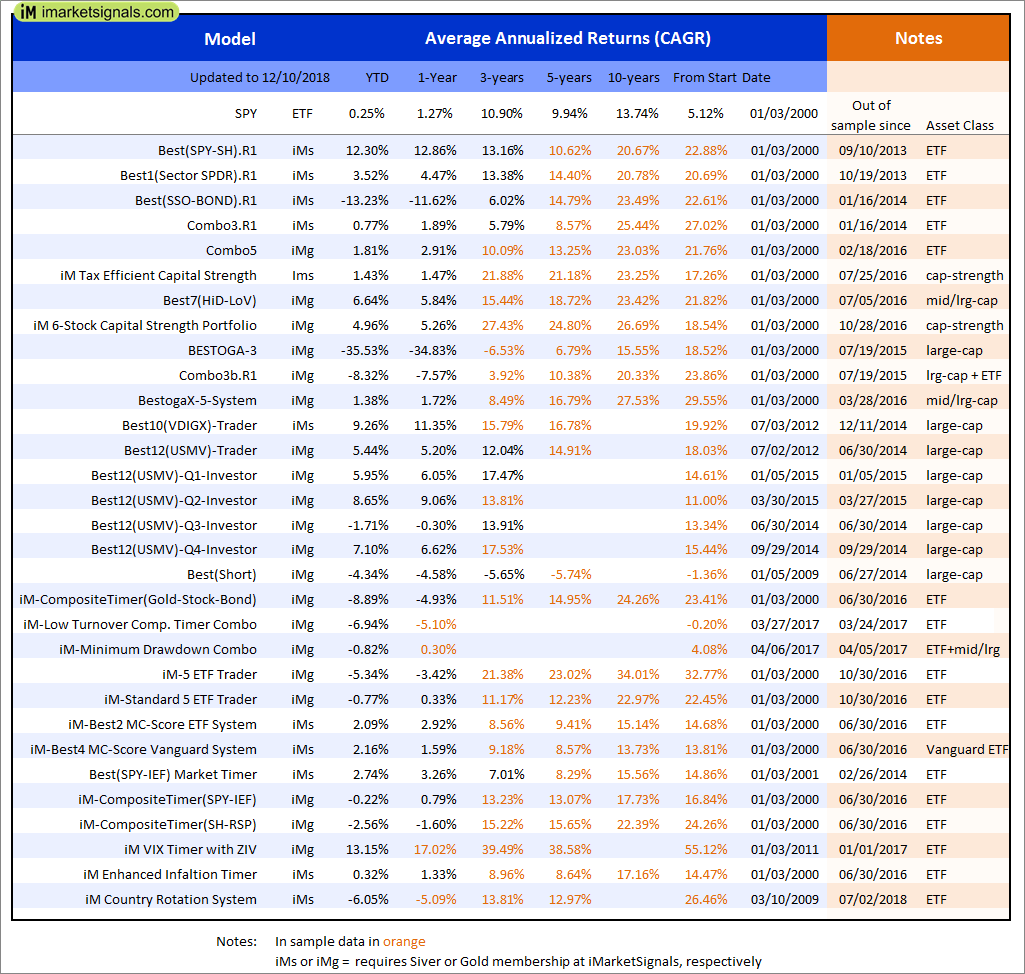
Out of sample performance summary of our models for the past 1, 2, 4 and 13 week periods. The active active return indicates how the models over- or underperformed the benchmark ETF SPY. Also the YTD, and the 1-, 3-, 5- and 10-year annualized returns are shown in the second table |
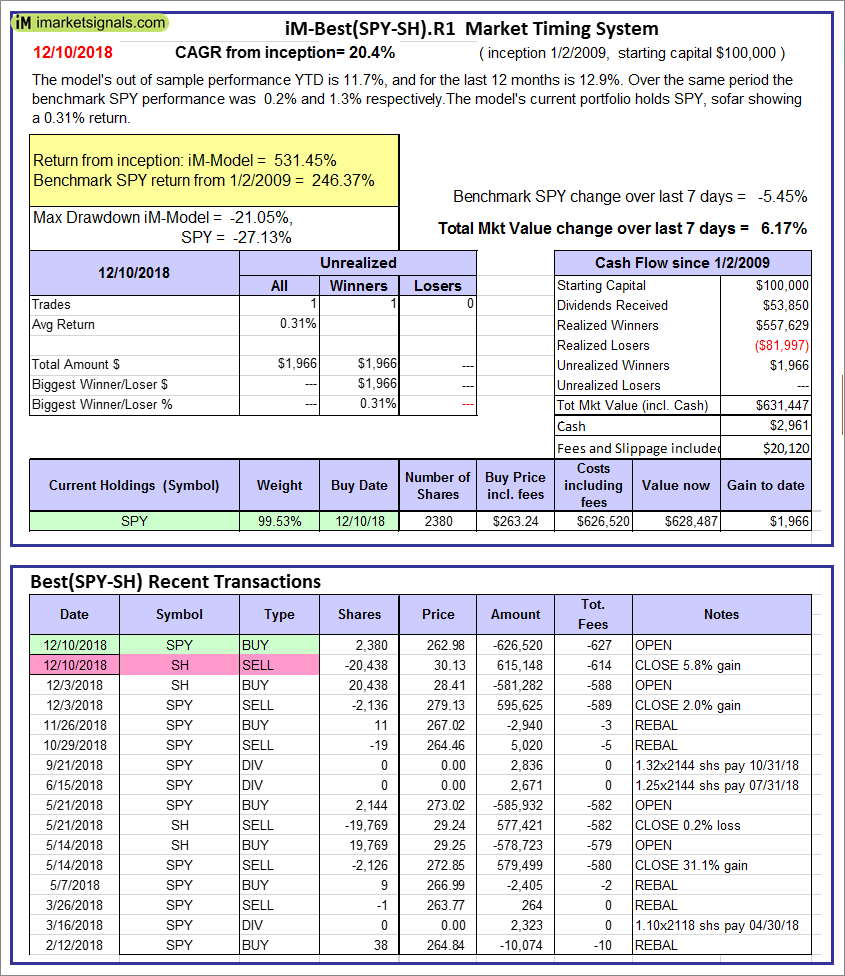 |
iM-Best(SPY-SH).R1: The model’s out of sample performance YTD is 11.7%, and for the last 12 months is 12.9%. Over the same period the benchmark SPY performance was 0.2% and 1.3% respectively. Over the previous week the market value of Best(SPY-SH) gained 6.17% at a time when SPY gained -5.45%. A starting capital of $100,000 at inception on 1/2/2009 would have grown to $631,447 which includes $2,961 cash and excludes $20,120 spent on fees and slippage. |
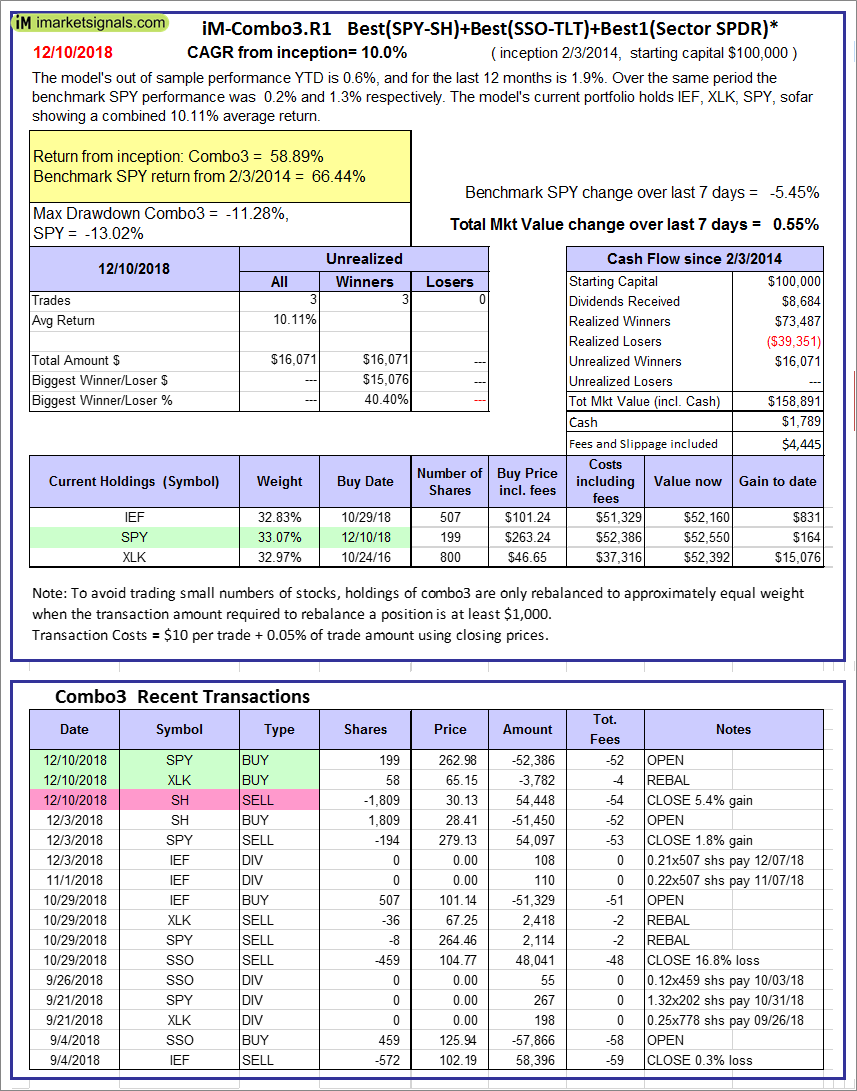 |
iM-Combo3.R1: The model’s out of sample performance YTD is 0.6%, and for the last 12 months is 1.9%. Over the same period the benchmark SPY performance was 0.2% and 1.3% respectively. Over the previous week the market value of iM-Combo3.R1 gained 0.55% at a time when SPY gained -5.45%. A starting capital of $100,000 at inception on 2/3/2014 would have grown to $158,891 which includes $1,789 cash and excludes $4,445 spent on fees and slippage. |
 |
iM-Combo5: The model’s out of sample performance YTD is 1.6%, and for the last 12 months is 2.9%. Over the same period the benchmark SPY performance was 0.2% and 1.3% respectively. Over the previous week the market value of iM-Combo5 gained -0.56% at a time when SPY gained -5.45%. A starting capital of $100,000 at inception on 2/22/2016 would have grown to $129,979 which includes $1,212 cash and excludes $1,248 spent on fees and slippage. |
  |
iM-Best10(VDIGX)-Trader: The model’s out of sample performance YTD is 9.2%, and for the last 12 months is 11.2%. Over the same period the benchmark SPY performance was 0.2% and 1.3% respectively. Since inception, on 7/1/2014, the model gained 94.65% while the benchmark SPY gained 46.68% and VDIGX gained 48.15% over the same period. Over the previous week the market value of iM-Best10(VDIGX) gained -2.82% at a time when SPY gained -5.45%. A starting capital of $100,000 at inception on 7/1/2014 would have grown to $194,651 which includes $714 cash and excludes $2,418 spent on fees and slippage. |
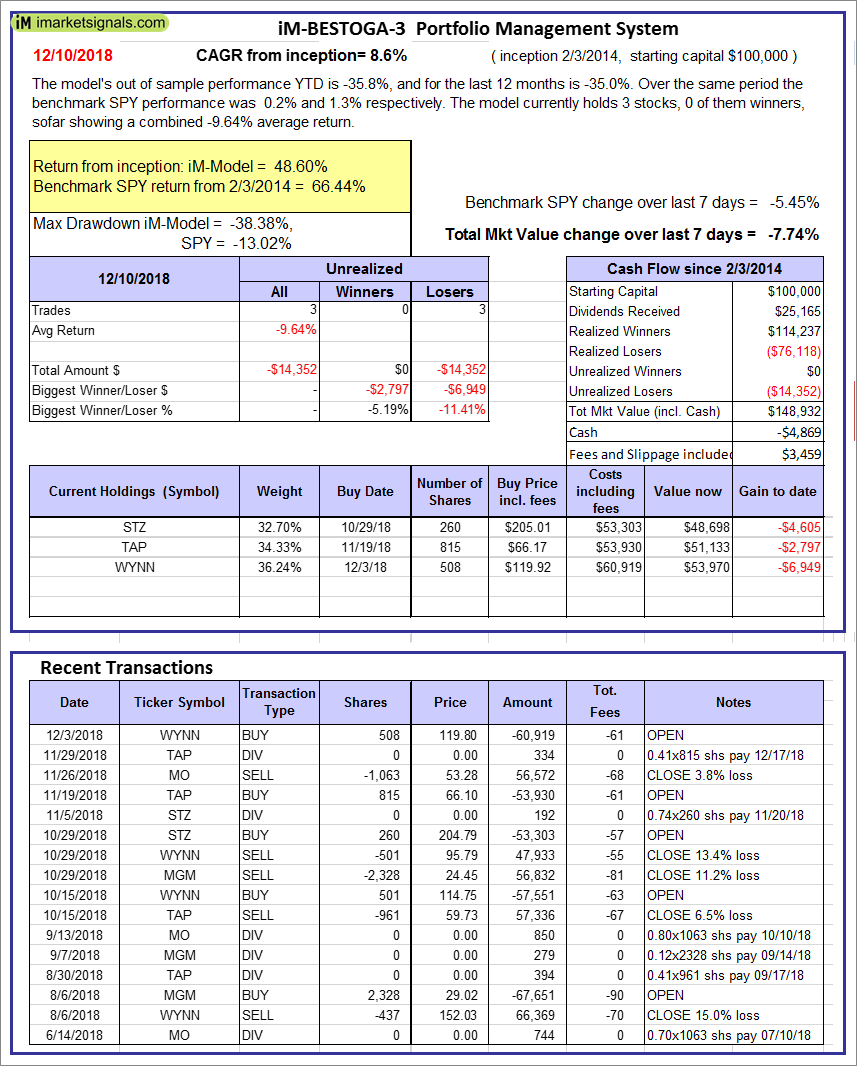 |
iM-BESTOGA-3: The model’s out of sample performance YTD is -35.8%, and for the last 12 months is -35.0%. Over the same period the benchmark SPY performance was 0.2% and 1.3% respectively. Over the previous week the market value of iM-BESTOGA-3 gained -7.74% at a time when SPY gained -5.45%. A starting capital of $100,000 at inception on 2/3/2014 would have grown to $148,932 which includes -$4,869 cash and excludes $3,459 spent on fees and slippage. |
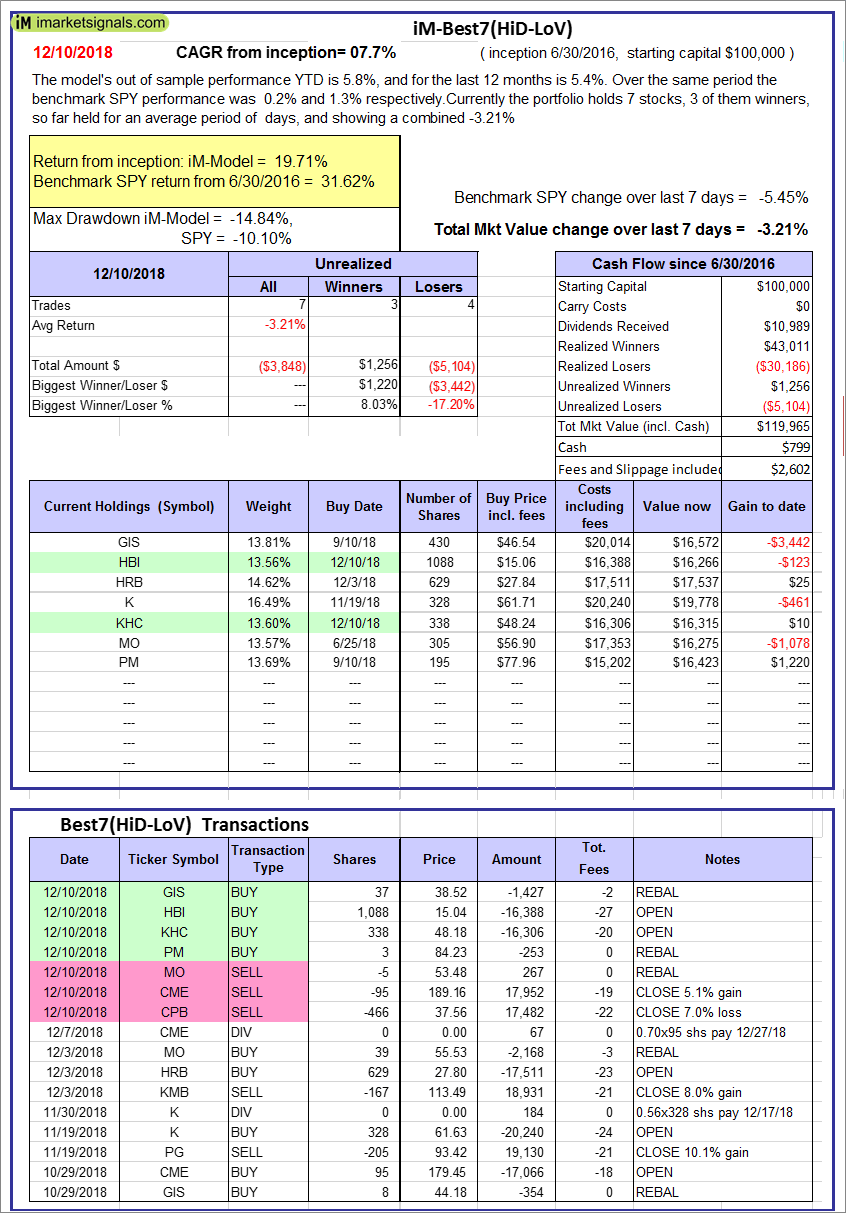 |
iM-Best7(HiD-LoV): The model’s out of sample performance YTD is 5.8%, and for the last 12 months is 5.4%. Over the same period the benchmark SPY performance was 0.2% and 1.3% respectively. Over the previous week the market value of iM-BESTOGA-3 gained -3.21% at a time when SPY gained -5.45%. A starting capital of $100,000 at inception on 6/30/2016 would have grown to $119,965 which includes $799 cash and excludes $2,602 spent on fees and slippage. |
 |
iM 6-Stock Capital Strength Portfolio: The model’s out of sample performance YTD is 4.7%, and for the last 12 months is 5.0%. Over the same period the benchmark SPY performance was 0.2% and 1.3% respectively. Over the previous week the market value of the iM 6-Stock Capital Strength Portfolio gained -3.29% at a time when SPY gained -5.45%. A starting capital of $100,000 at inception on 10/28/2016 would have grown to $158,737 which includes $1,694 cash and excludes $790 spent on fees and slippage. |
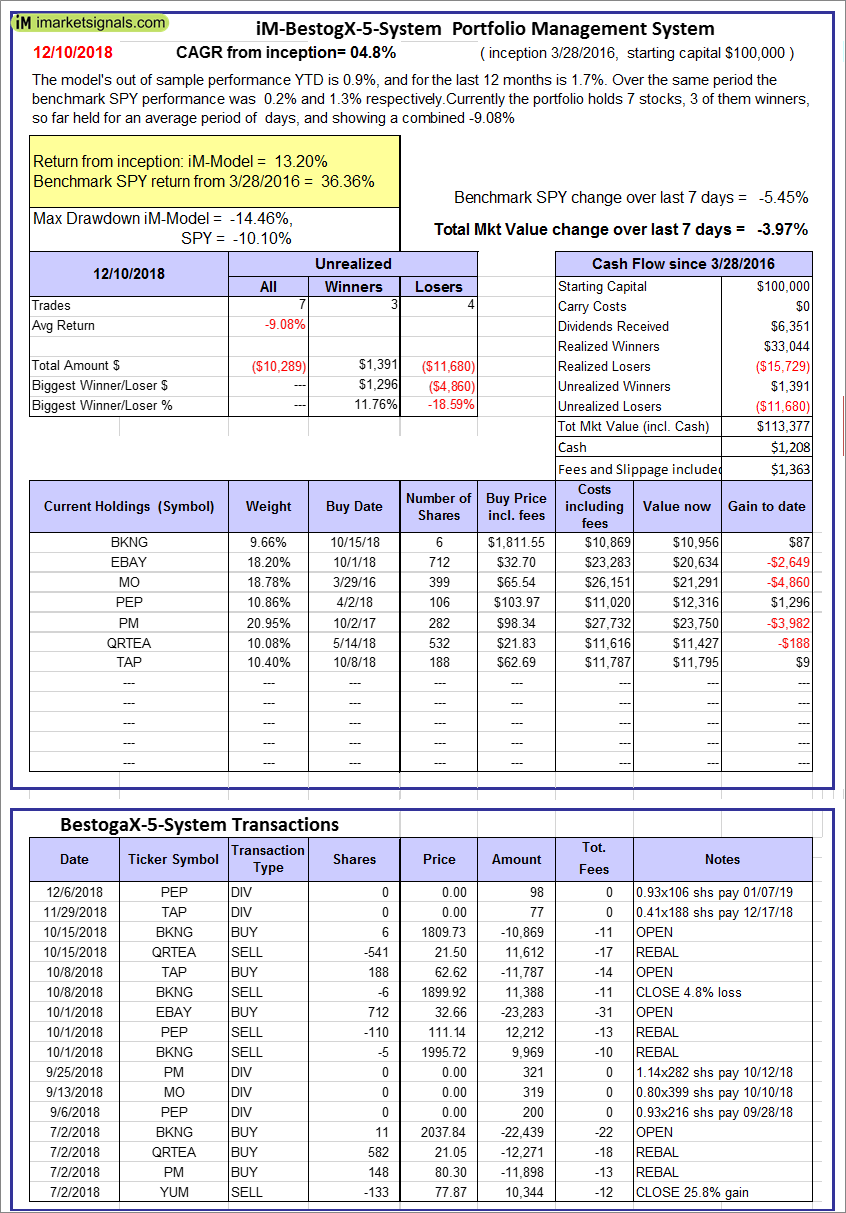 |
iM-BestogaX5-System: The model’s out of sample performance YTD is 0.9%, and for the last 12 months is 1.7%. Over the same period the benchmark SPY performance was 0.2% and 1.3% respectively. Over the previous week the market value of iM-BestogaX5-System gained -3.97% at a time when SPY gained -5.45%. A starting capital of $100,000 at inception on 3/28/2016 would have grown to $113,377 which includes $1,208 cash and excludes $1,363 spent on fees and slippage. |
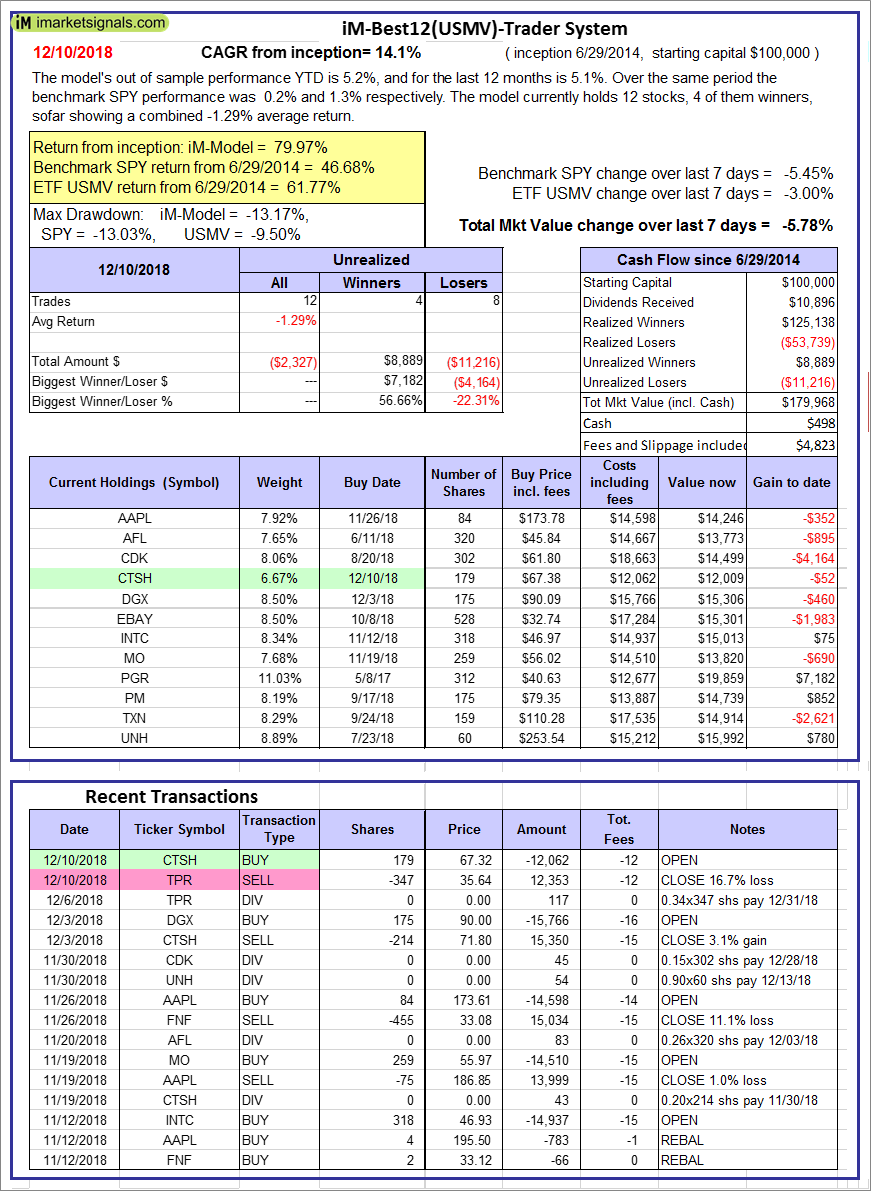 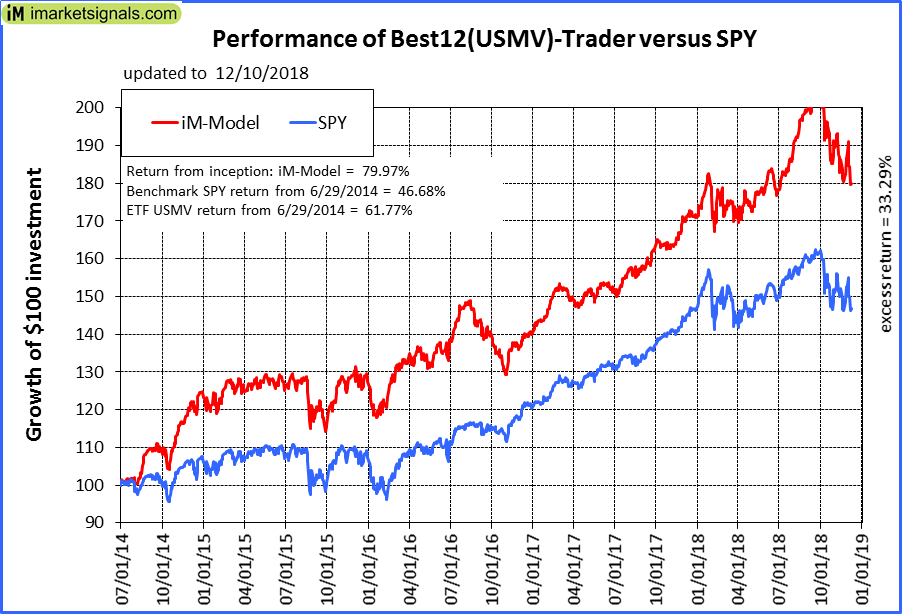 |
iM-Best12(USMV)-Trader: The model’s out of sample performance YTD is 5.2%, and for the last 12 months is 5.1%. Over the same period the benchmark SPY performance was 0.2% and 1.3% respectively. Since inception, on 6/30/2014, the model gained 79.97% while the benchmark SPY gained 46.68% and the ETF USMV gained 61.77% over the same period. Over the previous week the market value of iM-Best12(USMV)-Trader gained -5.78% at a time when SPY gained -5.45%. A starting capital of $100,000 at inception on 6/30/2014 would have grown to $179,968 which includes $498 cash and excludes $4,823 spent on fees and slippage. |
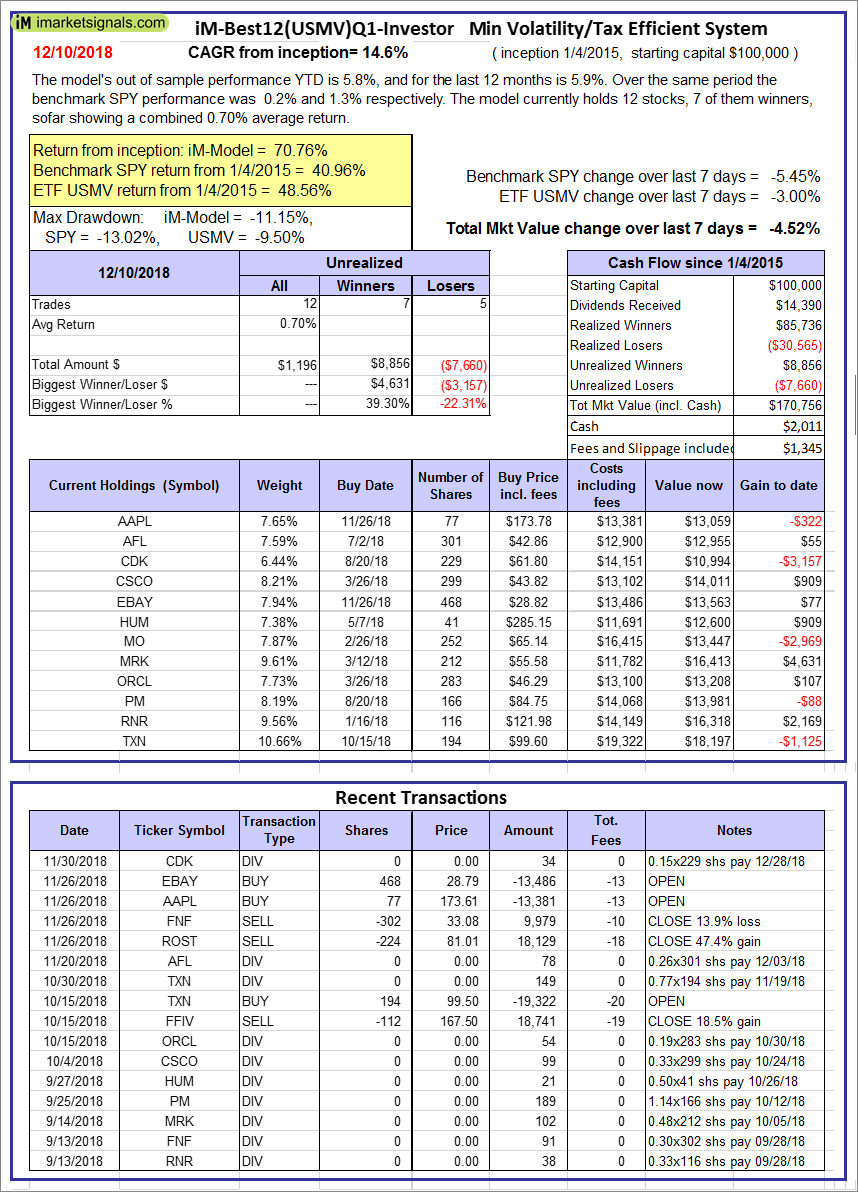  |
iM-Best12(USMV)Q1-Investor: The model’s out of sample performance YTD is 5.8%, and for the last 12 months is 5.9%. Over the same period the benchmark SPY performance was 0.2% and 1.3% respectively. Since inception, on 1/5/2015, the model gained 70.76% while the benchmark SPY gained 40.96% and the ETF USMV gained 48.56% over the same period. Over the previous week the market value of iM-Best12(USMV)Q1 gained -4.52% at a time when SPY gained -5.45%. A starting capital of $100,000 at inception on 1/5/2015 would have grown to $170,756 which includes $2,011 cash and excludes $1,345 spent on fees and slippage. |
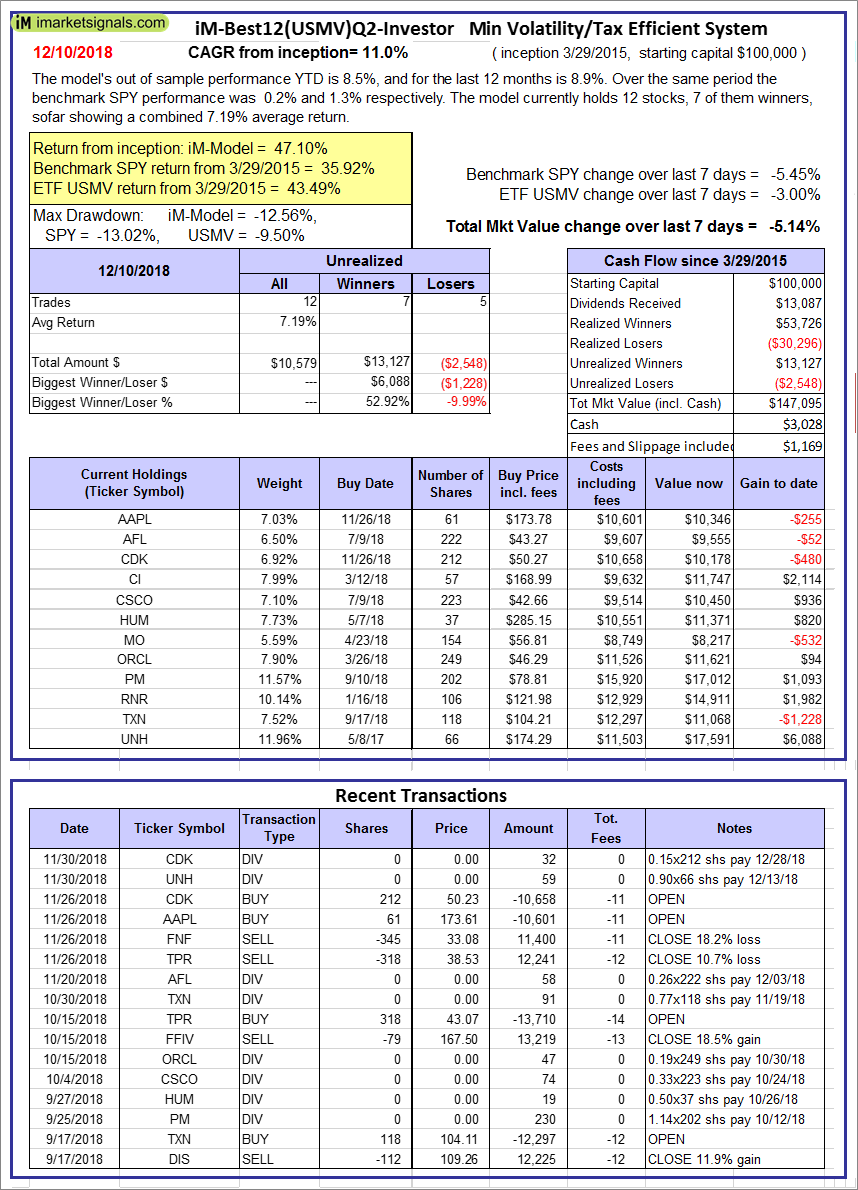 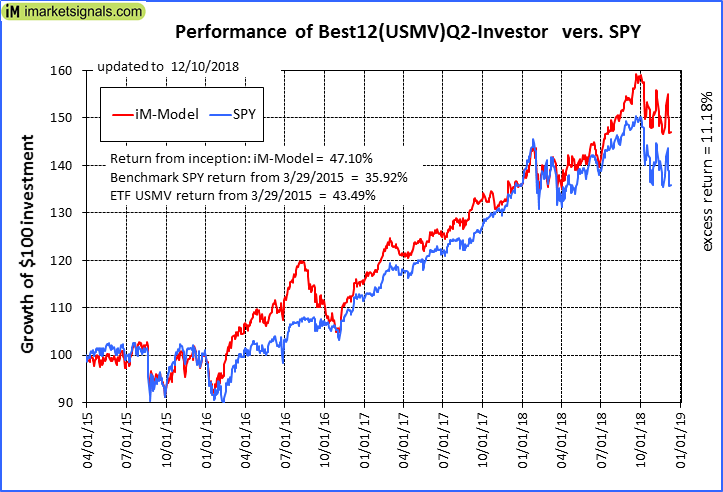 |
iM-Best12(USMV)Q2-Investor: The model’s out of sample performance YTD is 8.5%, and for the last 12 months is 8.9%. Over the same period the benchmark SPY performance was 0.2% and 1.3% respectively. Since inception, on 3/30/2015, the model gained 47.10% while the benchmark SPY gained 35.92% and the ETF USMV gained 43.49% over the same period. Over the previous week the market value of iM-Best12(USMV)Q2 gained -5.14% at a time when SPY gained -5.45%. A starting capital of $100,000 at inception on 3/30/2015 would have grown to $147,095 which includes $3,028 cash and excludes $1,169 spent on fees and slippage. |
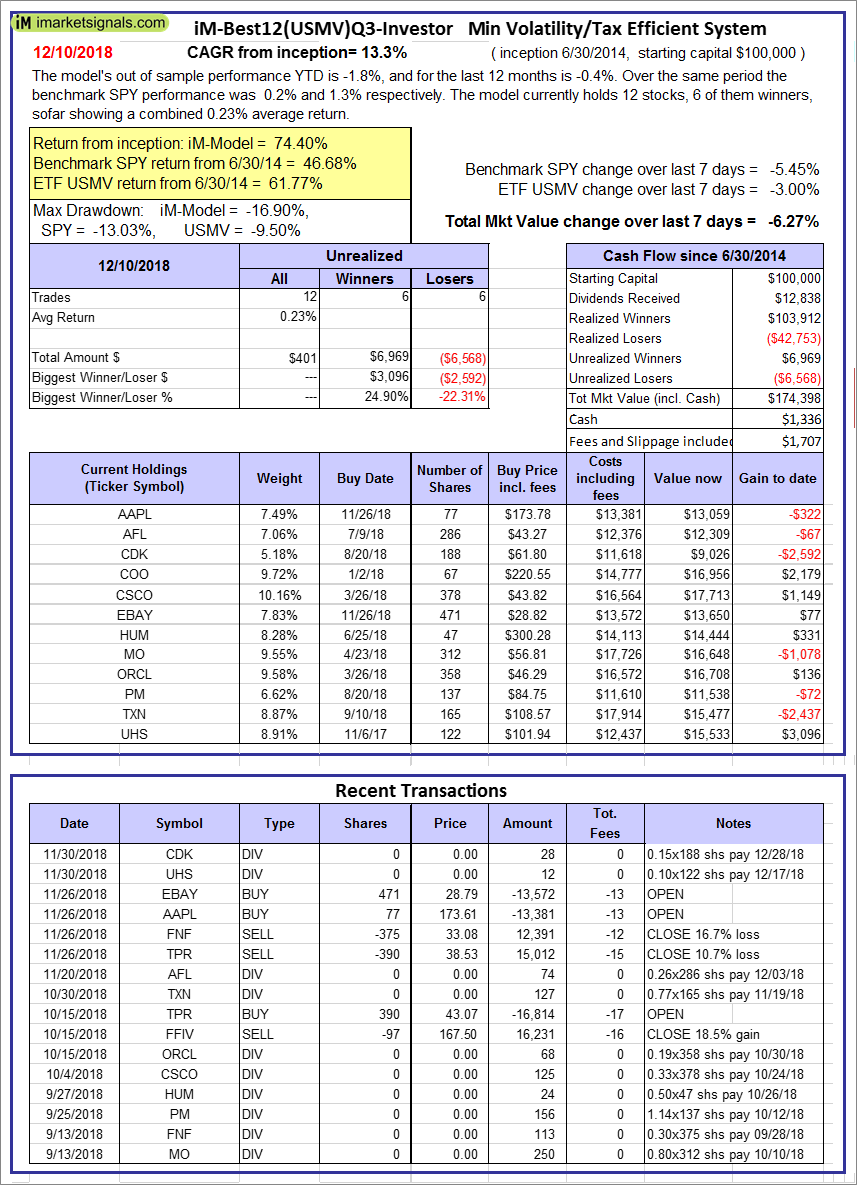 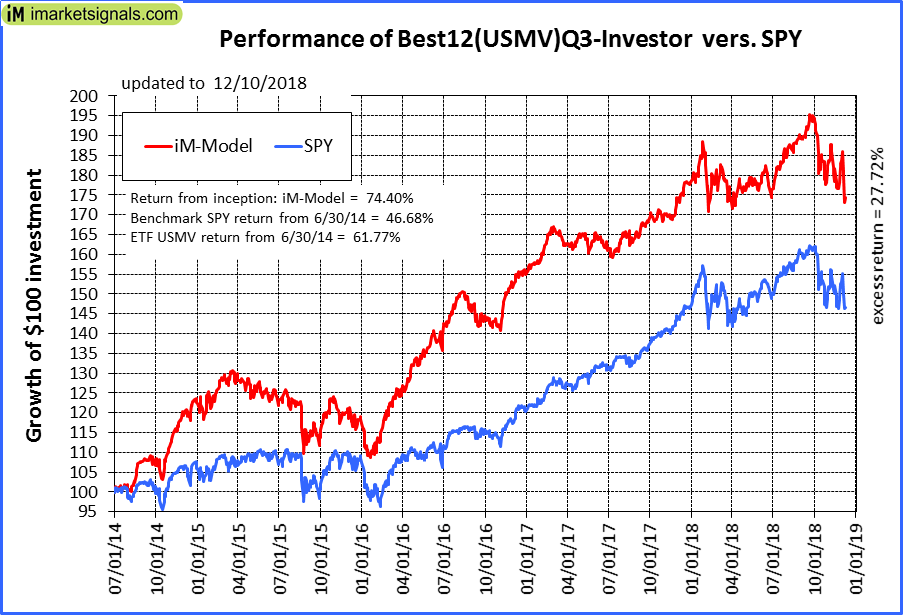 |
iM-Best12(USMV)Q3-Investor: The model’s out of sample performance YTD is -1.8%, and for the last 12 months is -0.4%. Over the same period the benchmark SPY performance was 0.2% and 1.3% respectively. Since inception, on 7/1/2014, the model gained 74.40% while the benchmark SPY gained 46.68% and the ETF USMV gained 61.77% over the same period. Over the previous week the market value of iM-Best12(USMV)Q3 gained -6.27% at a time when SPY gained -5.45%. A starting capital of $100,000 at inception on 7/1/2014 would have grown to $174,398 which includes $1,336 cash and excludes $1,707 spent on fees and slippage. |
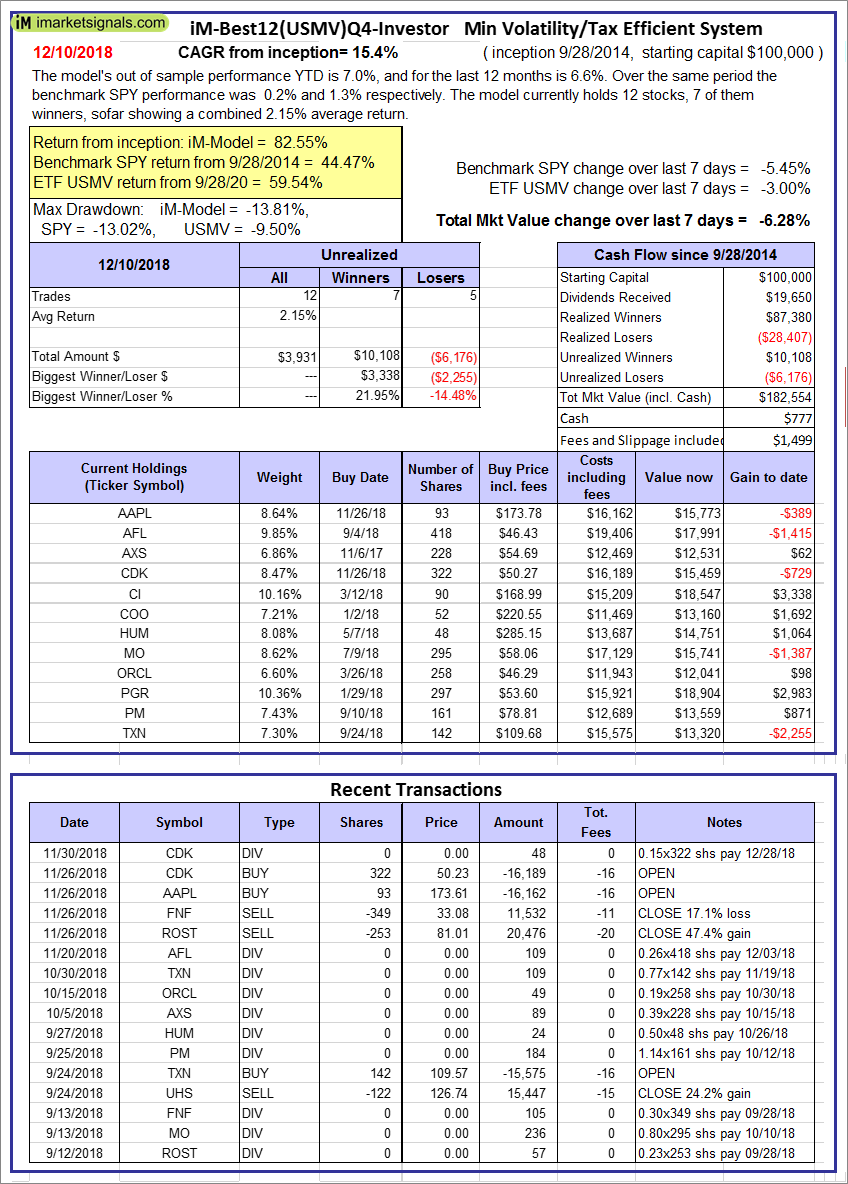 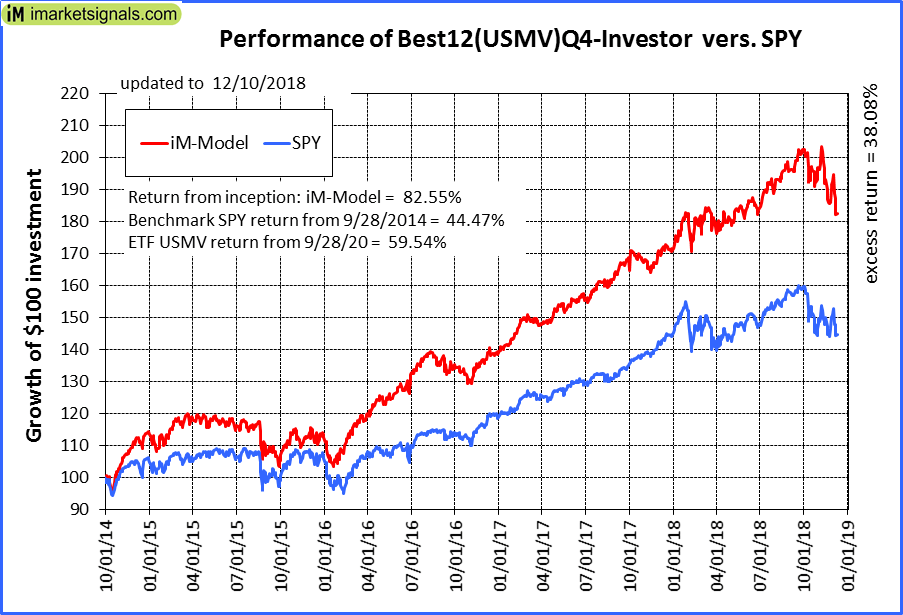 |
iM-Best12(USMV)Q4-Investor: Since inception, on 9/29/2014, the model gained 82.55% while the benchmark SPY gained 44.47% and the ETF USMV gained 59.54% over the same period. Over the previous week the market value of iM-Best12(USMV)Q4 gained -6.28% at a time when SPY gained -5.45%. A starting capital of $100,000 at inception on 9/29/2014 would have grown to $182,554 which includes $777 cash and excludes $1,499 spent on fees and slippage. |
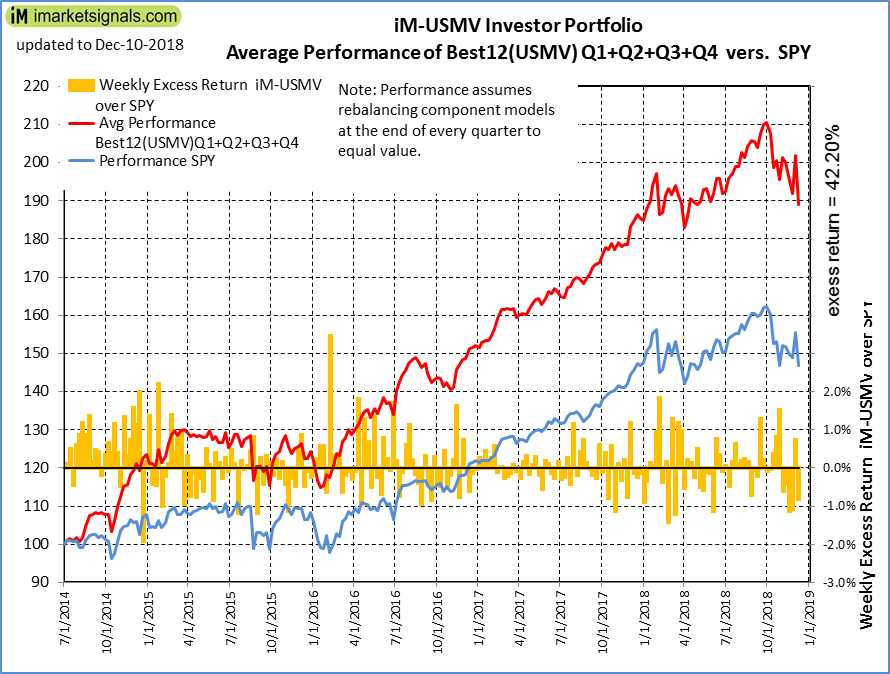 |
Average Performance of iM-Best12(USMV)Q1+Q2+Q3+Q4-Investor resulted in an excess return of 42.20% over SPY. (see iM-USMV Investor Portfolio) |
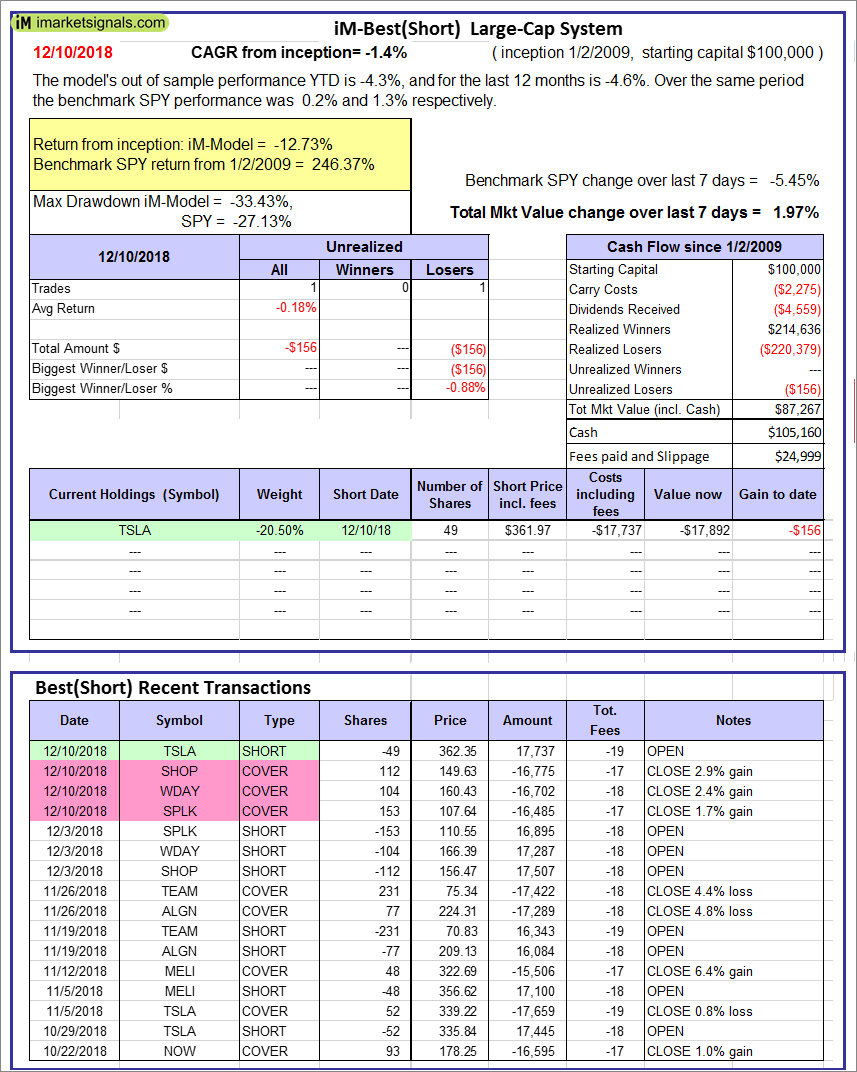 |
iM-Best(Short): The model’s out of sample performance YTD is -4.3%, and for the last 12 months is -4.6%. Over the same period the benchmark SPY performance was 0.2% and 1.3% respectively. Over the previous week the market value of iM-Best(Short) gained 1.97% at a time when SPY gained -5.45%. Over the period 1/2/2009 to 12/10/2018 the starting capital of $100,000 would have grown to $87,267 which includes $105,160 cash and excludes $24,999 spent on fees and slippage. |
 |
iM-Best2 MC-Score ETF System: The model’s out of sample performance YTD is 2.1%, and for the last 12 months is 2.9%. Over the same period the benchmark SPY performance was 0.2% and 1.3% respectively. Over the previous week the market value of the iM-Best2 MC-Score ETF System gained -2.91% at a time when SPY gained -5.45%. A starting capital of $100,000 at inception on 6/30/2016 would have grown to $114,718 which includes $45 cash and excludes $124 spent on fees and slippage. |
 |
iM-Best4 MC-Score Vanguard System: The model’s out of sample performance YTD is 2.2%, and for the last 12 months is 1.6%. Over the same period the benchmark SPY performance was 0.2% and 1.3% respectively. Over the previous week the market value of the iM-Best4 MC-Score Vanguard System gained -0.72% at a time when SPY gained -5.45%. A starting capital of $100,000 at inception on 6/30/2016 would have grown to $113,238 which includes $381 cash and excludes $00 spent on fees and slippage. |
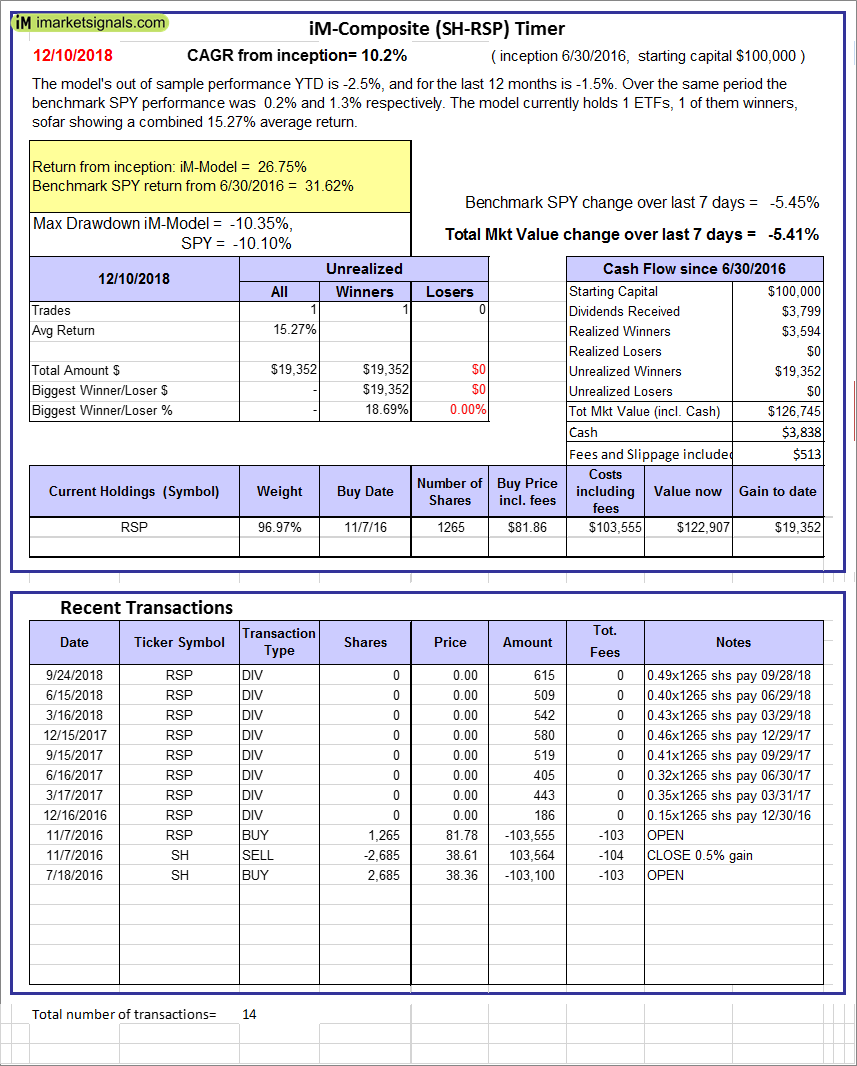 |
iM-Composite (SH-RSP) Timer: The model’s out of sample performance YTD is -2.5%, and for the last 12 months is -1.5%. Over the same period the benchmark SPY performance was 0.2% and 1.3% respectively. Over the previous week the market value of the iM-Composite (SH-RSP) Timer gained -5.41% at a time when SPY gained -5.45%. A starting capital of $100,000 at inception on 6/30/2016 would have grown to $126,745 which includes $3,838 cash and excludes $513 spent on fees and slippage. |
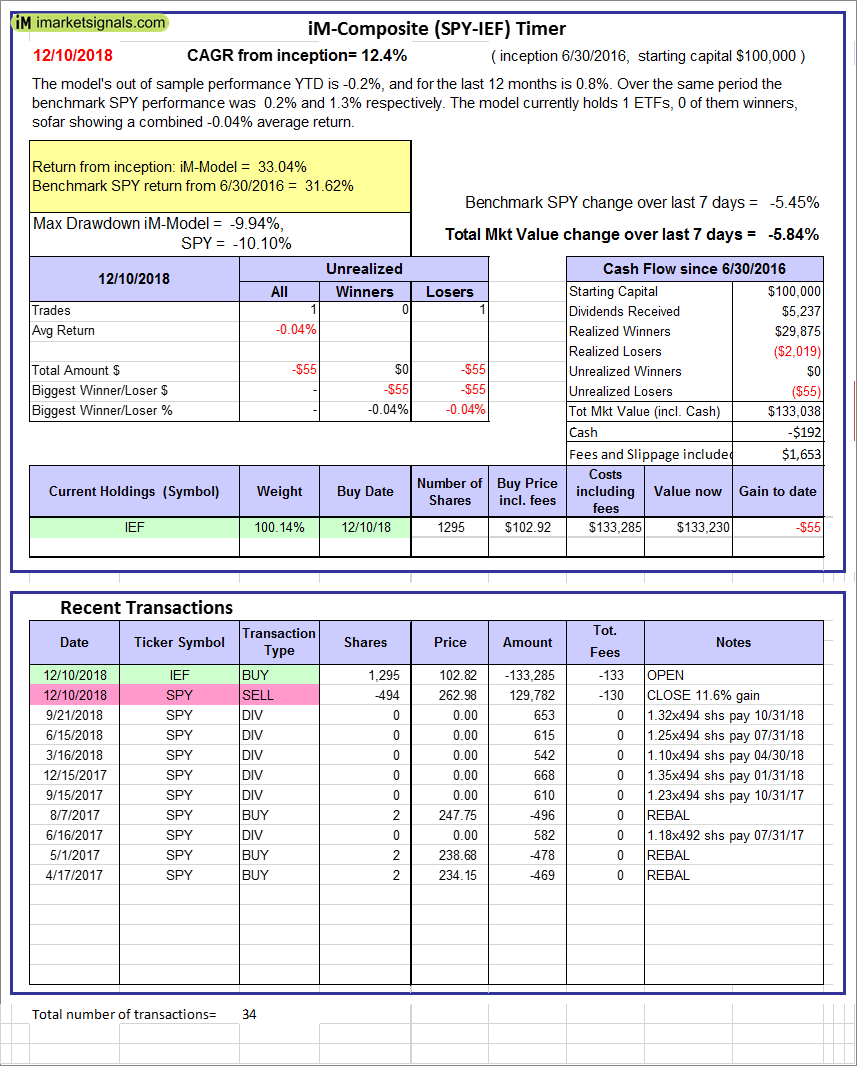 |
iM-Composite (SPY-IEF) Timer: The model’s out of sample performance YTD is -0.2%, and for the last 12 months is 0.8%. Over the same period the benchmark SPY performance was 0.2% and 1.3% respectively. Over the previous week the market value of the iM-Composite (SPY-IEF) Timer gained -5.84% at a time when SPY gained -5.45%. A starting capital of $100,000 at inception on 6/30/2016 would have grown to $133,038 which includes -$192 cash and excludes $1,653 spent on fees and slippage. |
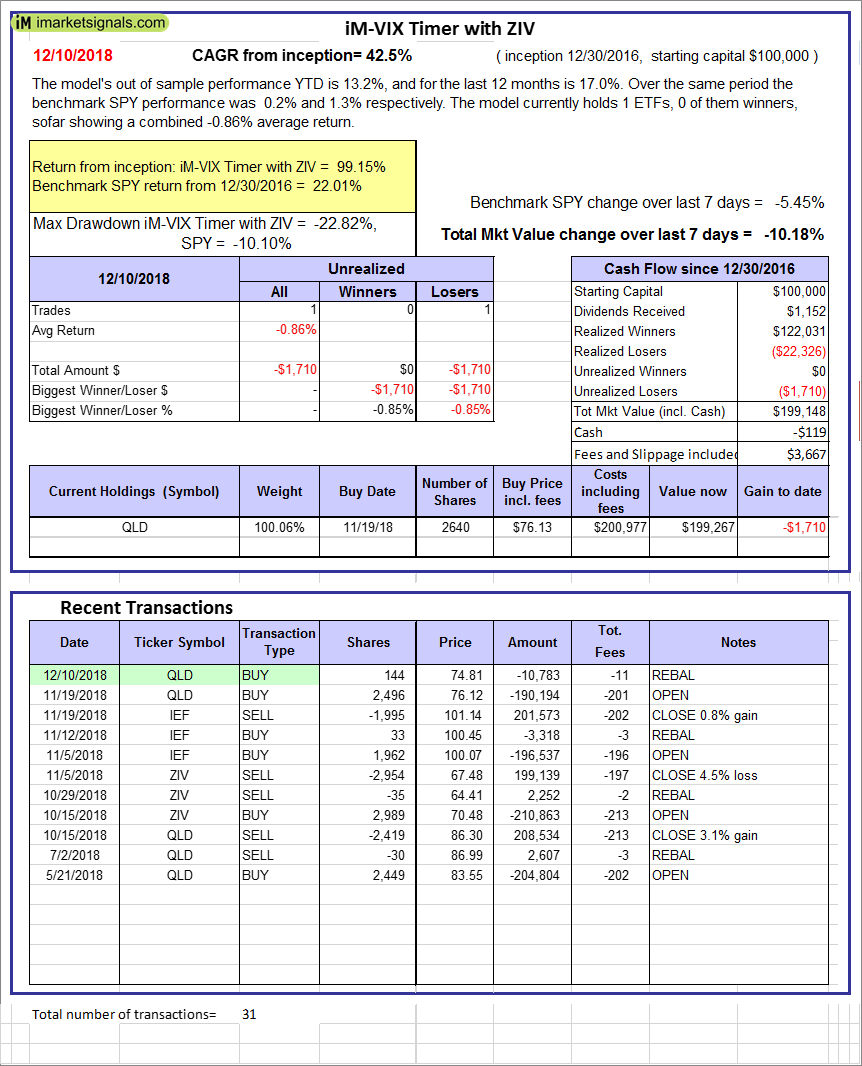 |
iM-VIX Timer with ZIV: The model’s out of sample performance YTD is 13.2%, and for the last 12 months is 17.0%. Over the same period the benchmark SPY performance was 0.2% and 1.3% respectively. Over the previous week the market value of the iM-VIX Timer with ZIV gained -10.18% at a time when SPY gained -5.45%. A starting capital of $100,000 at inception on 6/30/2016 would have grown to $199,148 which includes -$119 cash and excludes $3,667 spent on fees and slippage. |
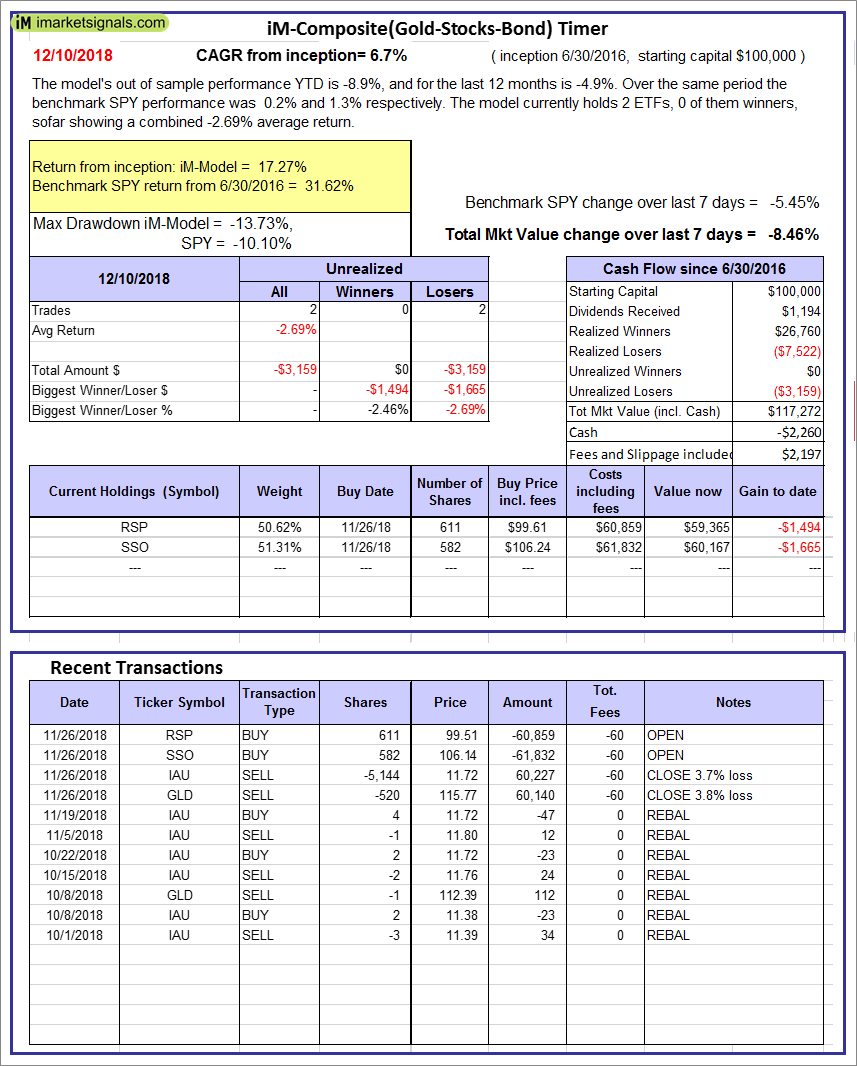 |
iM-Composite(Gold-Stocks-Bond) Timer: The model’s out of sample performance YTD is -8.9%, and for the last 12 months is -4.9%. Over the same period the benchmark SPY performance was 0.2% and 1.3% respectively. Over the previous week the market value of the iM-Composite(Gold-Stocks-Bond) Timer gained -8.46% at a time when SPY gained -5.45%. A starting capital of $100,000 at inception on 6/30/2016 would have grown to $117,272 which includes -$2,260 cash and excludes $2,197 spent on fees and slippage. |
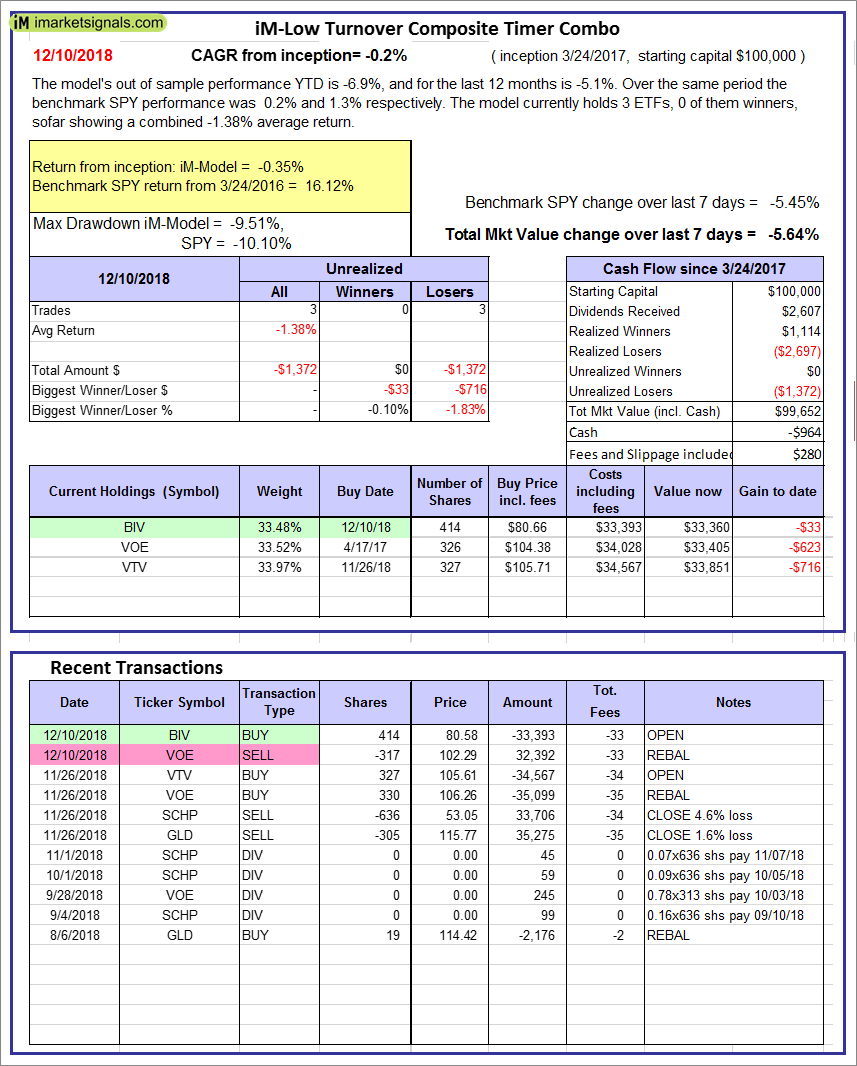 |
iM-Low Turnover Composite Timer Combo: The model’s out of sample performance YTD is -6.9%, and for the last 12 months is -5.1%. Over the same period the benchmark SPY performance was 0.2% and 1.3% respectively. Over the previous week the market value of the iM-Low Turnover Composite Timer Combo gained -5.64% at a time when SPY gained -5.45%. A starting capital of $100,000 at inception on 3/24/27 would have grown to $99,652 which includes -$964 cash and excludes $280 spent on fees and slippage. |
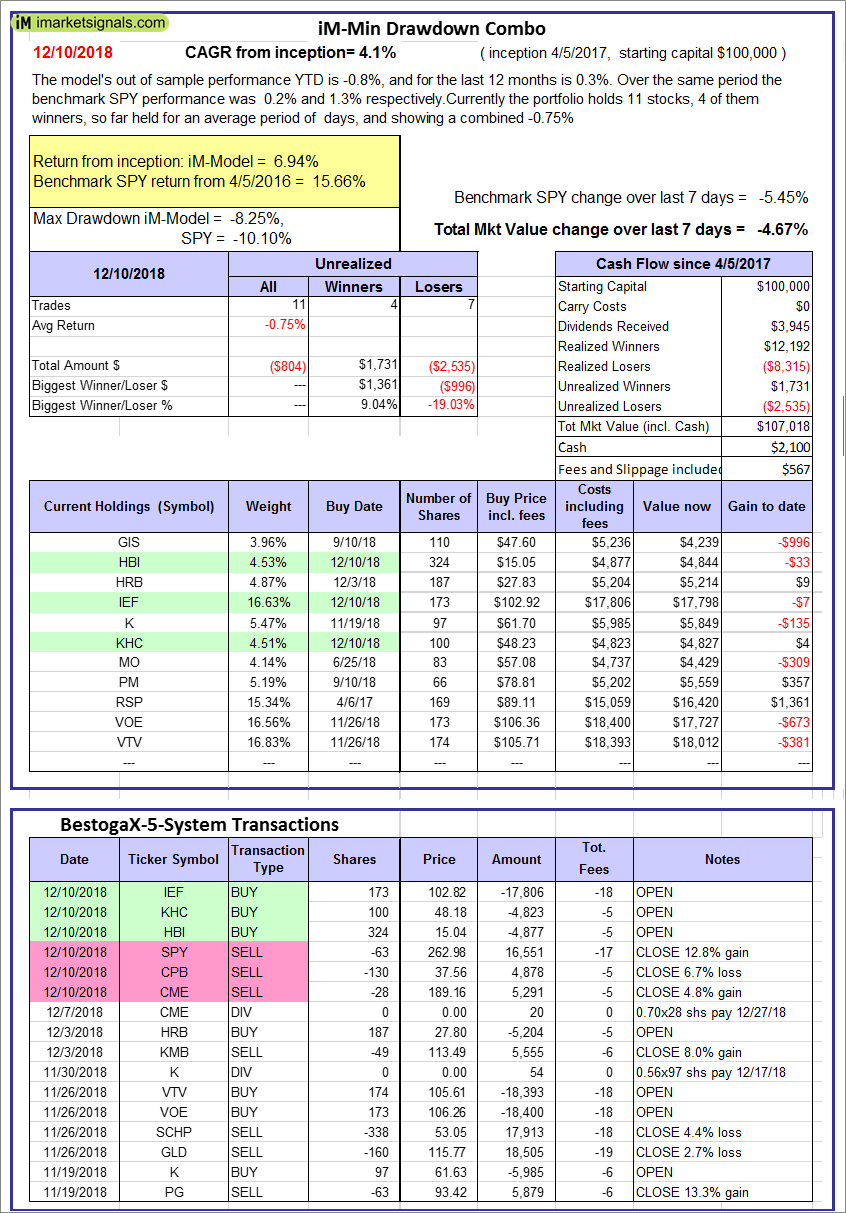 |
iM-Min Drawdown Combo: The model’s out of sample performance YTD is -0.8%, and for the last 12 months is 0.3%. Over the same period the benchmark SPY performance was 0.2% and 1.3% respectively. Over the previous week the market value of the iM-Min Drawdown Combo gained -4.67% at a time when SPY gained -5.45%. A starting capital of $100,000 at inception on 4/5/2017 would have grown to $107,018 which includes $2,100 cash and excludes $567 spent on fees and slippage. |
 |
iM-5ETF Trader (includes leveraged ETFs): The model’s out of sample performance YTD is -5.3%, and for the last 12 months is -3.4%. Over the same period the benchmark SPY performance was 0.2% and 1.3% respectively. Over the previous week the market value of the iM-5ETF Trader (includes leveraged ETFs) gained -10.34% at a time when SPY gained -5.45%. A starting capital of $100,000 at inception on 10/30/2016 would have grown to $154,088 which includes -$24 cash and excludes $1,097 spent on fees and slippage. |
 |
iM-Standard 5ETF Trader (excludes leveraged ETFs): The model’s out of sample performance YTD is -0.8%, and for the last 12 months is 0.3%. Over the same period the benchmark SPY performance was 0.2% and 1.3% respectively. Over the previous week the market value of the iM-Standard 5ETF Trader (excludes leveraged ETFs) gained -5.24% at a time when SPY gained -5.45%. A starting capital of $100,000 at inception on 10/30/2016 would have grown to $124,654 which includes $31 cash and excludes $1,028 spent on fees and slippage. |
iM-Best Reports – 12/10/2018
Posted in pmp SPY-SH
Leave a Reply
You must be logged in to post a comment.