
  |
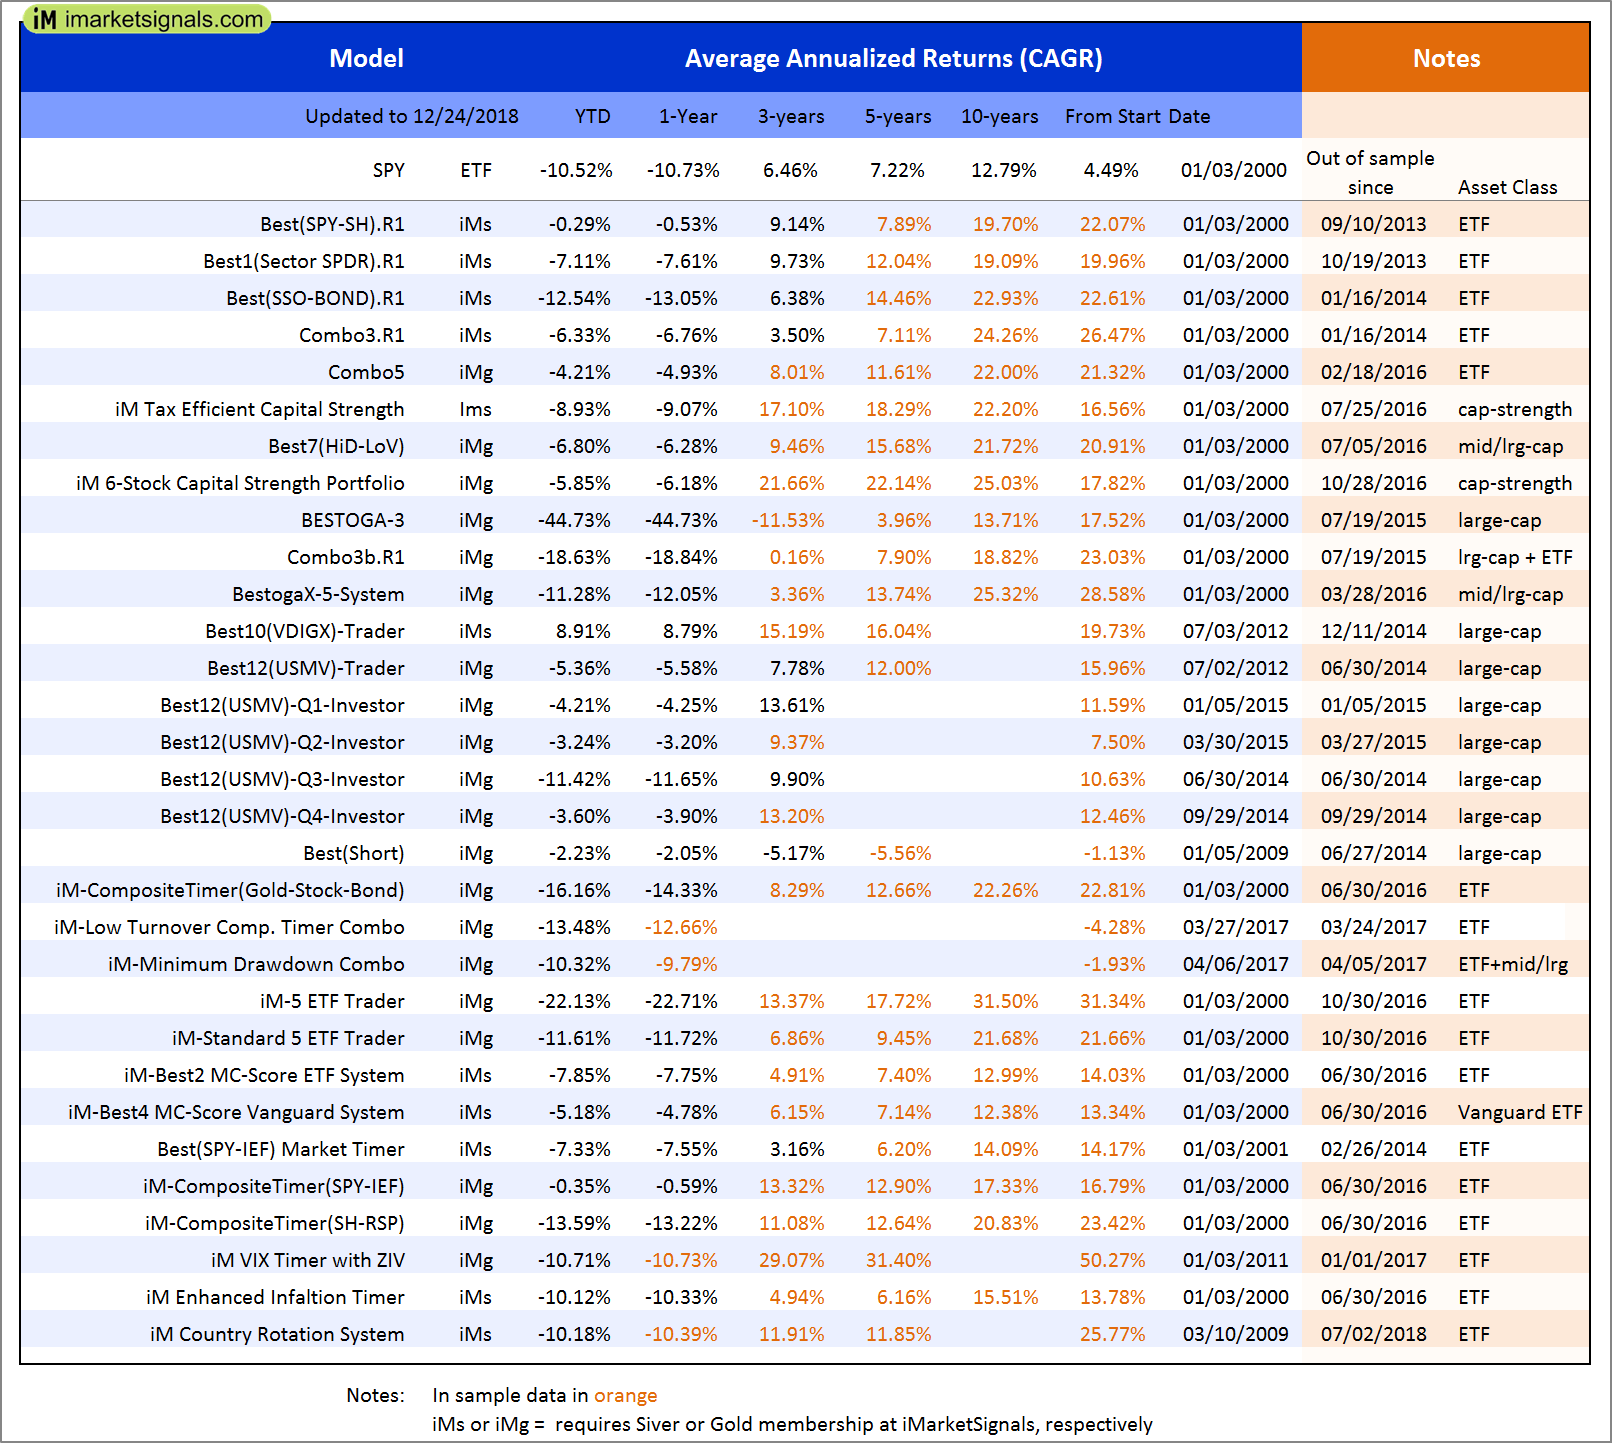
Out of sample performance summary of our models for the past 1, 2, 4 and 13 week periods. The active active return indicates how the models over- or underperformed the benchmark ETF SPY. Also the YTD, and the 1-, 3-, 5- and 10-year annualized returns are shown in the second table |
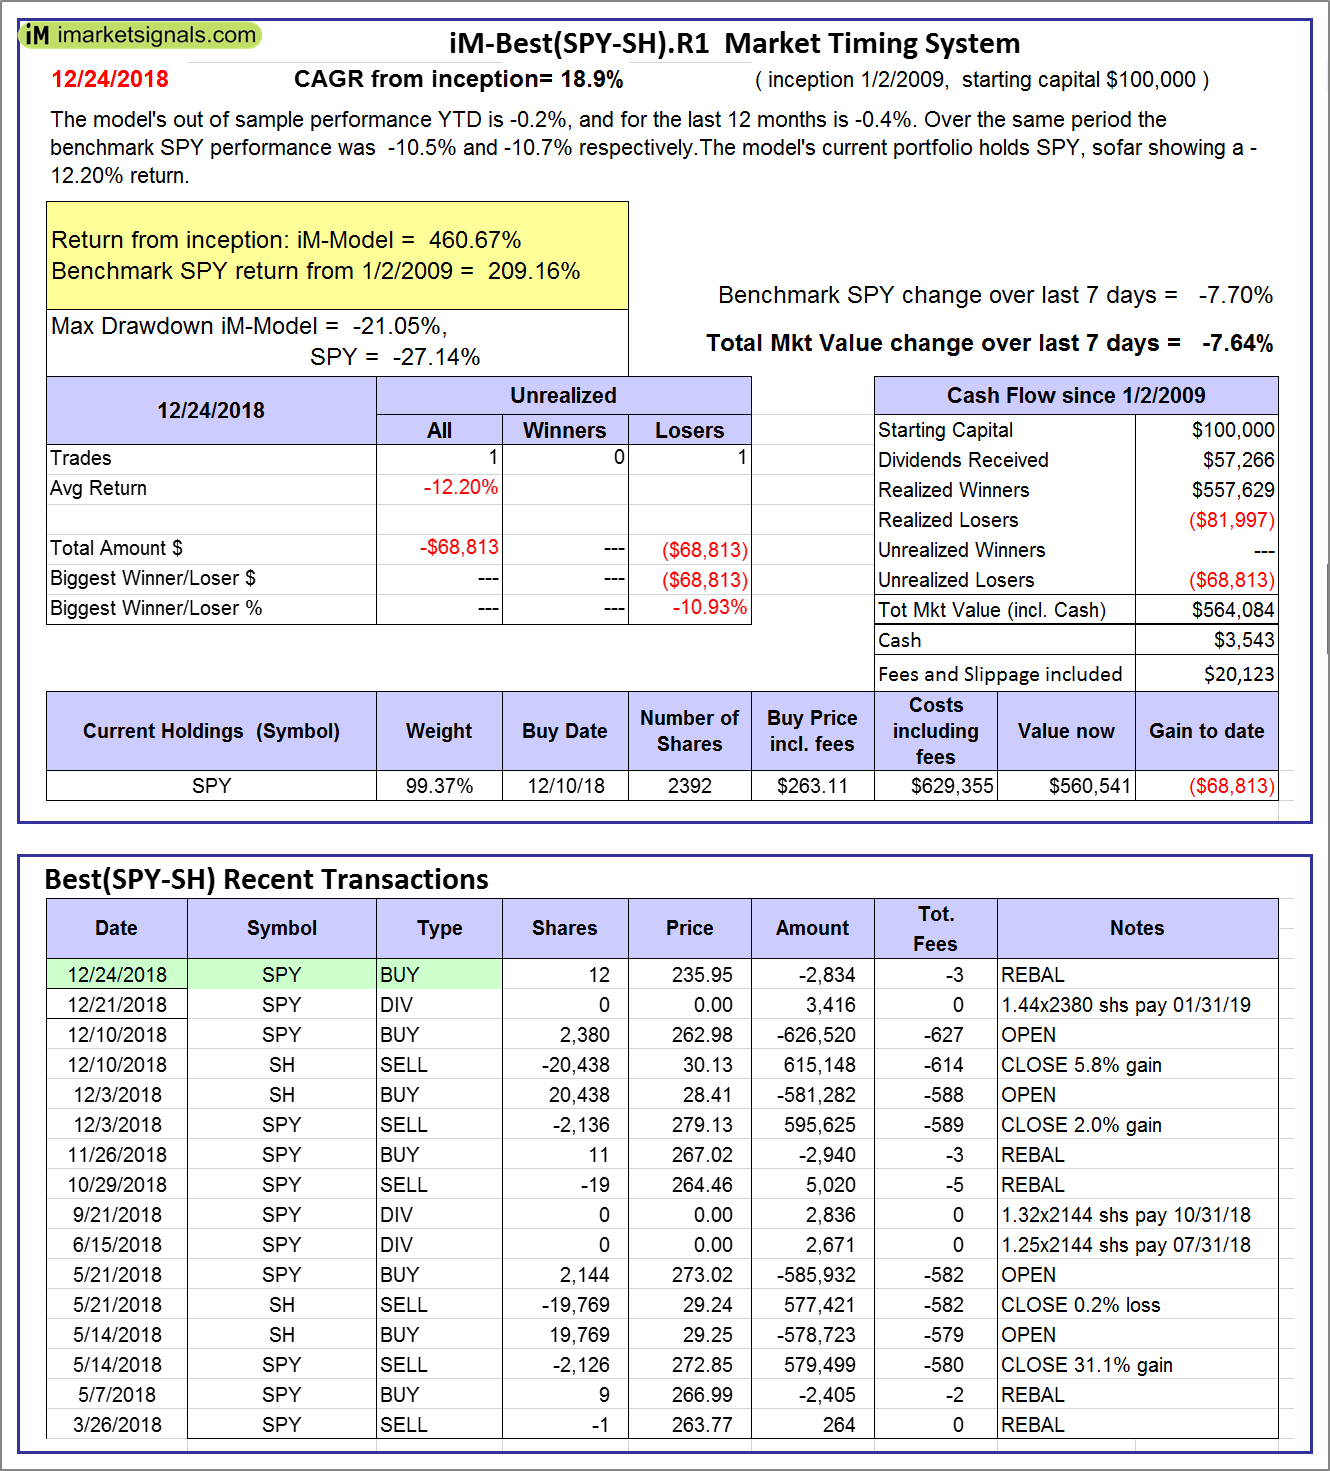 |
iM-Best(SPY-SH).R1: The model’s out of sample performance YTD is -0.2%, and for the last 12 months is -0.4%. Over the same period the benchmark SPY performance was -10.5% and -10.7% respectively. Over the previous week the market value of Best(SPY-SH) gained -7.64% at a time when SPY gained -7.70%. A starting capital of $100,000 at inception on 1/2/2009 would have grown to $564,084 which includes $3,543 cash and excludes $20,123 spent on fees and slippage. |
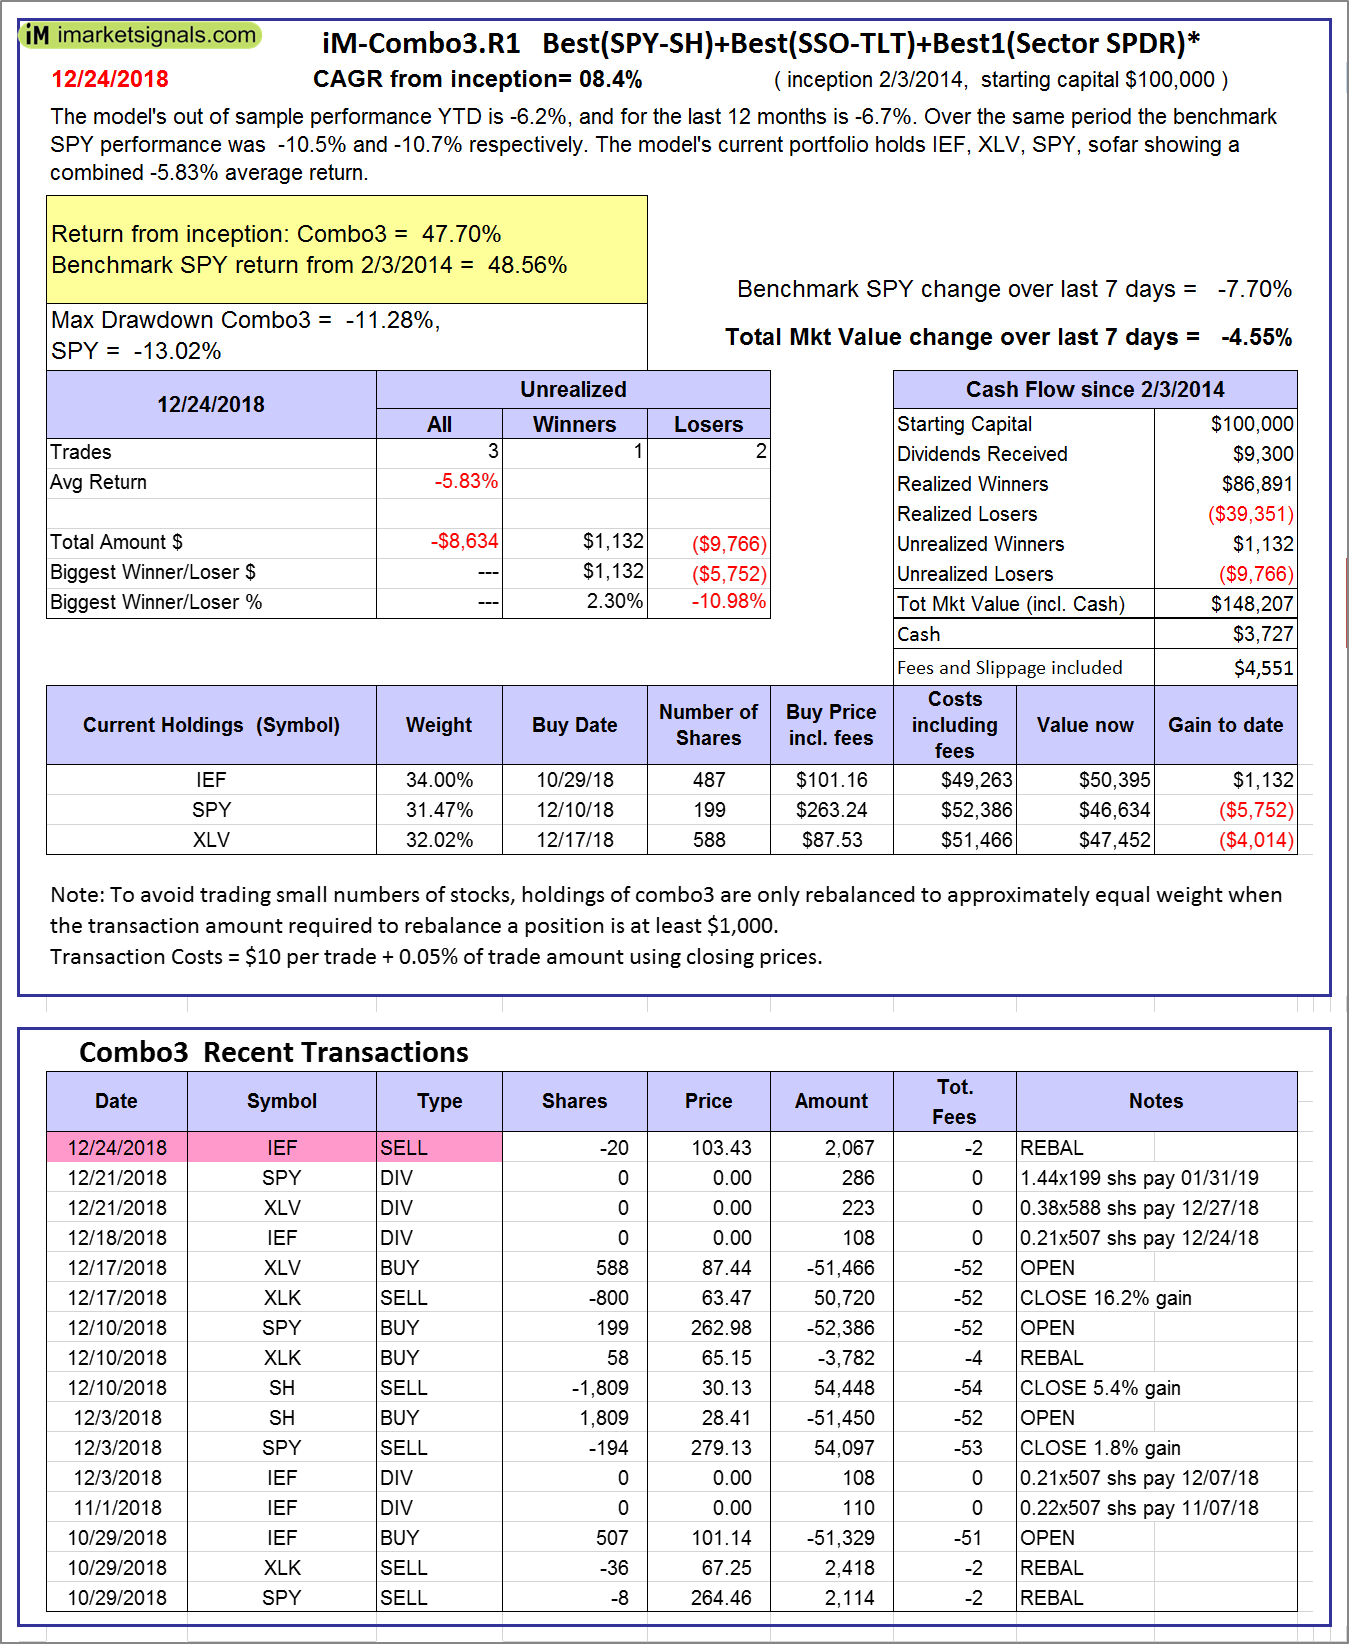 |
iM-Combo3.R1: The model’s out of sample performance YTD is -6.2%, and for the last 12 months is -6.7%. Over the same period the benchmark SPY performance was -10.5% and -10.7% respectively. Over the previous week the market value of iM-Combo3.R1 gained -4.55% at a time when SPY gained -7.70%. A starting capital of $100,000 at inception on 2/3/2014 would have grown to $148,207 which includes $3,727 cash and excludes $4,551 spent on fees and slippage. |
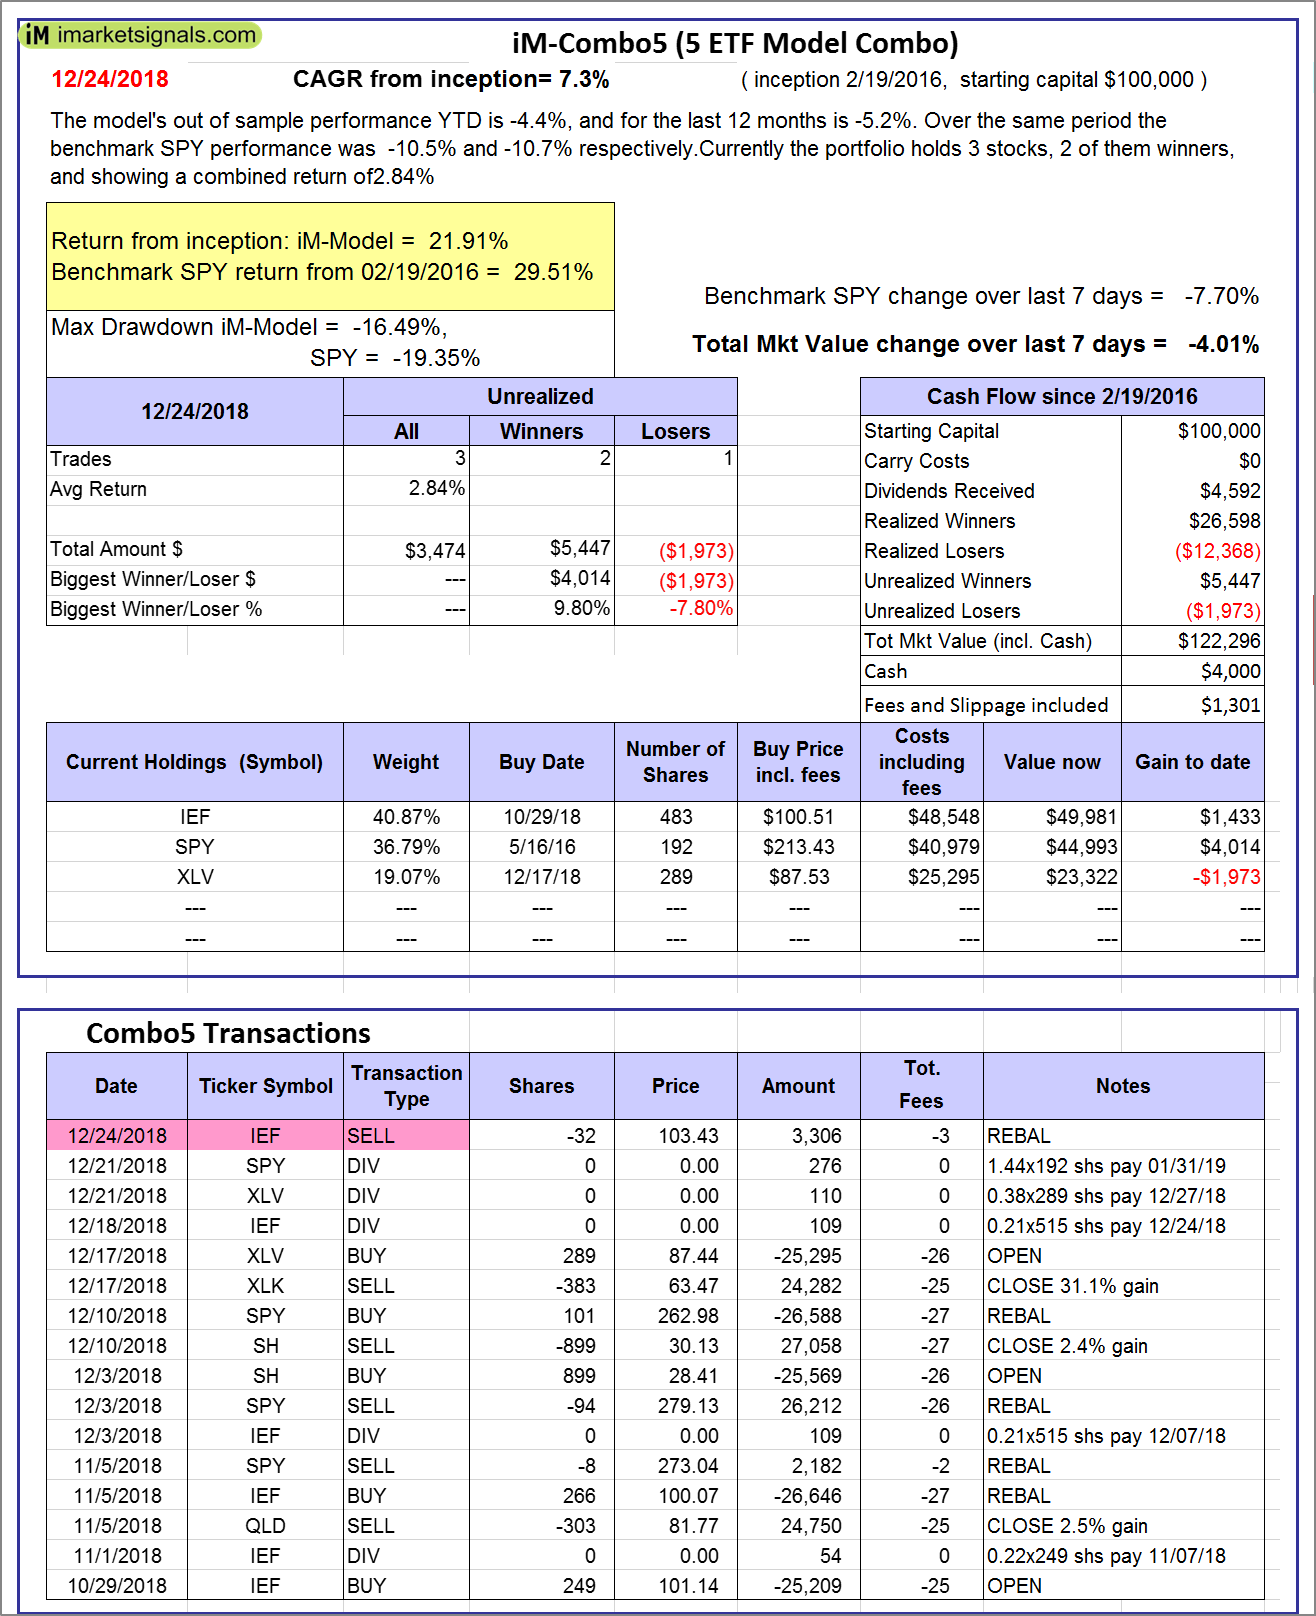 |
iM-Combo5: The model’s out of sample performance YTD is -4.4%, and for the last 12 months is -5.2%. Over the same period the benchmark SPY performance was -10.5% and -10.7% respectively. Over the previous week the market value of iM-Combo5 gained -4.01% at a time when SPY gained -7.70%. A starting capital of $100,000 at inception on 2/22/2016 would have grown to $122,296 which includes $4,000 cash and excludes $1,301 spent on fees and slippage. |
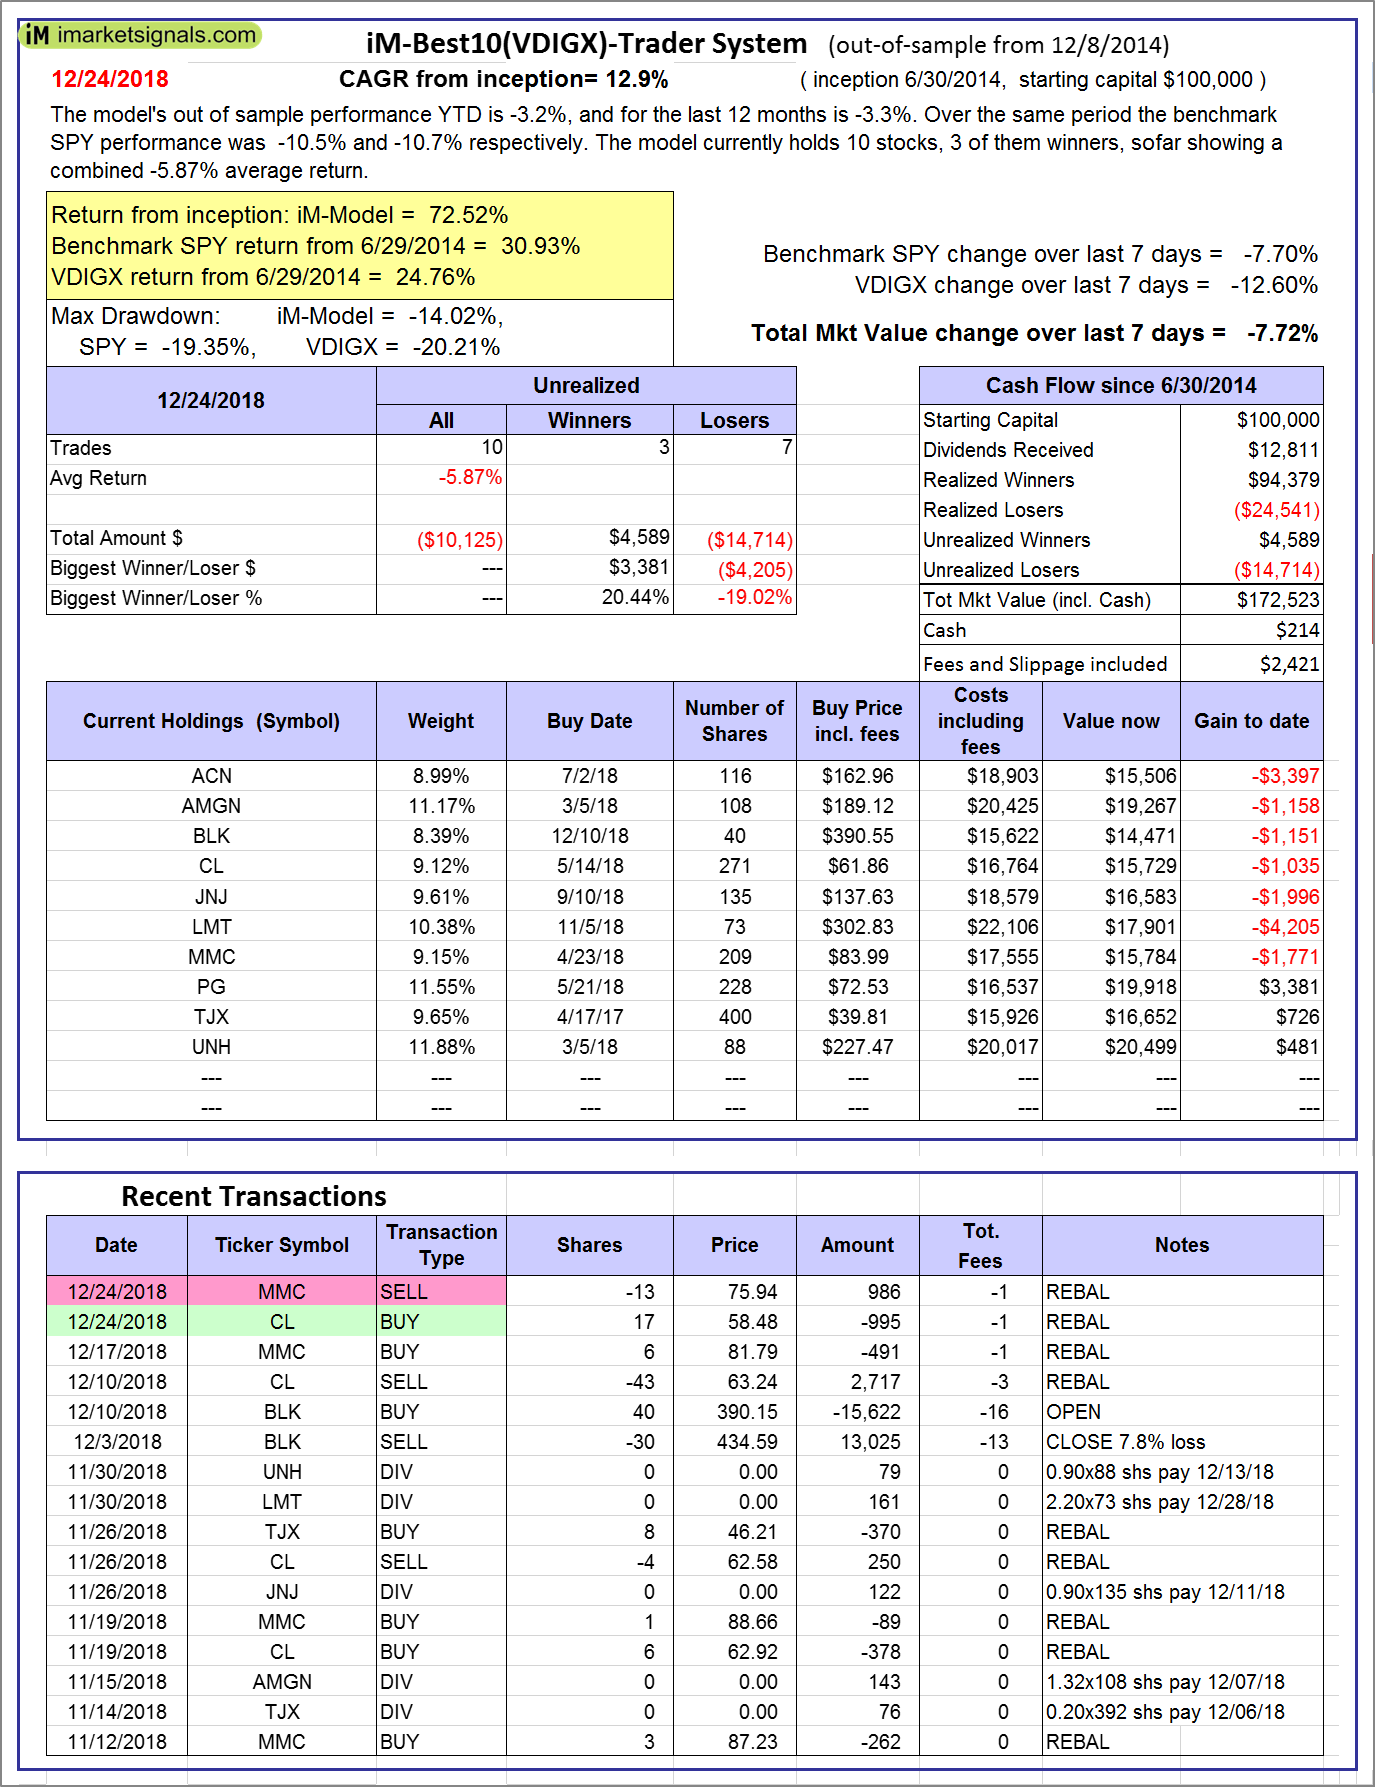 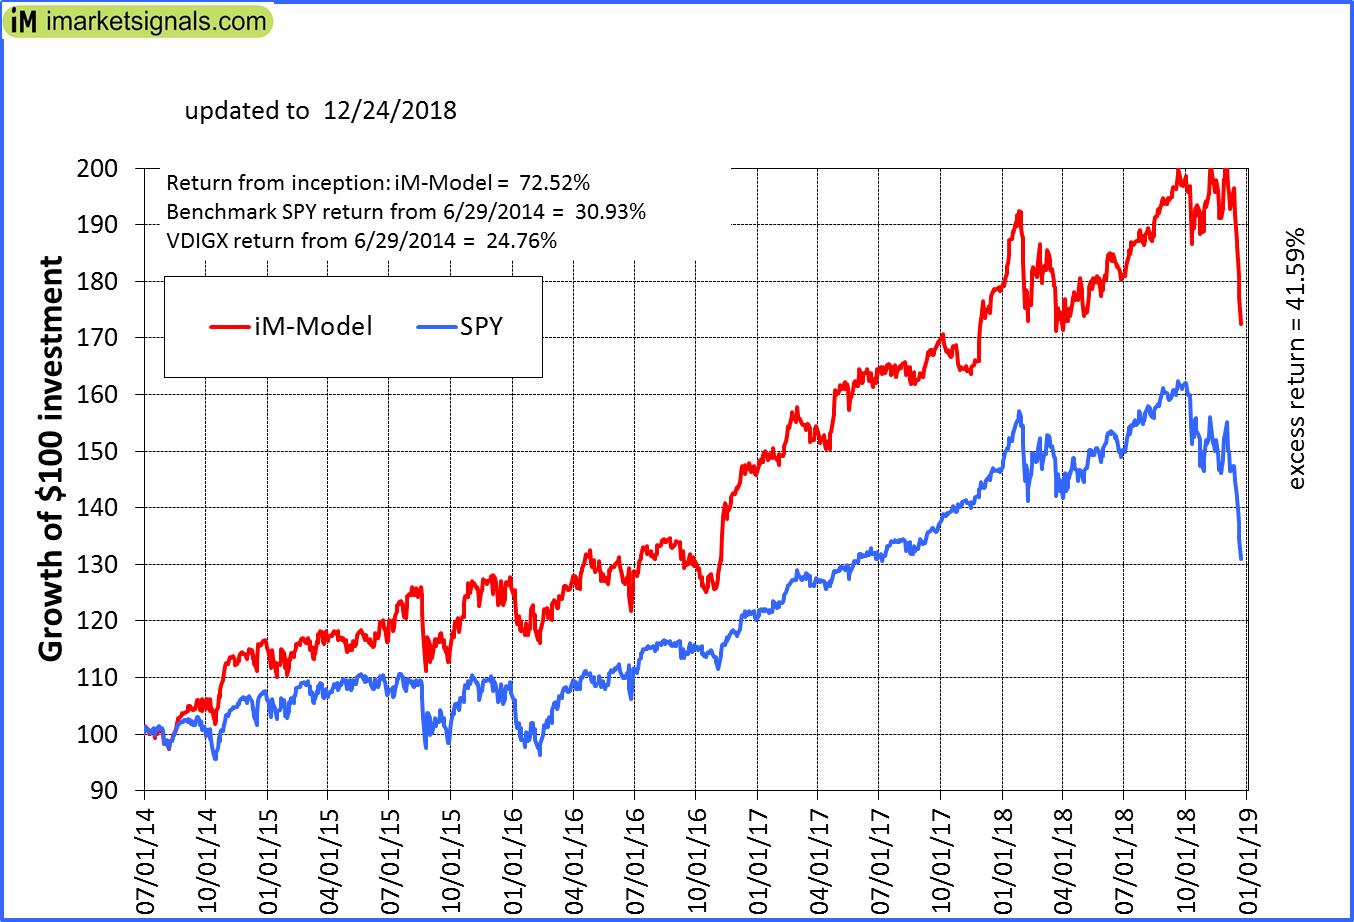 |
iM-Best10(VDIGX)-Trader: The model’s out of sample performance YTD is -3.2%, and for the last 12 months is -3.3%. Over the same period the benchmark SPY performance was -10.5% and -10.7% respectively. Since inception, on 7/1/2014, the model gained 72.52% while the benchmark SPY gained 30.93% and VDIGX gained 24.76% over the same period. Over the previous week the market value of iM-Best10(VDIGX) gained -7.72% at a time when SPY gained -7.70%. A starting capital of $100,000 at inception on 7/1/2014 would have grown to $172,523 which includes $214 cash and excludes $2,421 spent on fees and slippage. |
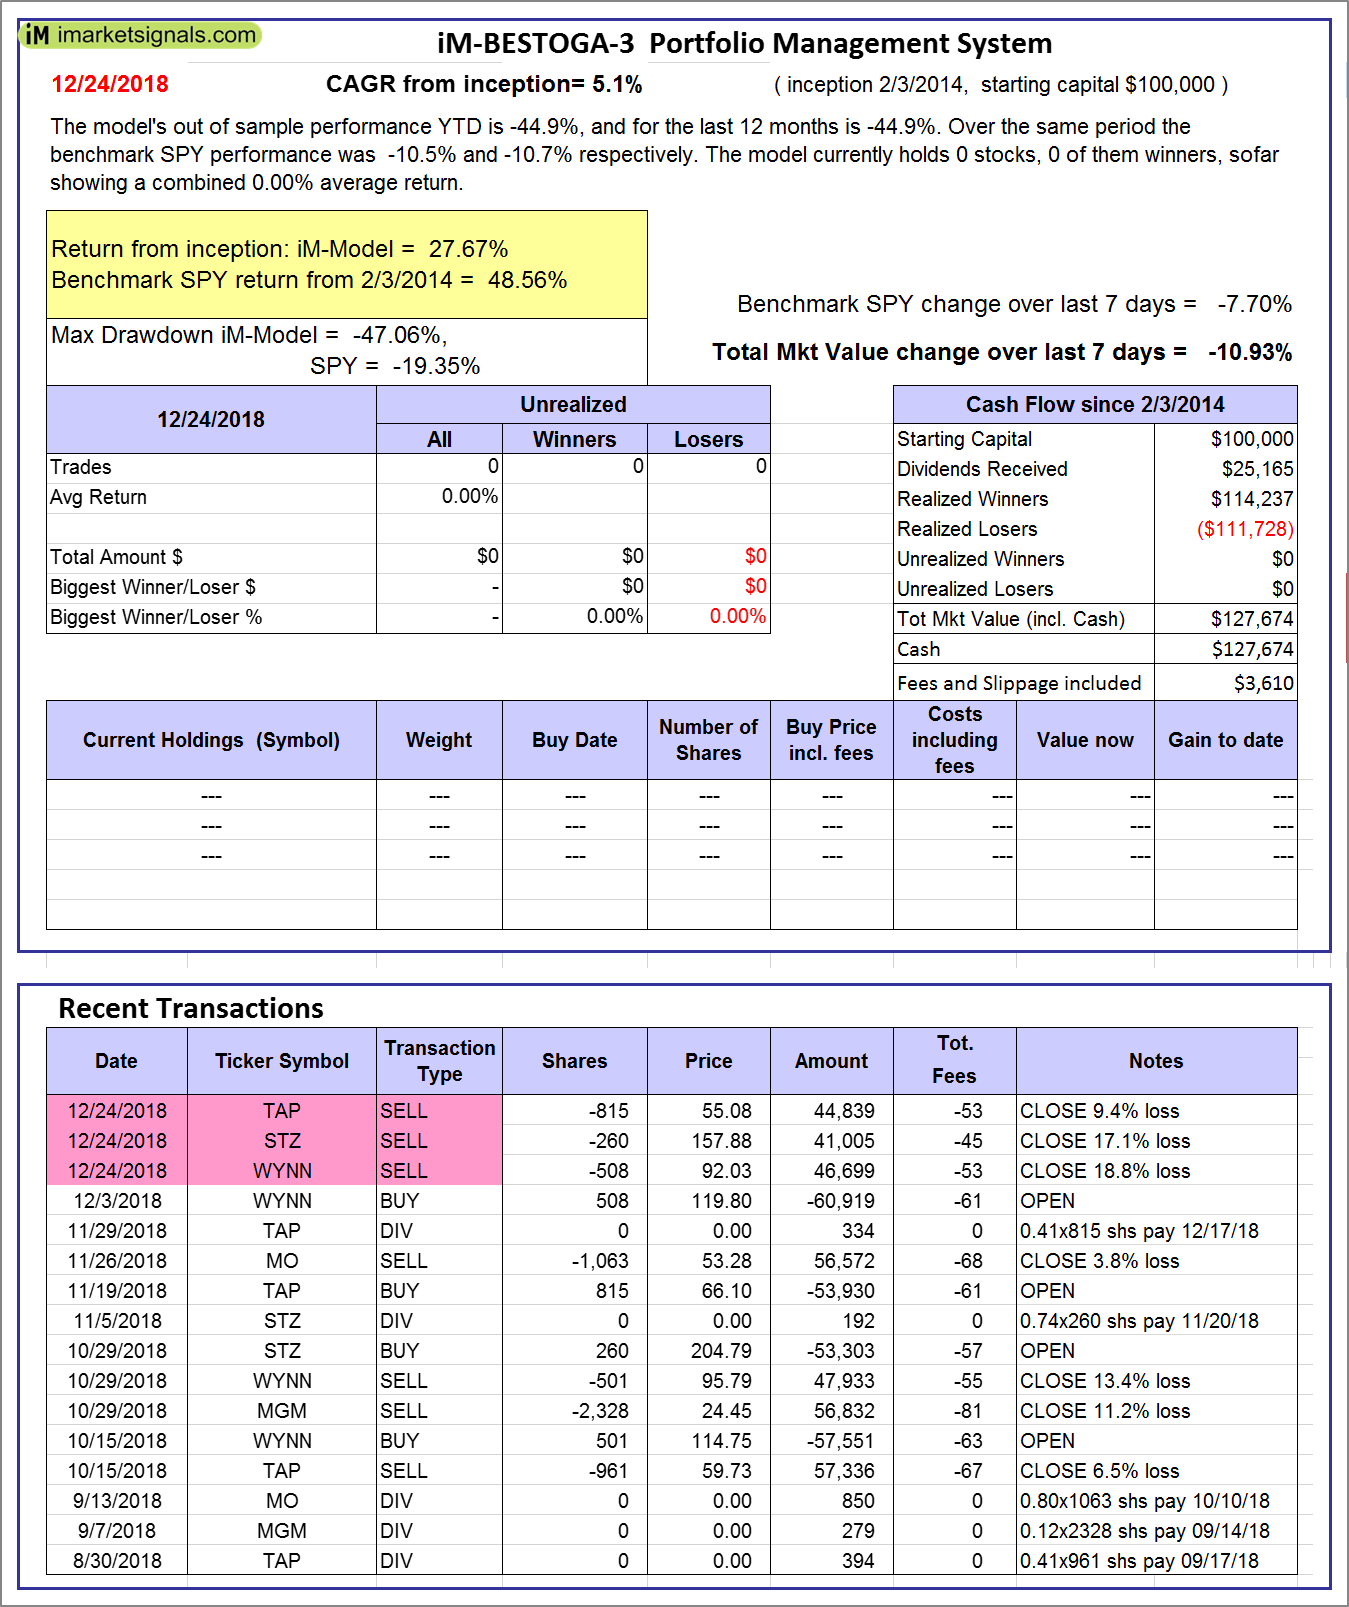 |
iM-BESTOGA-3: The model’s out of sample performance YTD is -44.9%, and for the last 12 months is -44.9%. Over the same period the benchmark SPY performance was -10.5% and -10.7% respectively. Over the previous week the market value of iM-BESTOGA-3 gained -10.93% at a time when SPY gained -7.70%. A starting capital of $100,000 at inception on 2/3/2014 would have grown to $127,674 which includes $127,674 cash and excludes $3,610 spent on fees and slippage. |
 |
iM-Best7(HiD-LoV): The model’s out of sample performance YTD is -7.5%, and for the last 12 months is -6.9%. Over the same period the benchmark SPY performance was -10.5% and -10.7% respectively. Over the previous week the market value of iM-BESTOGA-3 gained -8.27% at a time when SPY gained -7.70%. A starting capital of $100,000 at inception on 6/30/2016 would have grown to $104,847 which includes $914 cash and excludes $2,642 spent on fees and slippage. |
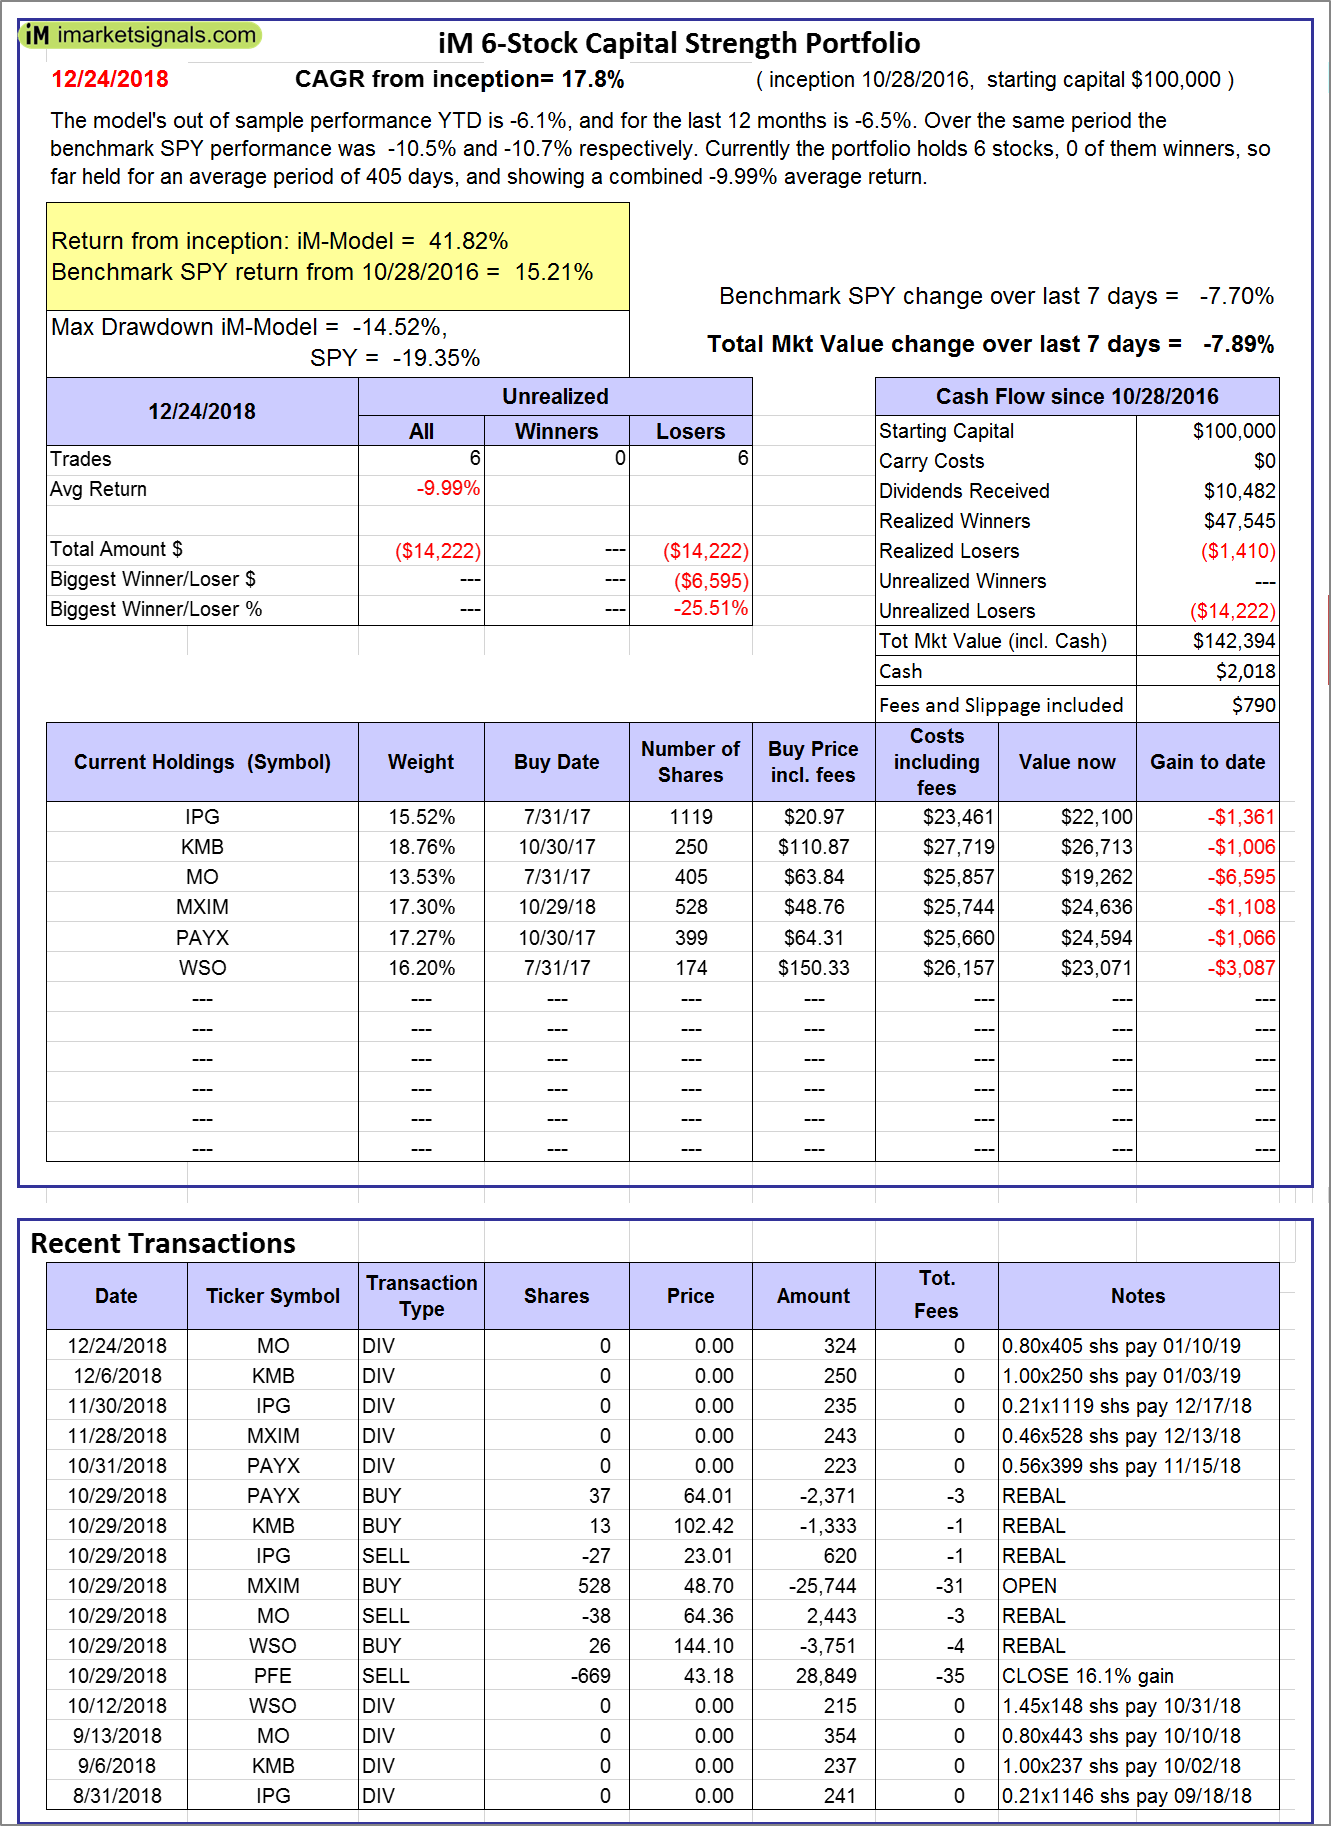 |
iM 6-Stock Capital Strength Portfolio: The model’s out of sample performance YTD is -6.1%, and for the last 12 months is -6.5%. Over the same period the benchmark SPY performance was -10.5% and -10.7% respectively. Over the previous week the market value of the iM 6-Stock Capital Strength Portfolio gained -7.89% at a time when SPY gained -7.70%. A starting capital of $100,000 at inception on 10/28/2016 would have grown to $142,394 which includes $2,018 cash and excludes $790 spent on fees and slippage. |
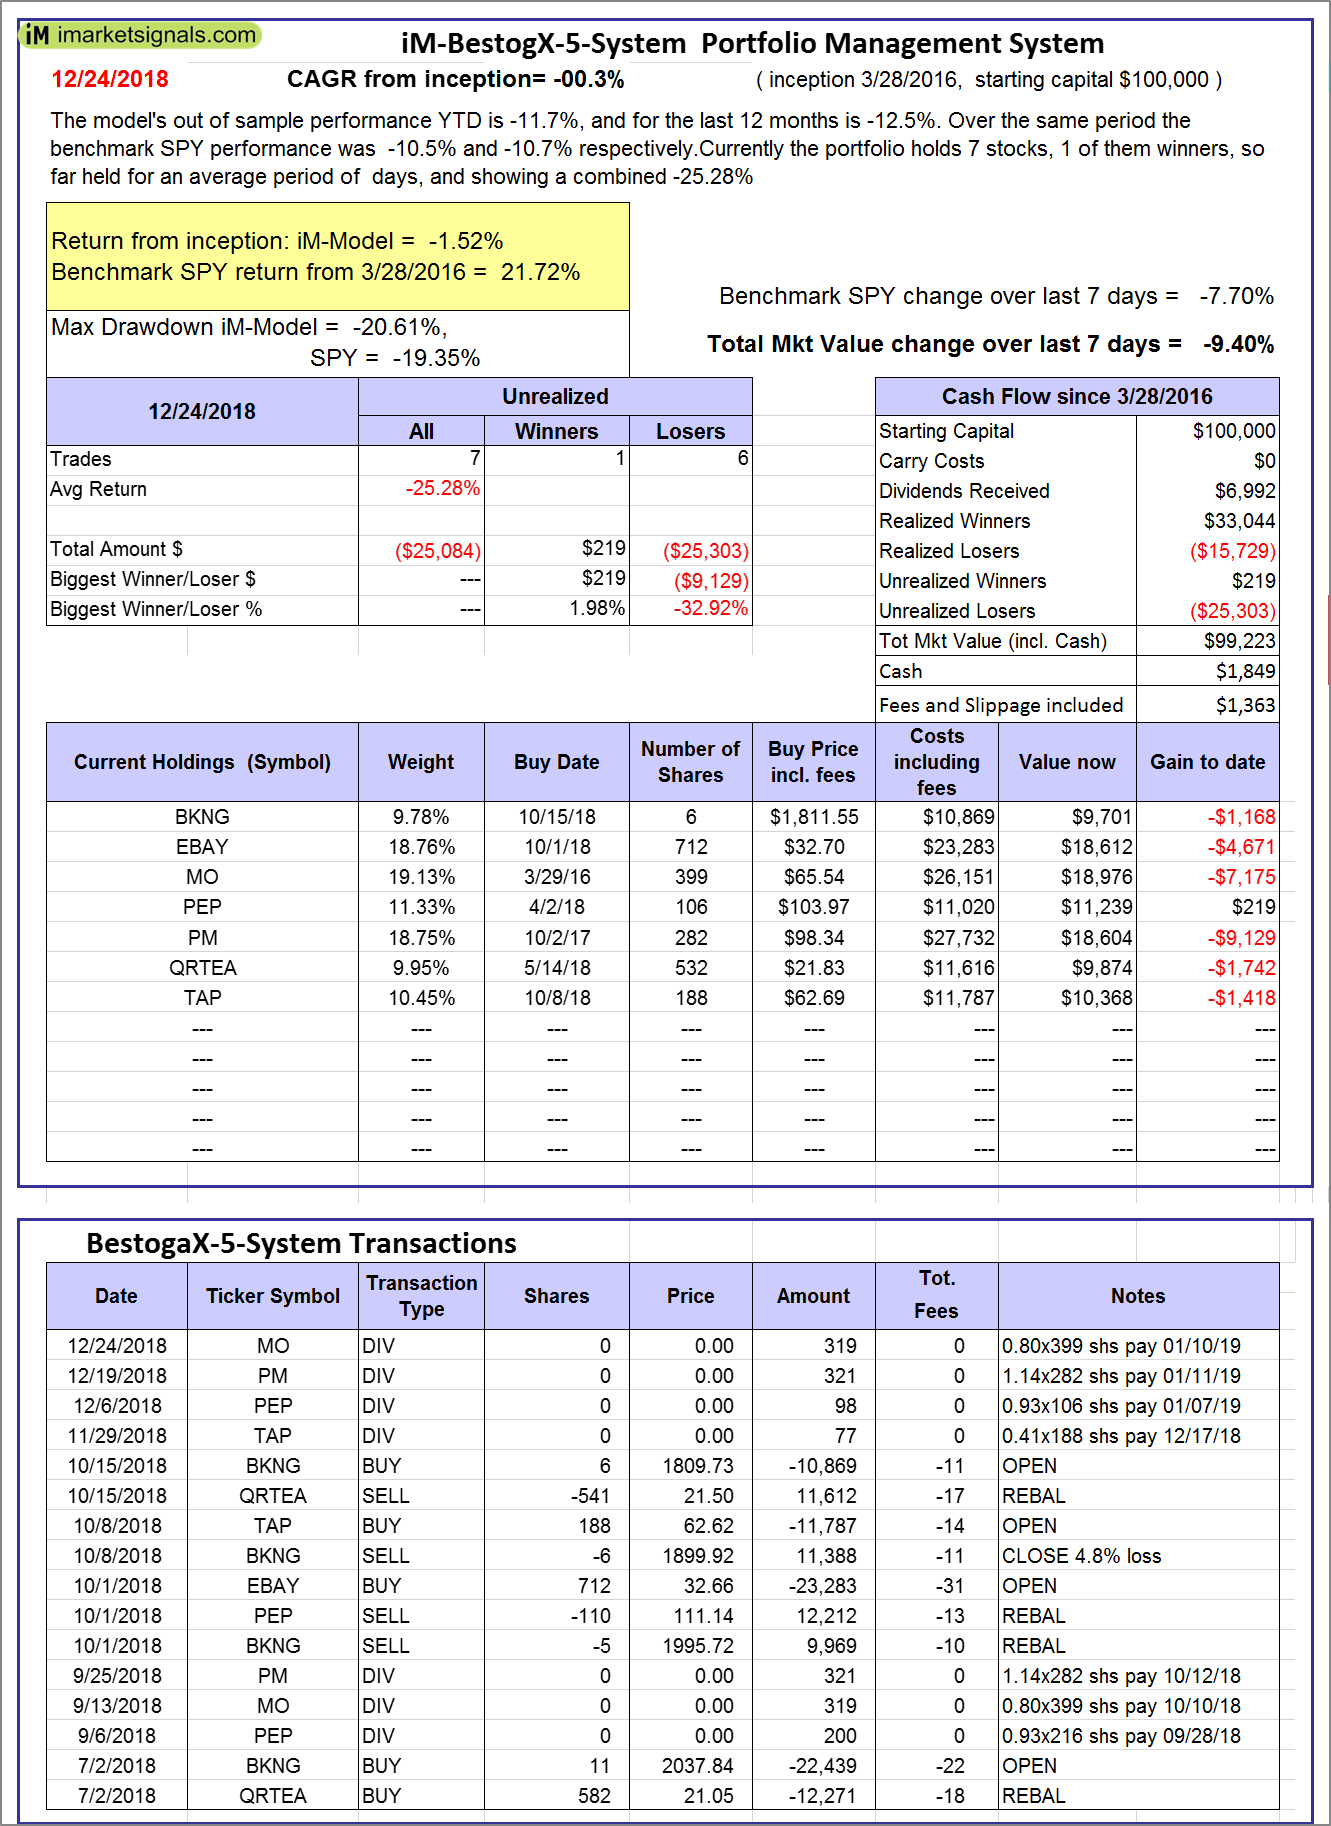 |
iM-BestogaX5-System: The model’s out of sample performance YTD is -11.7%, and for the last 12 months is -12.5%. Over the same period the benchmark SPY performance was -10.5% and -10.7% respectively. Over the previous week the market value of iM-BestogaX5-System gained -9.40% at a time when SPY gained -7.70%. A starting capital of $100,000 at inception on 3/28/2016 would have grown to $99,223 which includes $1,849 cash and excludes $1,363 spent on fees and slippage. |
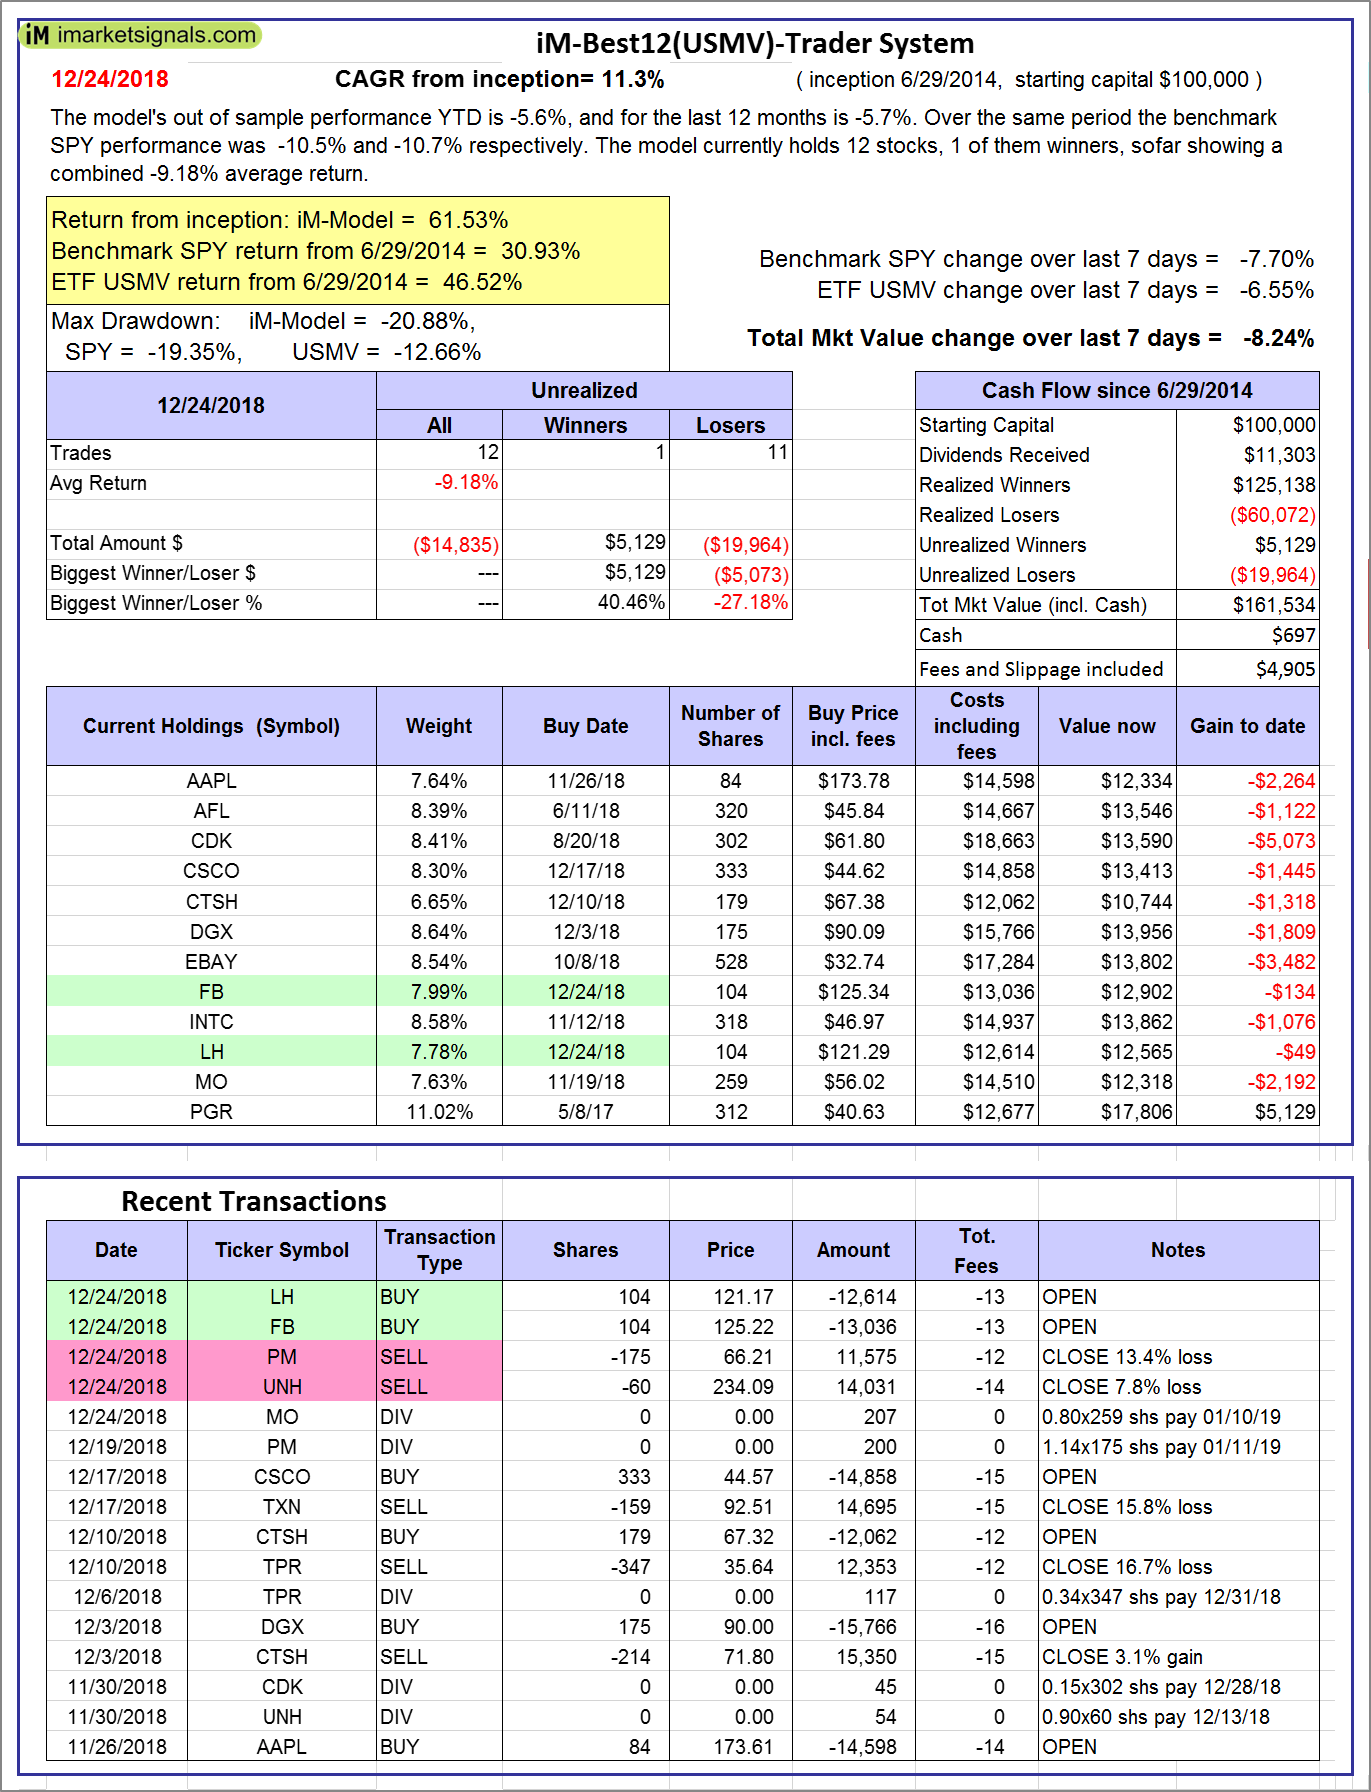 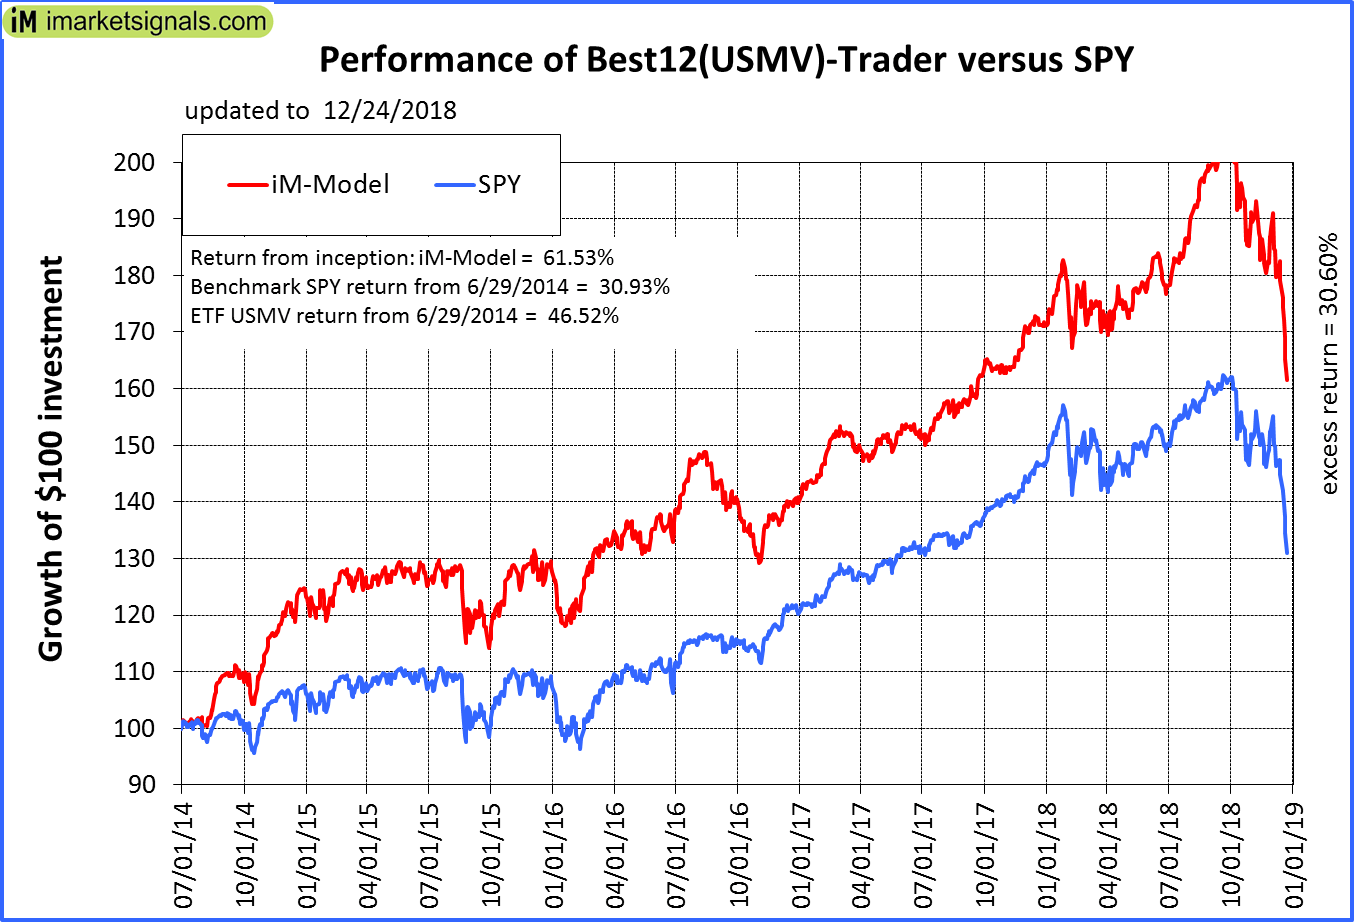 |
iM-Best12(USMV)-Trader: The model’s out of sample performance YTD is -5.6%, and for the last 12 months is -5.7%. Over the same period the benchmark SPY performance was -10.5% and -10.7% respectively. Since inception, on 6/30/2014, the model gained 61.53% while the benchmark SPY gained 30.93% and the ETF USMV gained 46.52% over the same period. Over the previous week the market value of iM-Best12(USMV)-Trader gained -8.24% at a time when SPY gained -7.70%. A starting capital of $100,000 at inception on 6/30/2014 would have grown to $161,534 which includes $697 cash and excludes $4,905 spent on fees and slippage. |
 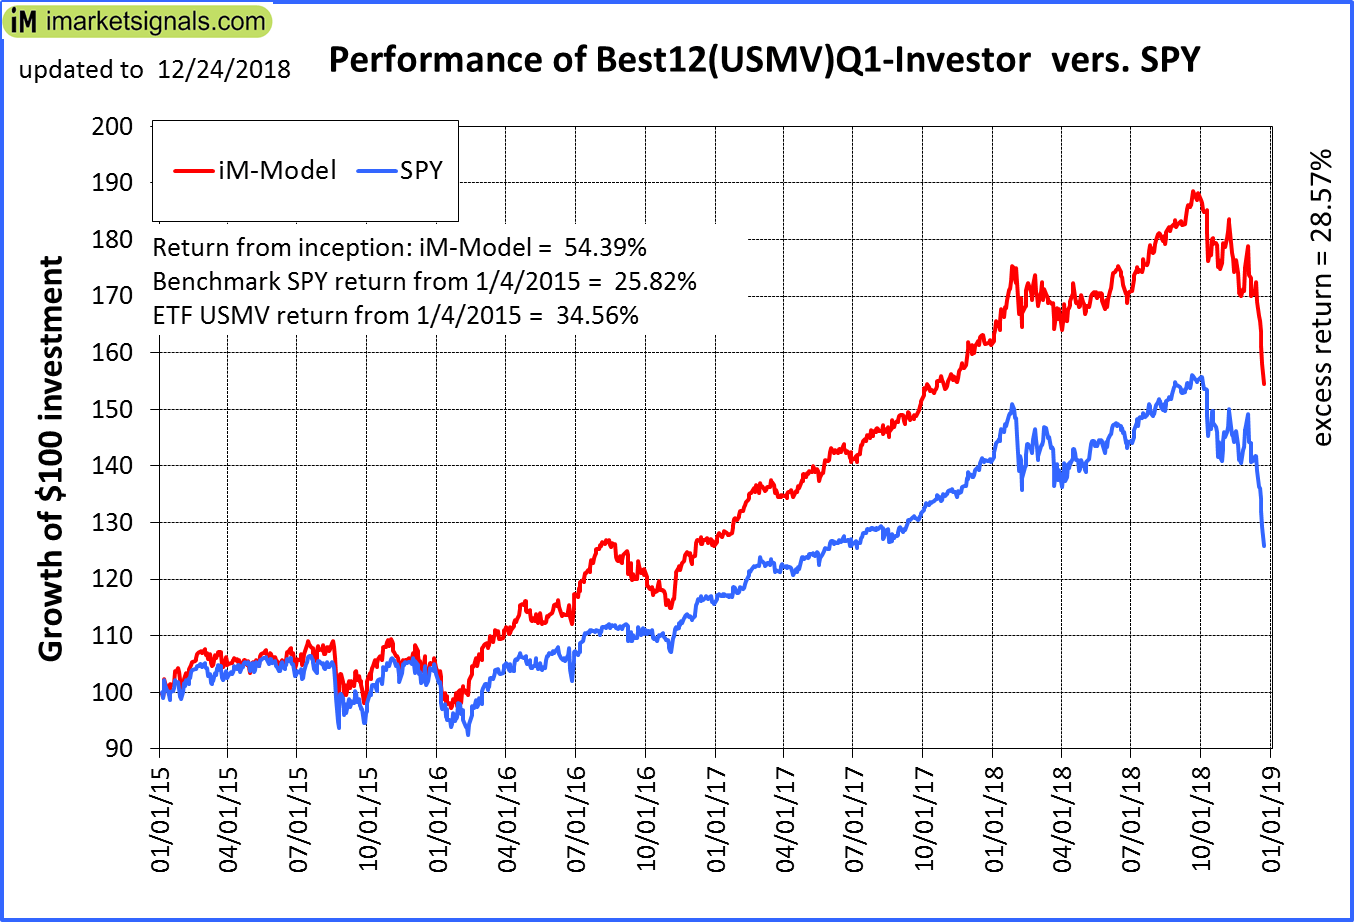 |
iM-Best12(USMV)Q1-Investor: The model’s out of sample performance YTD is -4.4%, and for the last 12 months is -4.4%. Over the same period the benchmark SPY performance was -10.5% and -10.7% respectively. Since inception, on 1/5/2015, the model gained 54.39% while the benchmark SPY gained 25.82% and the ETF USMV gained 34.56% over the same period. Over the previous week the market value of iM-Best12(USMV)Q1 gained -7.30% at a time when SPY gained -7.70%. A starting capital of $100,000 at inception on 1/5/2015 would have grown to $154,386 which includes $1,423 cash and excludes $1,393 spent on fees and slippage. |
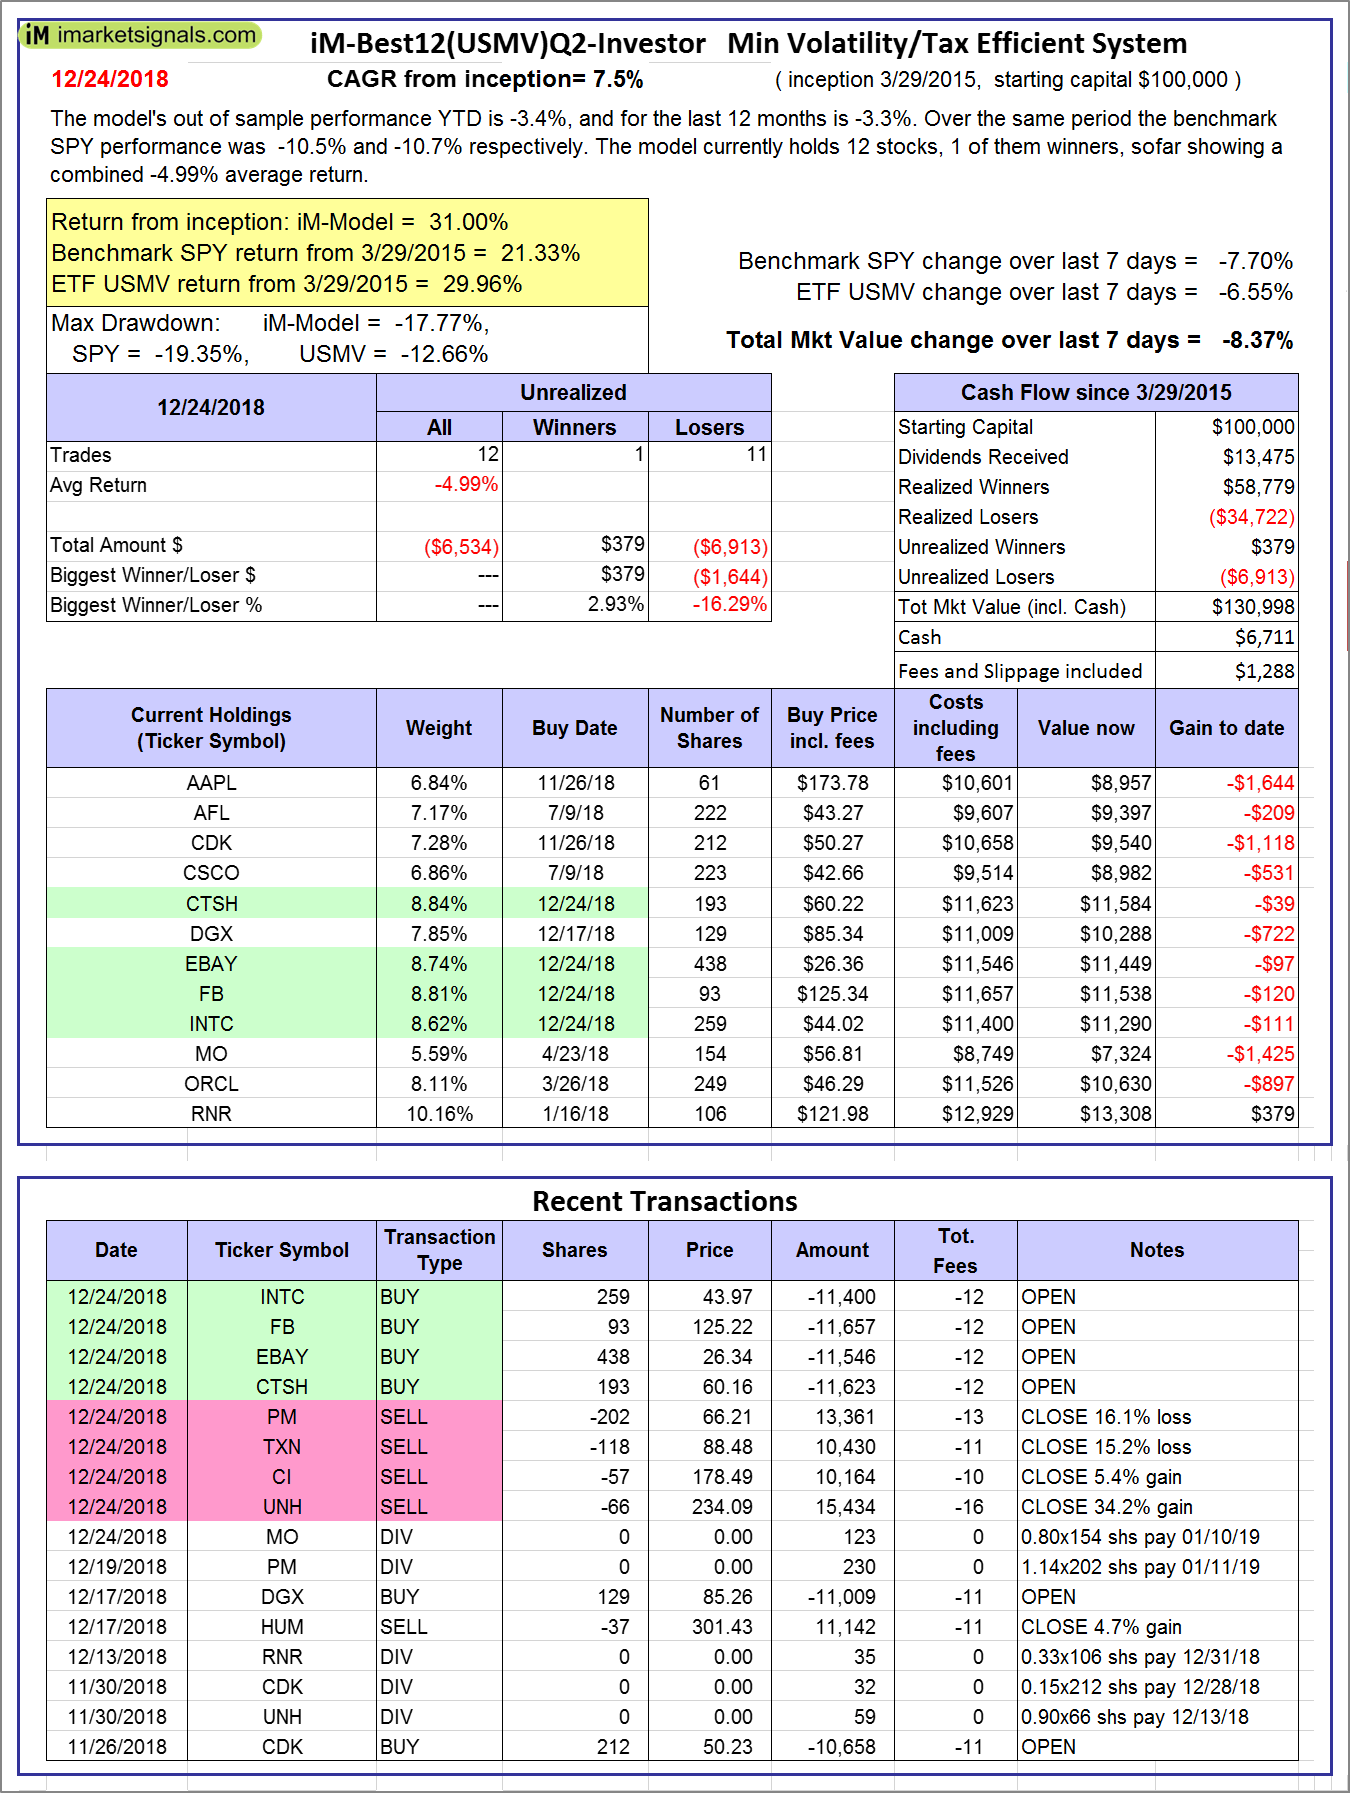 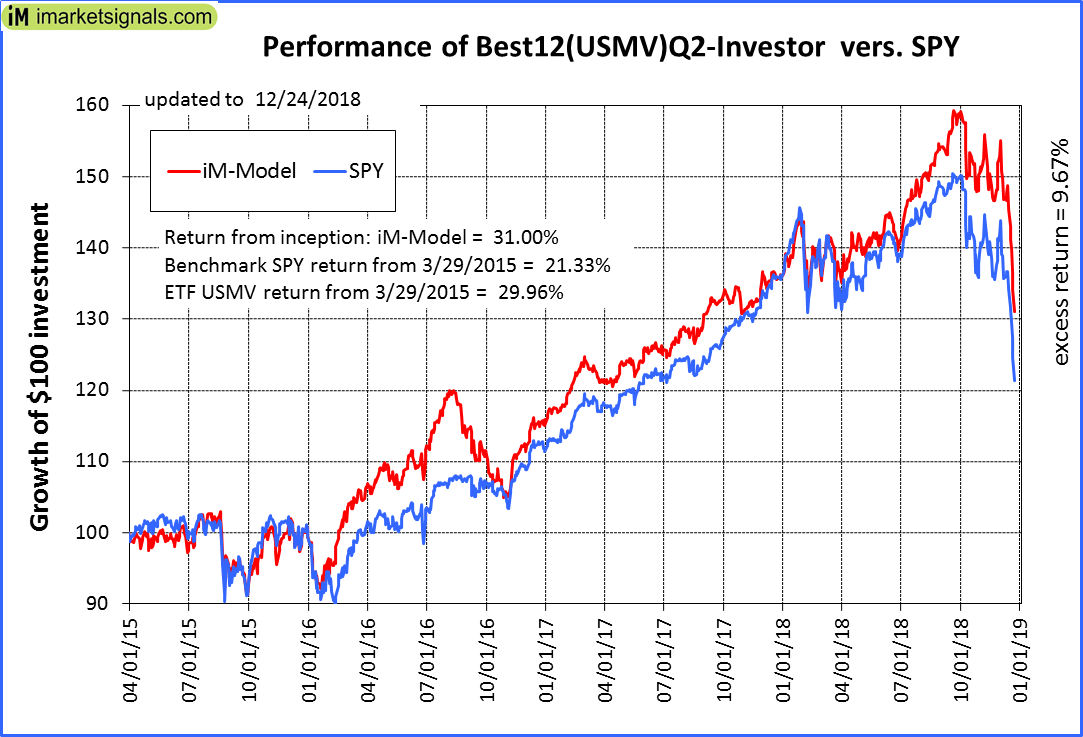 |
iM-Best12(USMV)Q2-Investor: The model’s out of sample performance YTD is -3.4%, and for the last 12 months is -3.3%. Over the same period the benchmark SPY performance was -10.5% and -10.7% respectively. Since inception, on 3/30/2015, the model gained 31.00% while the benchmark SPY gained 21.33% and the ETF USMV gained 29.96% over the same period. Over the previous week the market value of iM-Best12(USMV)Q2 gained -8.37% at a time when SPY gained -7.70%. A starting capital of $100,000 at inception on 3/30/2015 would have grown to $130,998 which includes $6,711 cash and excludes $1,288 spent on fees and slippage. |
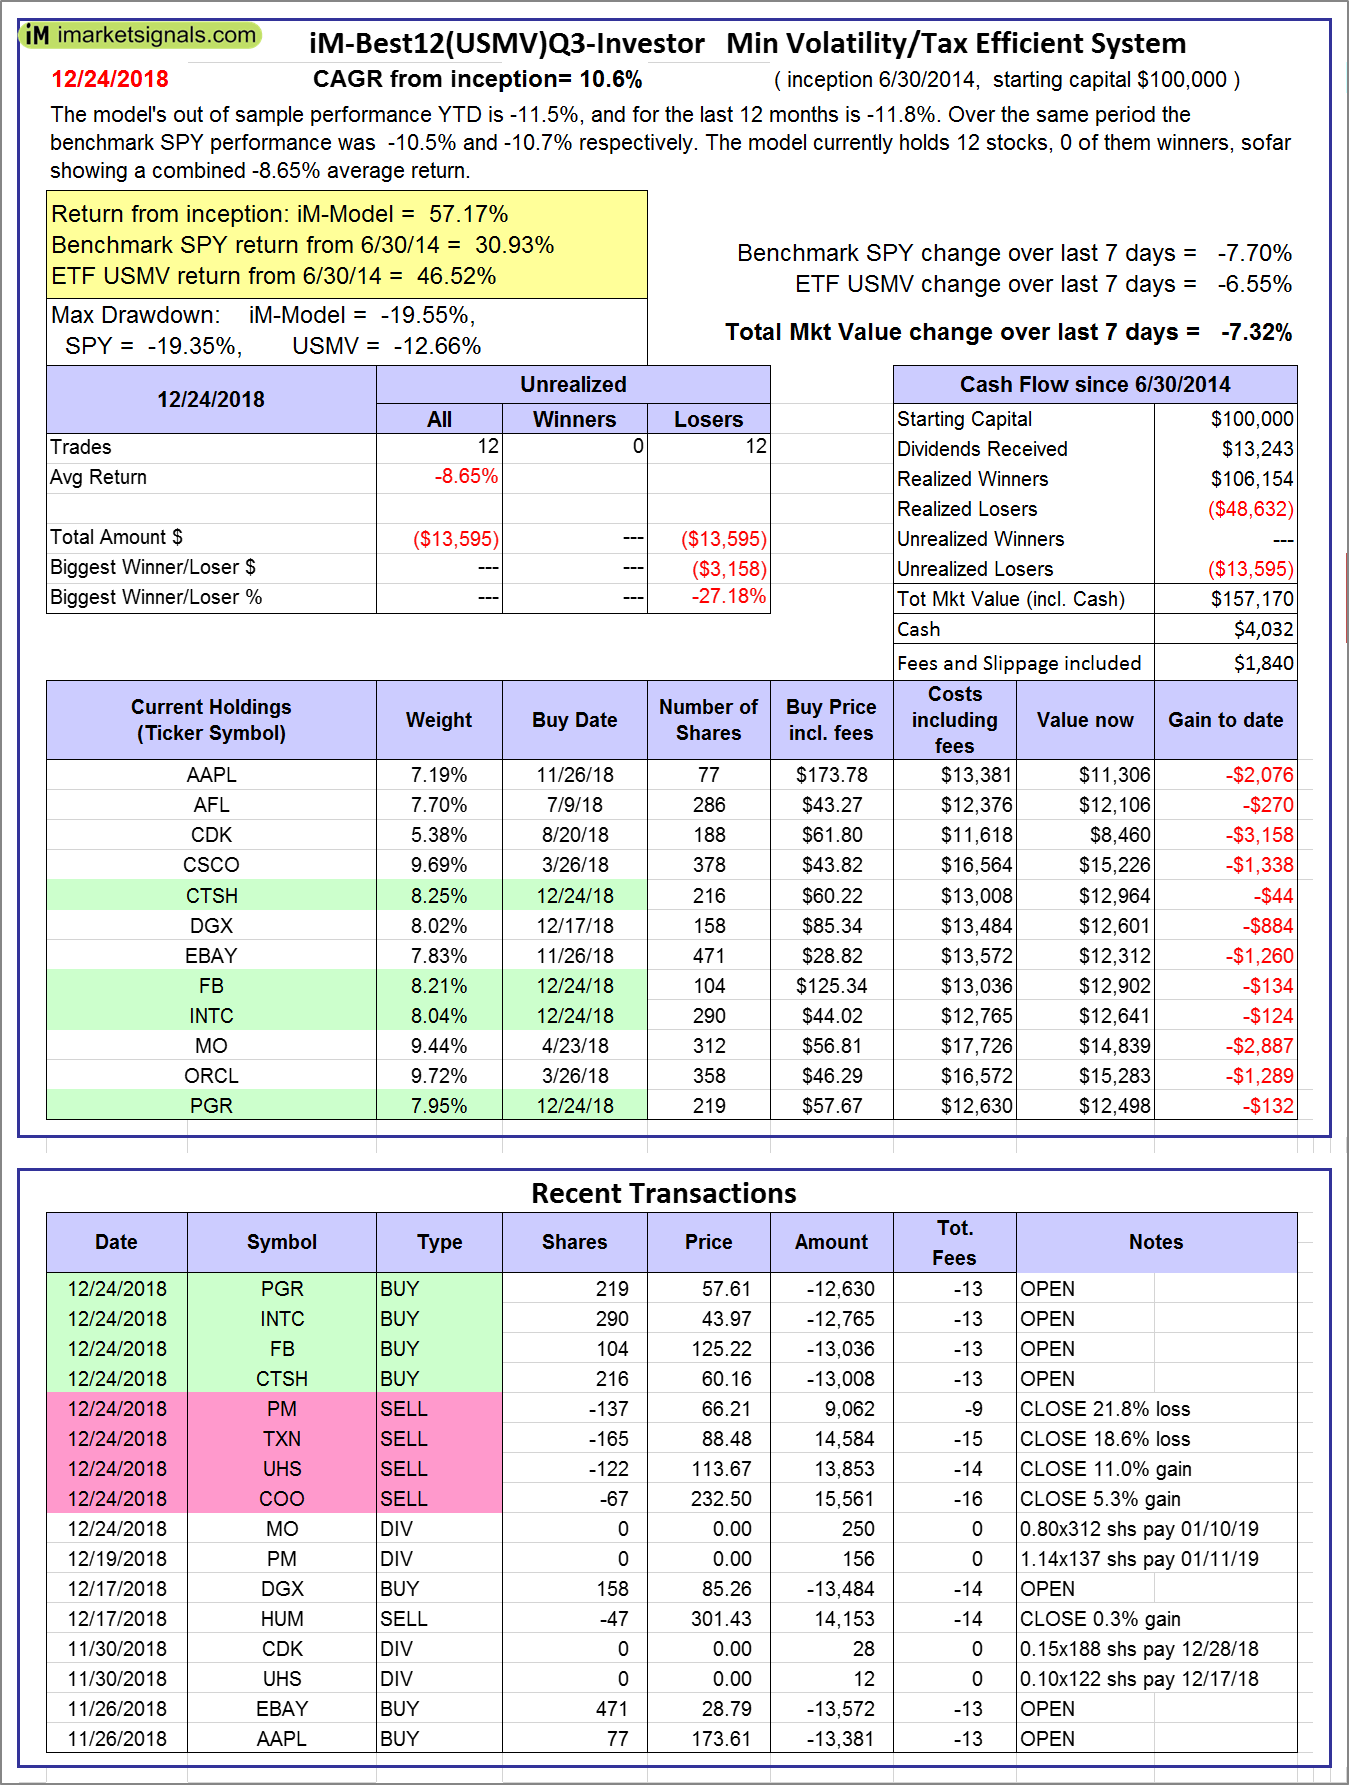 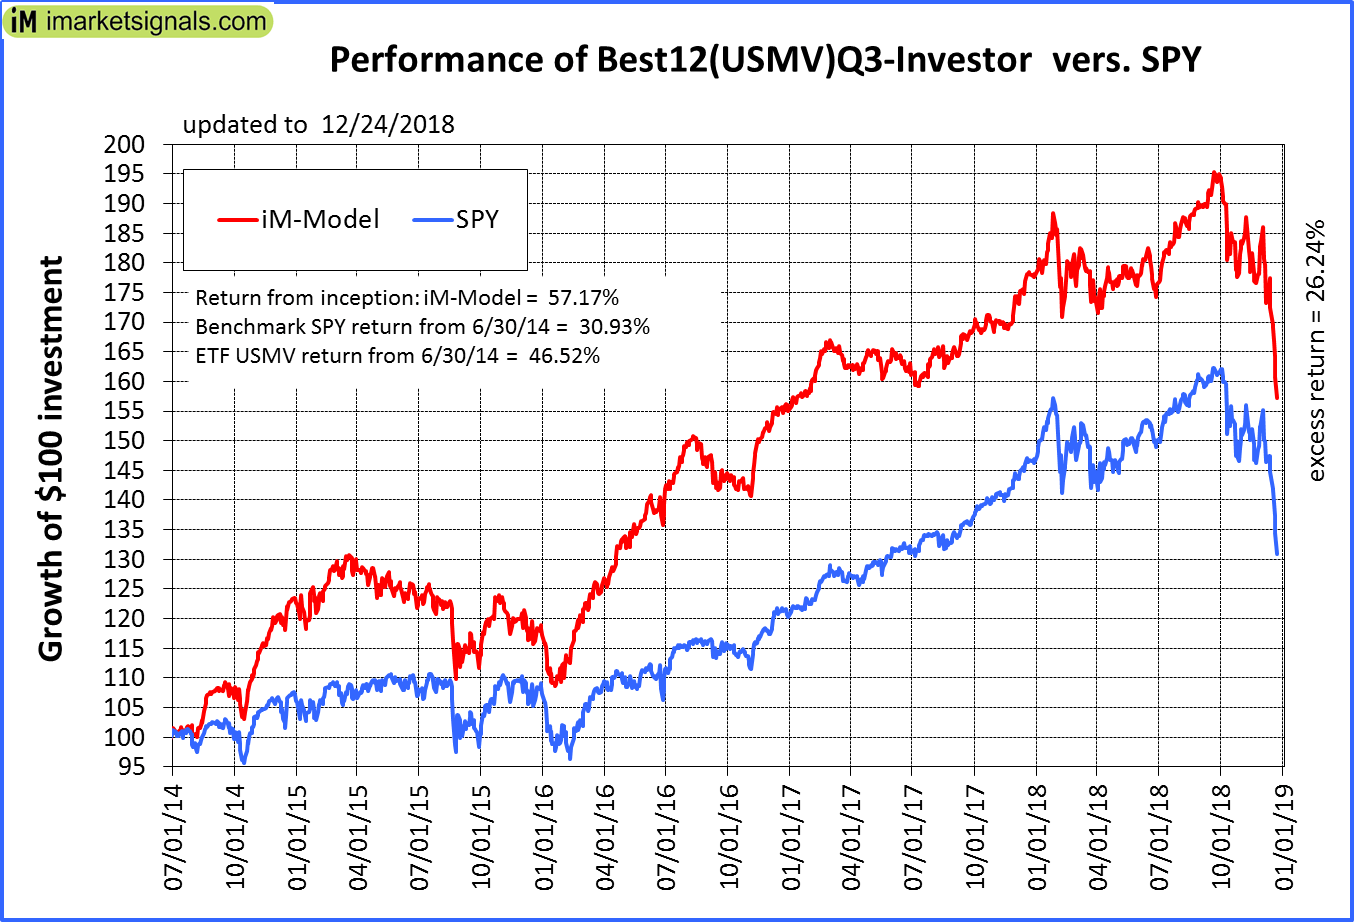 |
iM-Best12(USMV)Q3-Investor: The model’s out of sample performance YTD is -11.5%, and for the last 12 months is -11.8%. Over the same period the benchmark SPY performance was -10.5% and -10.7% respectively. Since inception, on 7/1/2014, the model gained 57.17% while the benchmark SPY gained 30.93% and the ETF USMV gained 46.52% over the same period. Over the previous week the market value of iM-Best12(USMV)Q3 gained -7.32% at a time when SPY gained -7.70%. A starting capital of $100,000 at inception on 7/1/2014 would have grown to $157,170 which includes $4,032 cash and excludes $1,840 spent on fees and slippage. |
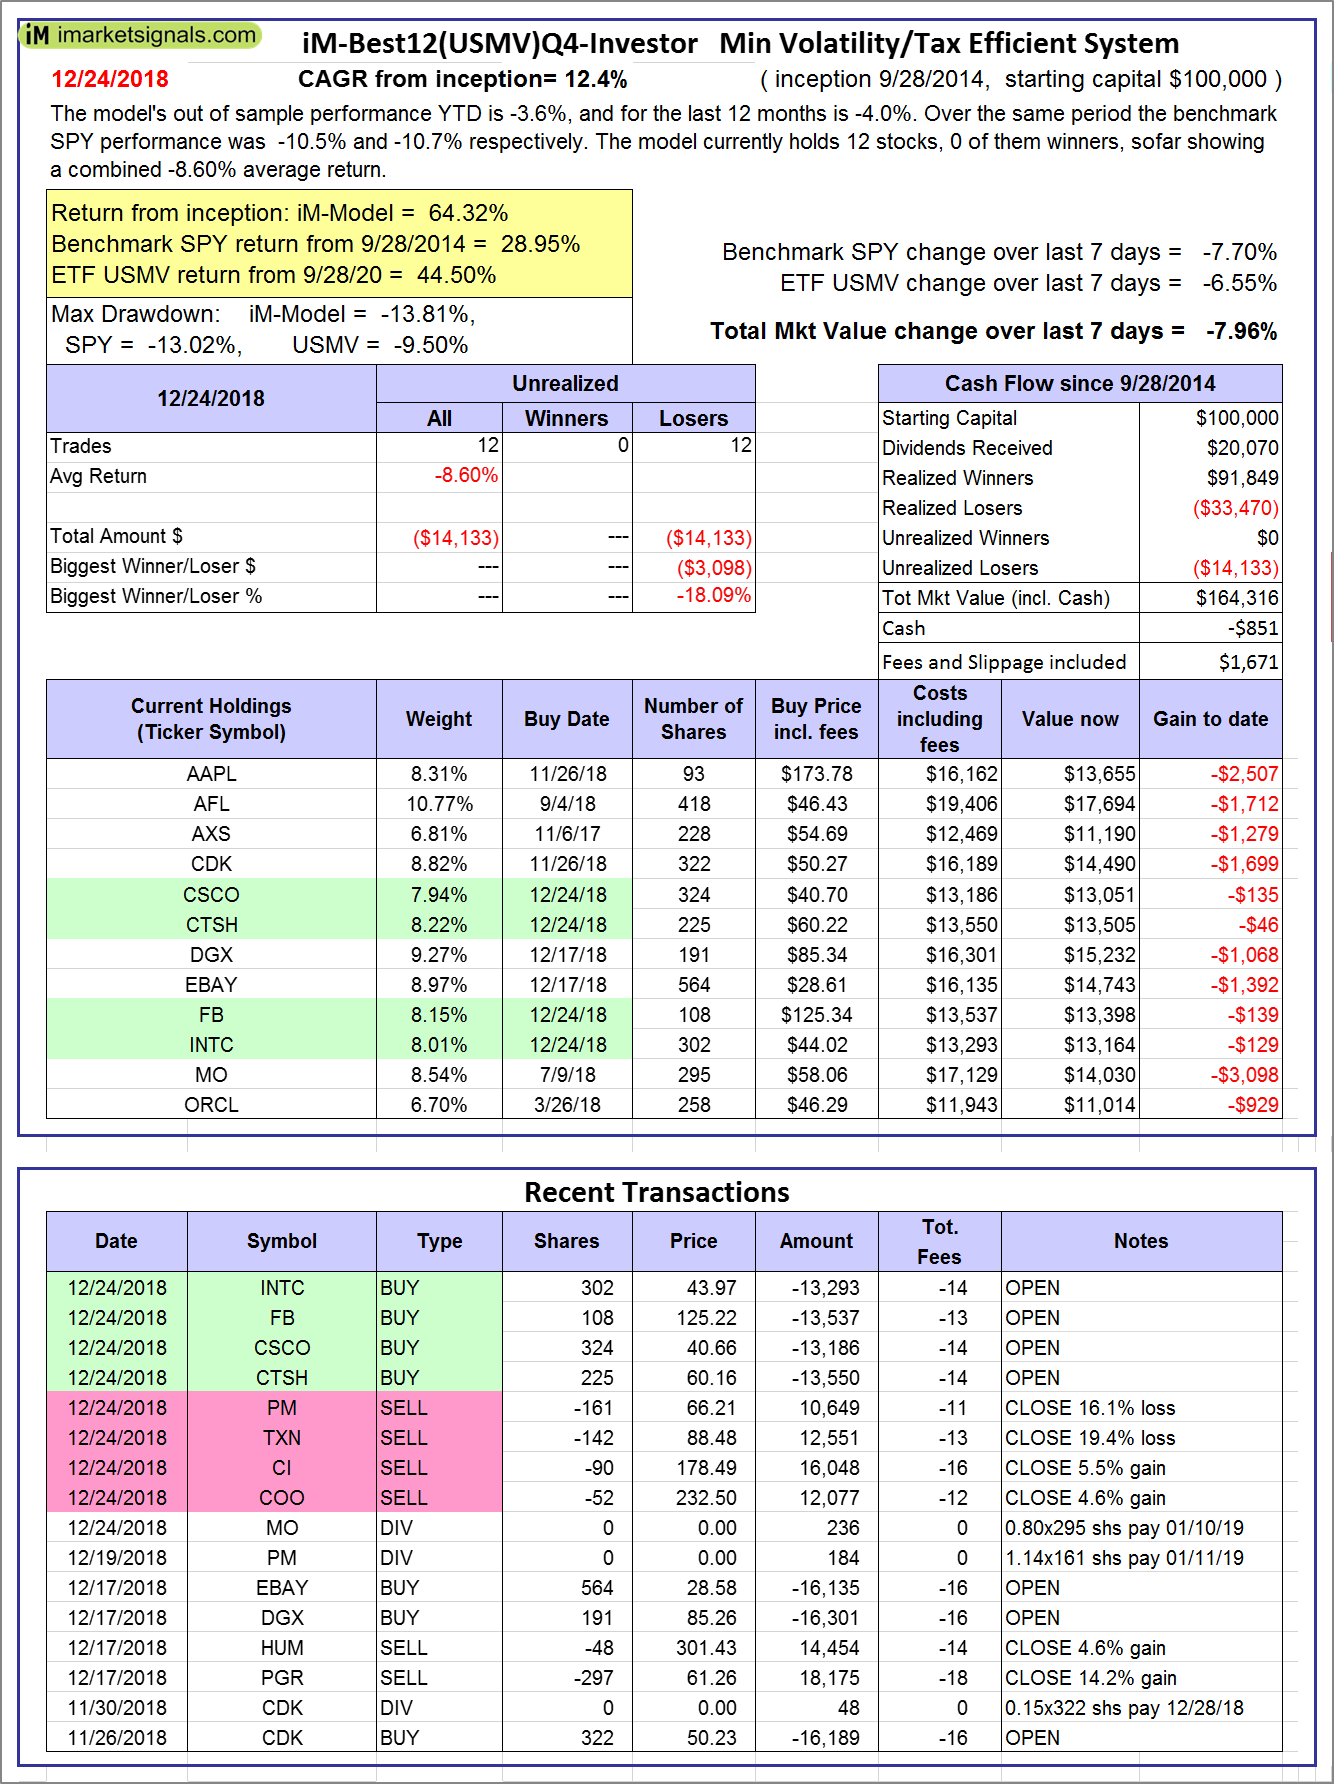 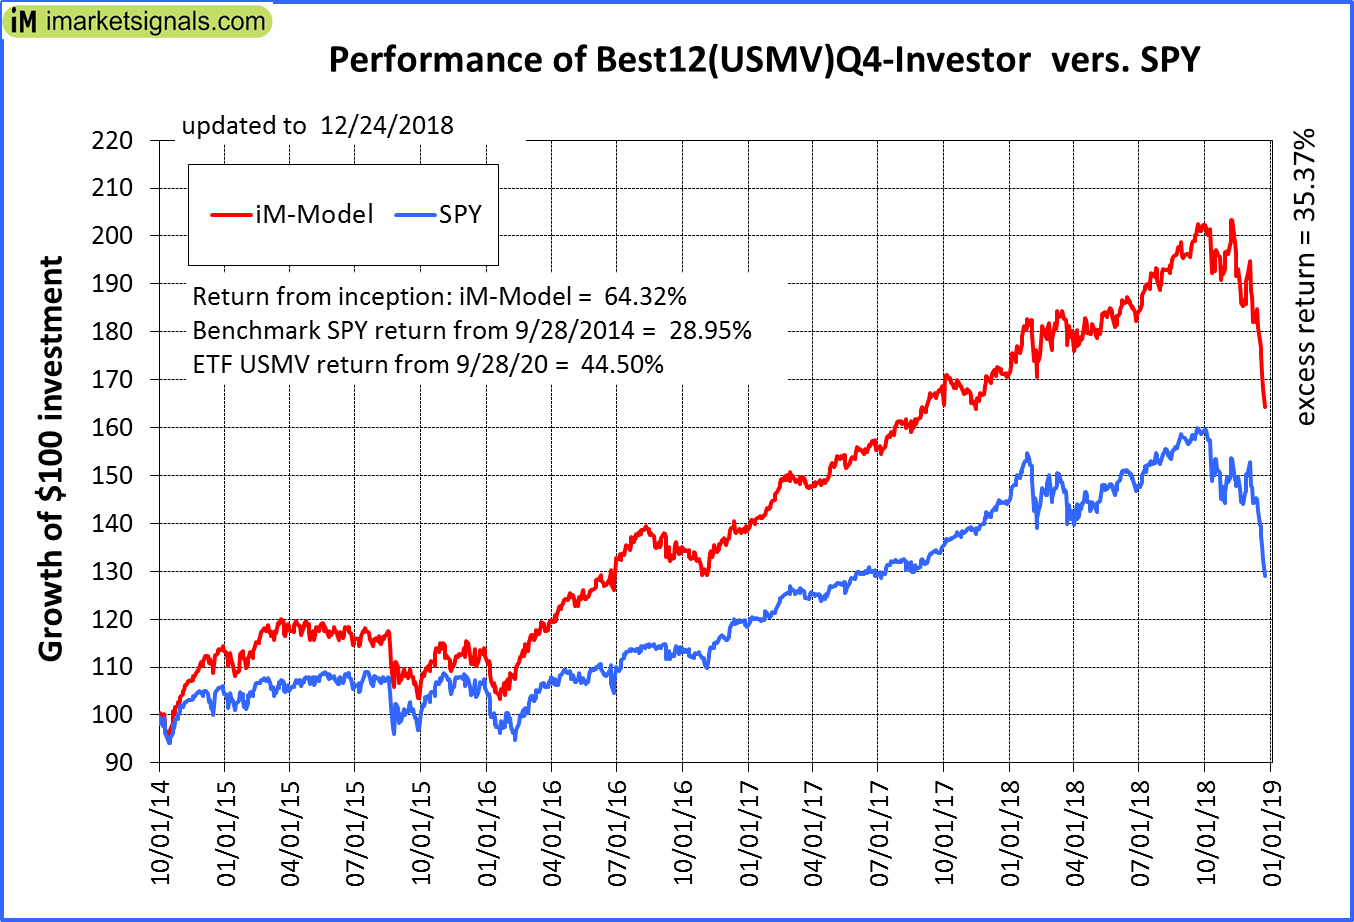 |
iM-Best12(USMV)Q4-Investor: Since inception, on 9/29/2014, the model gained 64.32% while the benchmark SPY gained 28.95% and the ETF USMV gained 44.50% over the same period. Over the previous week the market value of iM-Best12(USMV)Q4 gained -7.96% at a time when SPY gained -7.70%. A starting capital of $100,000 at inception on 9/29/2014 would have grown to $164,316 which includes -$851 cash and excludes $1,671 spent on fees and slippage. |
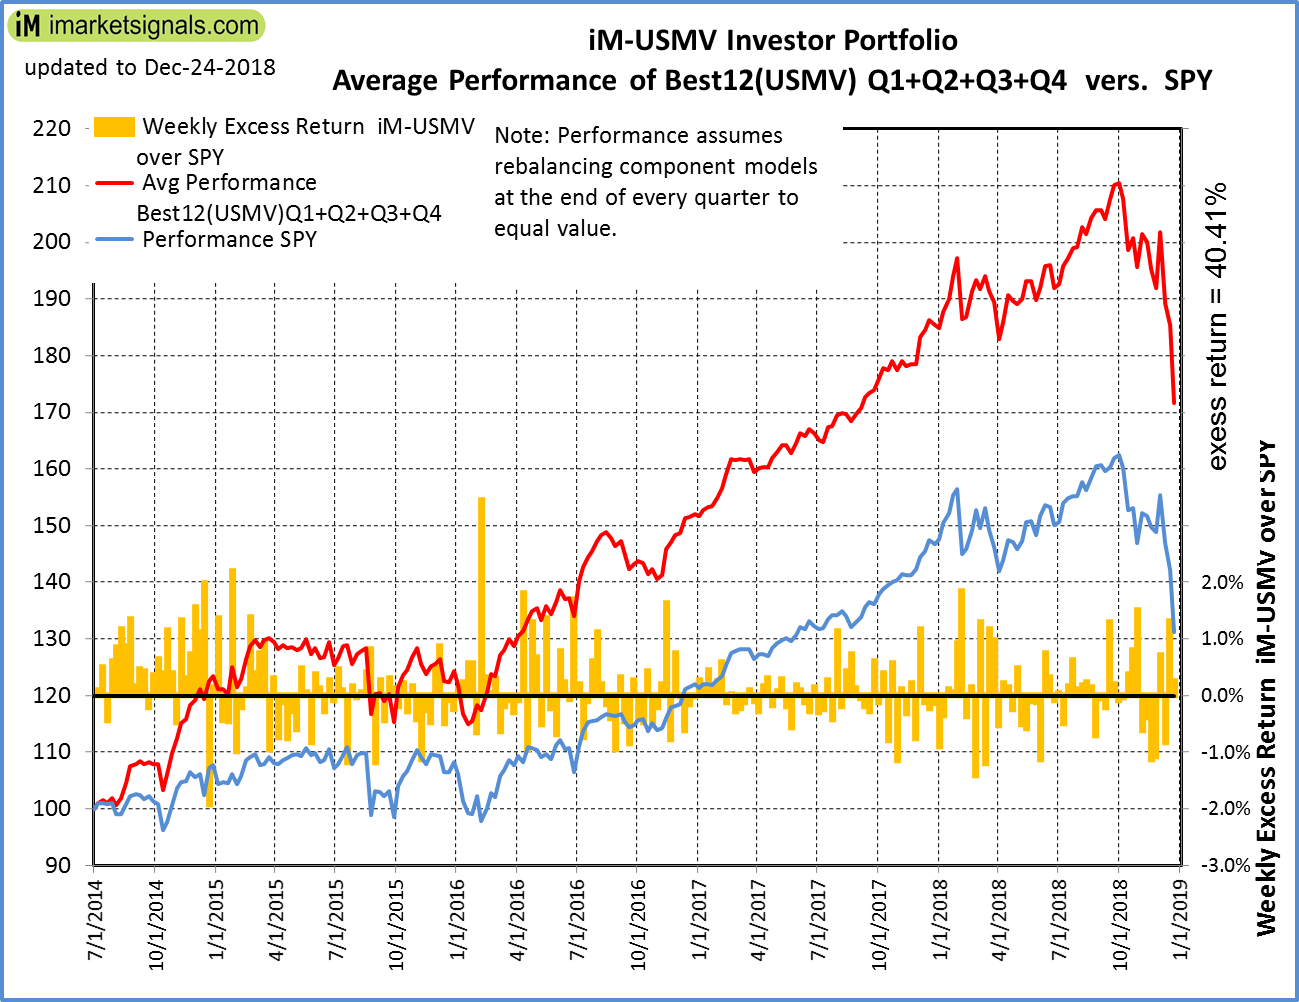 |
Average Performance of iM-Best12(USMV)Q1+Q2+Q3+Q4-Investor resulted in an excess return of 40.41% over SPY. (see iM-USMV Investor Portfolio) |
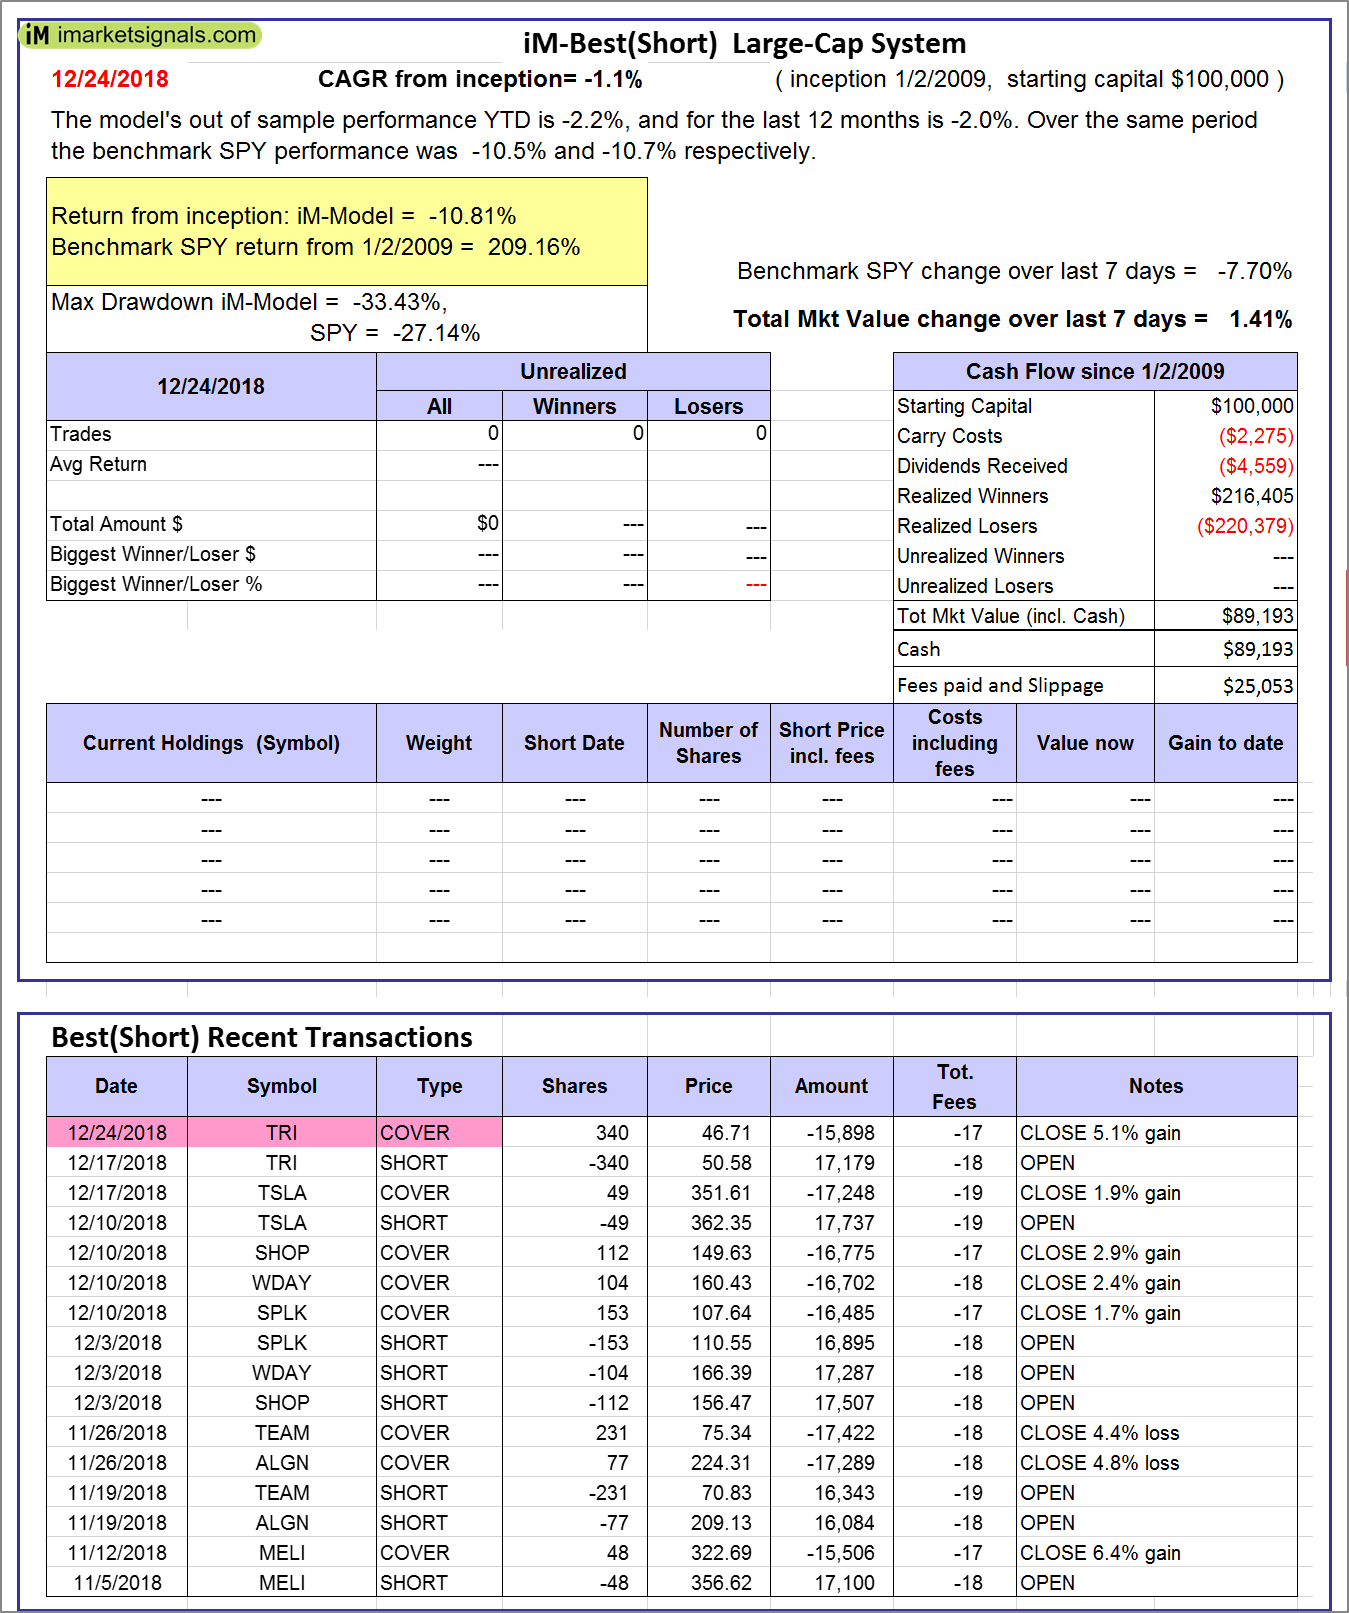 |
iM-Best(Short): The model’s out of sample performance YTD is -2.2%, and for the last 12 months is -2.0%. Over the same period the benchmark SPY performance was -10.5% and -10.7% respectively. Over the previous week the market value of iM-Best(Short) gained 1.41% at a time when SPY gained -7.70%. Over the period 1/2/2009 to 12/24/2018 the starting capital of $100,000 would have grown to $89,193 which includes $89,193 cash and excludes $25,053 spent on fees and slippage. |
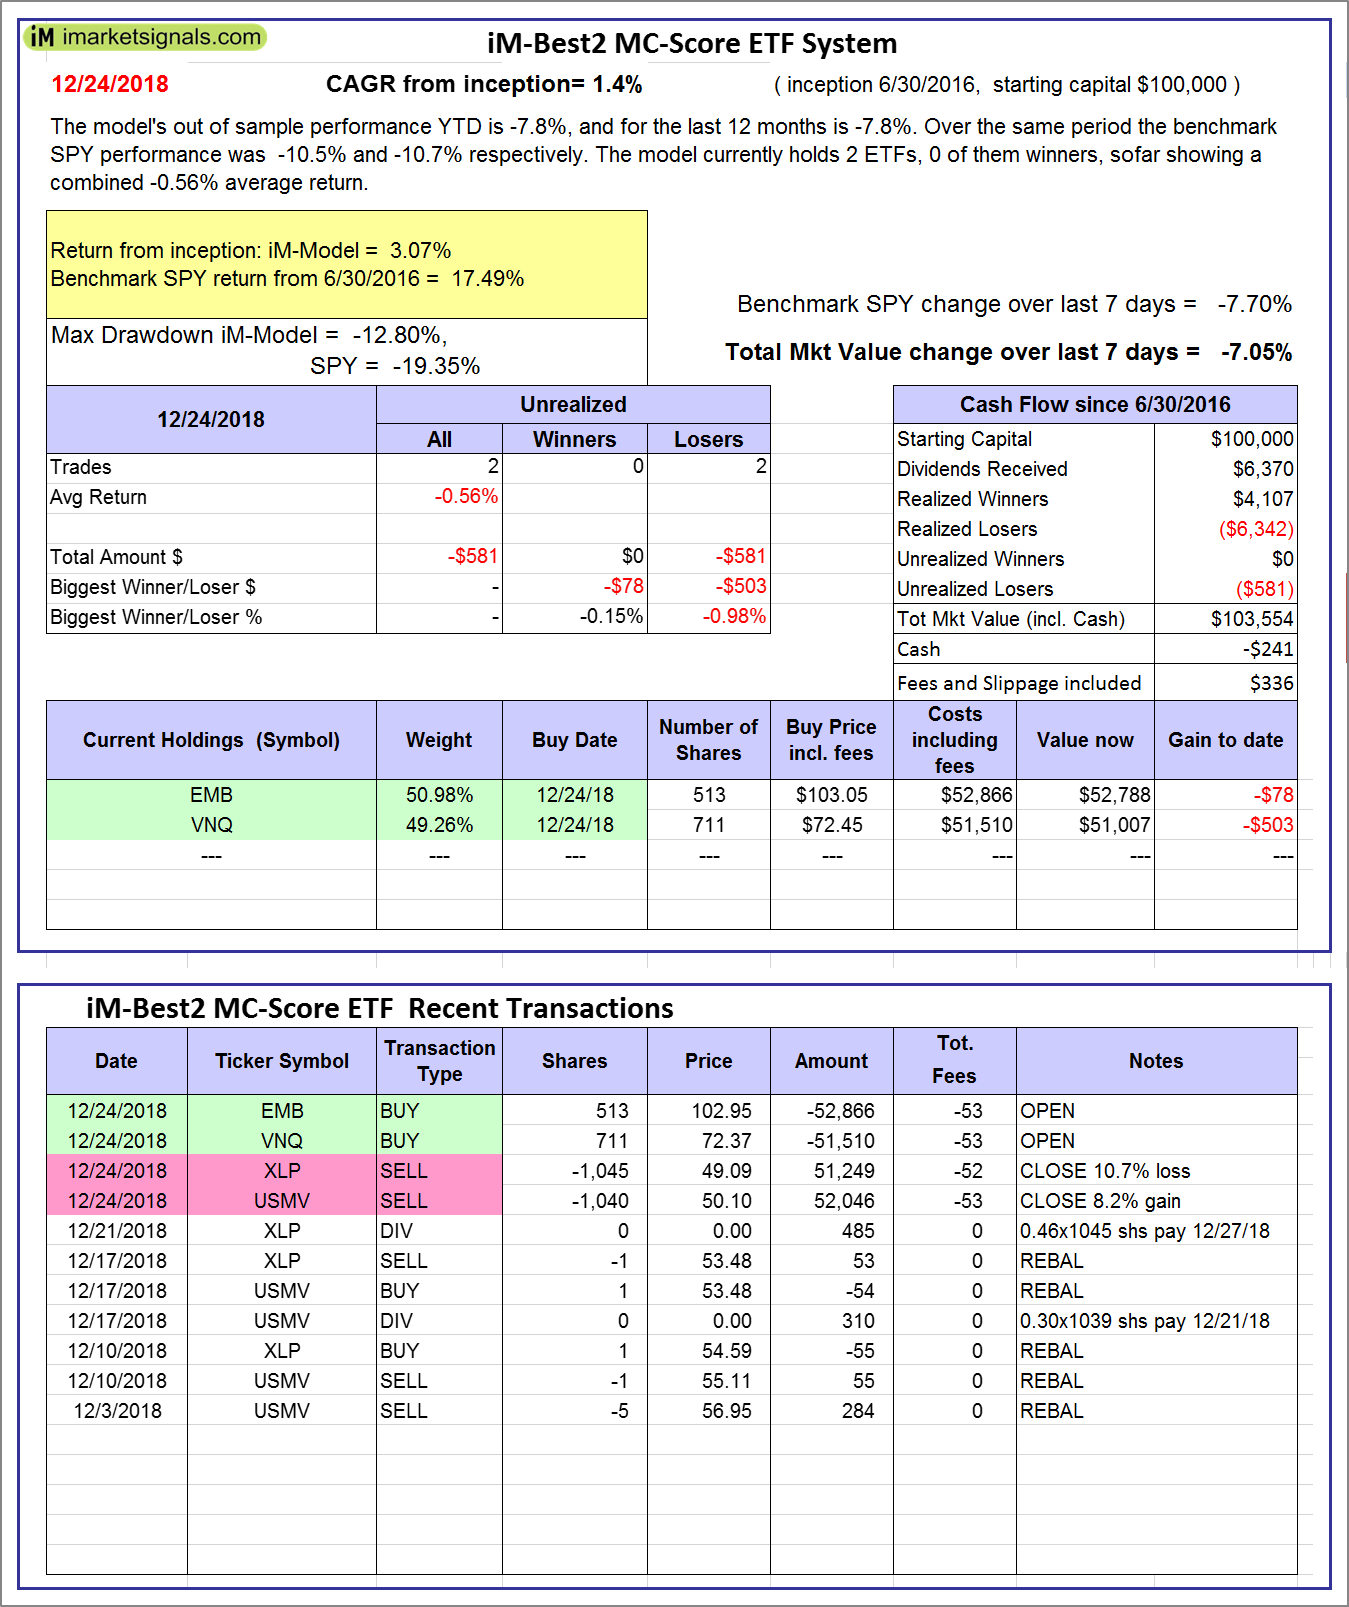 |
iM-Best2 MC-Score ETF System: The model’s out of sample performance YTD is -7.8%, and for the last 12 months is -7.8%. Over the same period the benchmark SPY performance was -10.5% and -10.7% respectively. Over the previous week the market value of the iM-Best2 MC-Score ETF System gained -7.05% at a time when SPY gained -7.70%. A starting capital of $100,000 at inception on 6/30/2016 would have grown to $103,554 which includes -$241 cash and excludes $336 spent on fees and slippage. |
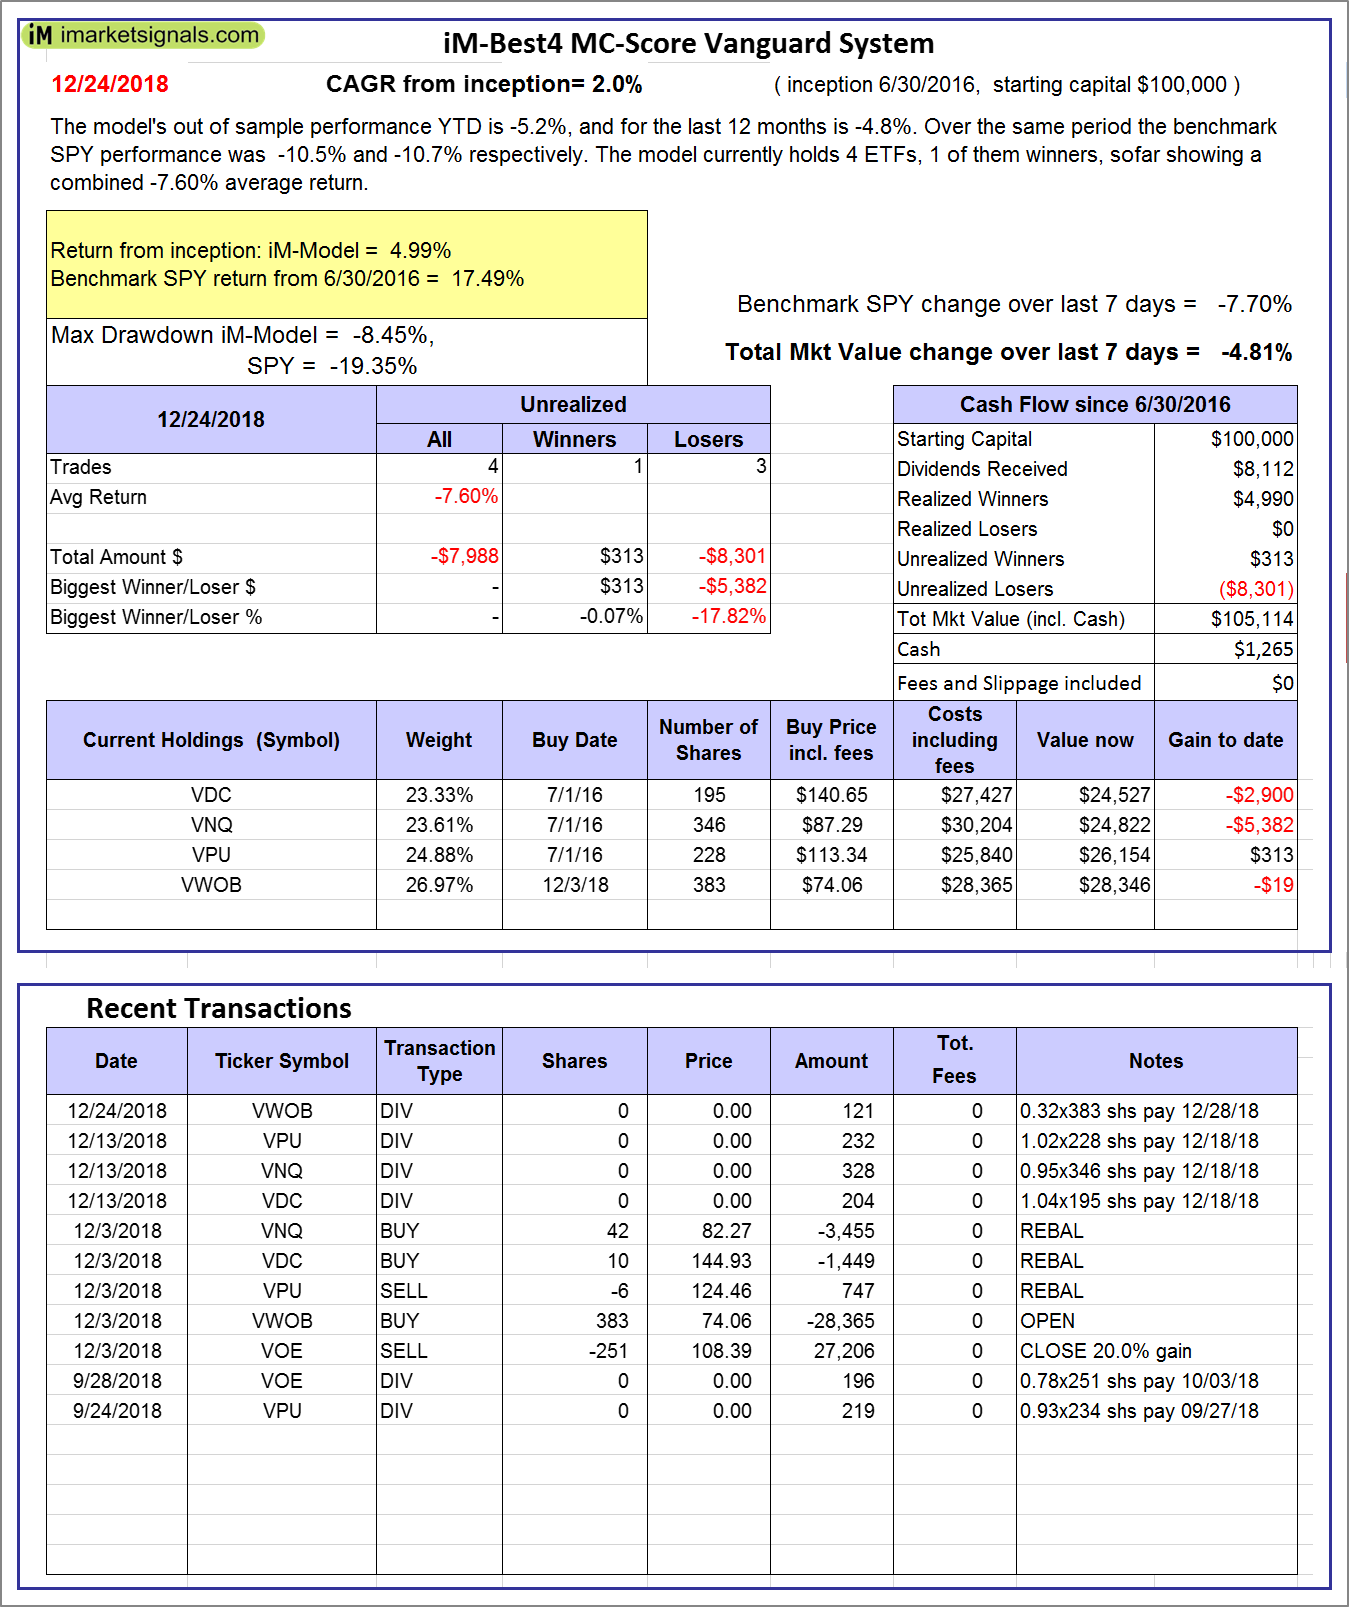 |
iM-Best4 MC-Score Vanguard System: The model’s out of sample performance YTD is -5.2%, and for the last 12 months is -4.8%. Over the same period the benchmark SPY performance was -10.5% and -10.7% respectively. Over the previous week the market value of the iM-Best4 MC-Score Vanguard System gained -4.81% at a time when SPY gained -7.70%. A starting capital of $100,000 at inception on 6/30/2016 would have grown to $105,114 which includes $1,265 cash and excludes $00 spent on fees and slippage. |
 |
iM-Composite (SH-RSP) Timer: The model’s out of sample performance YTD is -13.2%, and for the last 12 months is -13.2%. Over the same period the benchmark SPY performance was -10.5% and -10.7% respectively. Over the previous week the market value of the iM-Composite (SH-RSP) Timer gained -7.73% at a time when SPY gained -7.70%. A starting capital of $100,000 at inception on 6/30/2016 would have grown to $112,868 which includes $3,838 cash and excludes $513 spent on fees and slippage. |
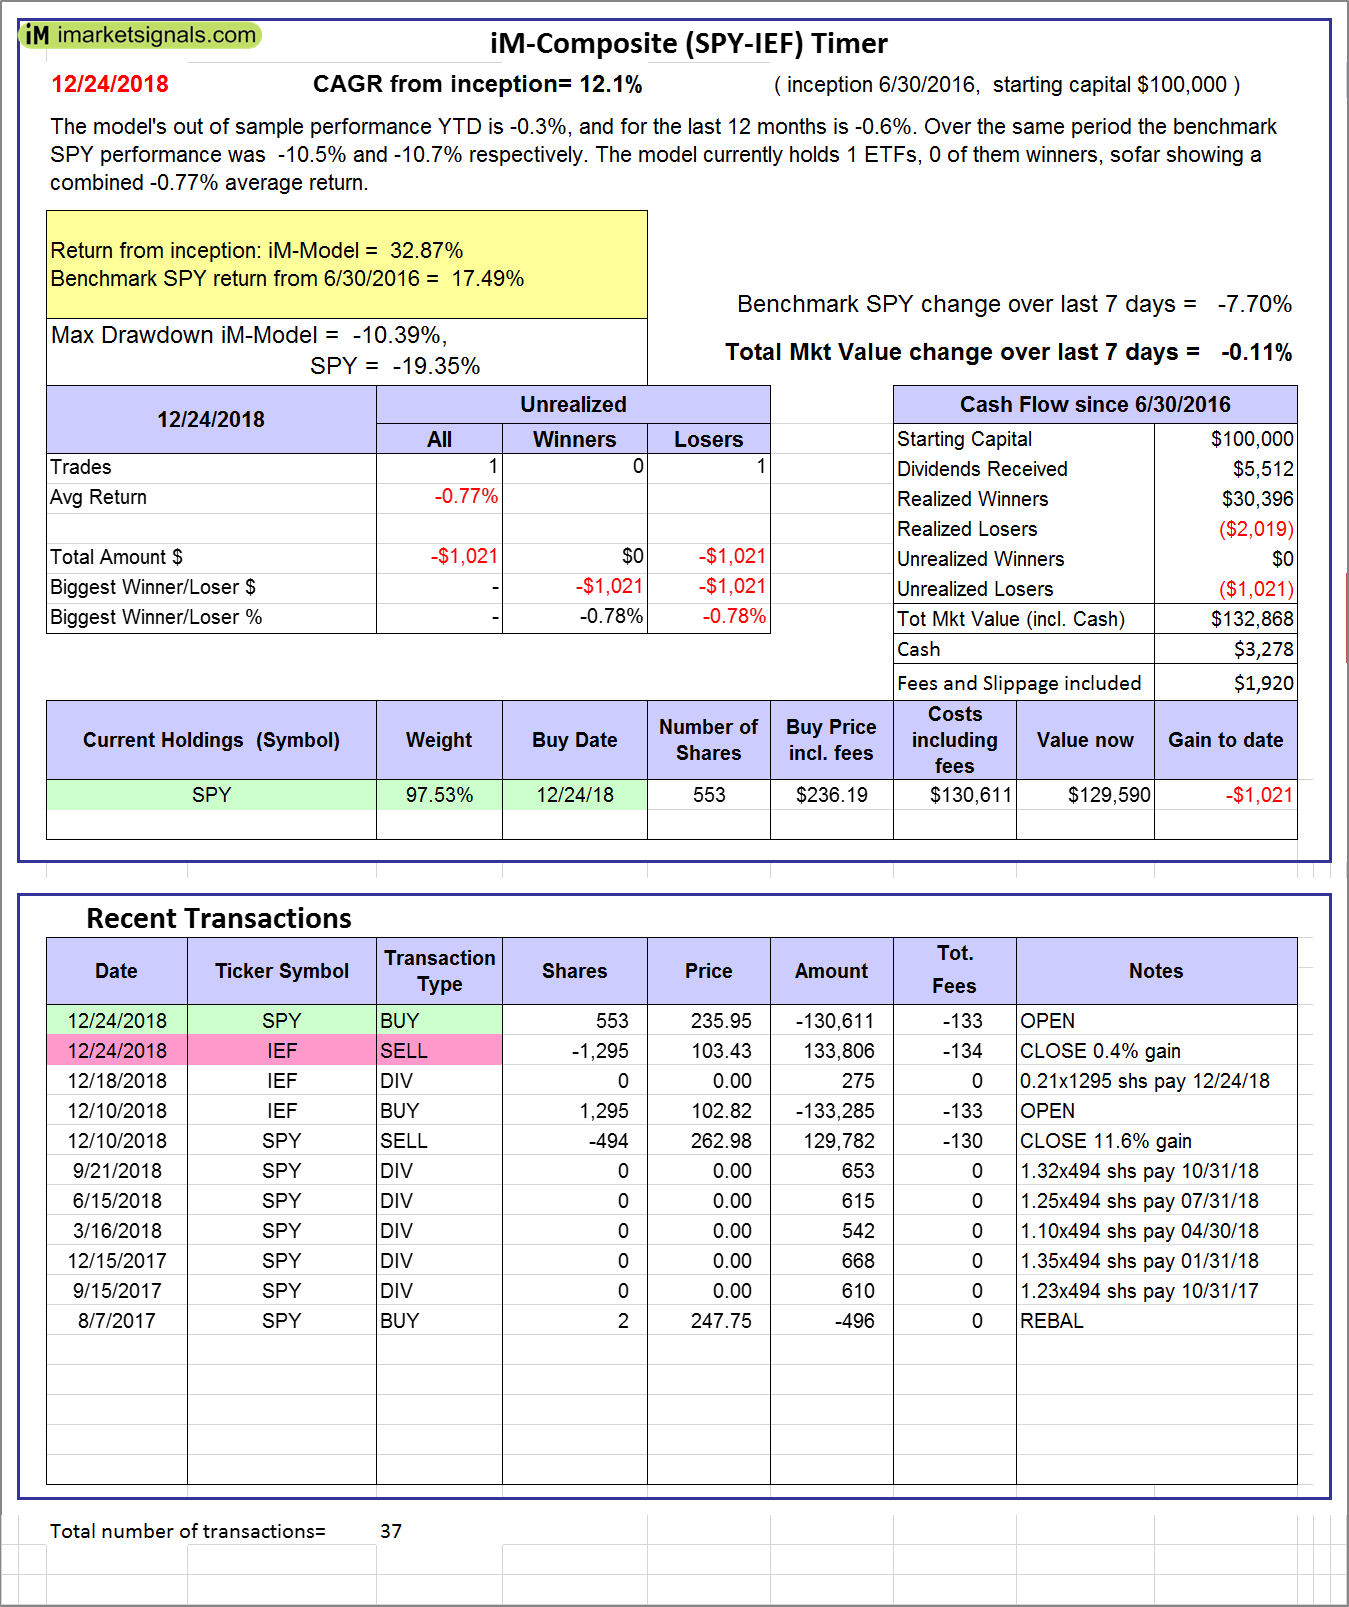 |
iM-Composite (SPY-IEF) Timer: The model’s out of sample performance YTD is -0.3%, and for the last 12 months is -0.6%. Over the same period the benchmark SPY performance was -10.5% and -10.7% respectively. Over the previous week the market value of the iM-Composite (SPY-IEF) Timer gained -0.11% at a time when SPY gained -7.70%. A starting capital of $100,000 at inception on 6/30/2016 would have grown to $132,868 which includes $3,278 cash and excludes $1,920 spent on fees and slippage. |
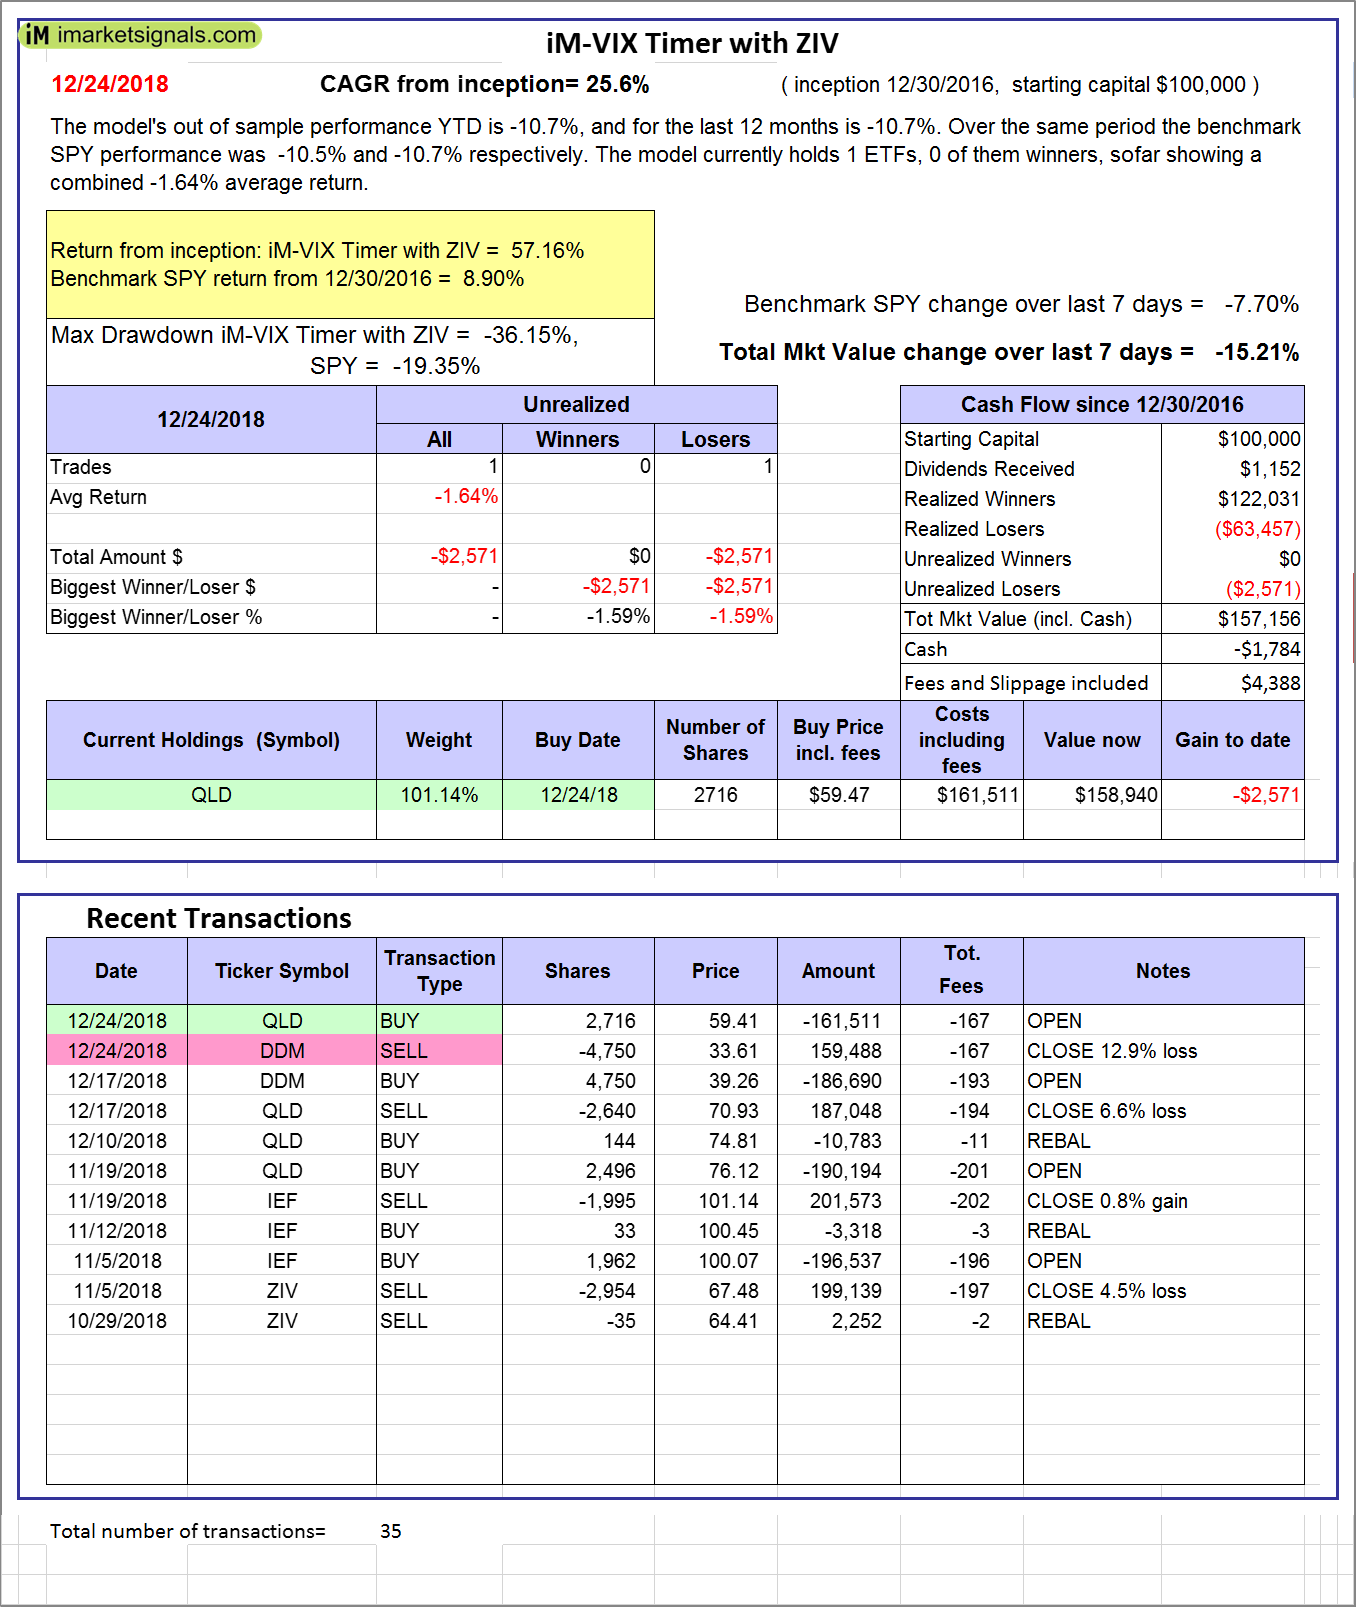 |
iM-VIX Timer with ZIV: The model’s out of sample performance YTD is -10.7%, and for the last 12 months is -10.7%. Over the same period the benchmark SPY performance was -10.5% and -10.7% respectively. Over the previous week the market value of the iM-VIX Timer with ZIV gained -15.21% at a time when SPY gained -7.70%. A starting capital of $100,000 at inception on 6/30/2016 would have grown to $157,156 which includes -$1,784 cash and excludes $4,388 spent on fees and slippage. |
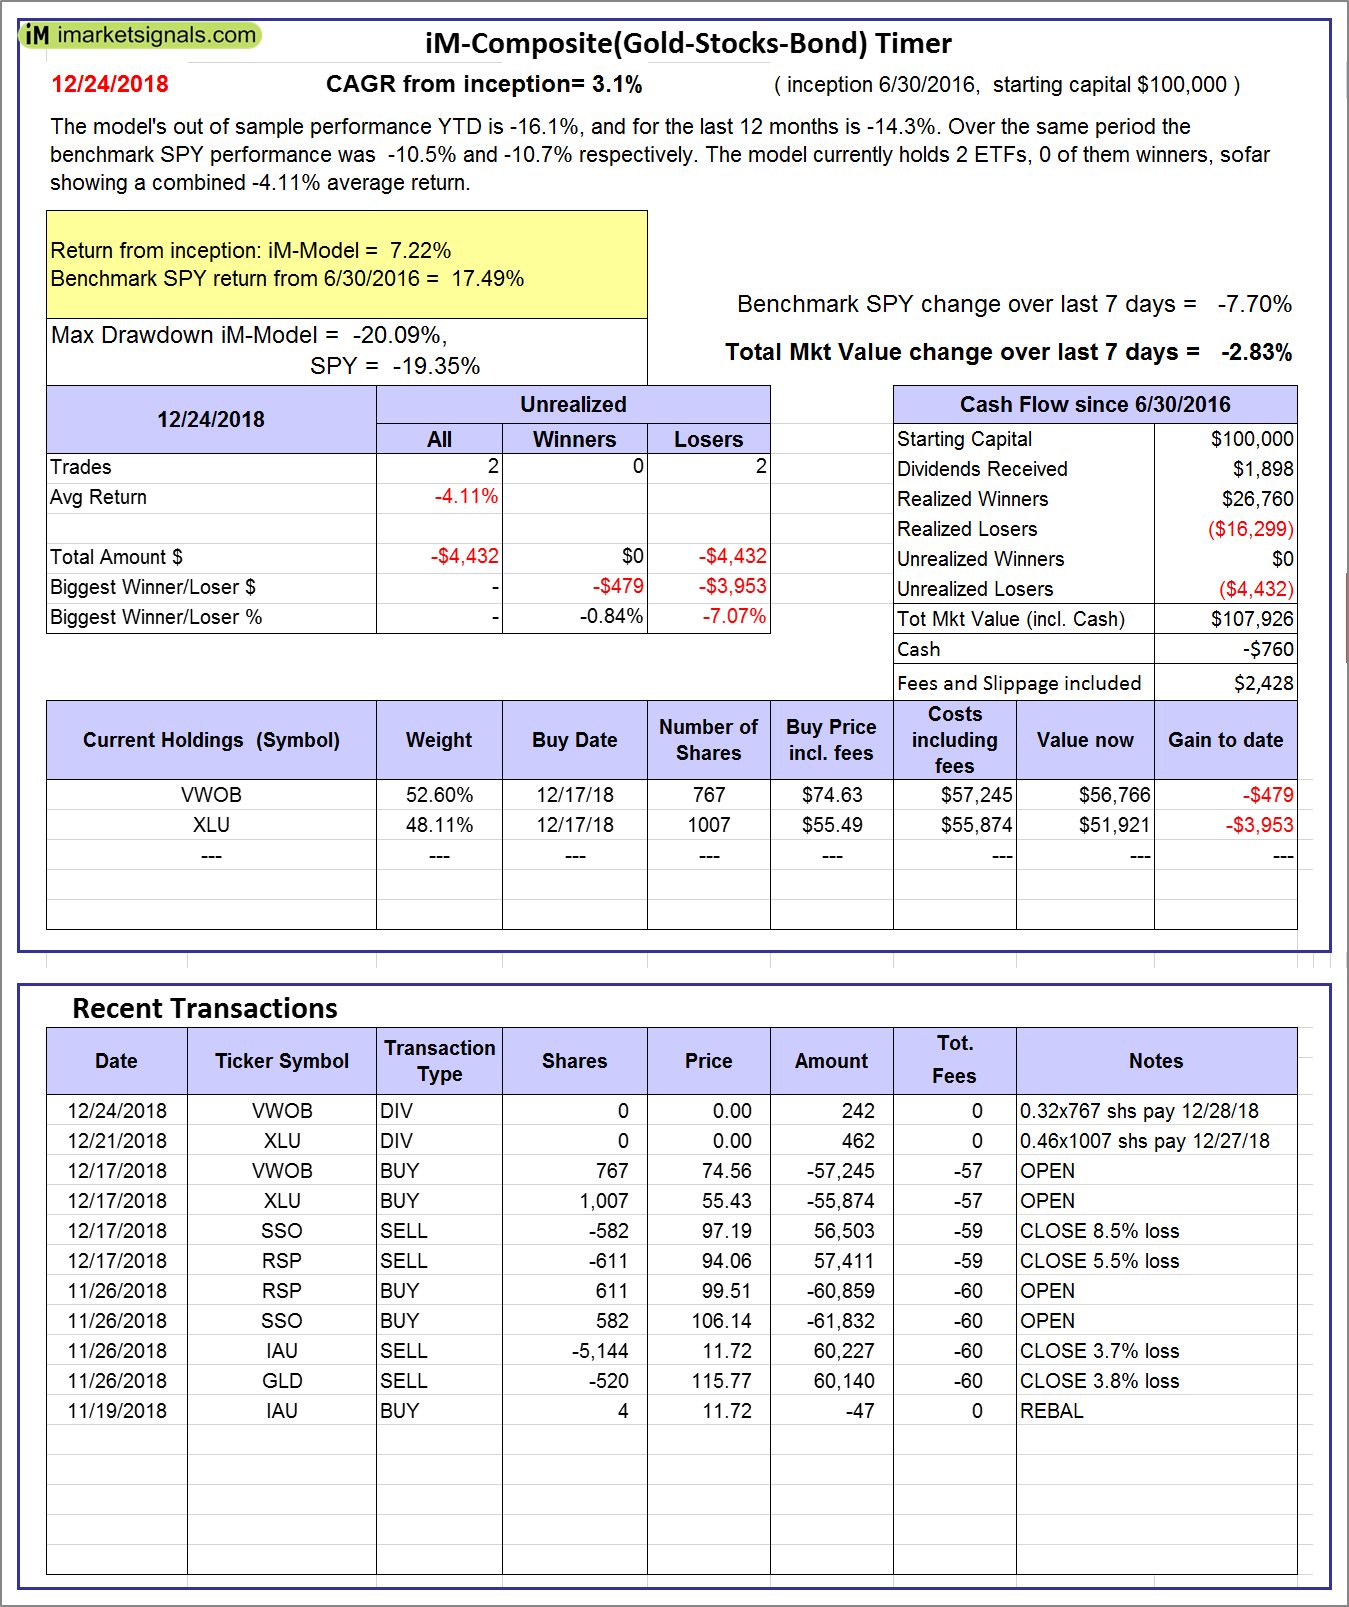 |
iM-Composite(Gold-Stocks-Bond) Timer: The model’s out of sample performance YTD is -16.1%, and for the last 12 months is -14.3%. Over the same period the benchmark SPY performance was -10.5% and -10.7% respectively. Over the previous week the market value of the iM-Composite(Gold-Stocks-Bond) Timer gained -2.83% at a time when SPY gained -7.70%. A starting capital of $100,000 at inception on 6/30/2016 would have grown to $107,926 which includes -$760 cash and excludes $2,428 spent on fees and slippage. |
 |
iM-Low Turnover Composite Timer Combo: The model’s out of sample performance YTD is -13.5%, and for the last 12 months is -12.7%. Over the same period the benchmark SPY performance was -10.5% and -10.7% respectively. Over the previous week the market value of the iM-Low Turnover Composite Timer Combo gained -4.83% at a time when SPY gained -7.70%. A starting capital of $100,000 at inception on 3/24/27 would have grown to $92,641 which includes -$391 cash and excludes $280 spent on fees and slippage. |
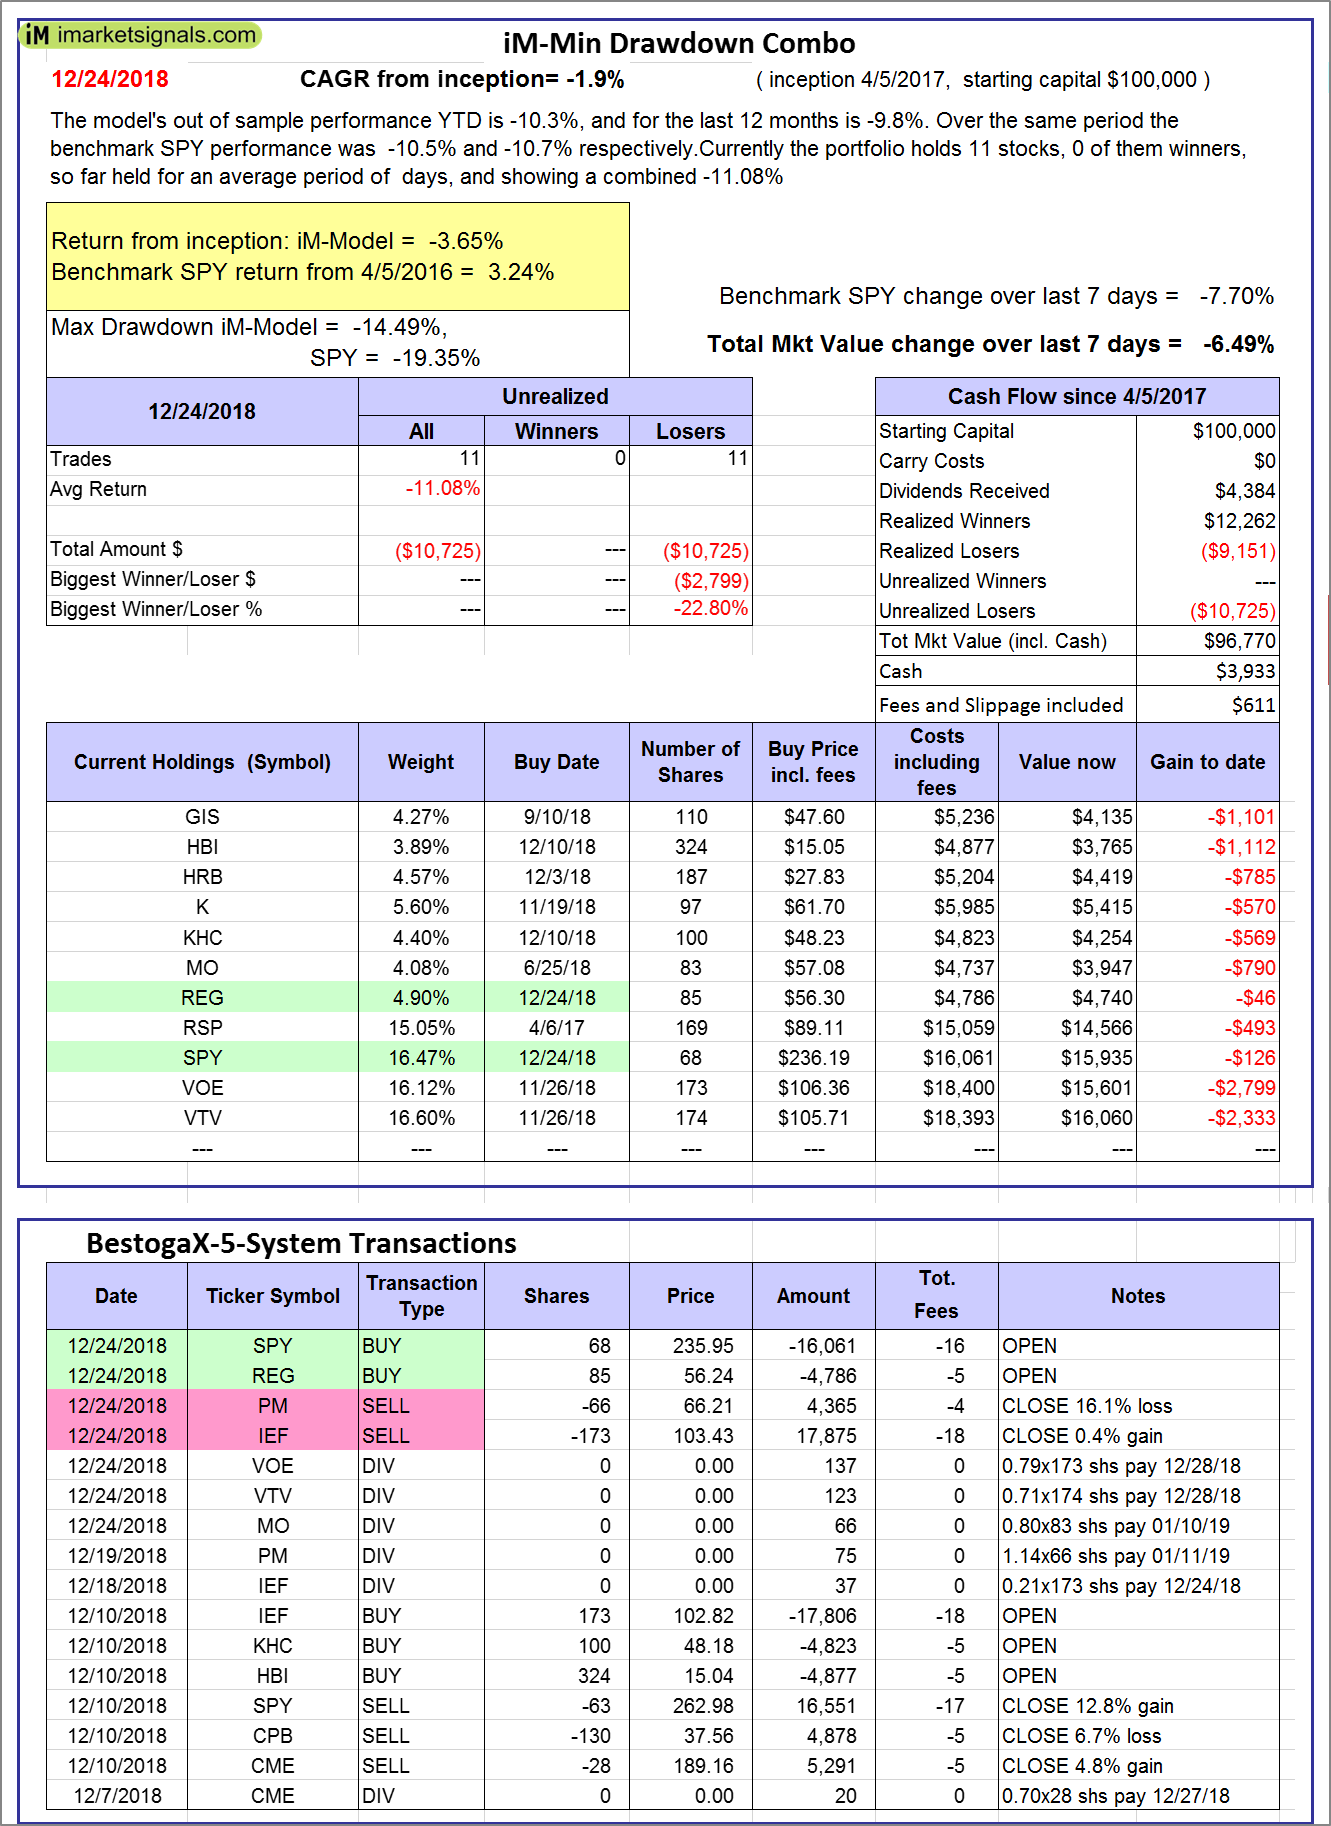 |
iM-Min Drawdown Combo: The model’s out of sample performance YTD is -10.3%, and for the last 12 months is -9.8%. Over the same period the benchmark SPY performance was -10.5% and -10.7% respectively. Over the previous week the market value of the iM-Min Drawdown Combo gained -6.49% at a time when SPY gained -7.70%. A starting capital of $100,000 at inception on 4/5/2017 would have grown to $96,770 which includes $3,933 cash and excludes $611 spent on fees and slippage. |
 |
iM-5ETF Trader (includes leveraged ETFs): The model’s out of sample performance YTD is -22.1%, and for the last 12 months is -22.7%. Over the same period the benchmark SPY performance was -10.5% and -10.7% respectively. Over the previous week the market value of the iM-5ETF Trader (includes leveraged ETFs) gained -11.89% at a time when SPY gained -7.70%. A starting capital of $100,000 at inception on 10/30/2016 would have grown to $126,797 which includes $163 cash and excludes $1,218 spent on fees and slippage. |
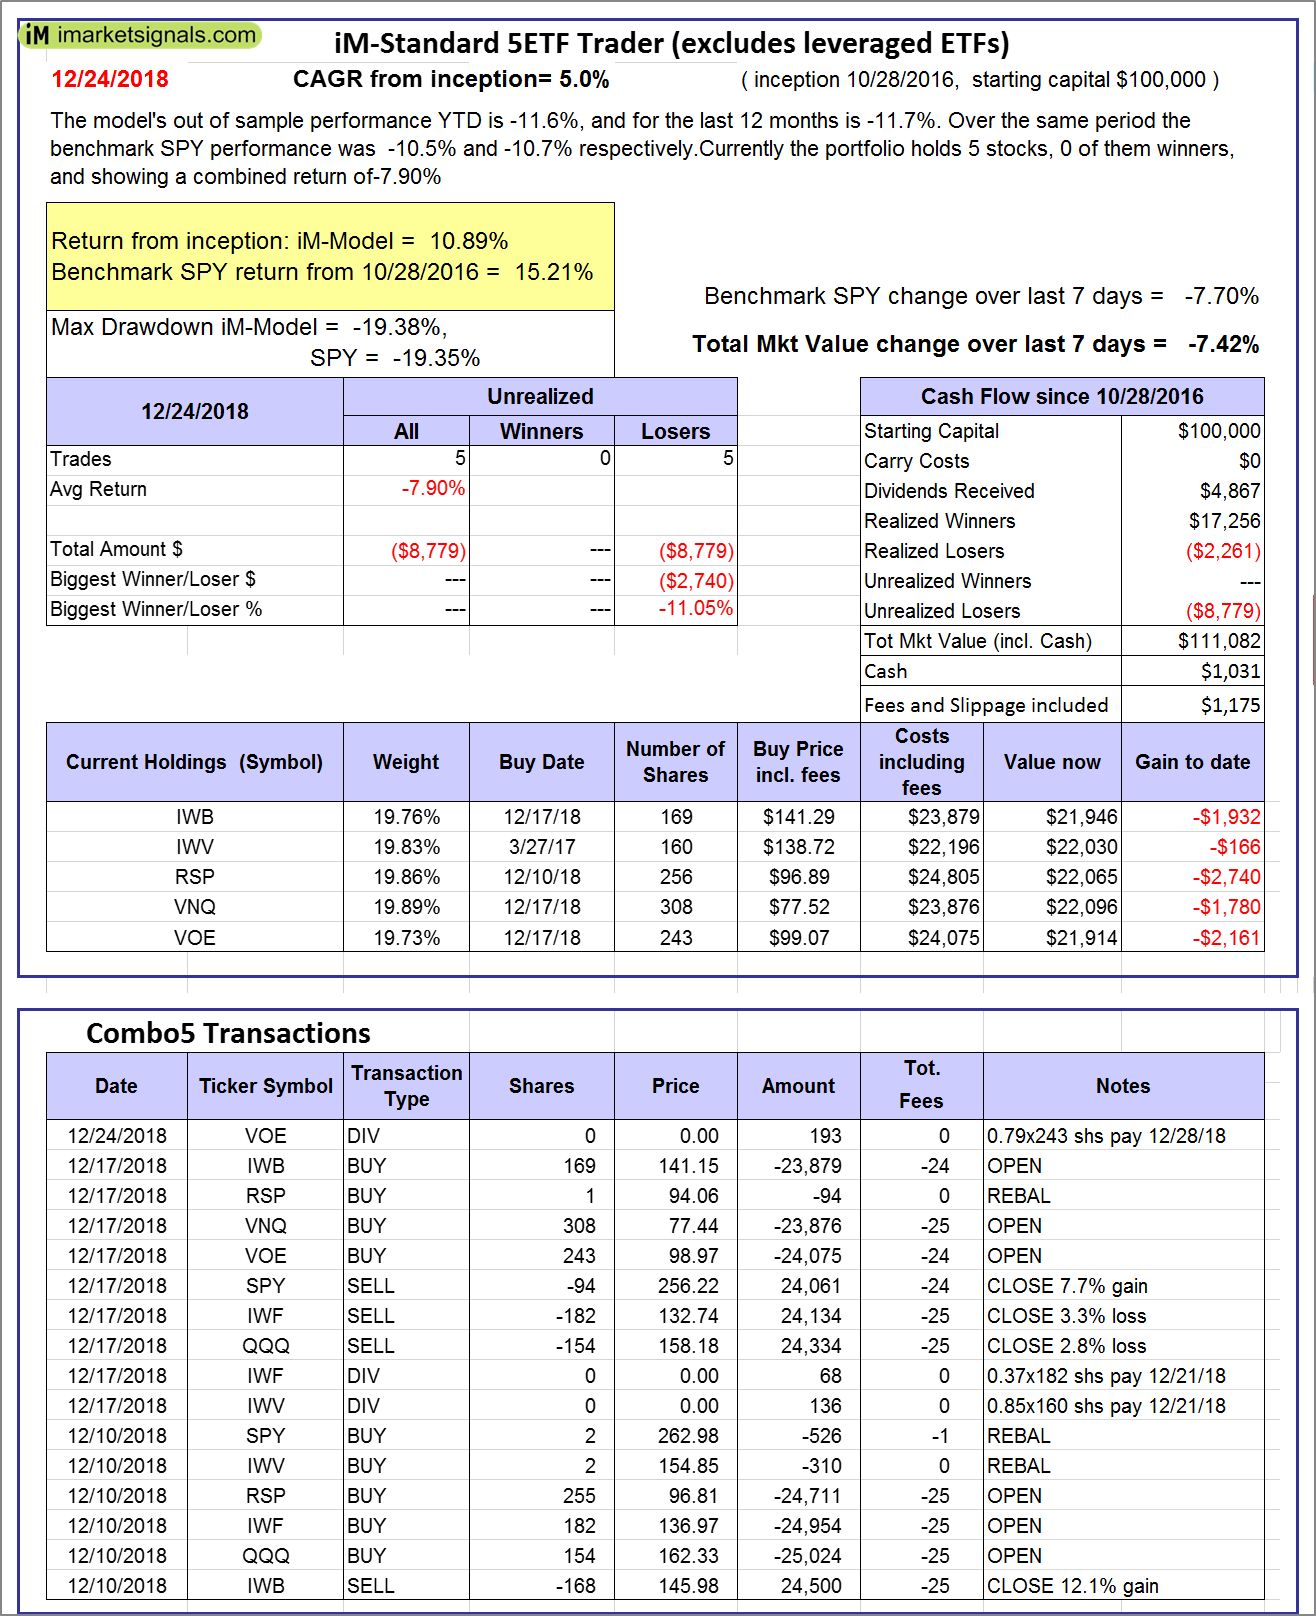 |
iM-Standard 5ETF Trader (excludes leveraged ETFs): The model’s out of sample performance YTD is -11.6%, and for the last 12 months is -11.7%. Over the same period the benchmark SPY performance was -10.5% and -10.7% respectively. Over the previous week the market value of the iM-Standard 5ETF Trader (excludes leveraged ETFs) gained -7.42% at a time when SPY gained -7.70%. A starting capital of $100,000 at inception on 10/30/2016 would have grown to $111,082 which includes $1,031 cash and excludes $1,175 spent on fees and slippage. |
iM-Best Reports – 12/24/2018
Posted in pmp SPY-SH
Leave a Reply
You must be logged in to post a comment.