
  |
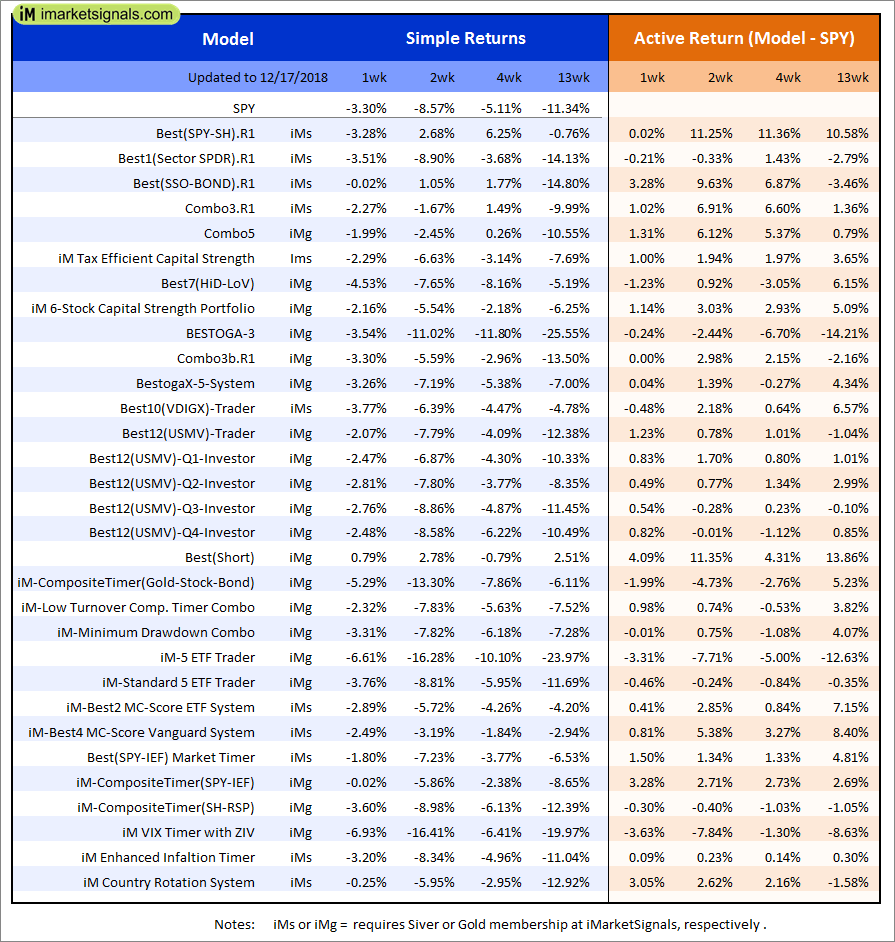
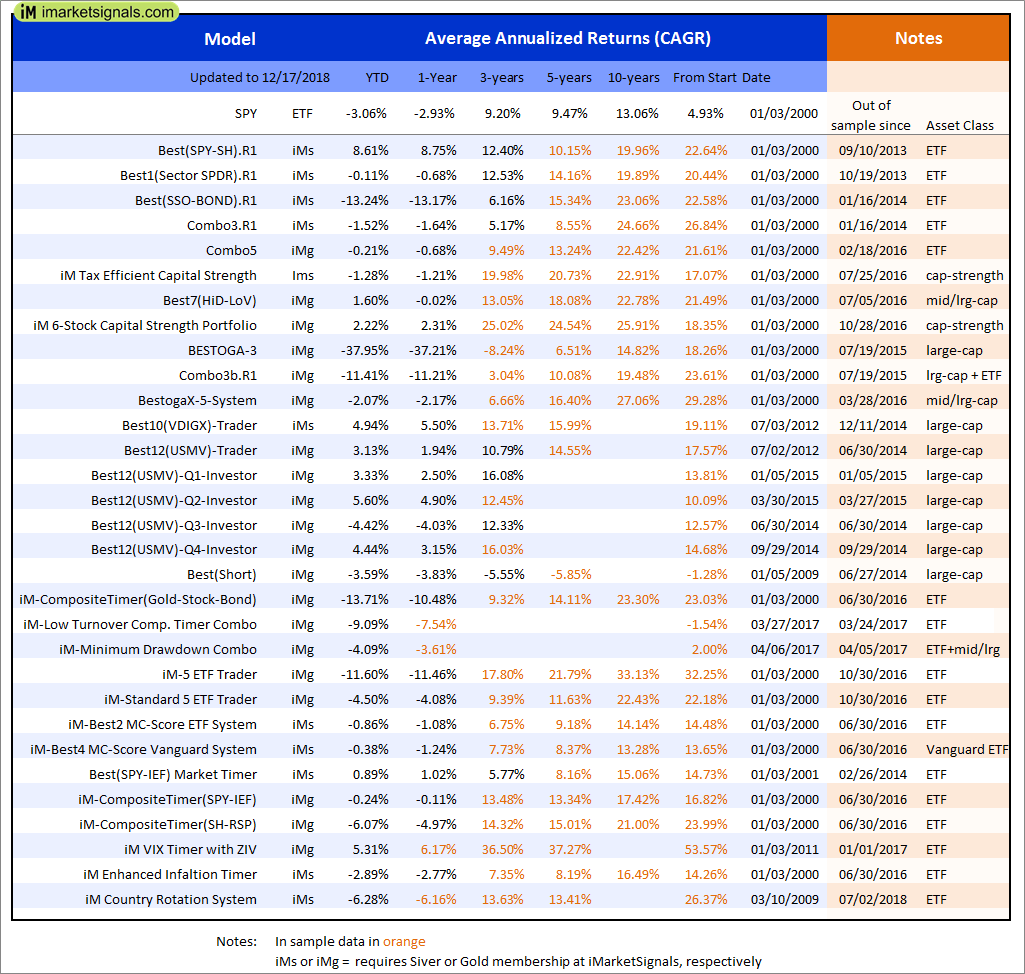
Out of sample performance summary of our models for the past 1, 2, 4 and 13 week periods. The active active return indicates how the models over- or underperformed the benchmark ETF SPY. Also the YTD, and the 1-, 3-, 5- and 10-year annualized returns are shown in the second table |
 |
iM-Best(SPY-SH).R1: The model’s out of sample performance YTD is 8.1%, and for the last 12 months is 8.2%. Over the same period the benchmark SPY performance was -3.1% and -2.9% respectively. Over the previous week the market value of Best(SPY-SH) gained -3.28% at a time when SPY gained -3.30%. A starting capital of $100,000 at inception on 1/2/2009 would have grown to $610,717 which includes $2,961 cash and excludes $20,120 spent on fees and slippage. |
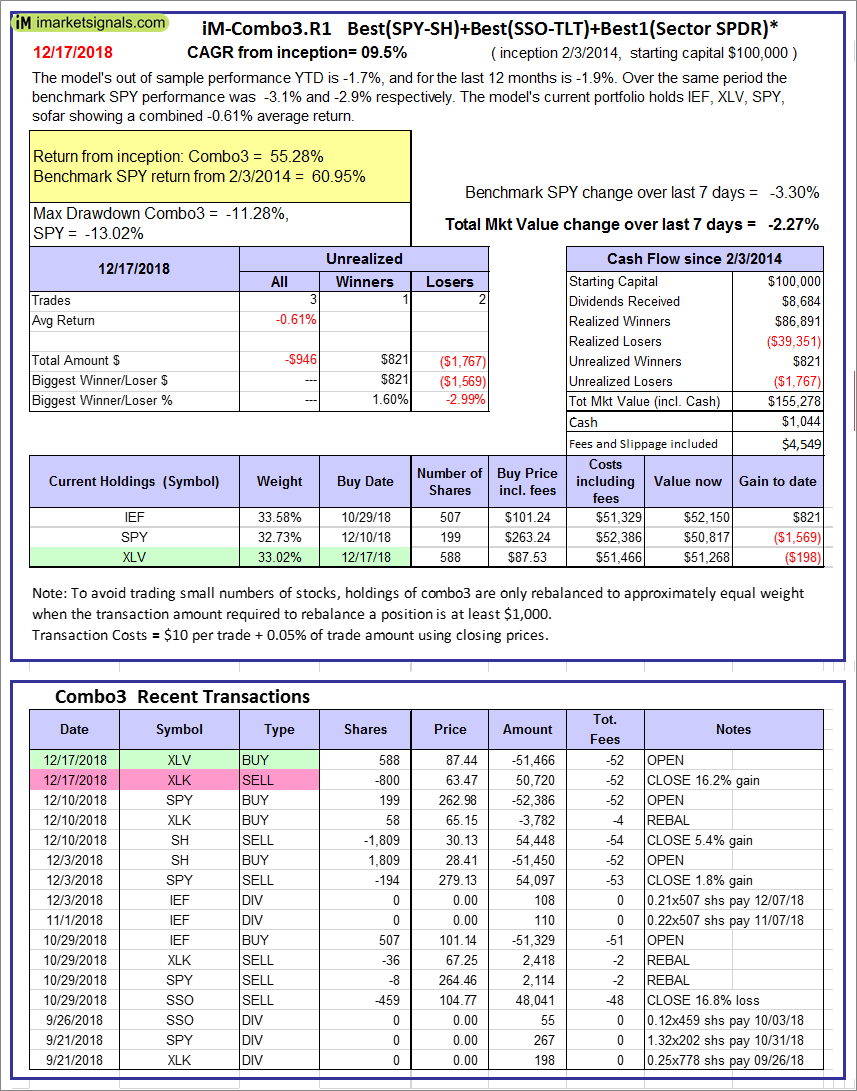 |
iM-Combo3.R1: The model’s out of sample performance YTD is -1.7%, and for the last 12 months is -1.9%. Over the same period the benchmark SPY performance was -3.1% and -2.9% respectively. Over the previous week the market value of iM-Combo3.R1 gained -2.27% at a time when SPY gained -3.30%. A starting capital of $100,000 at inception on 2/3/2014 would have grown to $155,278 which includes $1,044 cash and excludes $4,549 spent on fees and slippage. |
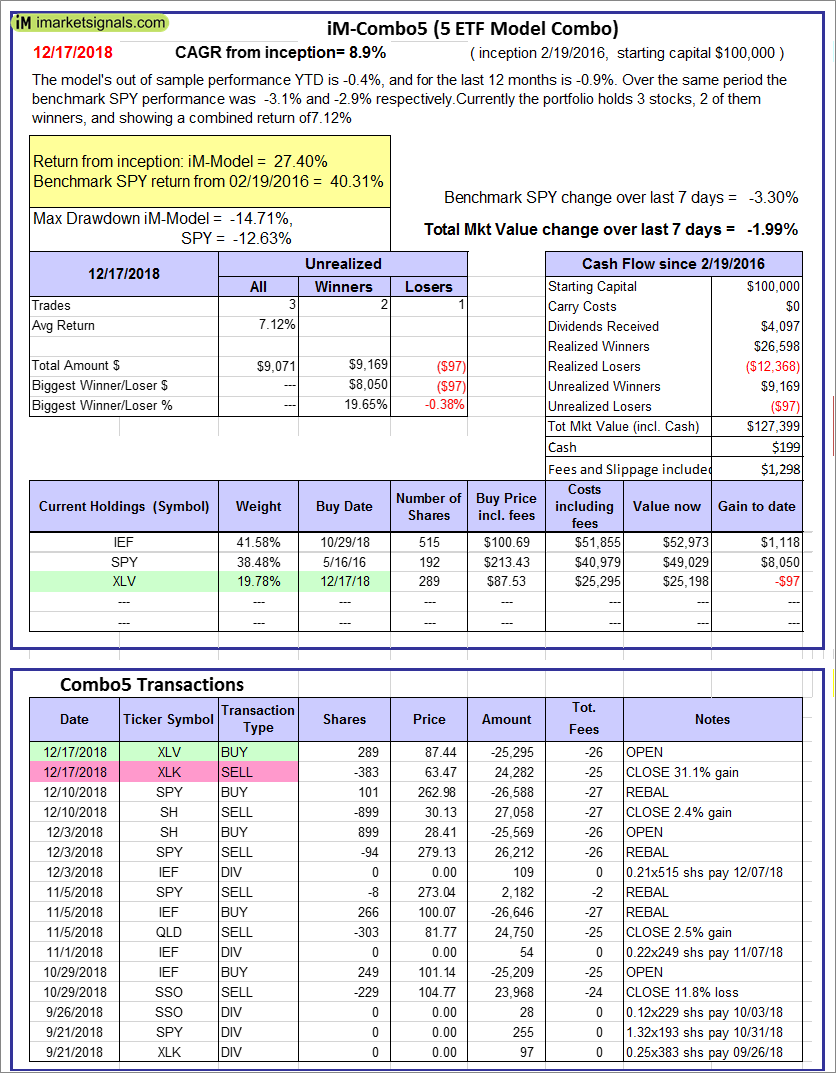 |
iM-Combo5: The model’s out of sample performance YTD is -0.4%, and for the last 12 months is -0.9%. Over the same period the benchmark SPY performance was -3.1% and -2.9% respectively. Over the previous week the market value of iM-Combo5 gained -1.99% at a time when SPY gained -3.30%. A starting capital of $100,000 at inception on 2/22/2016 would have grown to $127,399 which includes $199 cash and excludes $1,298 spent on fees and slippage. |
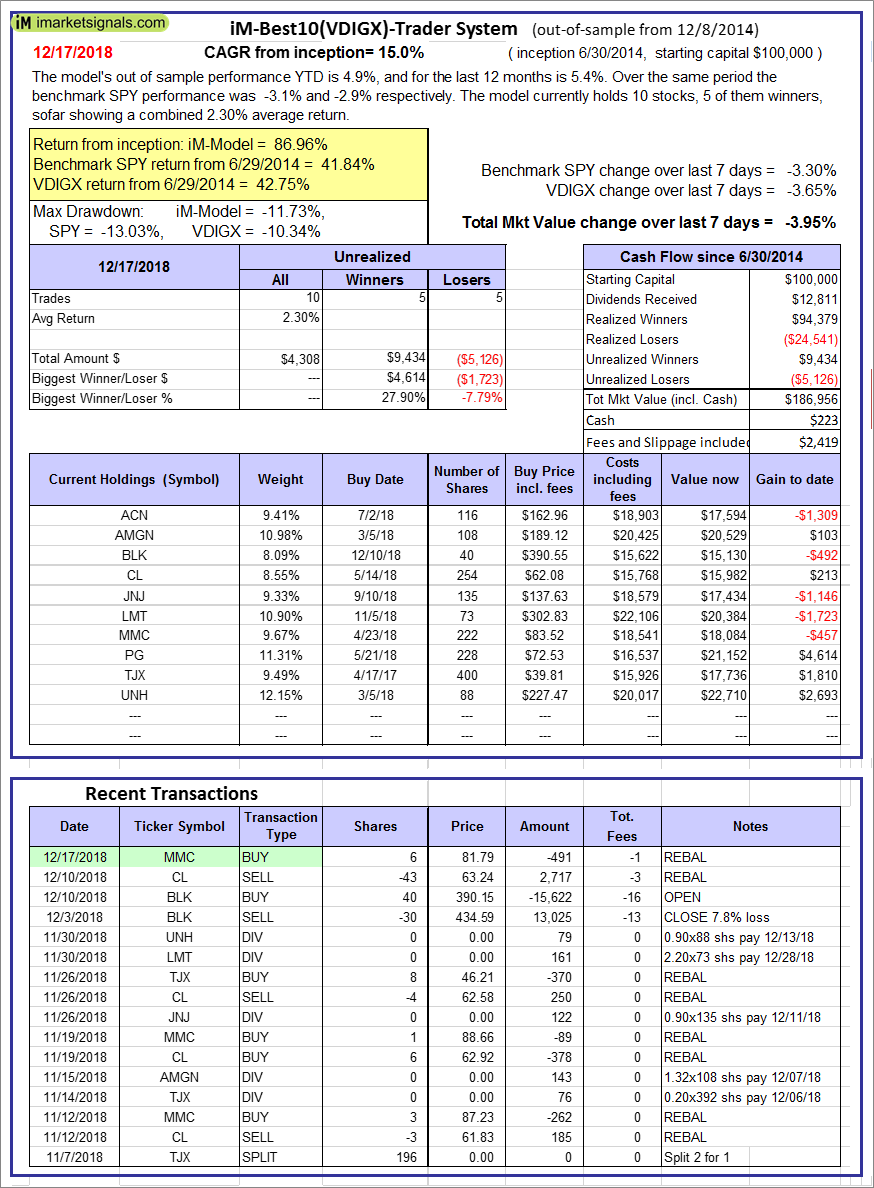 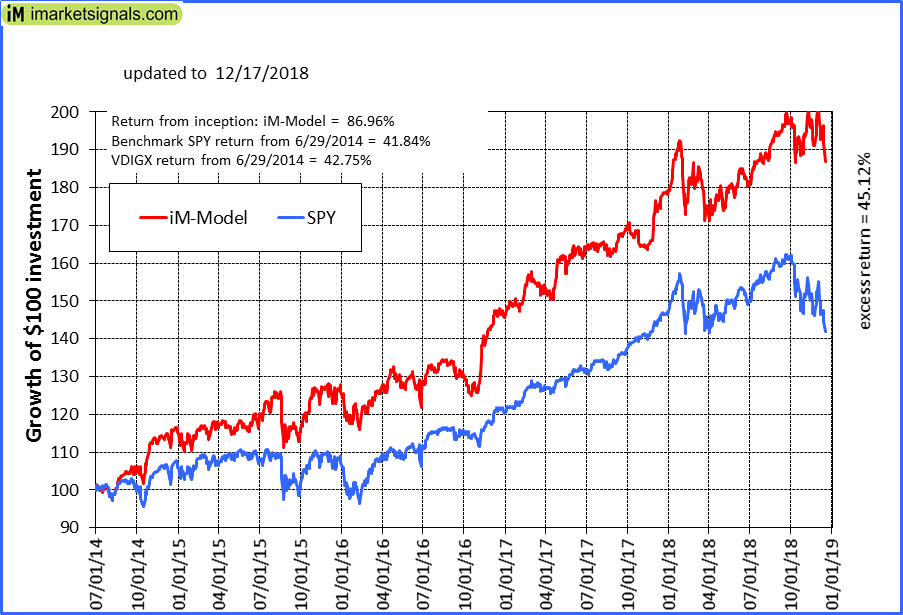 |
iM-Best10(VDIGX)-Trader: The model’s out of sample performance YTD is 4.9%, and for the last 12 months is 5.4%. Over the same period the benchmark SPY performance was -3.1% and -2.9% respectively. Since inception, on 7/1/2014, the model gained 86.96% while the benchmark SPY gained 41.84% and VDIGX gained 42.75% over the same period. Over the previous week the market value of iM-Best10(VDIGX) gained -3.95% at a time when SPY gained -3.30%. A starting capital of $100,000 at inception on 7/1/2014 would have grown to $186,956 which includes $223 cash and excludes $2,419 spent on fees and slippage. |
 |
iM-BESTOGA-3: The model’s out of sample performance YTD is -38.2%, and for the last 12 months is -37.2%. Over the same period the benchmark SPY performance was -3.1% and -2.9% respectively. Over the previous week the market value of iM-BESTOGA-3 gained -3.75% at a time when SPY gained -3.30%. A starting capital of $100,000 at inception on 2/3/2014 would have grown to $143,345 which includes -$4,869 cash and excludes $3,459 spent on fees and slippage. |
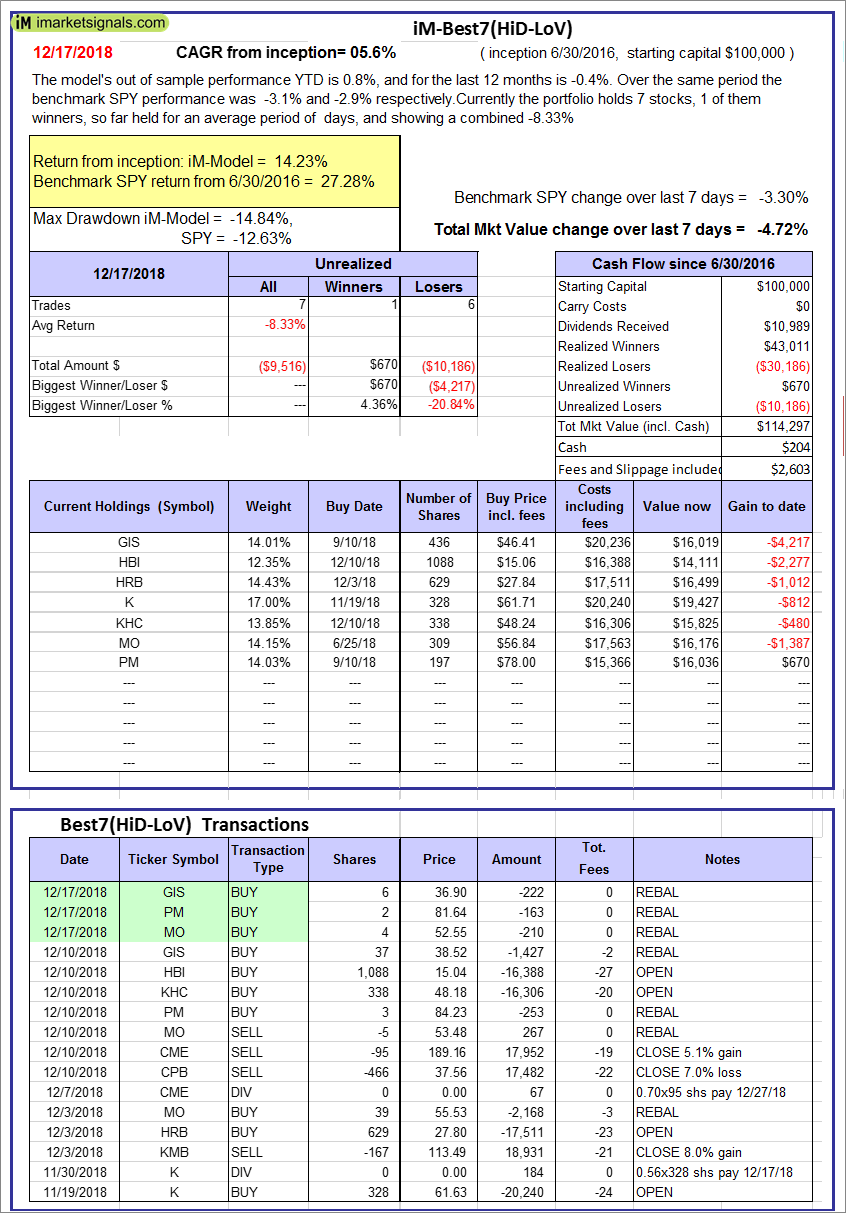 |
iM-Best7(HiD-LoV): The model’s out of sample performance YTD is 0.8%, and for the last 12 months is -0.4%. Over the same period the benchmark SPY performance was -3.1% and -2.9% respectively. Over the previous week the market value of iM-BESTOGA-3 gained -4.72% at a time when SPY gained -3.30%. A starting capital of $100,000 at inception on 6/30/2016 would have grown to $114,297 which includes $204 cash and excludes $2,603 spent on fees and slippage. |
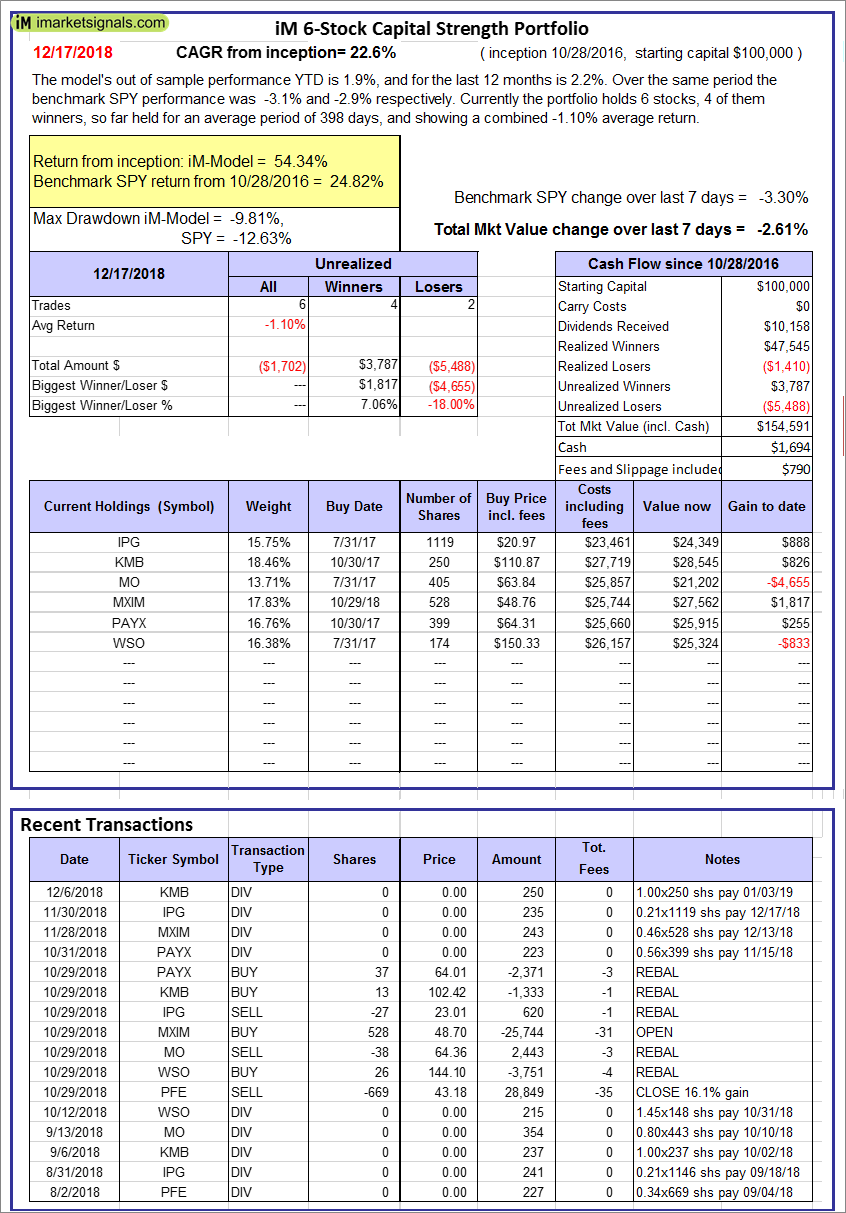 |
iM 6-Stock Capital Strength Portfolio: The model’s out of sample performance YTD is 1.9%, and for the last 12 months is 2.2%. Over the same period the benchmark SPY performance was -3.1% and -2.9% respectively. Over the previous week the market value of the iM 6-Stock Capital Strength Portfolio gained -2.61% at a time when SPY gained -3.30%. A starting capital of $100,000 at inception on 10/28/2016 would have grown to $154,591 which includes $1,694 cash and excludes $790 spent on fees and slippage. |
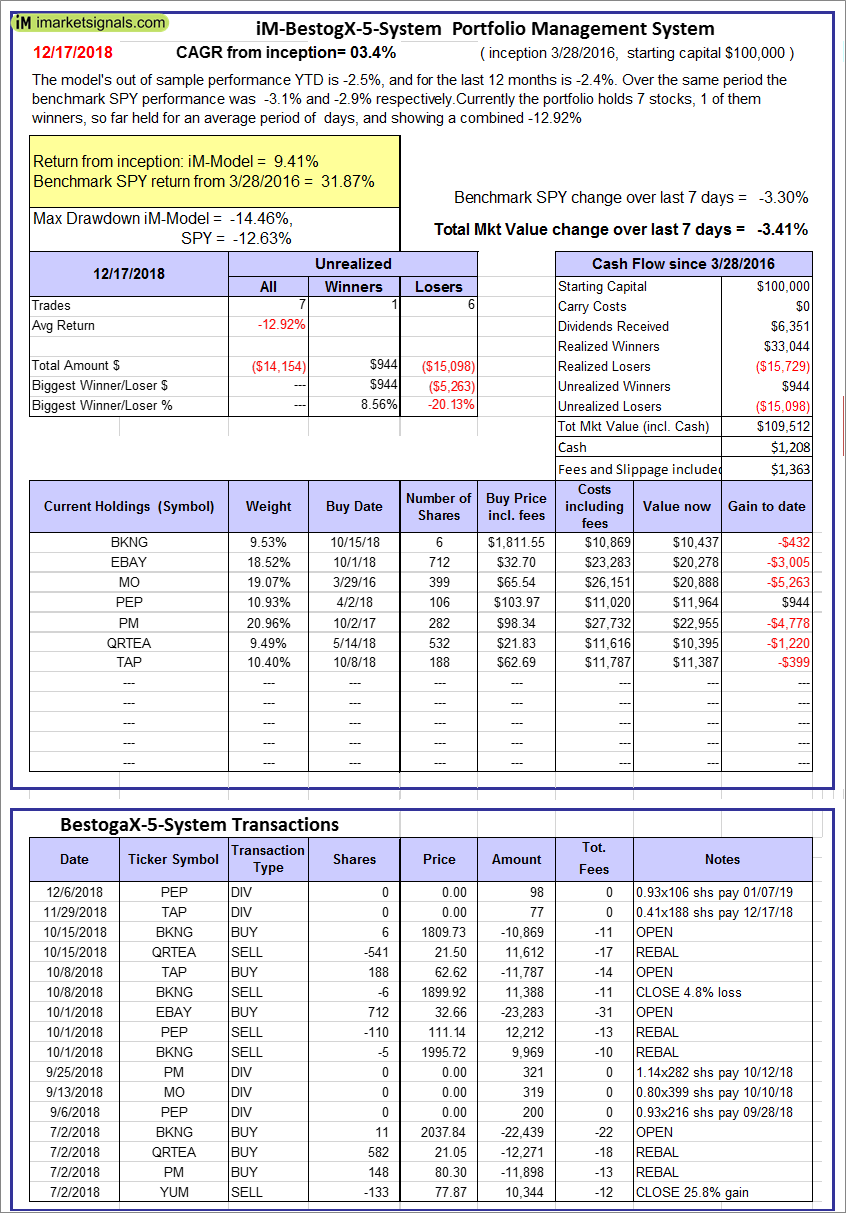 |
iM-BestogaX5-System: The model’s out of sample performance YTD is -2.5%, and for the last 12 months is -2.4%. Over the same period the benchmark SPY performance was -3.1% and -2.9% respectively. Over the previous week the market value of iM-BestogaX5-System gained -3.41% at a time when SPY gained -3.30%. A starting capital of $100,000 at inception on 3/28/2016 would have grown to $109,512 which includes $1,208 cash and excludes $1,363 spent on fees and slippage. |
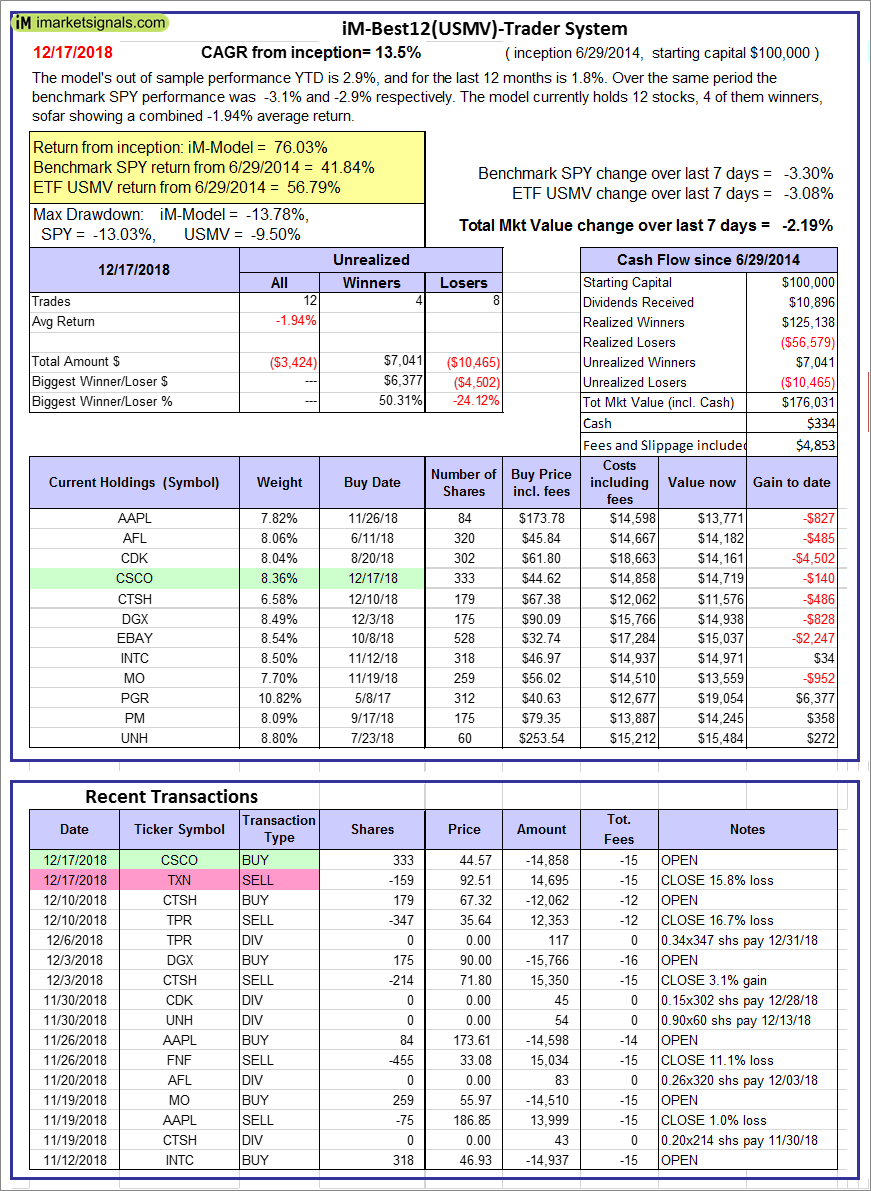  |
iM-Best12(USMV)-Trader: The model’s out of sample performance YTD is 2.9%, and for the last 12 months is 1.8%. Over the same period the benchmark SPY performance was -3.1% and -2.9% respectively. Since inception, on 6/30/2014, the model gained 76.03% while the benchmark SPY gained 41.84% and the ETF USMV gained 56.79% over the same period. Over the previous week the market value of iM-Best12(USMV)-Trader gained -2.19% at a time when SPY gained -3.30%. A starting capital of $100,000 at inception on 6/30/2014 would have grown to $176,031 which includes $334 cash and excludes $4,853 spent on fees and slippage. |
  |
iM-Best12(USMV)Q1-Investor: The model’s out of sample performance YTD is 3.2%, and for the last 12 months is 2.3%. Over the same period the benchmark SPY performance was -3.1% and -2.9% respectively. Since inception, on 1/5/2015, the model gained 66.54% while the benchmark SPY gained 36.31% and the ETF USMV gained 43.99% over the same period. Over the previous week the market value of iM-Best12(USMV)Q1 gained -2.47% at a time when SPY gained -3.30%. A starting capital of $100,000 at inception on 1/5/2015 would have grown to $166,540 which includes $1,796 cash and excludes $1,370 spent on fees and slippage. |
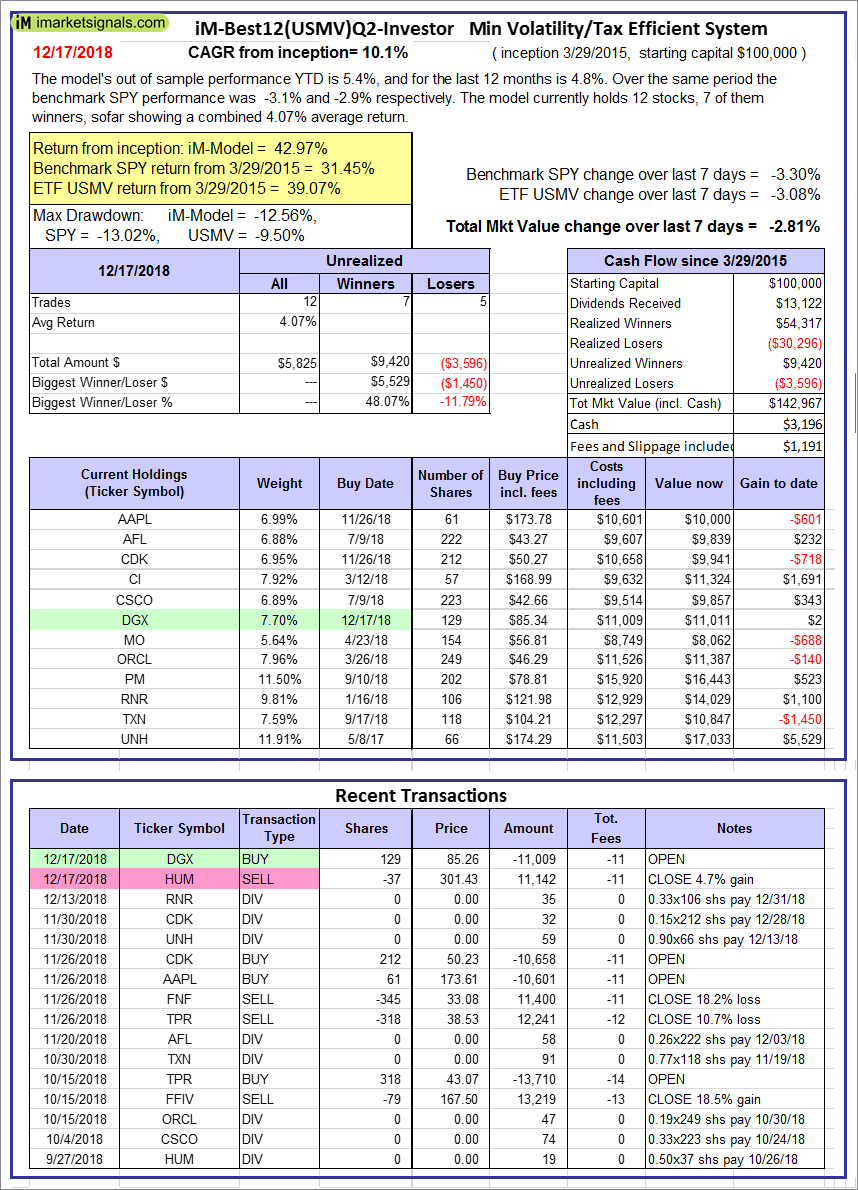 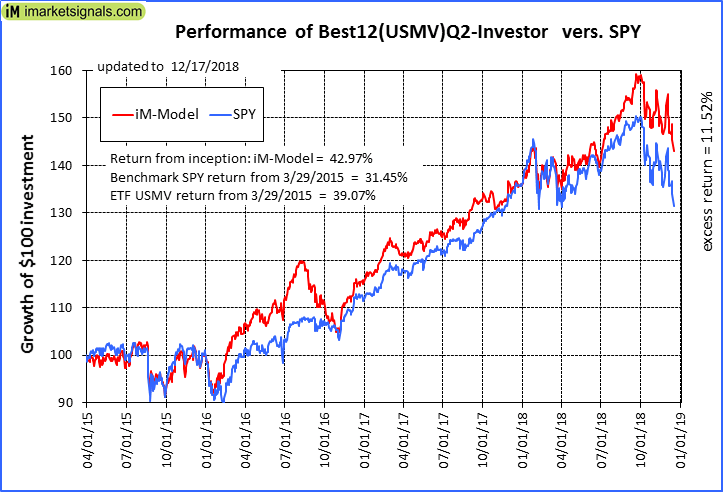 |
iM-Best12(USMV)Q2-Investor: The model’s out of sample performance YTD is 5.4%, and for the last 12 months is 4.8%. Over the same period the benchmark SPY performance was -3.1% and -2.9% respectively. Since inception, on 3/30/2015, the model gained 42.97% while the benchmark SPY gained 31.45% and the ETF USMV gained 39.07% over the same period. Over the previous week the market value of iM-Best12(USMV)Q2 gained -2.81% at a time when SPY gained -3.30%. A starting capital of $100,000 at inception on 3/30/2015 would have grown to $142,967 which includes $3,196 cash and excludes $1,191 spent on fees and slippage. |
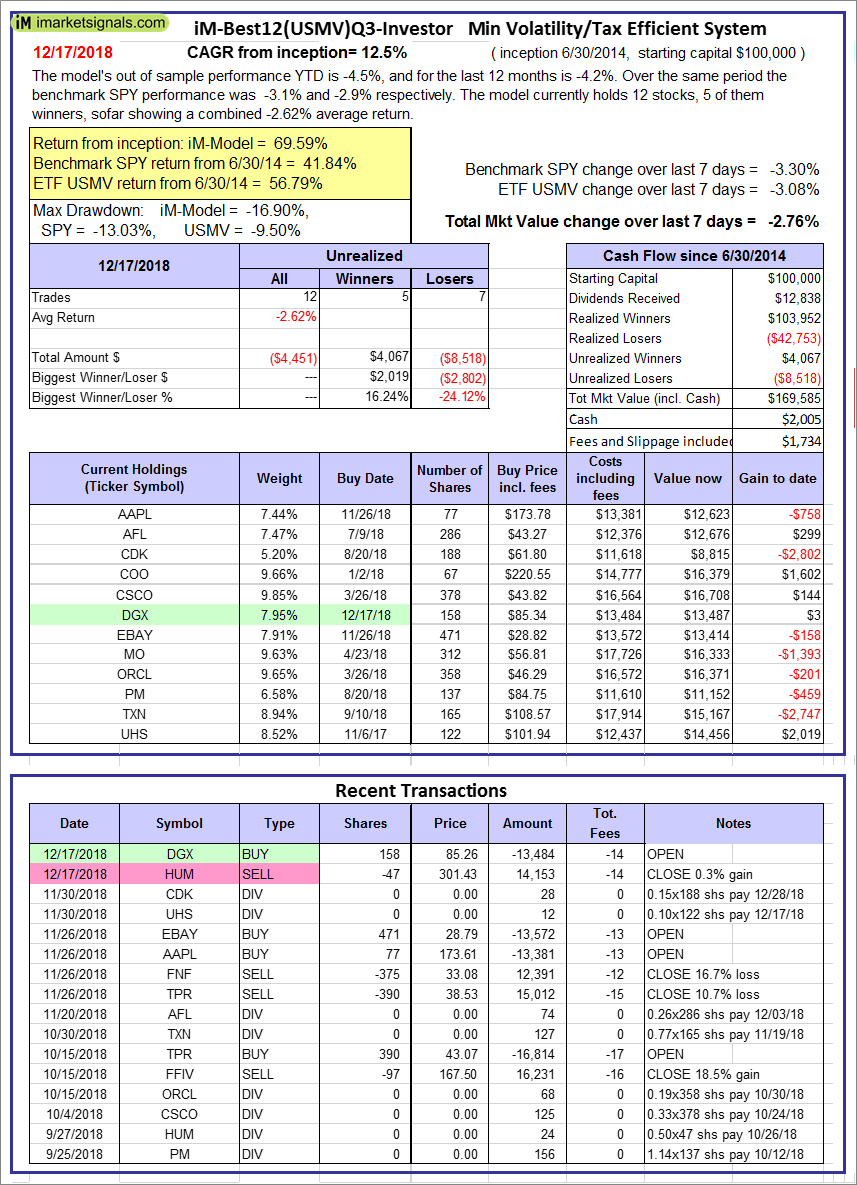 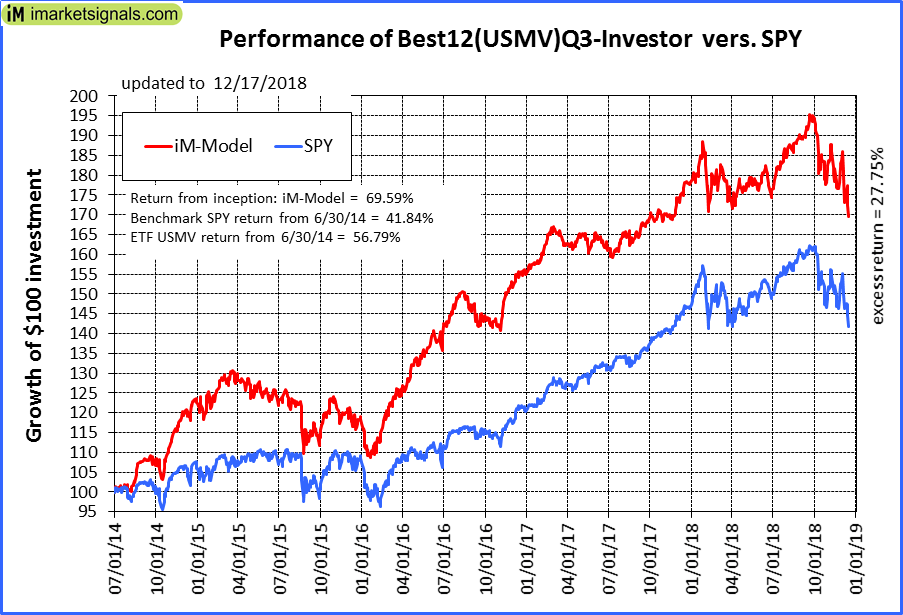 |
iM-Best12(USMV)Q3-Investor: The model’s out of sample performance YTD is -4.5%, and for the last 12 months is -4.2%. Over the same period the benchmark SPY performance was -3.1% and -2.9% respectively. Since inception, on 7/1/2014, the model gained 69.59% while the benchmark SPY gained 41.84% and the ETF USMV gained 56.79% over the same period. Over the previous week the market value of iM-Best12(USMV)Q3 gained -2.76% at a time when SPY gained -3.30%. A starting capital of $100,000 at inception on 7/1/2014 would have grown to $169,585 which includes $2,005 cash and excludes $1,734 spent on fees and slippage. |
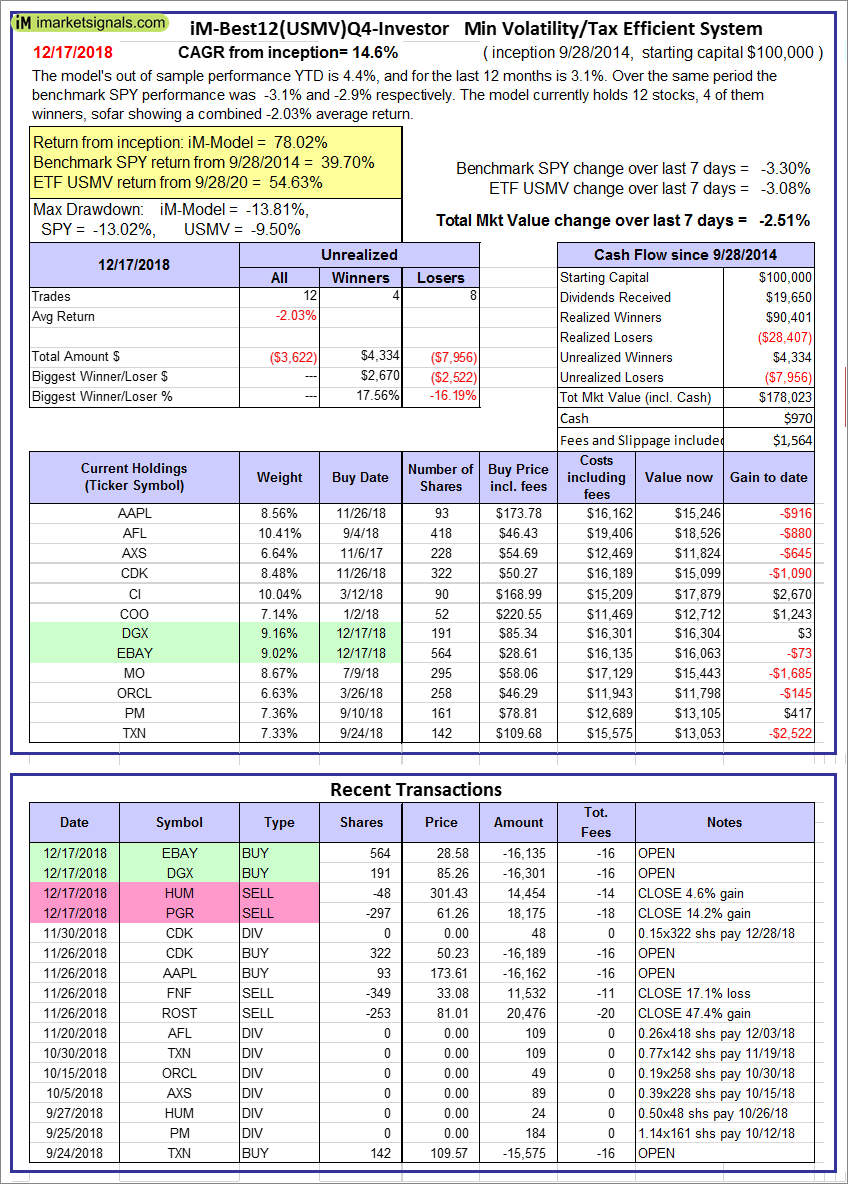 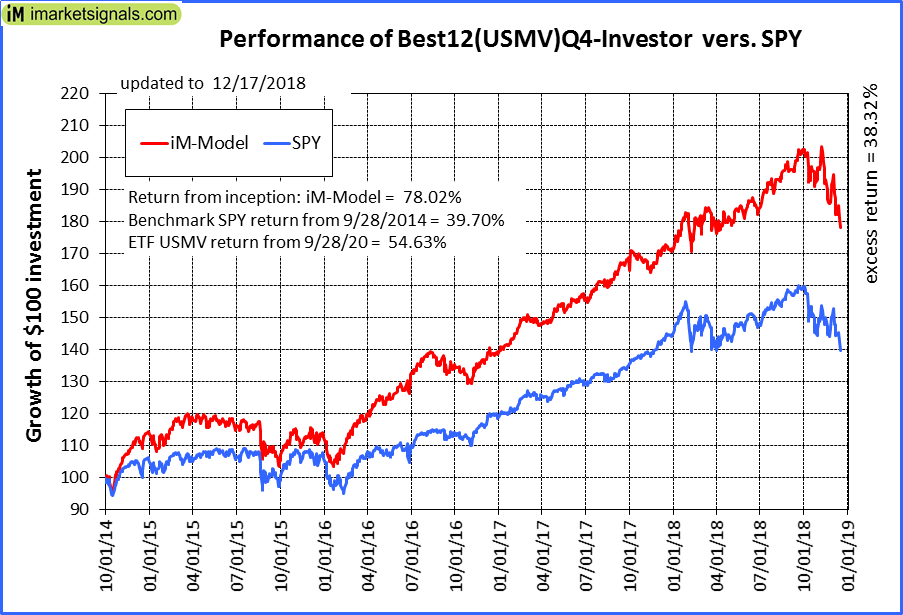 |
iM-Best12(USMV)Q4-Investor: Since inception, on 9/29/2014, the model gained 78.02% while the benchmark SPY gained 39.70% and the ETF USMV gained 54.63% over the same period. Over the previous week the market value of iM-Best12(USMV)Q4 gained -2.51% at a time when SPY gained -3.30%. A starting capital of $100,000 at inception on 9/29/2014 would have grown to $178,023 which includes $970 cash and excludes $1,564 spent on fees and slippage. |
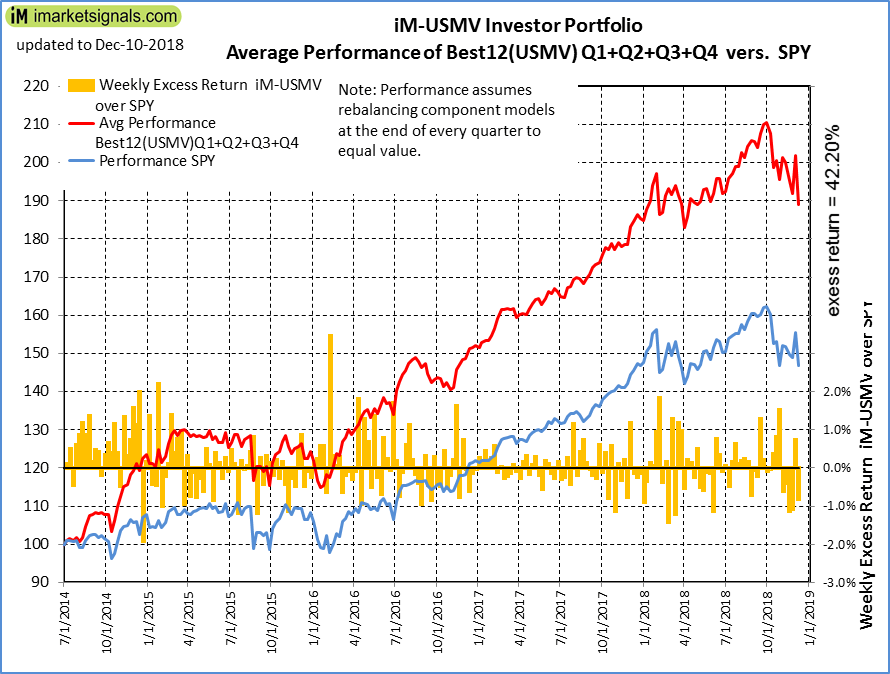 |
Average Performance of iM-Best12(USMV)Q1+Q2+Q3+Q4-Investor resulted in an excess return of 42.20% over SPY. (see iM-USMV Investor Portfolio) |
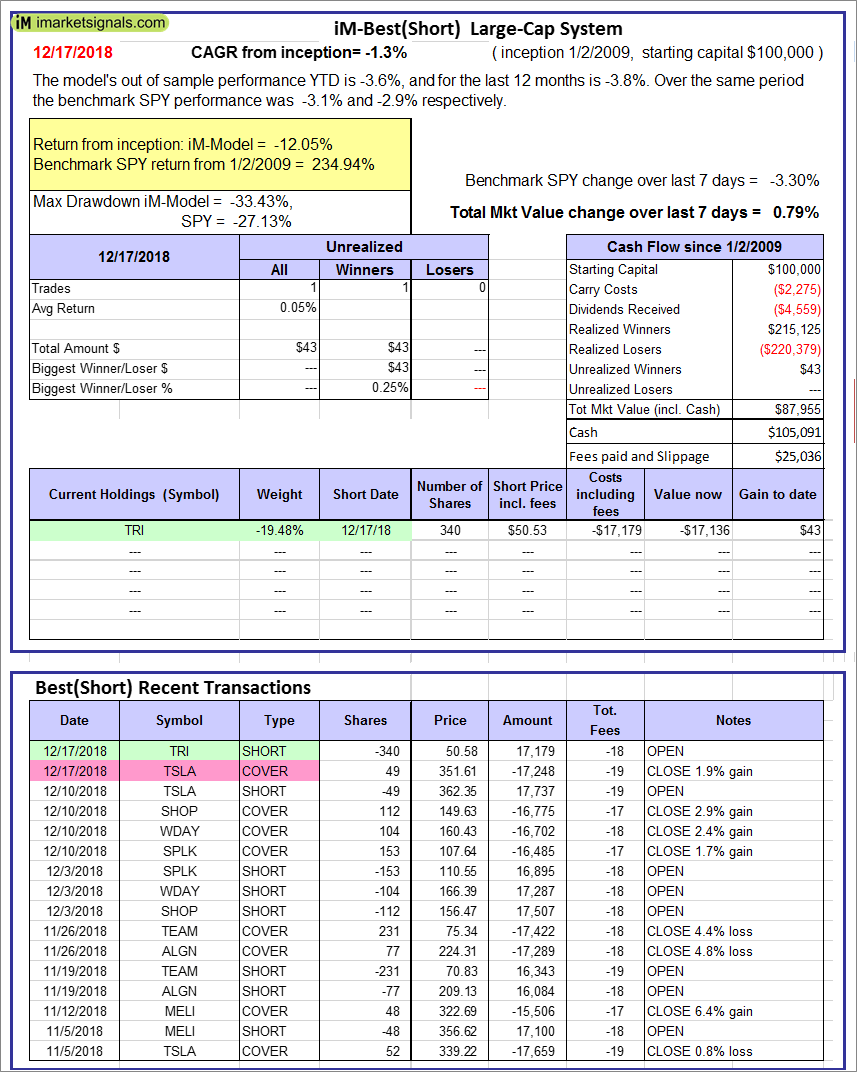 |
iM-Best(Short): The model’s out of sample performance YTD is -3.6%, and for the last 12 months is -3.8%. Over the same period the benchmark SPY performance was -3.1% and -2.9% respectively. Over the previous week the market value of iM-Best(Short) gained 0.79% at a time when SPY gained -3.30%. Over the period 1/2/2009 to 12/17/2018 the starting capital of $100,000 would have grown to $87,955 which includes $105,091 cash and excludes $25,036 spent on fees and slippage. |
 |
iM-Best2 MC-Score ETF System: The model’s out of sample performance YTD is -0.9%, and for the last 12 months is -1.1%. Over the same period the benchmark SPY performance was -3.1% and -2.9% respectively. Over the previous week the market value of the iM-Best2 MC-Score ETF System gained -2.89% at a time when SPY gained -3.30%. A starting capital of $100,000 at inception on 6/30/2016 would have grown to $111,403 which includes $356 cash and excludes $125 spent on fees and slippage. |
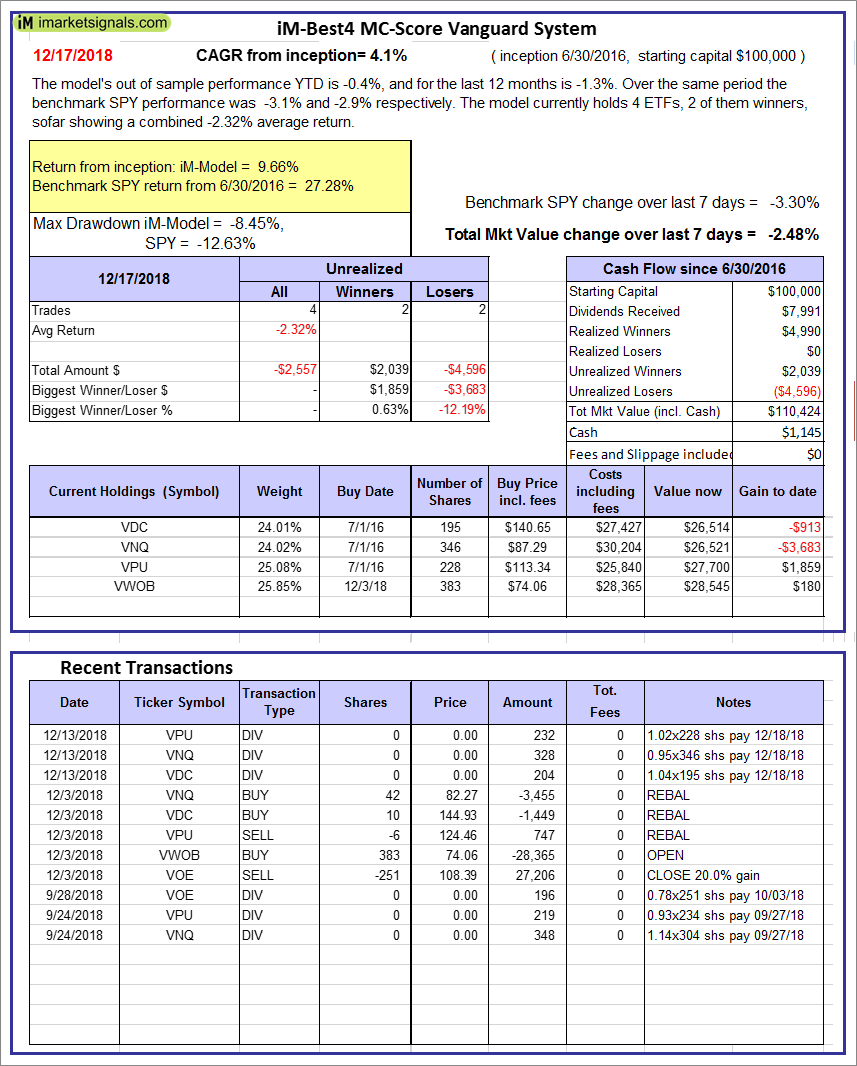 |
iM-Best4 MC-Score Vanguard System: The model’s out of sample performance YTD is -0.4%, and for the last 12 months is -1.3%. Over the same period the benchmark SPY performance was -3.1% and -2.9% respectively. Over the previous week the market value of the iM-Best4 MC-Score Vanguard System gained -2.48% at a time when SPY gained -3.30%. A starting capital of $100,000 at inception on 6/30/2016 would have grown to $110,424 which includes $1,145 cash and excludes $00 spent on fees and slippage. |
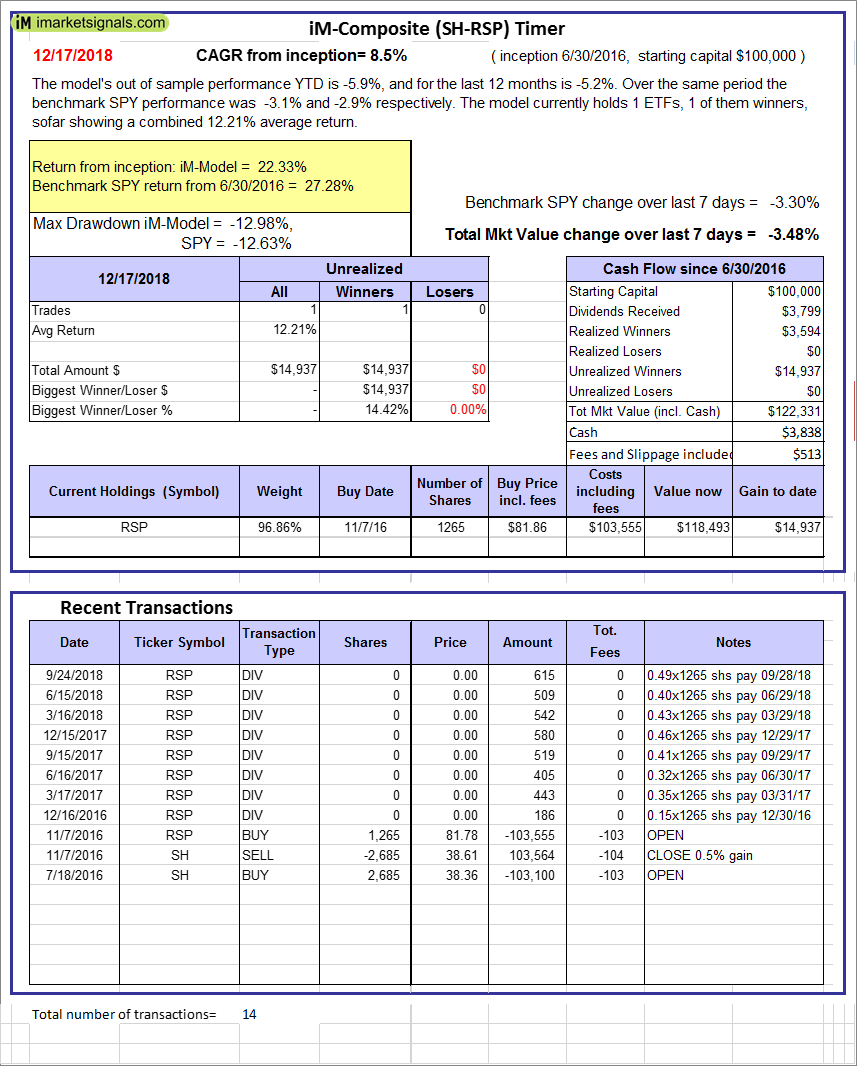 |
iM-Composite (SH-RSP) Timer: The model’s out of sample performance YTD is -5.9%, and for the last 12 months is -5.2%. Over the same period the benchmark SPY performance was -3.1% and -2.9% respectively. Over the previous week the market value of the iM-Composite (SH-RSP) Timer gained -3.48% at a time when SPY gained -3.30%. A starting capital of $100,000 at inception on 6/30/2016 would have grown to $122,331 which includes $3,838 cash and excludes $513 spent on fees and slippage. |
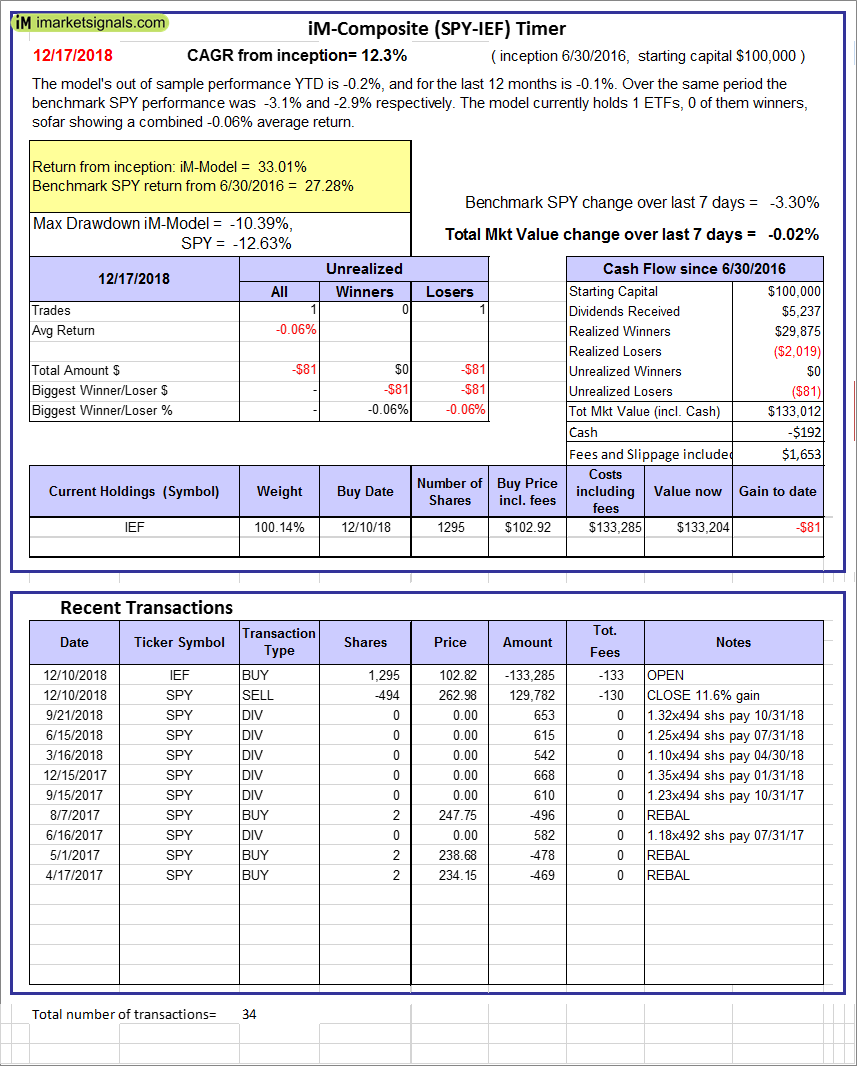 |
iM-Composite (SPY-IEF) Timer: The model’s out of sample performance YTD is -0.2%, and for the last 12 months is -0.1%. Over the same period the benchmark SPY performance was -3.1% and -2.9% respectively. Over the previous week the market value of the iM-Composite (SPY-IEF) Timer gained -0.02% at a time when SPY gained -3.30%. A starting capital of $100,000 at inception on 6/30/2016 would have grown to $133,012 which includes -$192 cash and excludes $1,653 spent on fees and slippage. |
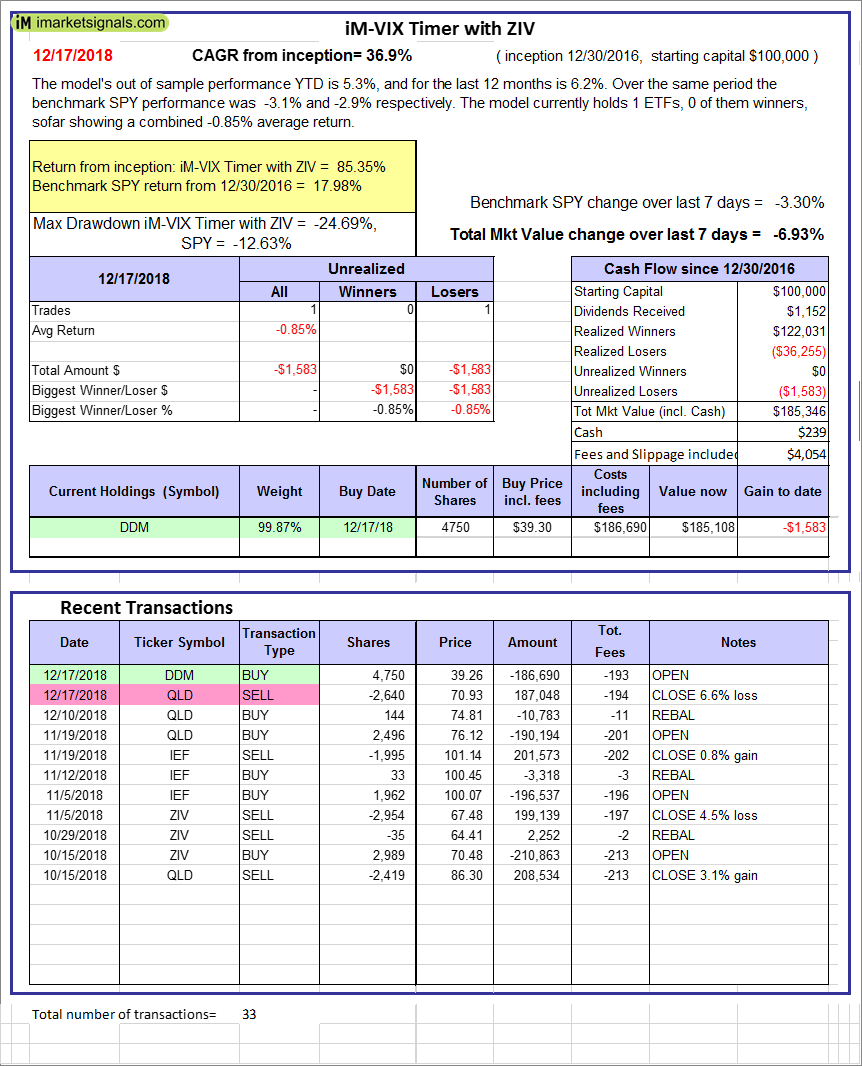 |
iM-VIX Timer with ZIV: The model’s out of sample performance YTD is 5.3%, and for the last 12 months is 6.2%. Over the same period the benchmark SPY performance was -3.1% and -2.9% respectively. Over the previous week the market value of the iM-VIX Timer with ZIV gained -6.93% at a time when SPY gained -3.30%. A starting capital of $100,000 at inception on 6/30/2016 would have grown to $185,346 which includes $239 cash and excludes $4,054 spent on fees and slippage. |
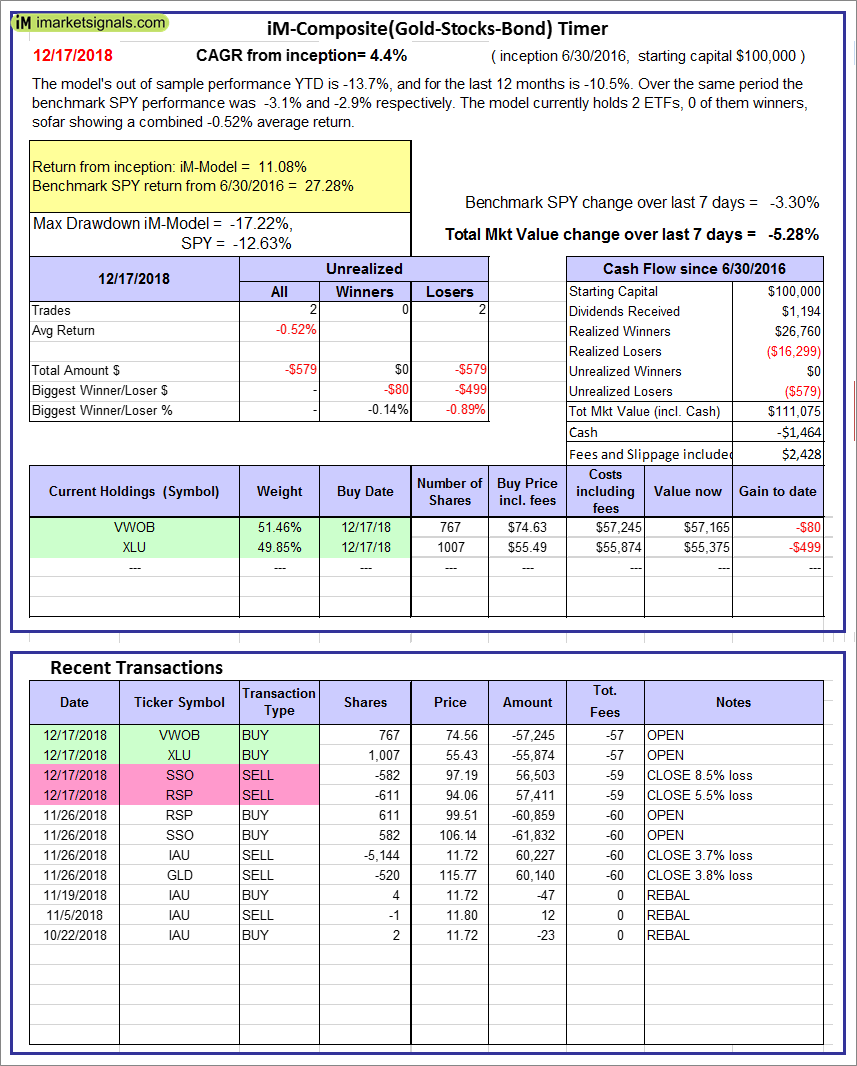 |
iM-Composite(Gold-Stocks-Bond) Timer: The model’s out of sample performance YTD is -13.7%, and for the last 12 months is -10.5%. Over the same period the benchmark SPY performance was -3.1% and -2.9% respectively. Over the previous week the market value of the iM-Composite(Gold-Stocks-Bond) Timer gained -5.28% at a time when SPY gained -3.30%. A starting capital of $100,000 at inception on 6/30/2016 would have grown to $111,075 which includes -$1,464 cash and excludes $2,428 spent on fees and slippage. |
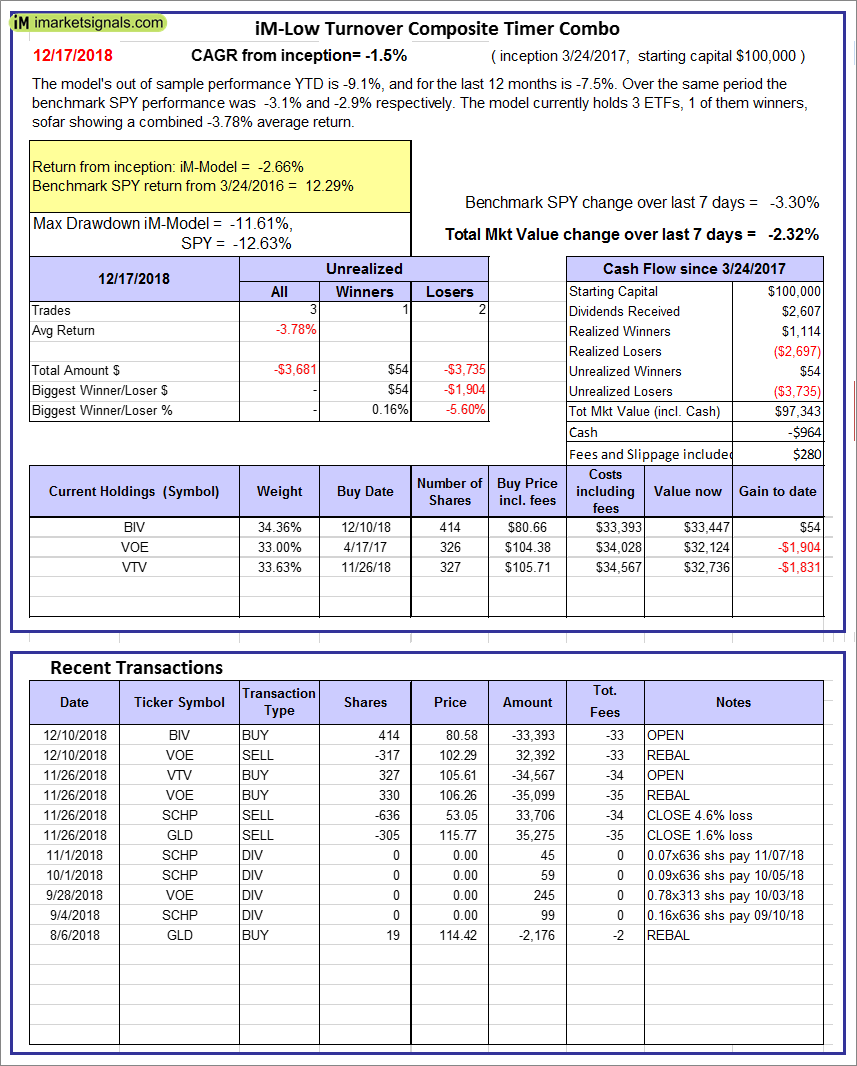 |
iM-Low Turnover Composite Timer Combo: The model’s out of sample performance YTD is -9.1%, and for the last 12 months is -7.5%. Over the same period the benchmark SPY performance was -3.1% and -2.9% respectively. Over the previous week the market value of the iM-Low Turnover Composite Timer Combo gained -2.32% at a time when SPY gained -3.30%. A starting capital of $100,000 at inception on 3/24/27 would have grown to $97,343 which includes -$964 cash and excludes $280 spent on fees and slippage. |
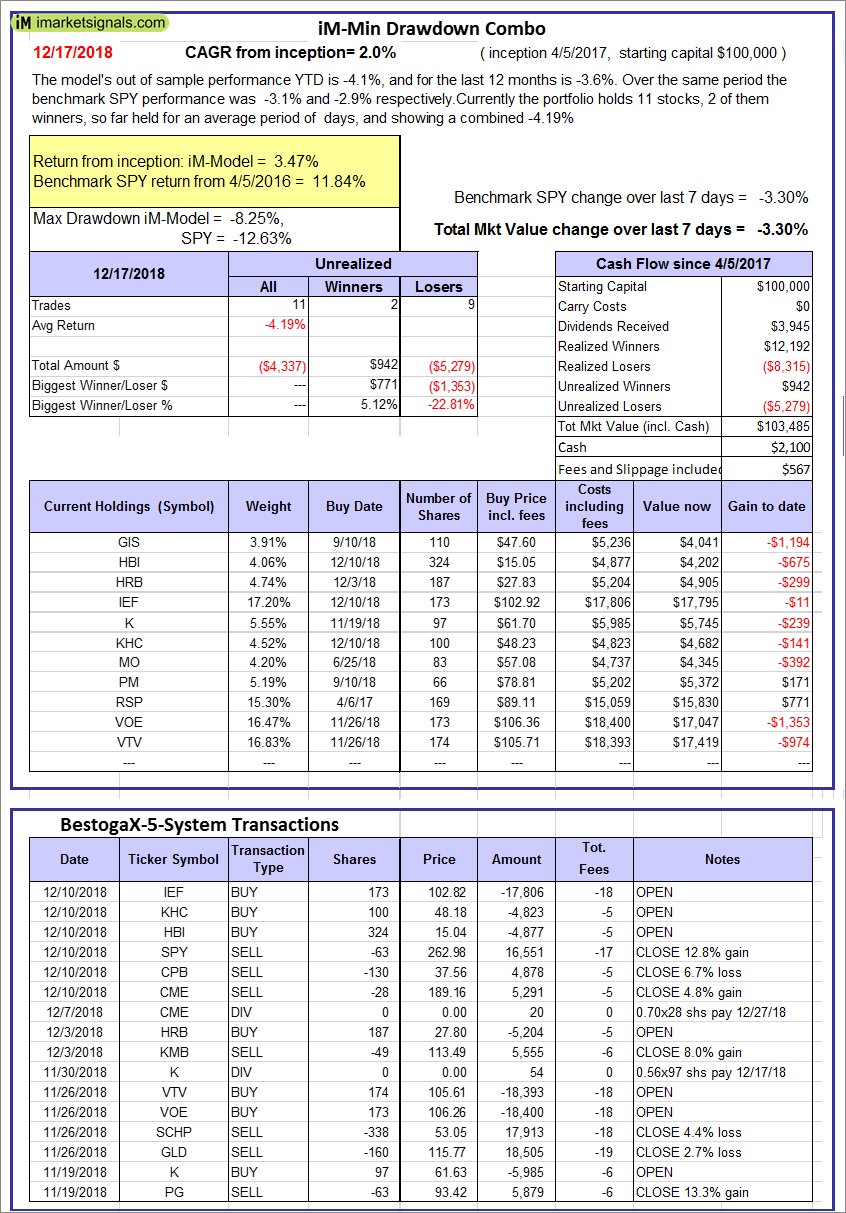 |
iM-Min Drawdown Combo: The model’s out of sample performance YTD is -4.1%, and for the last 12 months is -3.6%. Over the same period the benchmark SPY performance was -3.1% and -2.9% respectively. Over the previous week the market value of the iM-Min Drawdown Combo gained -3.30% at a time when SPY gained -3.30%. A starting capital of $100,000 at inception on 4/5/2017 would have grown to $103,485 which includes $2,100 cash and excludes $567 spent on fees and slippage. |
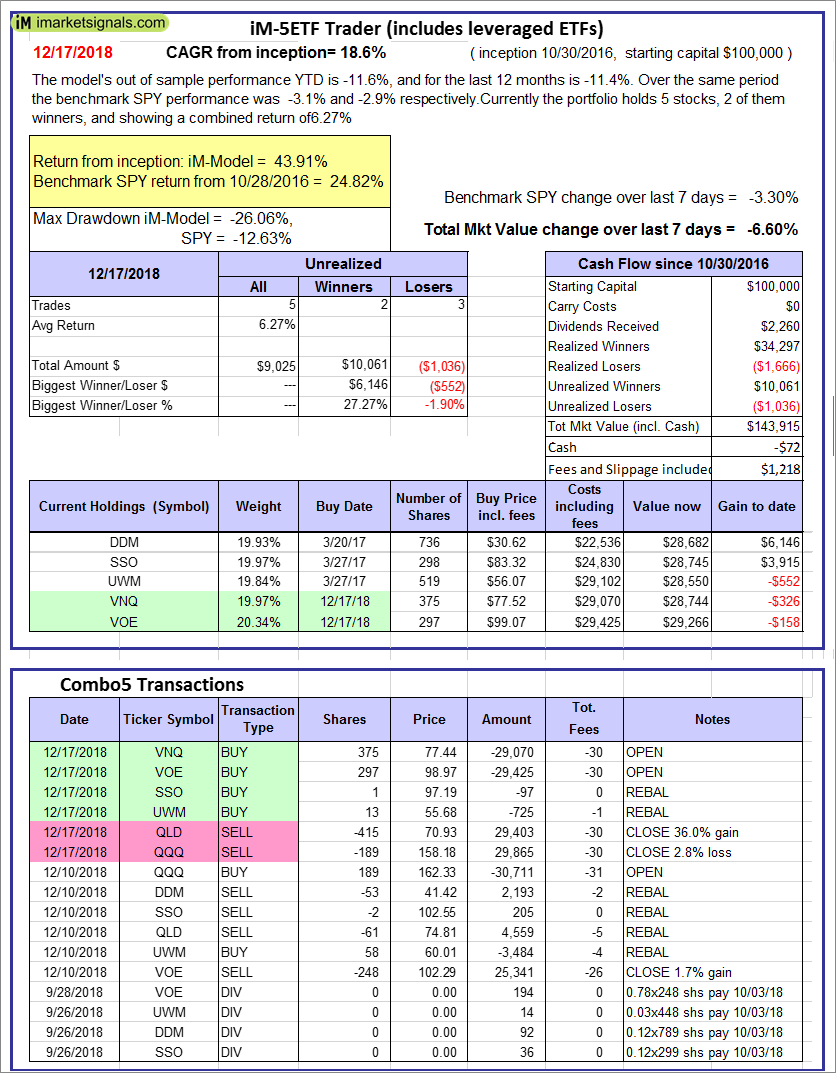 |
iM-5ETF Trader (includes leveraged ETFs): The model’s out of sample performance YTD is -11.6%, and for the last 12 months is -11.4%. Over the same period the benchmark SPY performance was -3.1% and -2.9% respectively. Over the previous week the market value of the iM-5ETF Trader (includes leveraged ETFs) gained -6.60% at a time when SPY gained -3.30%. A starting capital of $100,000 at inception on 10/30/2016 would have grown to $143,915 which includes -$72 cash and excludes $1,218 spent on fees and slippage. |
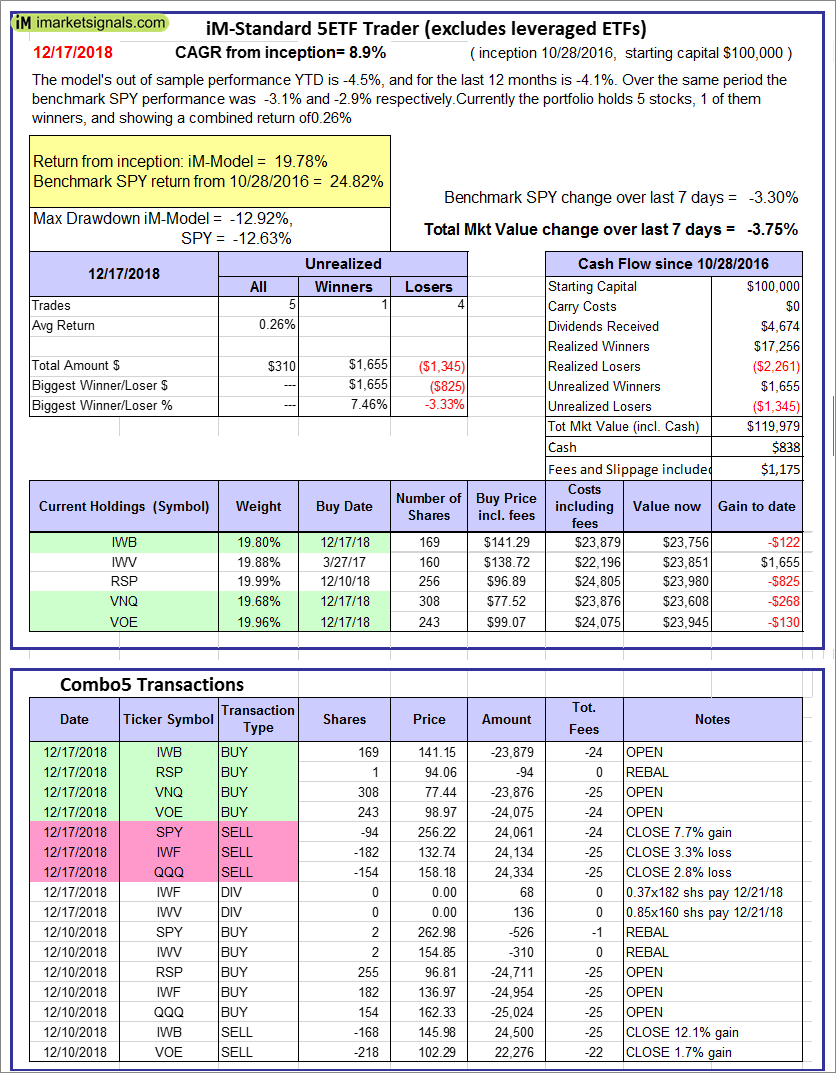 |
iM-Standard 5ETF Trader (excludes leveraged ETFs): The model’s out of sample performance YTD is -4.5%, and for the last 12 months is -4.1%. Over the same period the benchmark SPY performance was -3.1% and -2.9% respectively. Over the previous week the market value of the iM-Standard 5ETF Trader (excludes leveraged ETFs) gained -3.75% at a time when SPY gained -3.30%. A starting capital of $100,000 at inception on 10/30/2016 would have grown to $119,979 which includes $838 cash and excludes $1,175 spent on fees and slippage. |
iM-Best Reports – 12/17/2018
Posted in pmp SPY-SH
Leave a Reply
You must be logged in to post a comment.