  |
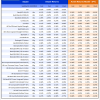
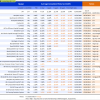
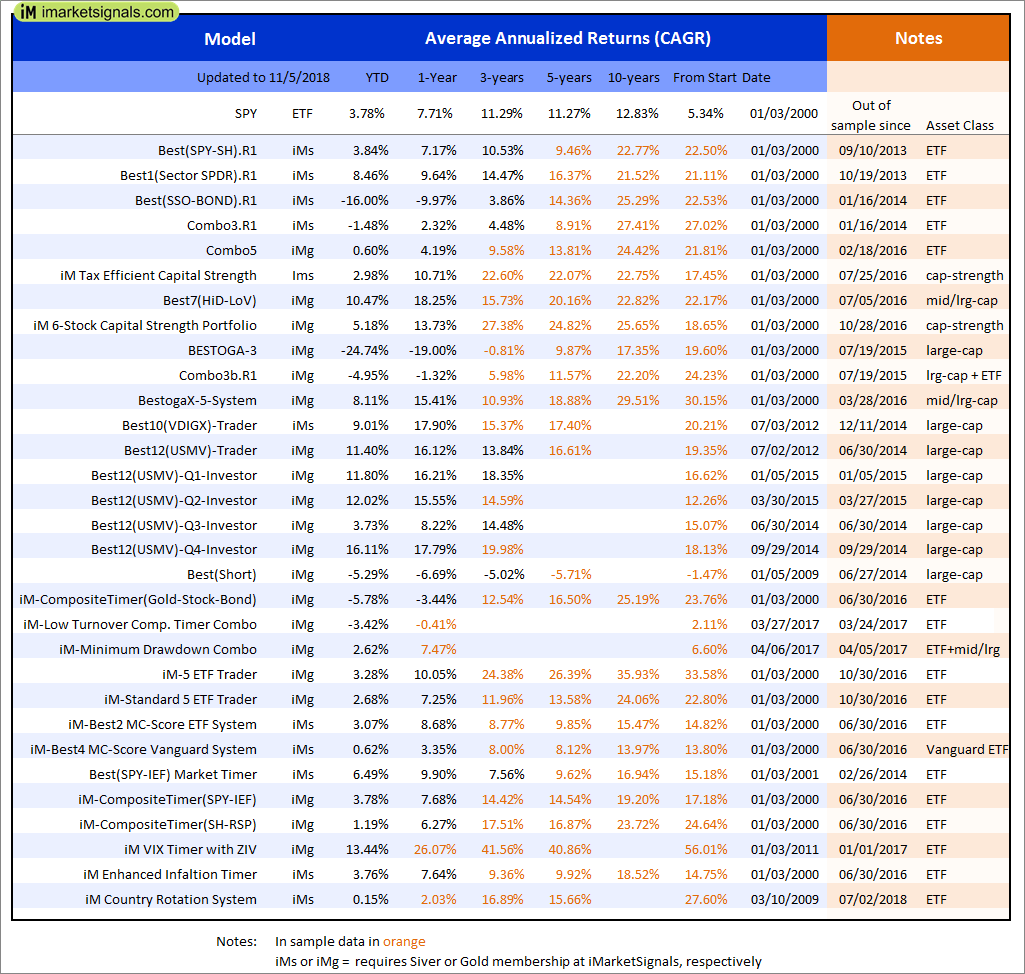
Out of sample performance summary of our models for the past 1, 2, 4 and 13 week periods. The active active return indicates how the models over- or underperformed the benchmark ETF SPY. Also the YTD, and the 1-, 3-, 5- and 10-year annualized returns are shown in the second table |
|
|
iM-Best(SPY-SH).R1: The model’s out of sample performance YTD is 3.3%, and for the last 12 months is 7.2%. Over the same period the benchmark SPY performance was 3.8% and 7.7% respectively. Over the previous week the market value of Best(SPY-SH) gained 3.59% at a time when SPY gained 3.61%. A starting capital of $100,000 at inception on 1/2/2009 would have grown to $583,884 which includes $2,930 cash and excludes $17,699 spent on fees and slippage. |
|
|
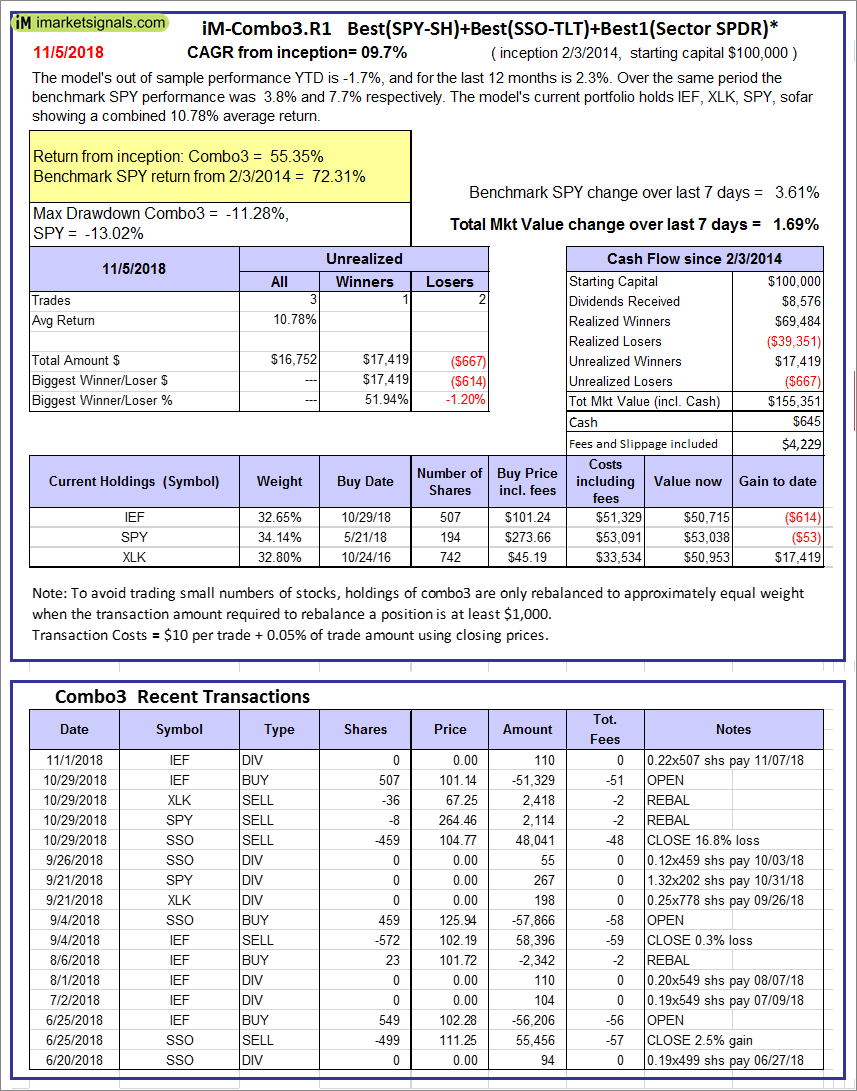
iM-Combo3.R1: The model’s out of sample performance YTD is -1.7%, and for the last 12 months is 2.3%. Over the same period the benchmark SPY performance was 3.8% and 7.7% respectively. Over the previous week the market value of iM-Combo3.R1 gained 1.69% at a time when SPY gained 3.61%. A starting capital of $100,000 at inception on 2/3/2014 would have grown to $155,351 which includes $645 cash and excludes $4,229 spent on fees and slippage. |
|
|
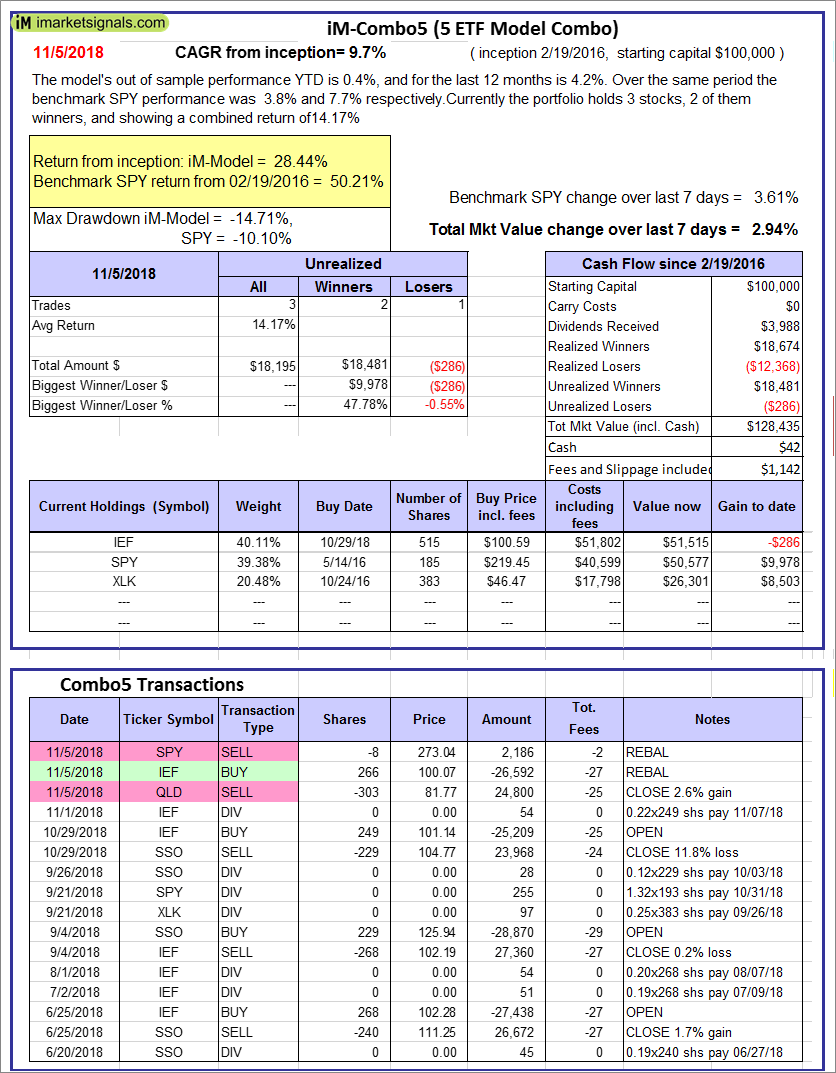
iM-Combo5: The model’s out of sample performance YTD is 0.4%, and for the last 12 months is 4.2%. Over the same period the benchmark SPY performance was 3.8% and 7.7% respectively. Over the previous week the market value of iM-Combo5 gained 2.94% at a time when SPY gained 3.61%. A starting capital of $100,000 at inception on 2/22/2016 would have grown to $128,435 which includes $42 cash and excludes $1,142 spent on fees and slippage. |
|
|
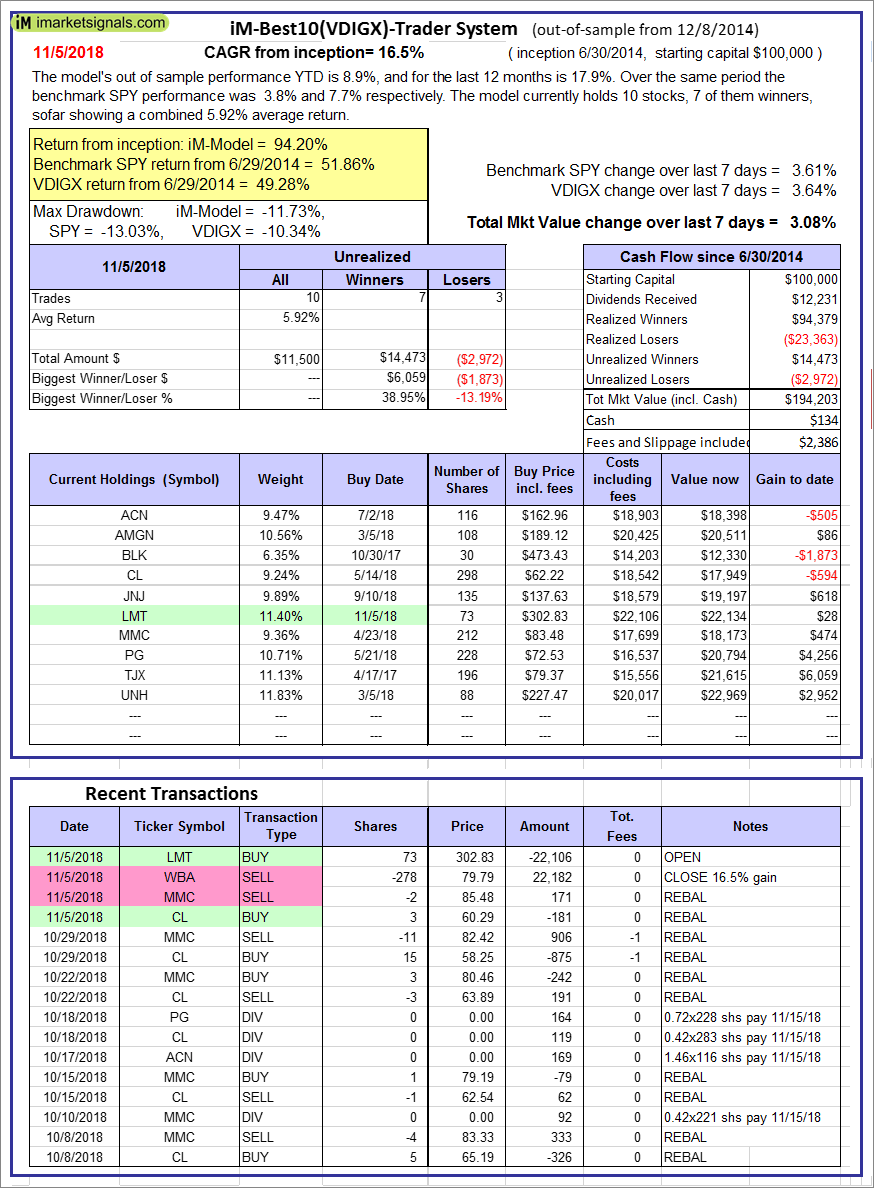
iM-Best10(VDIGX)-Trader: The model’s out of sample performance YTD is 8.9%, and for the last 12 months is 17.9%. Over the same period the benchmark SPY performance was 3.8% and 7.7% respectively. Since inception, on 7/1/2014, the model gained 94.20% while the benchmark SPY gained 51.86% and VDIGX gained 49.28% over the same period. Over the previous week the market value of iM-Best10(VDIGX) gained 3.08% at a time when SPY gained 3.61%. A starting capital of $100,000 at inception on 7/1/2014 would have grown to $194,203 which includes $134 cash and excludes $2,386 spent on fees and slippage. |
|
|
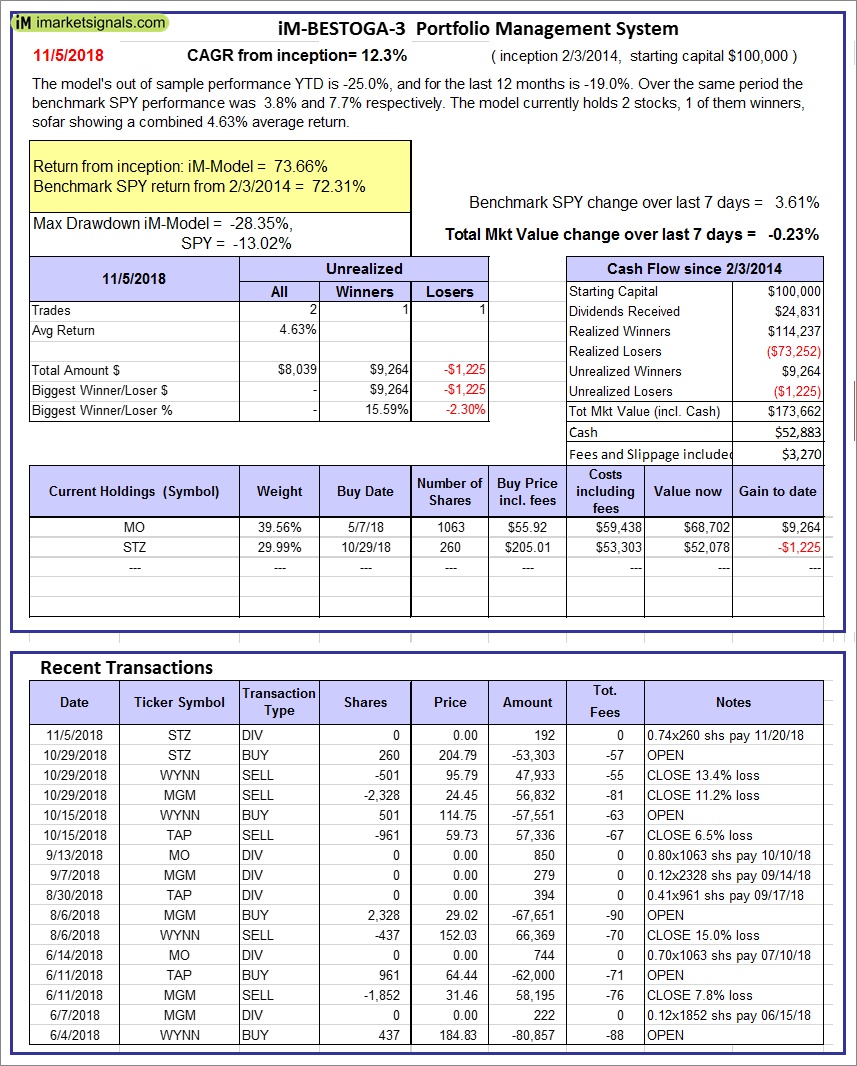
iM-BESTOGA-3: The model’s out of sample performance YTD is -25.0%, and for the last 12 months is -19.0%. Over the same period the benchmark SPY performance was 3.8% and 7.7% respectively. Over the previous week the market value of iM-BESTOGA-3 gained -0.23% at a time when SPY gained 3.61%. A starting capital of $100,000 at inception on 2/3/2014 would have grown to $173,662 which includes $52,883 cash and excludes $3,270 spent on fees and slippage. |
|
|
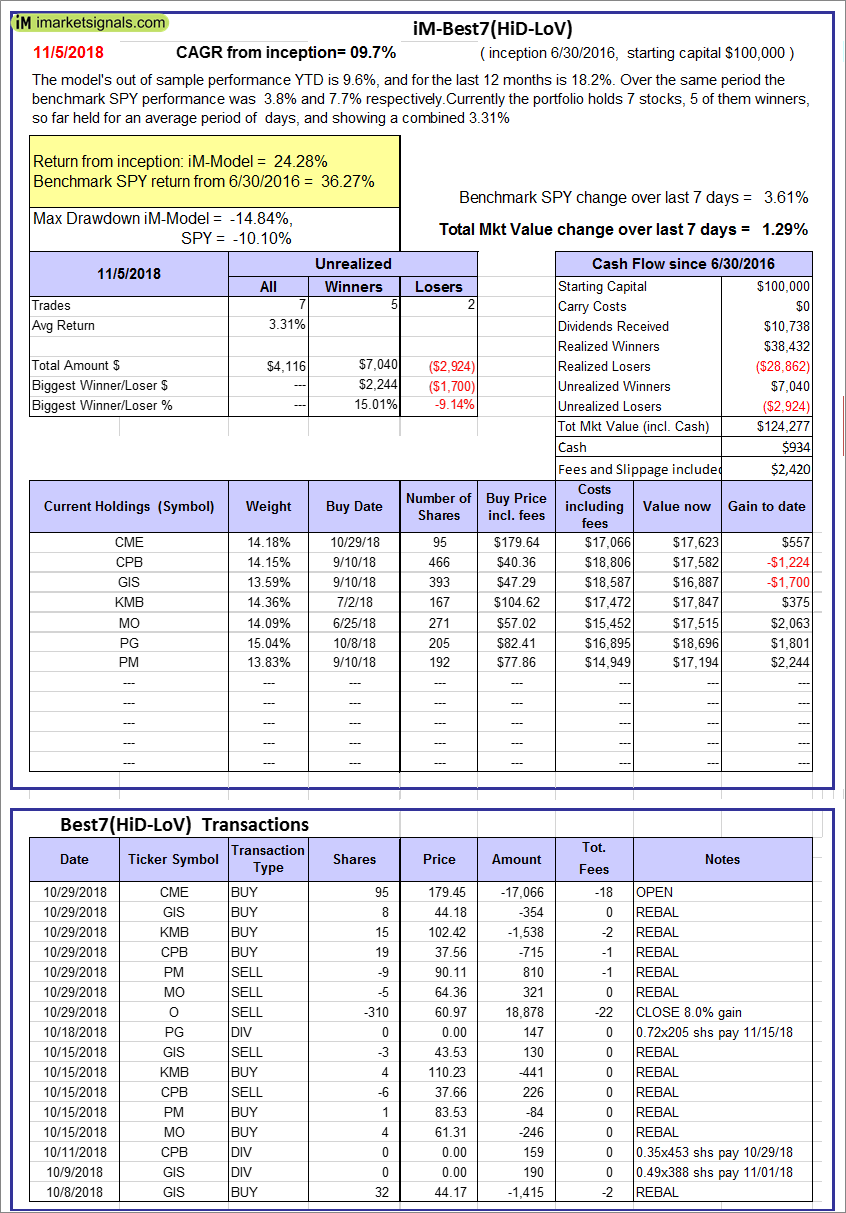
iM-Best7(HiD-LoV): The model’s out of sample performance YTD is 9.6%, and for the last 12 months is 18.2%. Over the same period the benchmark SPY performance was 3.8% and 7.7% respectively. Over the previous week the market value of iM-BESTOGA-3 gained 1.29% at a time when SPY gained 3.61%. A starting capital of $100,000 at inception on 6/30/2016 would have grown to $124,277 which includes $934 cash and excludes $2,420 spent on fees and slippage. |
|
|
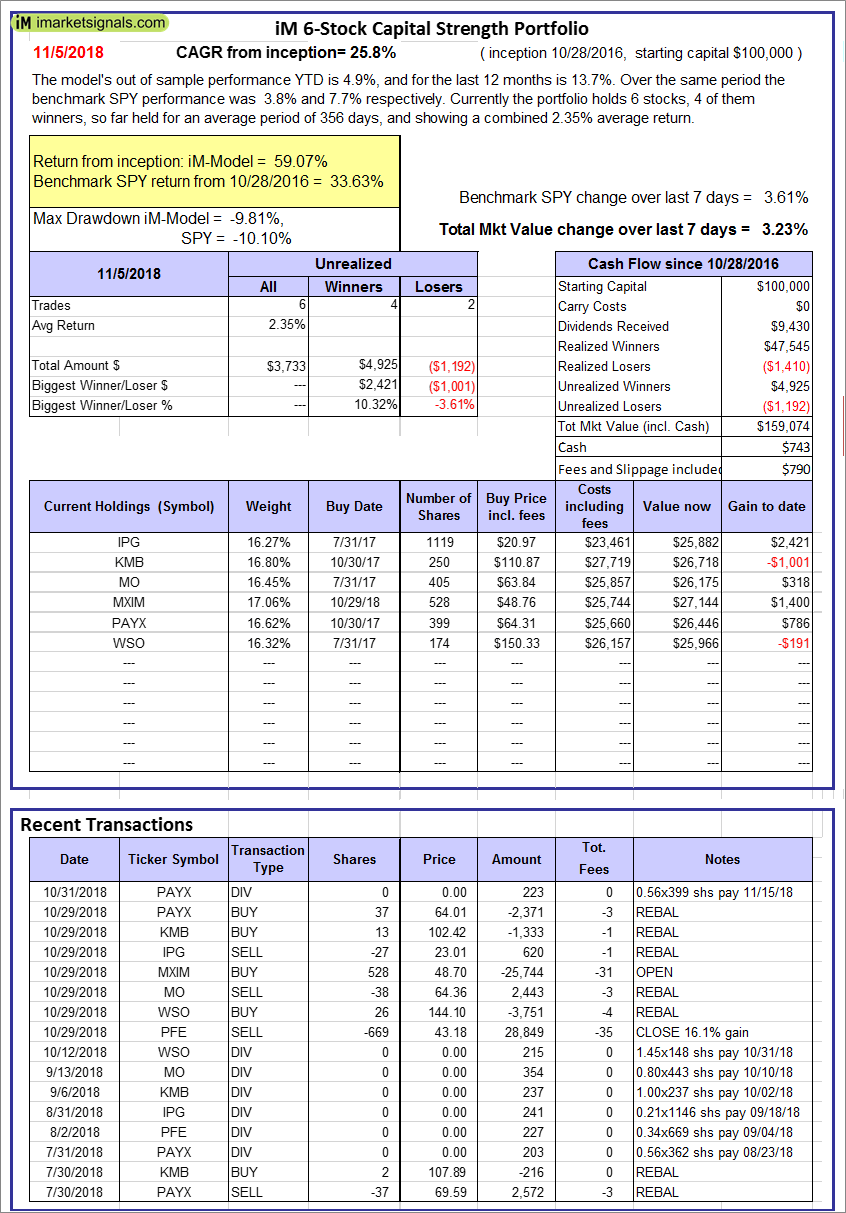
iM 6-Stock Capital Strength Portfolio: The model’s out of sample performance YTD is 4.9%, and for the last 12 months is 13.7%. Over the same period the benchmark SPY performance was 3.8% and 7.7% respectively. Over the previous week the market value of the iM 6-Stock Capital Strength Portfolio gained 3.23% at a time when SPY gained 3.61%. A starting capital of $100,000 at inception on 10/28/2016 would have grown to $159,074 which includes $743 cash and excludes $790 spent on fees and slippage. |
|
|
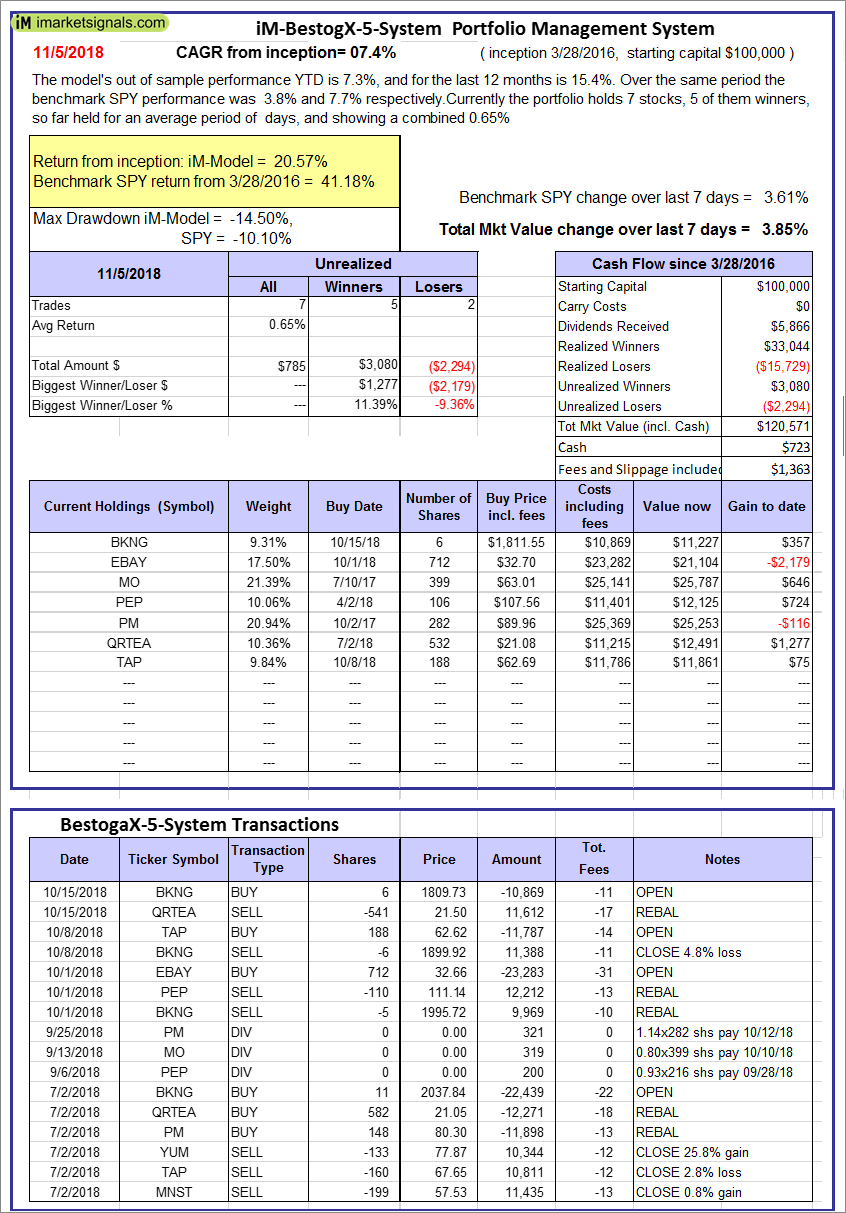
iM-BestogaX5-System: The model’s out of sample performance YTD is 7.3%, and for the last 12 months is 15.4%. Over the same period the benchmark SPY performance was 3.8% and 7.7% respectively. Over the previous week the market value of iM-BestogaX5-System gained 3.85% at a time when SPY gained 3.61%. A starting capital of $100,000 at inception on 3/28/2016 would have grown to $120,571 which includes $723 cash and excludes $1,363 spent on fees and slippage. |
|
|
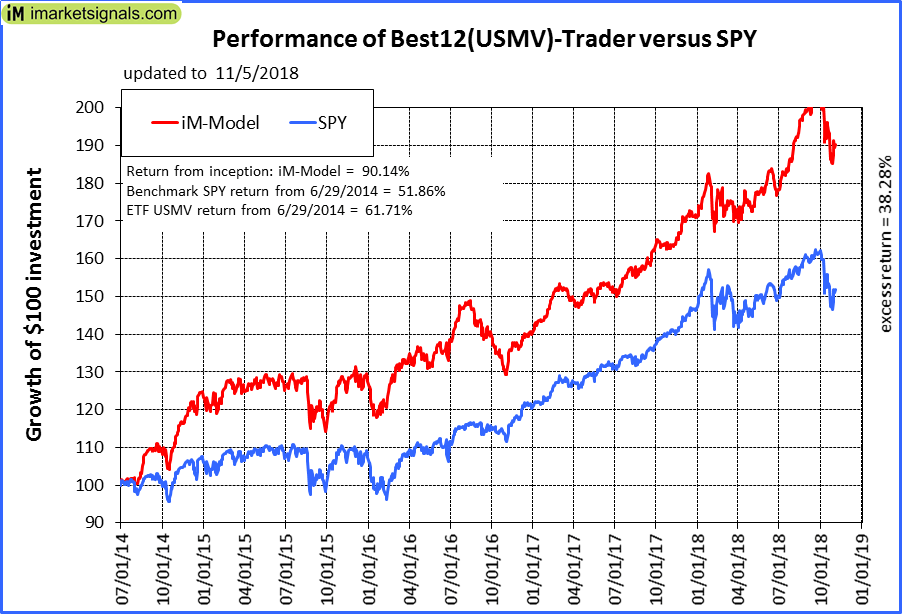
iM-Best12(USMV)-Trader: The model’s out of sample performance YTD is 11.2%, and for the last 12 months is 16.1%. Over the same period the benchmark SPY performance was 3.8% and 7.7% respectively. Since inception, on 6/30/2014, the model gained 90.14% while the benchmark SPY gained 51.86% and the ETF USMV gained 61.71% over the same period. Over the previous week the market value of iM-Best12(USMV)-Trader gained 2.64% at a time when SPY gained 3.61%. A starting capital of $100,000 at inception on 6/30/2014 would have grown to $190,264 which includes $977 cash and excludes $4,678 spent on fees and slippage. |
|
|
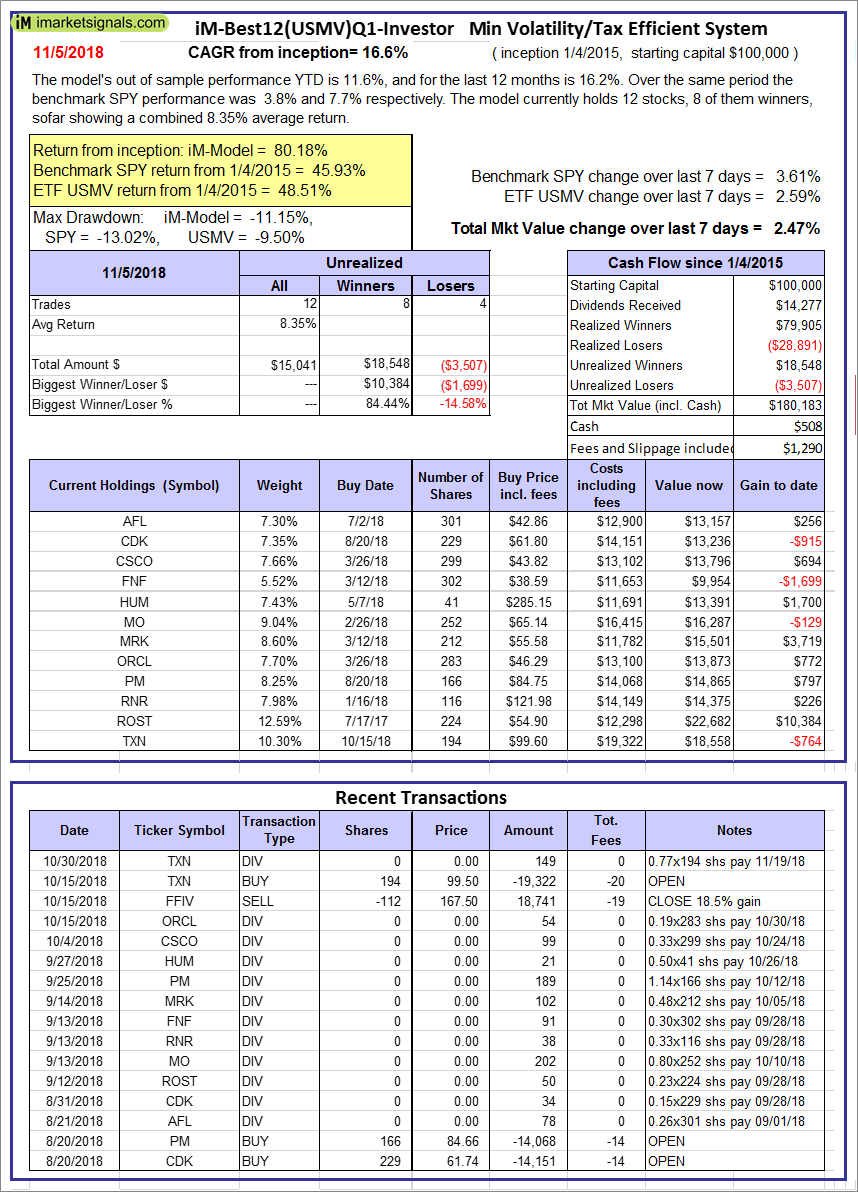
iM-Best12(USMV)Q1-Investor: The model’s out of sample performance YTD is 11.6%, and for the last 12 months is 16.2%. Over the same period the benchmark SPY performance was 3.8% and 7.7% respectively. Since inception, on 1/5/2015, the model gained 80.18% while the benchmark SPY gained 45.93% and the ETF USMV gained 48.51% over the same period. Over the previous week the market value of iM-Best12(USMV)Q1 gained 2.47% at a time when SPY gained 3.61%. A starting capital of $100,000 at inception on 1/5/2015 would have grown to $180,183 which includes $508 cash and excludes $1,290 spent on fees and slippage. |
|
|
iM-Best12(USMV)Q2-Investor: The model’s out of sample performance YTD is 11.8%, and for the last 12 months is 15.5%. Over the same period the benchmark SPY performance was 3.8% and 7.7% respectively. Since inception, on 3/30/2015, the model gained 51.67% while the benchmark SPY gained 40.72% and the ETF USMV gained 43.44% over the same period. Over the previous week the market value of iM-Best12(USMV)Q2 gained 2.49% at a time when SPY gained 3.61%. A starting capital of $100,000 at inception on 3/30/2015 would have grown to $151,669 which includes $444 cash and excludes $1,125 spent on fees and slippage. |
|
|
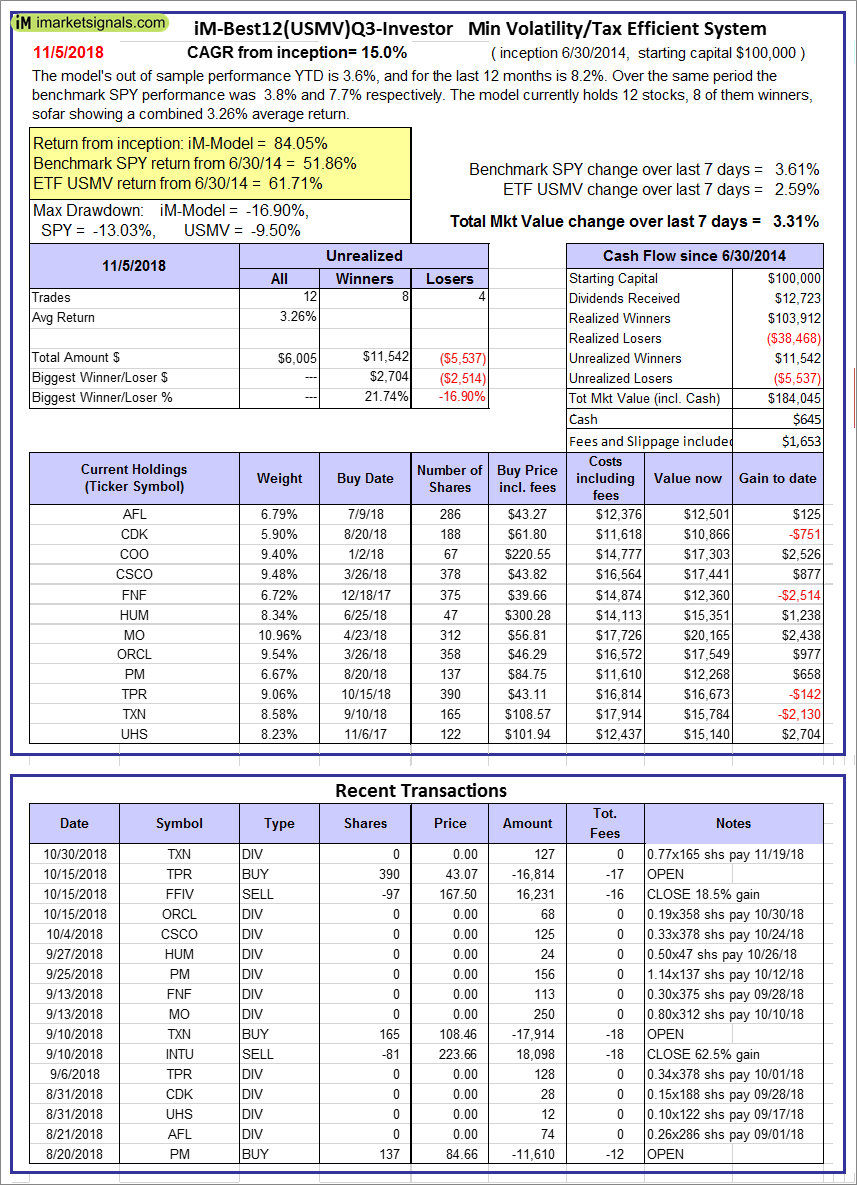
iM-Best12(USMV)Q3-Investor: The model’s out of sample performance YTD is 3.6%, and for the last 12 months is 8.2%. Over the same period the benchmark SPY performance was 3.8% and 7.7% respectively. Since inception, on 7/1/2014, the model gained 84.05% while the benchmark SPY gained 51.86% and the ETF USMV gained 61.71% over the same period. Over the previous week the market value of iM-Best12(USMV)Q3 gained 3.31% at a time when SPY gained 3.61%. A starting capital of $100,000 at inception on 7/1/2014 would have grown to $184,045 which includes $645 cash and excludes $1,653 spent on fees and slippage. |
|
|
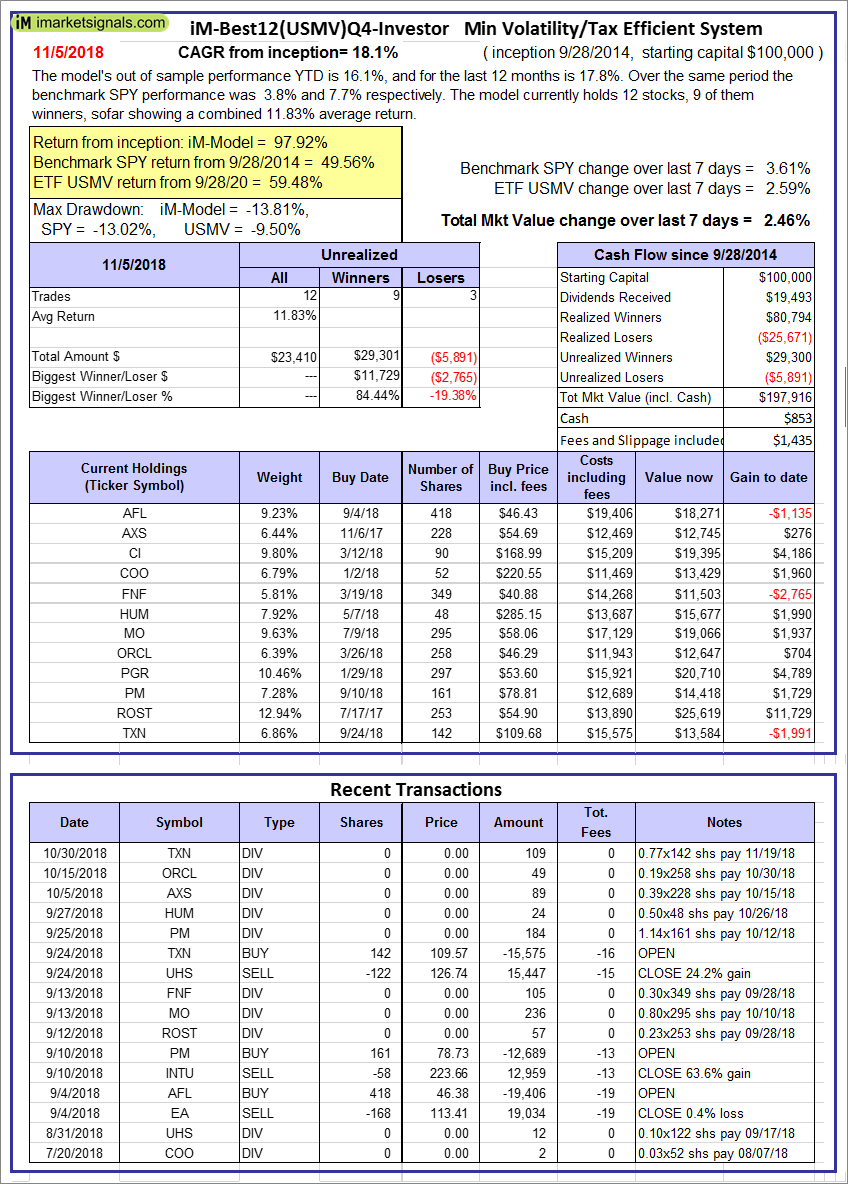
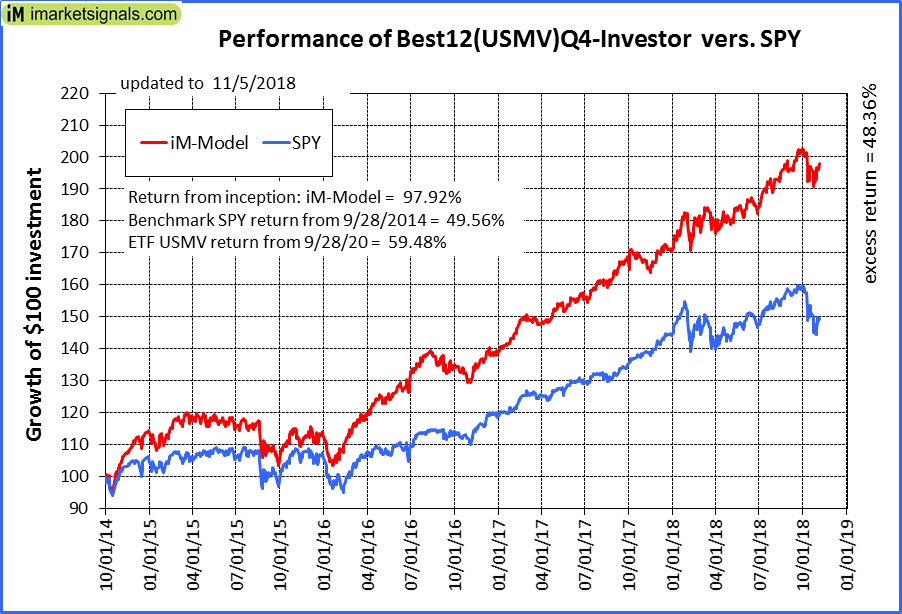
iM-Best12(USMV)Q4-Investor: Since inception, on 9/29/2014, the model gained 97.92% while the benchmark SPY gained 49.56% and the ETF USMV gained 59.48% over the same period. Over the previous week the market value of iM-Best12(USMV)Q4 gained 2.46% at a time when SPY gained 3.61%. A starting capital of $100,000 at inception on 9/29/2014 would have grown to $197,916 which includes $853 cash and excludes $1,435 spent on fees and slippage. |
|
|
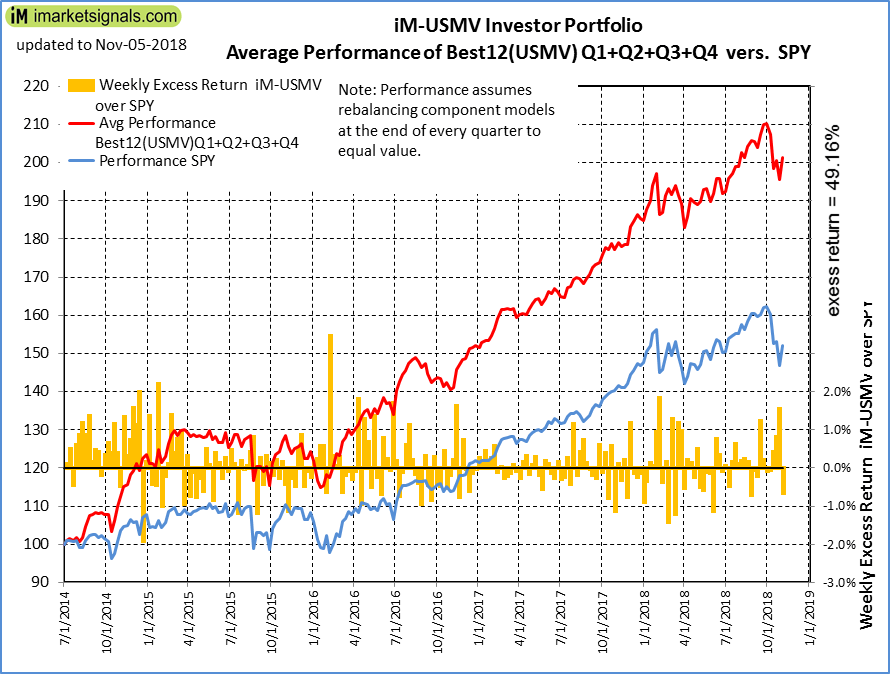
Average Performance of iM-Best12(USMV)Q1+Q2+Q3+Q4-Investor resulted in an excess return of 49.16% over SPY. (see iM-USMV Investor Portfolio) |
|
|
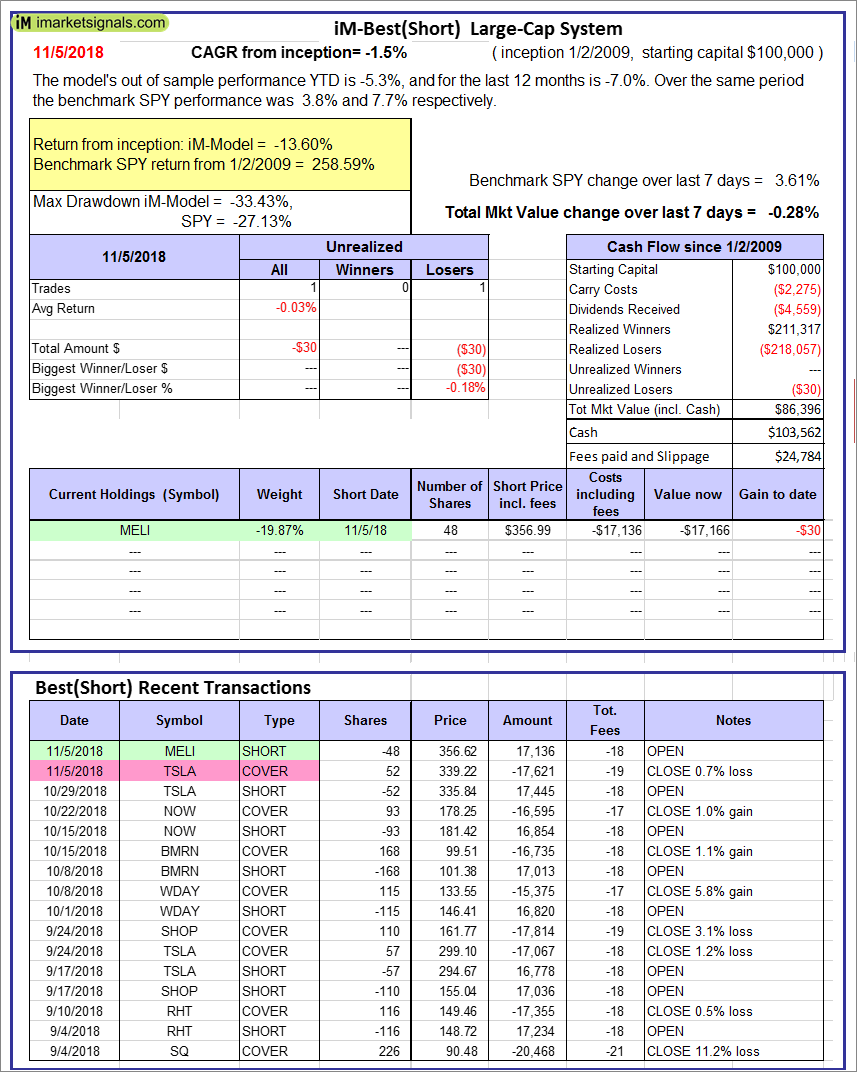
iM-Best(Short): The model’s out of sample performance YTD is -5.3%, and for the last 12 months is -7.0%. Over the same period the benchmark SPY performance was 3.8% and 7.7% respectively. Over the previous week the market value of iM-Best(Short) gained -0.28% at a time when SPY gained 3.61%. Over the period 1/2/2009 to 11/5/2018 the starting capital of $100,000 would have grown to $86,396 which includes $103,562 cash and excludes $24,784 spent on fees and slippage. |
|
|
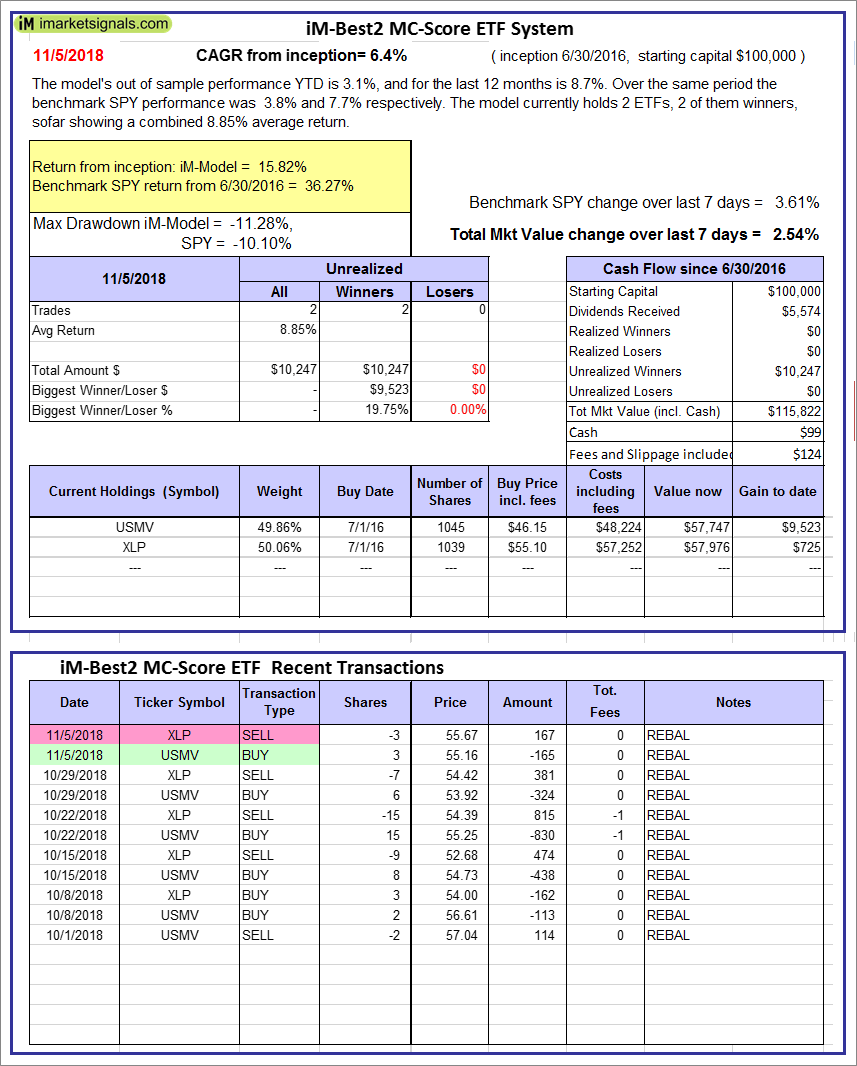
iM-Best2 MC-Score ETF System: The model’s out of sample performance YTD is 3.1%, and for the last 12 months is 8.7%. Over the same period the benchmark SPY performance was 3.8% and 7.7% respectively. Over the previous week the market value of the iM-Best2 MC-Score ETF System gained 2.54% at a time when SPY gained 3.61%. A starting capital of $100,000 at inception on 6/30/2016 would have grown to $115,822 which includes $99 cash and excludes $124 spent on fees and slippage. |
|
|
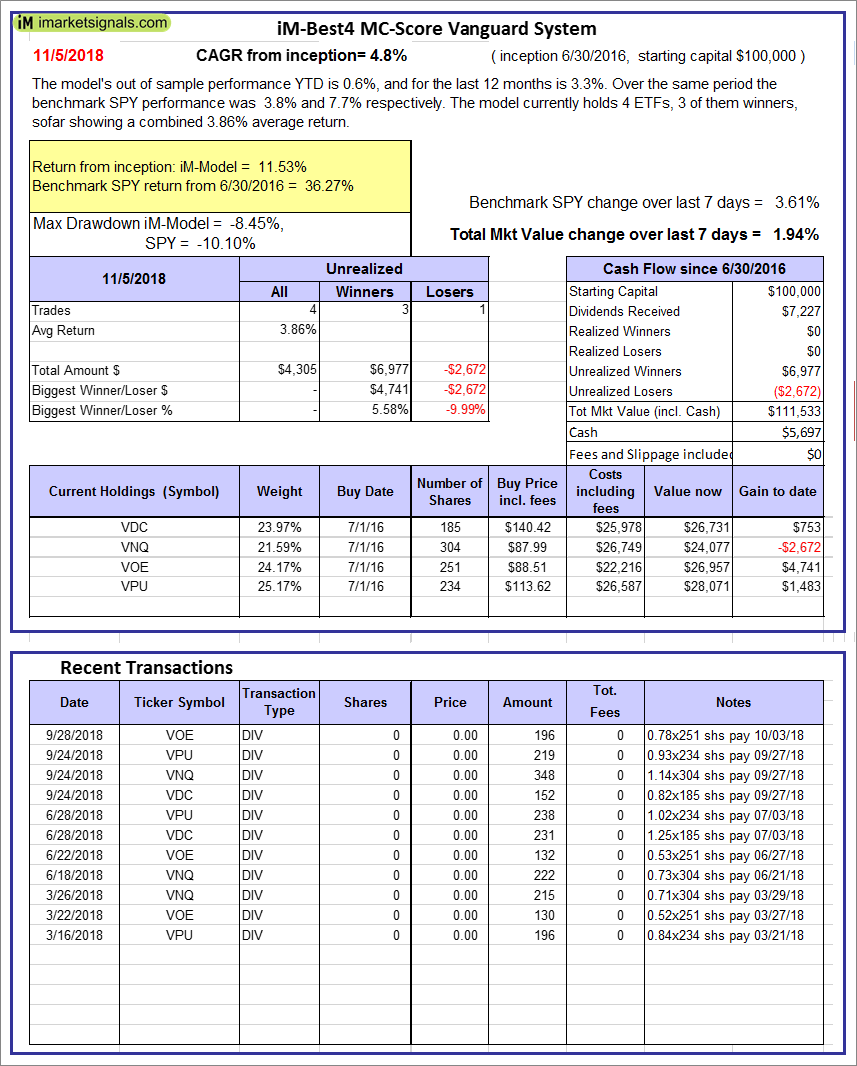
iM-Best4 MC-Score Vanguard System: The model’s out of sample performance YTD is 0.6%, and for the last 12 months is 3.3%. Over the same period the benchmark SPY performance was 3.8% and 7.7% respectively. Over the previous week the market value of the iM-Best4 MC-Score Vanguard System gained 1.94% at a time when SPY gained 3.61%. A starting capital of $100,000 at inception on 6/30/2016 would have grown to $111,533 which includes $5,697 cash and excludes $00 spent on fees and slippage. |
|
|
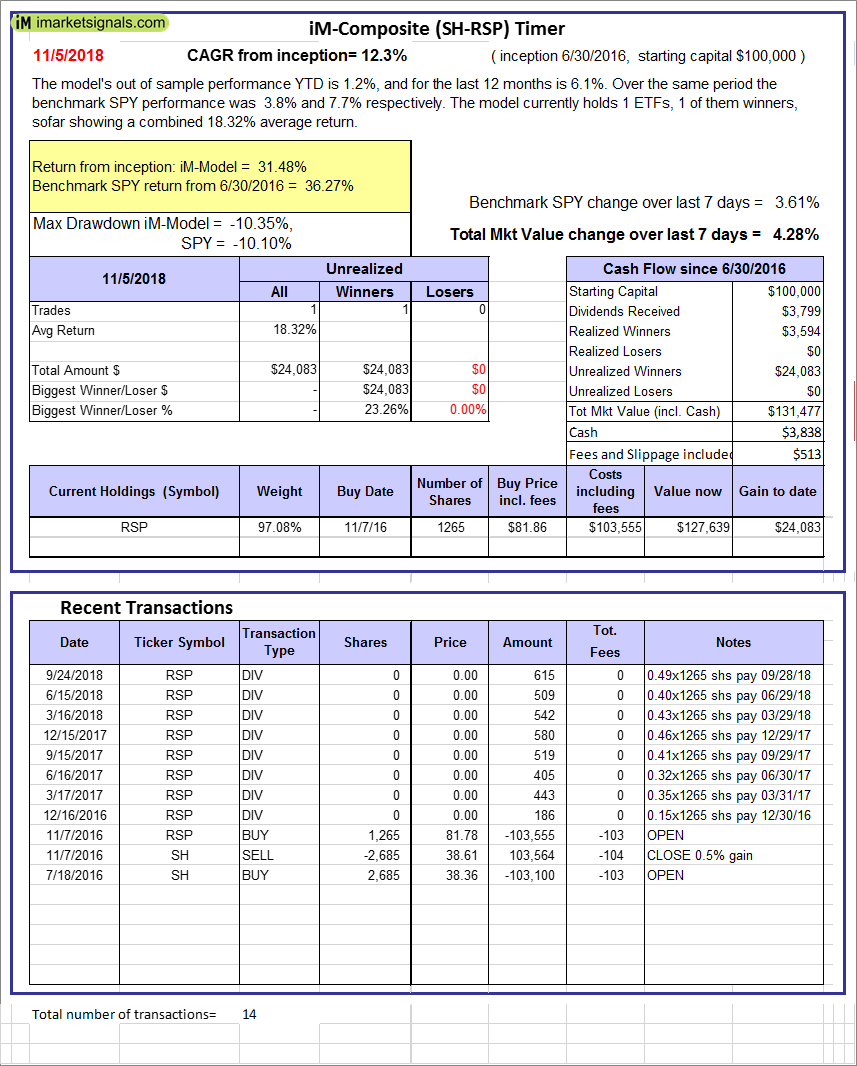
iM-Composite (SH-RSP) Timer: The model’s out of sample performance YTD is 1.2%, and for the last 12 months is 6.1%. Over the same period the benchmark SPY performance was 3.8% and 7.7% respectively. Over the previous week the market value of the iM-Composite (SH-RSP) Timer gained 4.28% at a time when SPY gained 3.61%. A starting capital of $100,000 at inception on 6/30/2016 would have grown to $131,477 which includes $3,838 cash and excludes $513 spent on fees and slippage. |
|
|
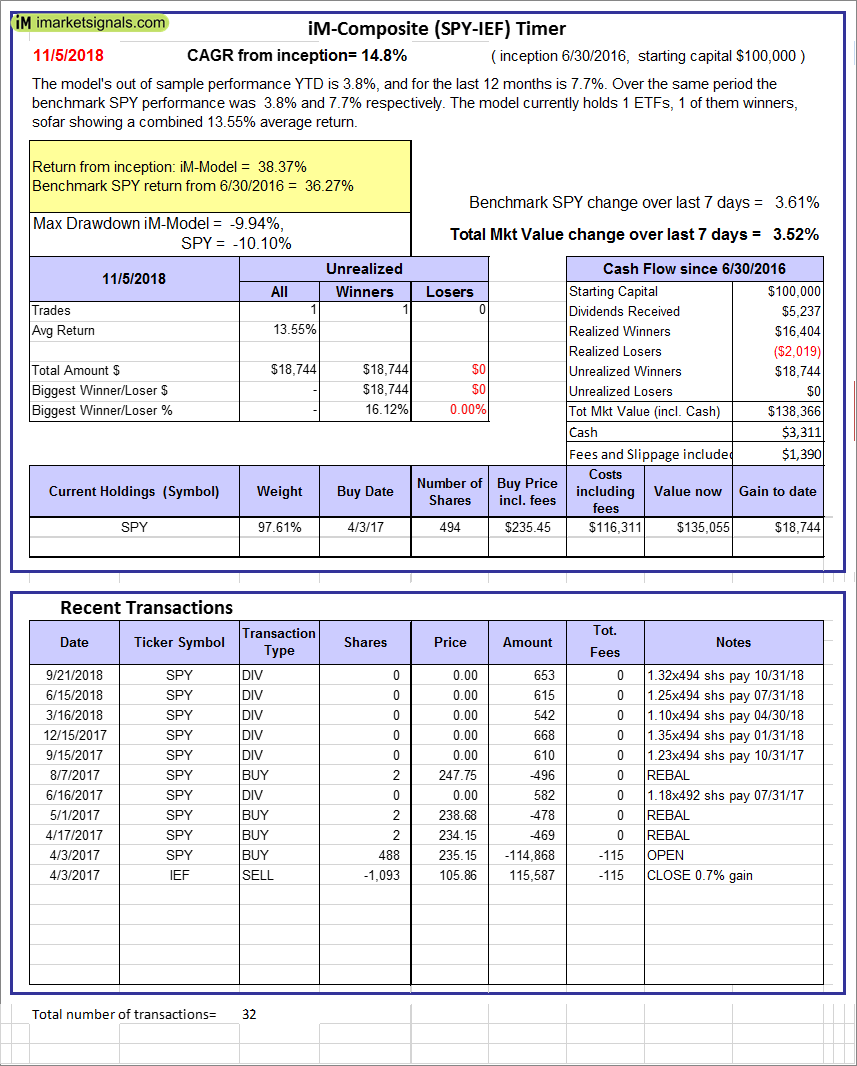
iM-Composite (SPY-IEF) Timer: The model’s out of sample performance YTD is 3.8%, and for the last 12 months is 7.7%. Over the same period the benchmark SPY performance was 3.8% and 7.7% respectively. Over the previous week the market value of the iM-Composite (SPY-IEF) Timer gained 3.52% at a time when SPY gained 3.61%. A starting capital of $100,000 at inception on 6/30/2016 would have grown to $138,366 which includes $3,311 cash and excludes $1,390 spent on fees and slippage. |
|
|
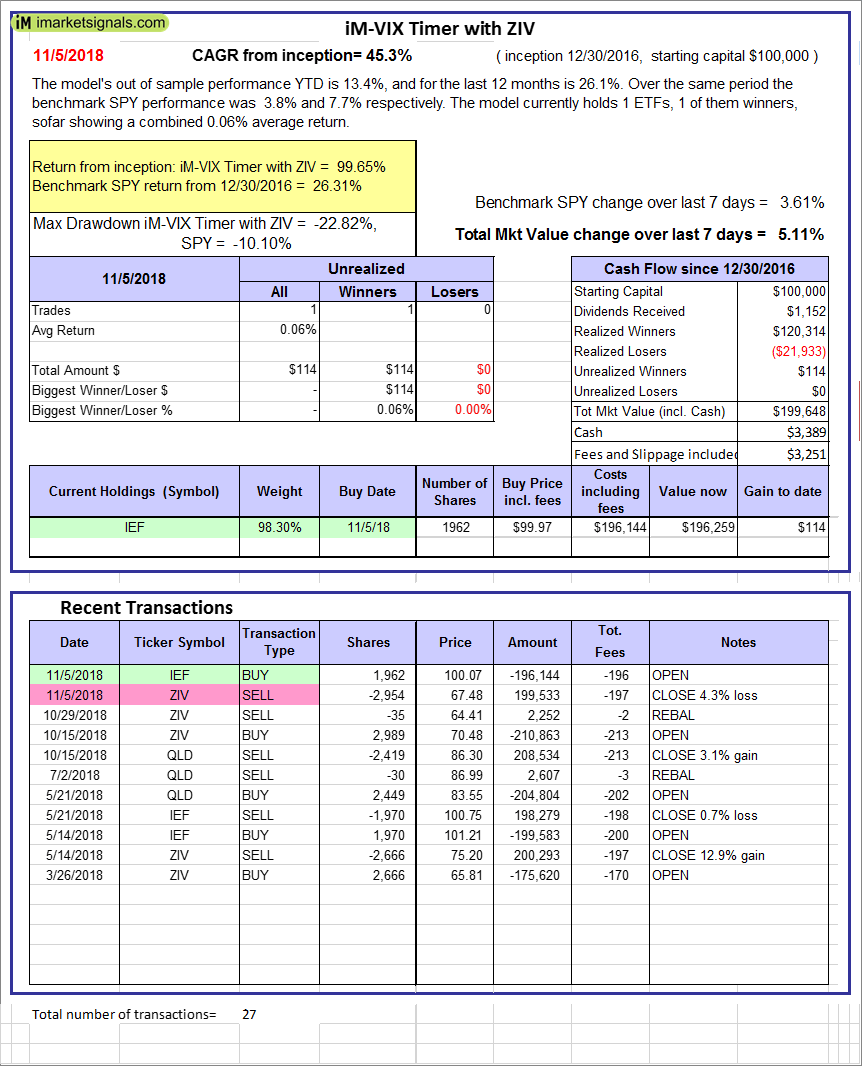
iM-VIX Timer with ZIV: The model’s out of sample performance YTD is 13.4%, and for the last 12 months is 26.1%. Over the same period the benchmark SPY performance was 3.8% and 7.7% respectively. Over the previous week the market value of the iM-VIX Timer with ZIV gained 5.11% at a time when SPY gained 3.61%. A starting capital of $100,000 at inception on 6/30/2016 would have grown to $199,648 which includes $3,389 cash and excludes $3,251 spent on fees and slippage. |
|
|
iM-Composite(Gold-Stocks-Bond) Timer: The model’s out of sample performance YTD is -5.9%, and for the last 12 months is -3.7%. Over the same period the benchmark SPY performance was 0.2% and 4.3% respectively. Over the previous week the market value of the iM-Composite(Gold-Stocks-Bond) Timer gained 0.51% at a time when SPY gained -4.05%. A starting capital of $100,000 at inception on 6/30/2016 would have grown to $121,141 which includes $99 cash and excludes $1,956 spent on fees and slippage. |
|
|
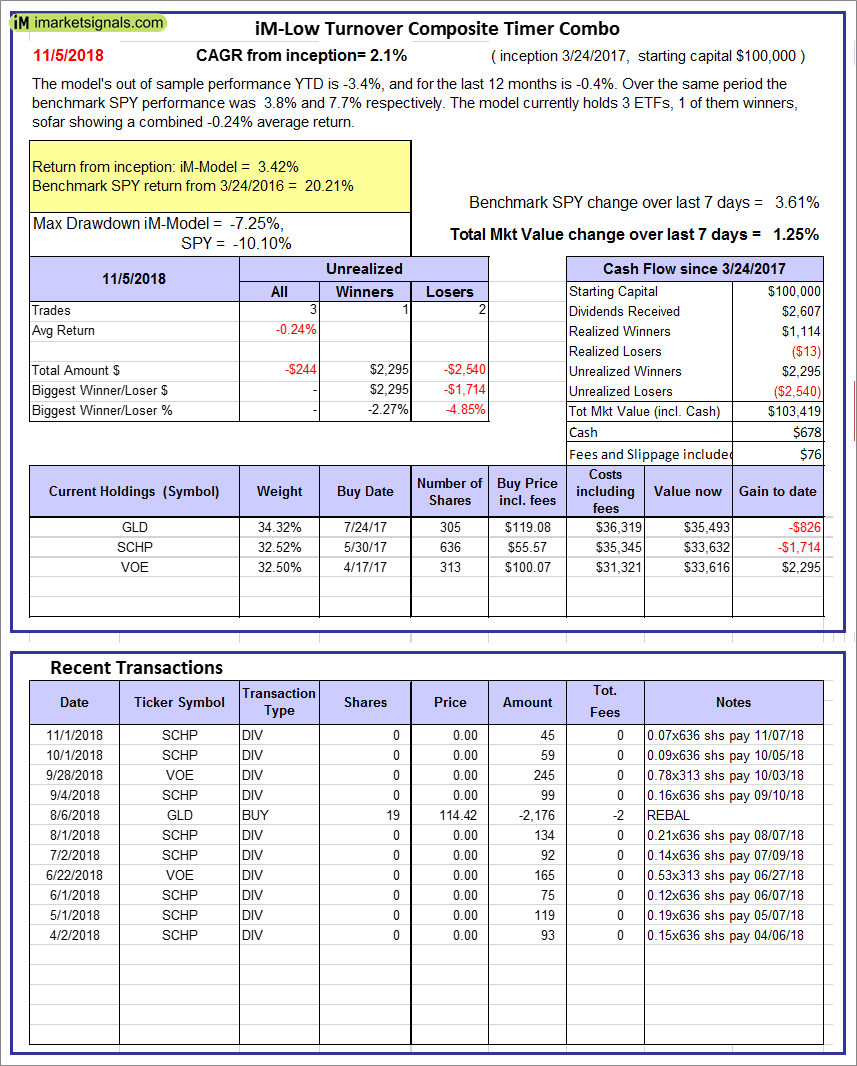
iM-Low Turnover Composite Timer Combo: The model’s out of sample performance YTD is -3.4%, and for the last 12 months is -0.4%. Over the same period the benchmark SPY performance was 3.8% and 7.7% respectively. Over the previous week the market value of the iM-Low Turnover Composite Timer Combo gained 1.25% at a time when SPY gained 3.61%. A starting capital of $100,000 at inception on 3/24/27 would have grown to $103,419 which includes $678 cash and excludes $76 spent on fees and slippage. |
|
|
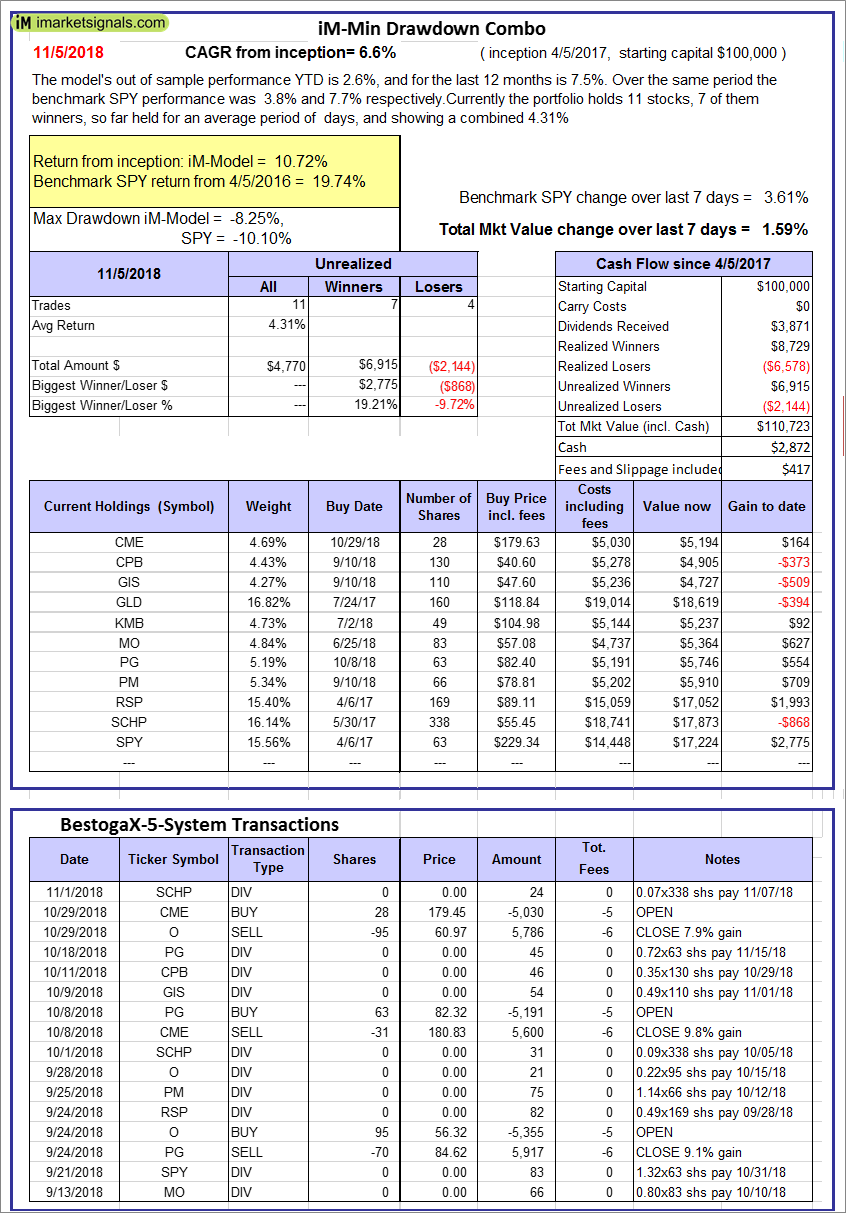
iM-Min Drawdown Combo: The model’s out of sample performance YTD is 2.6%, and for the last 12 months is 7.5%. Over the same period the benchmark SPY performance was 3.8% and 7.7% respectively. Over the previous week the market value of the iM-Min Drawdown Combo gained 1.59% at a time when SPY gained 3.61%. A starting capital of $100,000 at inception on 4/5/2017 would have grown to $110,723 which includes $2,872 cash and excludes $417 spent on fees and slippage. |
|
|
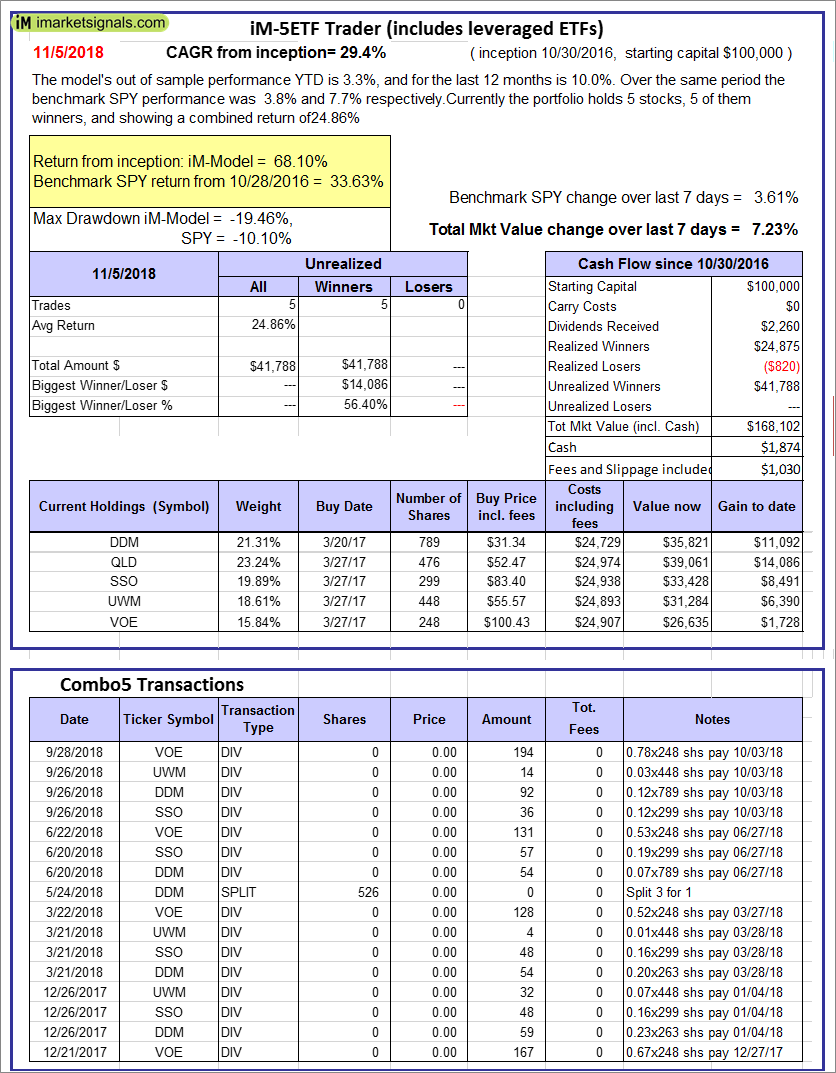
iM-5ETF Trader (includes leveraged ETFs): The model’s out of sample performance YTD is 3.3%, and for the last 12 months is 10.0%. Over the same period the benchmark SPY performance was 3.8% and 7.7% respectively. Over the previous week the market value of the iM-5ETF Trader (includes leveraged ETFs) gained 7.23% at a time when SPY gained 3.61%. A starting capital of $100,000 at inception on 10/30/2016 would have grown to $168,102 which includes $1,874 cash and excludes $1,030 spent on fees and slippage. |
|
|
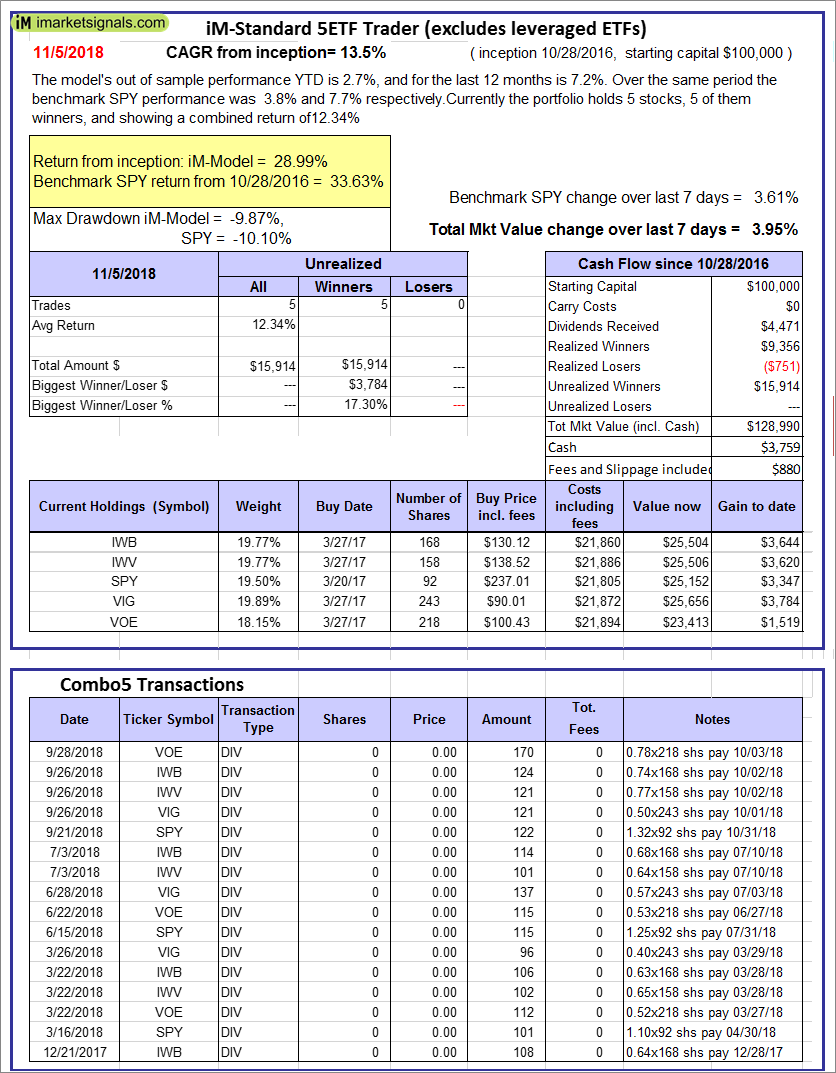
iM-Standard 5ETF Trader (excludes leveraged ETFs): The model’s out of sample performance YTD is 2.7%, and for the last 12 months is 7.2%. Over the same period the benchmark SPY performance was 3.8% and 7.7% respectively. Over the previous week the market value of the iM-Standard 5ETF Trader (excludes leveraged ETFs) gained 3.95% at a time when SPY gained 3.61%. A starting capital of $100,000 at inception on 10/30/2016 would have grown to $128,990 which includes $3,759 cash and excludes $880 spent on fees and slippage. |


Leave a Reply
You must be logged in to post a comment.